

Genome-wide analysis and expression divergence of protein disulfide isomerase (PDI) gene family members in chickpea (Cicer arietinum) under salt stress
Kauser Parveen A , Muhammad Abu Bakar Saddique A * , Muhammad Umair Waqas B , Kotb A. Attia C , Muhammad Rizwan D , Asmaa M. Abushady E F and Imran Haider Shamsi G
A
B
C
D
E
F
G
Abstract
Chickpea (Cicer arietinum) is a grain crop that is an important source of protein, vitamins, carbohydrates and minerals. It is highly sensitive to salt stress, and salt damage to cellular homeostasis and protein folding affects production. Plants have several mechanisms to prevent cellular damages under abiotic stresses, such as proteins in the endoplasmic reticulum (protein isulfide somerases (PDIs) and PDI-like proteins), which help prevent the build-up of mis-folded proteins that are damaged under abiotic stresses. In this study, we completed initial comprehensive genome-wide analysis of the chickpea PDI gene family. We found eight PDI genes are distributed on six out of eight chromosomes. Two pairs of paralogous genes were found to have segmental duplications. The phylogenetic analysis showed that the PDIs have a high degree of homology in C. arietinum, Cicer reticulatum, Lens culinaris, Phaseolus acutifolius, Pisum sativum and Oryza sativa. The gene structure analysis displayed that CaPDI1-CaPDI8 have 9–12 exons except for CaPDI5, which has 25 exons. Subcellular localisation indicated accumulation of CaPDIs in endoplasmic reticulum. Protein-conserved motifs and domain analysis demonstrated that thioredoxin domains of PDI family is present in all CaPDIs. CaPDI proteins have strong protein-protein interaction. In silico expression analysis showed that four out of eight PDI genes (CPDI2, CaPDI6, CaPDI7 and CaPDI8) were expressed under salt stress. Of these, expression of CaPDI2 and CaPDI8 was the highest. This work indicated that PDI genes are involved in salt stress tolerance in chickpea and the CaPDIs may be further studied for their role of inducing salt tolerance.
Keywords: bioinformatics breeding, CaPDI, climate change, food security, gene expression, nutritional imbalance, PCR, salt tolerance, seed formation.
Introduction
Chickpea (Cicer arietinum) is an important legume crop that is mainly grown in dry and semi-arid regions of the world. One of the critical problems of these regions is the salt stress (Shanko et al. 2017). It is estimated that one billion ha (out of 6.5 billion ha) of the dry and semi-arid regions of world is salt affected (Balal et al. 2013). Chickpea is grown on approximately 15 million ha worldwide, yielding 15 million tonnes at a yield of 10 578 kg/ha; however, in Pakistan, chickpea is grown on 0.8 million ha, yielding 0.2 million tonnes at a yield of 2650 kg/ha. (FAO 2021). Pakistan ranks seventh in chickpea production, accounting for 2.5% of global output (Maitlo et al. 2014). Pakistan’s Punjab province accounts for approximately 90% of chickpea output and meets 80% of the country’s chickpea consumption (Naveed et al. 2020).
Several studies have been carried out to determine the physiological and genetic basis of salt tolerance in chickpea (Pushpavalli et al. 2020, 2015; Atieno et al. 2017; Kotula et al. 2019). It is a salt-sensitive plant, and salt stress induces osmotic stress, ionic toxicity and nutritional imbalance in chickpea (Singh et al. 2018). In saline soils, an osmotic potential gradient between the soil and the root system induces physiological drought to plant. Similarly, the accumulation of chloride (Cl−) and sodium (Na+) ions in the plant inhibits metabolic processes and damages cells. The over accumulation of salt ions in soil competes with the uptake of nutrients (potassium, phosphorus and nitrogen) and causes nutrient deficiencies in plants (Sarita et al. 2023). Salinity also negatively impacts the physiological and biochemical processes in chickpeas, including respiration, photosynthesis, transpiration and enzyme activity (Loudari et al. 2022). It damages protein formation, folding and stability (Wang et al. 2004). Plants have several mechanisms (e.g. formation of osmolytes, antioxidants, salt exclusion and compartmentalisation) to avoid salt damage (Julio Armando et al. 2022). Moreover, when plants are under salt stress, protein disulfide isomerases (PDIs) interact with mis-folded or denatured proteins to prevent the formation of unfolded protein, which can disrupt normal cellular metabolism and induce stress tolerance in plants (Wai et al. 2021). The PDIs are thiodisulfide oxidoreductases that are present in the endoplasmic reticulum (ER) and catalyse the synthesis, reduction and rearrangement of disulfide bonds in target proteins (Zhu et al. 2014). PDIs are important for the proper functioning and stability of the protein (Rietsch and Beckwith 1998). Additionally, PDIs contain a thioredoxin (TRX) domain with a specific arrangement of α-helices and β-strands that are required for DNA binding, regulation and gene expression. The TRX domains have two types: (1) with a CXXC motif that promotes redox activity; and (2) another without this motif, so it lacks specialised redox and isomerisation functions (Kemmink et al. 1997). The role of PDI in inducing salt stress tolerance is reported by several studies; for example, when the tomato (Solanum lycopersicum) encounters salt stress, the change in the expression of PDI genes was observed. Eight genes (SlPDI1-1, SlPDI1-3, SlPDI1-4, SlPDI2-1, SlPDI4-1, SlPDI5-1, SlPDI3-1, SlPDI6-1, SlPDI7-2 and SlPDI9-1) consistently showed upregulation, while three genes (SlPDI1-2, SlPDI2-3 and SlPDI8-1) showed downregulation (Wai et al. 2021). Similarly, in Chinese cabbage (Brassica rapa ssp. pekinensis), it was reported that the expression of BrPDI genes were increased under salt and drought stress (Kayum et al. 2017). Moreover, the overexpression of PDI1 in Arabidopsis thaliana was reported to increase seed germination and boost root growth under different abiotic stress conditions (Zhang et al. 2018).
PDI genes also perform a crucial role in several physiological activities including seed formation, pollen viability, cell wall biosynthesis, defense response and stress tolerance (Zhang et al. 2018). There are several important examples on the role of PDI genes in plant growth and development: (1) A. thaliana PDI5 control the programmed cell death during embryogenesis, which aids in normal seed development (Andème Ondzighi et al. 2008); (2) PDIL1-1 of rice (Oryza sativa) has an important role in the formation of starch in developing grains (Han et al. 2012); (3) PDI genes have also been linked to the development of the endosperm in wheat (Triticum aestivum) and maize (Zea mays) (d’Aloisio et al. 2010); and (4) soybean (Glycine max) GmPDIL-3a and GmPDIL-3b play essential roles in cotyledon development (Iwasaki et al. 2009).
The genome-wide studies of PDI proteins and their role in stress tolerance have been reported in several plant species including tomato, Arabidopsis, Chinese cabbage, Brachypodium, wheat and rice (d’Aloisio et al. 2010; Wu et al. 2012; Zhu et al. 2014; Kayum et al. 2017; Zhang et al. 2018; Wai et al. 2021). But the PDI family of C. arietinum has not yet been identified. This study was conducted to identify the PDI gene family and better understand its role for inducing salt stress tolerance in chickpeas. This study provides the results of first genome-wide analysis and expression profiling of CaPDI genes in chickpea.
Materials and methods
Identification, sequence alignment and phylogenetic analysis of Cicer arietinum PDI (CaPDI) genes
The query protein sequence of AtPDI1 (Q8VX13.1) was retrieved from NCBI (www.ncbi.nlm.nih.gov/nucleotide/) and BLASTp search was performed on Crop Database (PCD) ICC 4958 ver. 2.0 genome (Humann et al. 2019) (http://www.pulsedb.org/) to pick the protein, CDS and genomic sequences of PDI genes in Cicer arietinum L. The NCBI conserved domain database (https://www.ncbi.nlm.nih.gov/Structure/cdd/wrpsb.cgi) and the SMART database (http://smart.embl-heidelberg.de) were used to verify the recovered PDI proteins. Multiple sequence alignments of the protein sequences of C. arietinum, Cicer reticulatum L., Lens culinaris L., Phaseolus acutifolius L., Pisum sativum L. and Oryza sativa L. were performed by muscle. The alignments were then loaded into the MEGA7 software to construct the phylogenetic tree (https://www.megasoftware.net/home) using the neighbour-joining (NJ) technique with 1000 replications-per-bootstrap (Jalal et al. 2022).
CaPDI protein physicochemical characteristics
The information about amino acid, CDS, genomic length and location of CaPDI genes on the chromosome were retrieved from the Pulse Crop Database (www.pulsedb.org). The ExPASy ProtParam online tool (https://web.expasy.org/protparam) was used to predict the isoelectric points (pI), the grand average of hydropathicity (GRAVY), molecular weight (MW) and Formula for each PDI genes in chickpea. The Softberry server (http://www.softberry.com/berry.phtml?topic=protcomppl&group=programs&subgroup=proloc) was used to determine subcellular localisation of PDI proteins in chickpea (Jalal et al. 2022).
Gene structure, conserved domains and motifs of CaPDI genes
CaPDI protein sequences were subjected to domain analysis using NCBI CDD online tool (https://www.ncbi.nlm.nih.gov/Structure/cdd/wrpsb.cgi). The MEME suite software 5.4.1 (https://meme-suite.org/meme/tools/meme) (Jalal et al. 2022) was used to find conserved patterns in CaPDI proteins. The TBtools (Chen et al. 2020) was used for visualisation of results. To perform gene structure analysis, the CDS and genomic sequences of CaPDI genes were subject to the gene structure display server (http://gsds.gao-lab.org) (Dong et al. 2020).
The information that was received from the Pulse Crop Database was used to estimate the chromosomal location of CaPDI genes, and these locations were then illustrated by the TBtools. Synteny analysis (Tang et al. 2008) was performed to determine the synteny links between PDI genes from C. arietinum, Arabidopsis thaliana L., Medicago truncatula L. and Glcyine max L. We calculated the synonymous substitution per synonymous site (Ks) and the nonsynonymous substitution per nonsynonymous site (Ka). Using the formula ‘t = Ks/2λ’, with λ value was 6.05 × 10⁻⁹ (Yadav et al. 2022) divergence time MYA (million years ago) was calculated by the method of Wang et al. (2021).
Protein-protein interaction were predicted using the STRING database (Szklarczyk et al. 2015) (https://string-db.org/). The secondary structure of eight CaPDI proteins were determined by SOPMA (https://npsa-prabi.ibcp.fr/cgi-bin/secpredsopma.pl). The tertiary structures of all CaPDI proteins were predicted by using the UniProt (https://www.uniprot.org) (Ge et al. 2022).
The data of salt tolerant (JG 11) and the salt sensitive genotype (ICCV 2) of chickpea was retrieved from the NCBI GEO dataset (www.ncbi.nlm.nih.gov/DataSets/) having accession number GSE110127. It was used to determine the expression patterns of CaPDI genes in chickpea at two developmental stages (vegetative and reproductive) under salt stress. The expression patterns of all CaPDI genes were presented as heatmap generated by TBtools.
Five genotypes of chickpea were collected from the Arid Zone Research Institute (AZRI), Bhakkar (see Supplementary Table S1). The G1, G2, G3, G4 genotypes were used as salt tolerant and G5 as salt-sensitive and the expression analysis was performed to better understand the function of CaPDI2 and CaPDI8 in chickpeas during salt stress. These chickpea genotypes were grown under control (0 mM) and salt stress (100 mM) conditions. The experiment was carried out in the growth chamber following a factorial under CRD having three replications and two treatments. Twenty five days after germination, plants were given a 100 mM NaCl stress (Varshney et al. 2009; Arefian et al. 2014). Each pot held 500 g sandy loam soil. The temperature in growth chamber was 23–20°C day/night, while 16 h/8 h light/dark period and 60% humidity were maintained. After 1 h, 6 h and 24 h of treatment, leaves were collected for RNA isolation. RNA was extracted by using Thermo Scientific GeneJET Plant RNA Purification Mini Kit. Thermo Scientific’s RevertAid First Strand cDNA Synthesis Kit was used to synthesise cDNA, which afterward was used as a template for PCR. The target genes were then amplified in the following conditions using a thermal cycler (Bio-Rad, California, USA), The total 30 cycles of PCR were performed: initial denaturation at 95°C for 3 min, annealing at 54–58°C for 30 s, and elongation at 72°C for 30 s. A holding step at a temperature of 4–10°C was performed after the last cycle, which was extended for 5 min at 72°C. Tables S2 and S3 lists the primers that were used in the PCR. The 2.0% agarose gel was used for gel electrophoresis to analyse the PCR product. The 3-μL of PCR product was loaded on the gel. The voltage was maintained at 100 V for 30 min. The agarose gel was photographed under UV light using Gel Documentation system (Omega Fluor Plus, AplaGen, USA).
Results
Identification and phylogenetic analysis of CaPDI genes
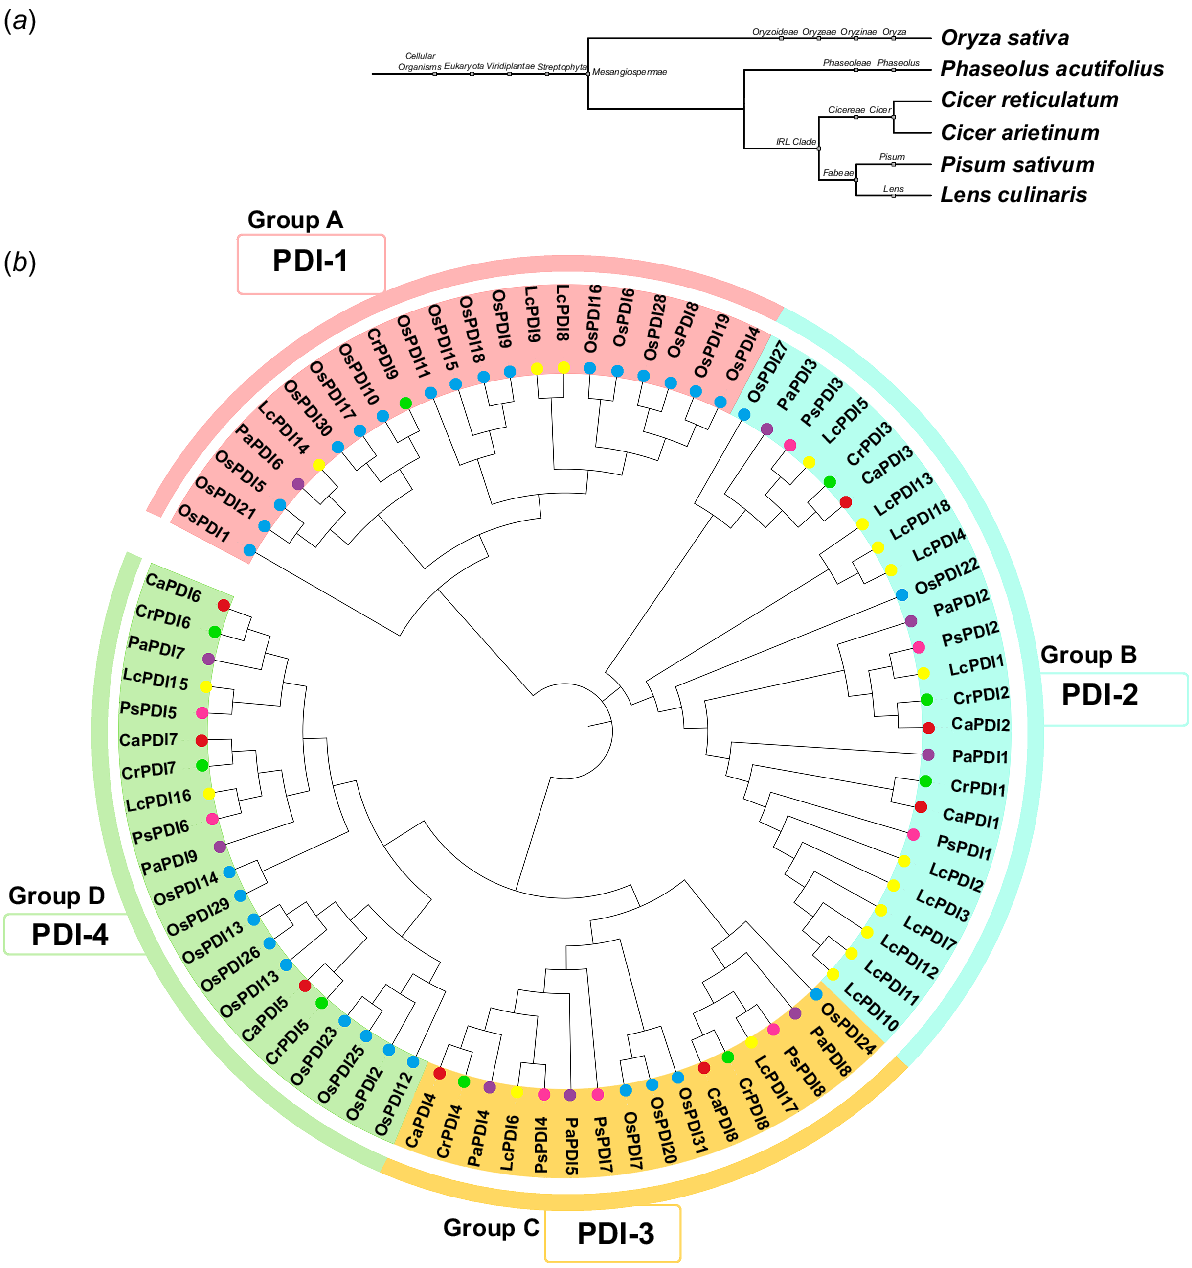
In this study, 83 PDI genes among six species were identified; i.e. eight (CaPDI1–CaPDI8) in C. arietinum, nine (CrPDI1–CrPDI9) in C. reticulatum, 18 (LcPDI1–LcPDI18) in L. culinaris, nine (PaPDI1–PaPDI9) in P. acutifolius, eight (PsPDI1–PsPDI8) in P. sativum and 31 (OsPDI1–OsPDI31) in O. sativa (Table S4). The protein sequences of these 83 genes were used to generate a phylogenetic tree, which presented the classification as well as the evolutionary characteristics of the CaPDI proteins (Fig. 1a, b). All 83 available sequences were primarily clustered into four groups (PDI-1, PDI-2, PDI-3, PDI-4). Group A (PDI-1) did not have CaPDI members. Group B (PDI-2) contained three CaPDI members (CaPDI1, CaPDI2 and CaPDI3), that are clustered to CrPDI1, CrPDI2 and CrPDI3. Group C (PDI-3) consisted of two CaPDI members (CaPDI4 and CaPDI8), that are clustered to CrPDI4 and CrPDI8. Group D (PDI-4) consisted of three CaPDI2 members (CaPDI5, CaPDI6 and CaPDI7), clustered to CrPDI5, CrPDI6 and CrPDI7. According to this comparative phylogenetic data, the PDI members share similar functions with one another or with other species that protects them from stress.
Physicochemical characteristics of CaPDIs
The findings showed that the CaPDI proteins amino acid lengths ranged from 354 to 1031 bp. The CDS values were ranged between 1065 and 3096 bp. The isoelectric point (PI) was ranged from 4.75 PI to 5.75 PI (CaPDI7), while their molecular weights (MW/kDa) ranged from 11.677639 to 39.26802 kDA. Additionally, all CaPDIs are endoplasmic, except CaPDI5 and CaPDI8, which appeared to be extracellular (Table 1).
| Gene name | Gene ID | Chr | Genomic | CDS | AA | MW KDa | PI | GRAVY | Subcellular localisation (significant) | |
|---|---|---|---|---|---|---|---|---|---|---|
| CaPDI1 | Ca_00525.1 | 1 | 3858 | 1692 | 563 | 63.13704 | 4.75 | −0.344 | Endoplasmic reticulum | |
| CaPDI2 | Ca_18383.1 | 6 | 5219 | 1755 | 584 | Undefined | Undefined | −0.287 | Endoplasmic reticulum | |
| CaPDI3 | Ca_00188.1 | 1 | 4575 | 1566 | 521 | 59.14248 | 5.25 | −0.234 | Endoplasmic reticulum | |
| CaPDI4 | Ca_13872.1 | 5 | 3475 | 1527 | 508 | Undefined | Undefined | −0.28 | Endoplasmic reticulum | |
| CaPDI5 | Ca_10119.1 | 4 | 12 849 | 3096 | 1031 | 11.67764 | 5.11 | −0.103 | Extracellular | |
| CaPDI6 | Ca_09843.1 | 4 | 4774 | 1101 | 366 | 40.54288 | 5.31 | −0.373 | Endoplasmic reticulum | |
| CaPDI7 | Ca_07993.1 | 3 | 3254 | 1065 | 354 | 39.26802 | 5.75 | −0.23 | Endoplasmic reticulum | |
| CaPDI8 | Ca_03553.1 | 2 | 4509 | 1311 | 436 | 47.51541 | 5.62 | −0.114 | Extracellular |
Chr, chromosome; AA, amino acid; PI, isoelectric point; MW, molecular weight; GRAVY, grand average of hydropathicity.
Domain, motif and gene structure analysis of CaPDI genes
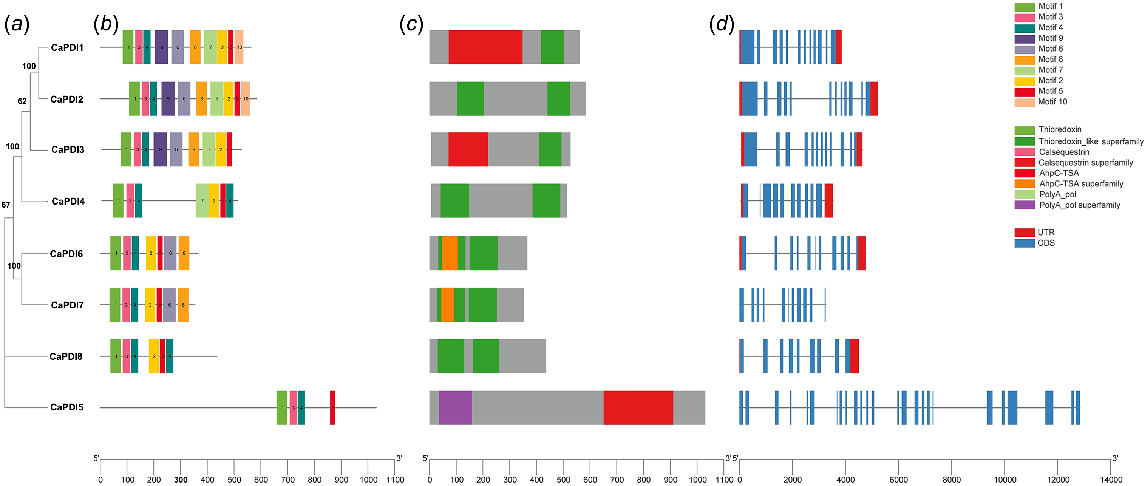
CaPDI genes were checked for conserved domains, the organisation of the gene structure, and motifs to learn more about the important functions of CaPDI genes along with the phylogeny tree (Fig. 2a). All the CaPDI proteins contain 10 conserved motifs that were specific to the thioredoxin domains (Fig. 2b). The conserved domain analysis showed that PDI family thioredoxin domains were present in all the CaPDIs (Fig. 2c). The gene structure display showed that CaPDI1, CaPDI2 and CaPDI3 have 12 exons, CaPDI4 has 10 exons, CaPDI5 has 25 exons, CaPDI6 and CaPDI7 have 11 exons, and CaPDI8 has nine exons (Fig. 2d).
Chromosomal location, synteny analysis and determination of (Ka) and (Ks) substitution rate of CaPDI genes
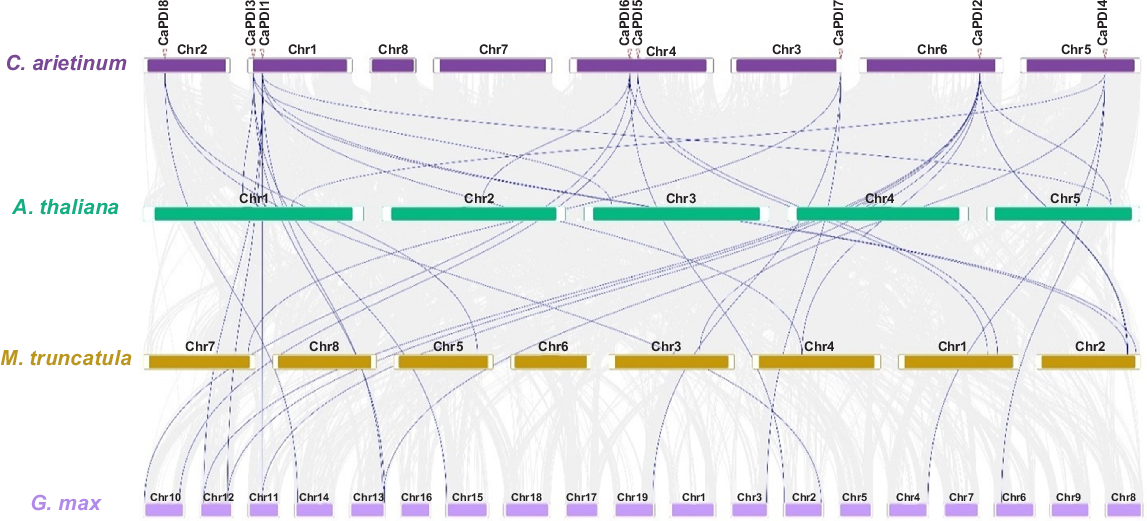
The chromosomal location analysis showed that CaPDI3 and CaPDI1 located on chromosome 1, CaPDI8 on chromosome 2 and CaPDI7 on chromosome 3, CaPDI6 and CaPDI5 on chromosome 4, CaPDI4 and CaPDI2 on chromosomes 5 and 6. It also indicated that CaPDI gene family has two pairs of duplicated genes in chickpea. The first pair is CaPDI1 and CaPDI2, which is located on chromosome 1 and 6, and the second pair is CaPDI6 and CaPDI7, which is located on chromosome 4 and 3 with segmental duplication event in the genome of C. arietinum (Fig. 3). The multi-synteny map showed that PDI genes of C. arietinum, A. thaliana, M. truncatula, and G. max have collinear regions (Fig. 4). It was observed that the CaPDI3 was present on chromosome 1 and has synteny with AT1G52260.1 and AT3G16110.1 on chromosomes 1 and 3 of A. thaliana, and with gene of M. truncatula; i.e. Medtr2g101880.1 present on chromosome 2, with Glyma.15G015700.1 and Glyma.02G014000.3 present on chromosomes 13 and 15 of G. max. The CaPDI1 on chromosome 1 showed synteny with Medtr2g094180.1 and Medtr4g059450.1 on chromosomes 2 and 4 of M. truncatula. Similarly, CaPDI8 showed synteny with Medtr5g084930.1 on chromosome 5 of M. truncatula, and with Glyma.02G266900.1 and Glyma.14G050600.1 present on chromosomes 2 and 15 of G. max. CaPDI7 on Chromosome 3 showed synteny with Medtr7g112040.1 on chromosome 7 of M. truncatula and with Glyma.03G232000.1, Glyma.19G229000.2 on chromosome 3 and 9 of G. max. CaPDI5 on chromosome 4 of C. arietinum showed synteny with Medtr1g096790.1 present on chromosome 1. CaPDI6 on chromosome 4 showed synteny with AT2G47470.1 on chromosome 2 of A. thaliana, and with M. truncatula Medtr1g087520.1 present on chromosome 1, it also showed synteny with Glyma.02G014000.3 and Glyma.10G014700.1 present on chromosomes 2 and 10 of G. max. CaPDI4 on chromosome 5 showed synteny with AT1G77510.1 on chromosome 1 of A. thaliana, with Medtr3g088220.1 present on chromosome 3 of M. truncatula. CaPDI2 present on chromosome 6 of C. arietinum showed synteny with A. thaliana AT5G60640.1 on chromosome 5, with Medtr2g094180.1, Medtr2g093500.1 on chromosome 2 and Medtr4g059450.1 on chromosome 4 of M. truncatula. CaPDI2 also showed synteny with Glyma.11G146800.1, Glyma.12G067700.1, Glyma.12G172800.1 and Glyma.13G326200.1 present on chromosomes 11, 12 and 13 of G. max. The lines twisted inward and outward between the chromosomes of analysed species also indicating conservation based on the intensity of the colours, demonstrating that PDI genes were conserved in C. arietinum throughout evolution. In accordance with the phylogenetic tree, we calculated Ka/Ks substitution rate for every pair of paralogous CaPDI genes (Fig. 2a, Table 2). It was observed that the Ka/Ks value was <1, which means a purifying selection occurred for the paralogous gene pairs.

Synteny analysis of identified C. arietinum CaPDI genes in A. thaliana, M. truncatula and G. max.
| Gene_1 | Gene_2 | Ka | Ks | Ka/Ks | Time (million years ago) | Duplication | Type of selection | |
|---|---|---|---|---|---|---|---|---|
| CaPDI1 | CaPDI2 | 0.1542544 | 0.640724598 | 0.240749864 | 12.748 | Segmental | Purifying | |
| CaPDI6 | CaPDI7 | 0.1910928 | 1.780039032 | 0.107353168 | 15.792 | Segmental | Purifying |
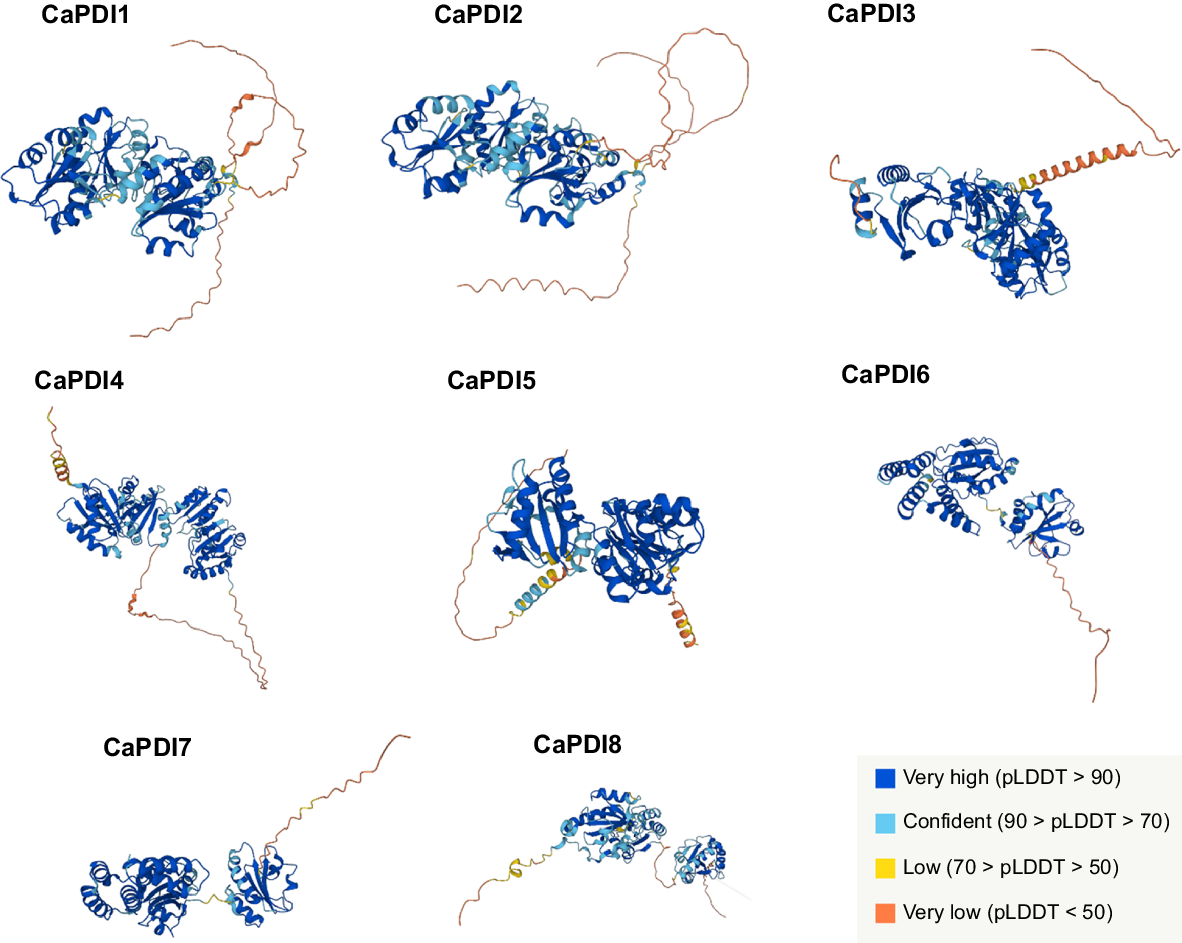
Analysis of protein-protein interaction displayed that there is a strong interaction among CaPDI proteins except for CaPDI5 (Fig. 5). The CaPDI1-8 shares the same putatively interacted protein known as thioredoxin except CaPDI4. The secondary structures of the CaPDI proteins were also predicted (Fig. 6). Analysis of PPI and tertiary structure of the protein (Fig. 7) were carried out to better understand the structure of the CaPDI proteins. The CaPDIs secondary structure provided insight into the folding and coiling of these proteins. Their secondary structure was composed of four main parts: (1) the turn (-T%); (2) the extended chain (-strand%); (3) the helix (-H%); and (4) the random coil (-RC%). Random coil (-RC%) in the secondary structure of CaPDI proteins ranged from 28.14% to 46.36%, followed by the helix (H%) and the extended strand (E-strand%), which ranged from 13.28% to 21.11% and 3.73% to 7.11%, respectively (Table 3).
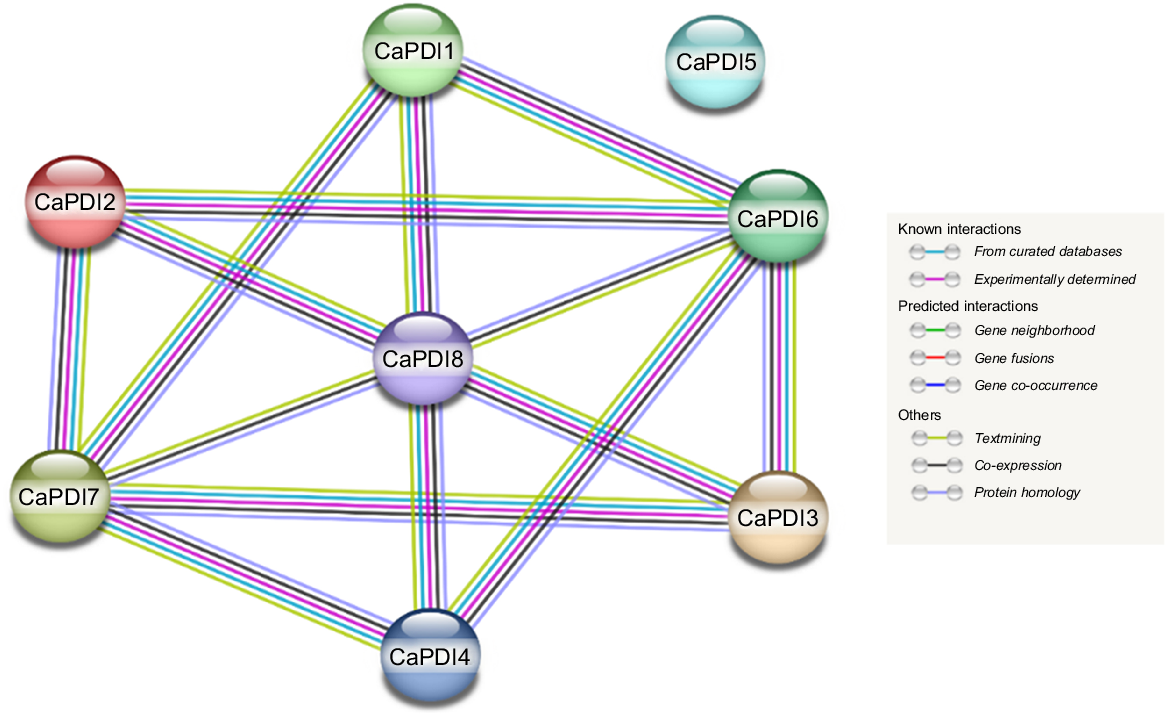
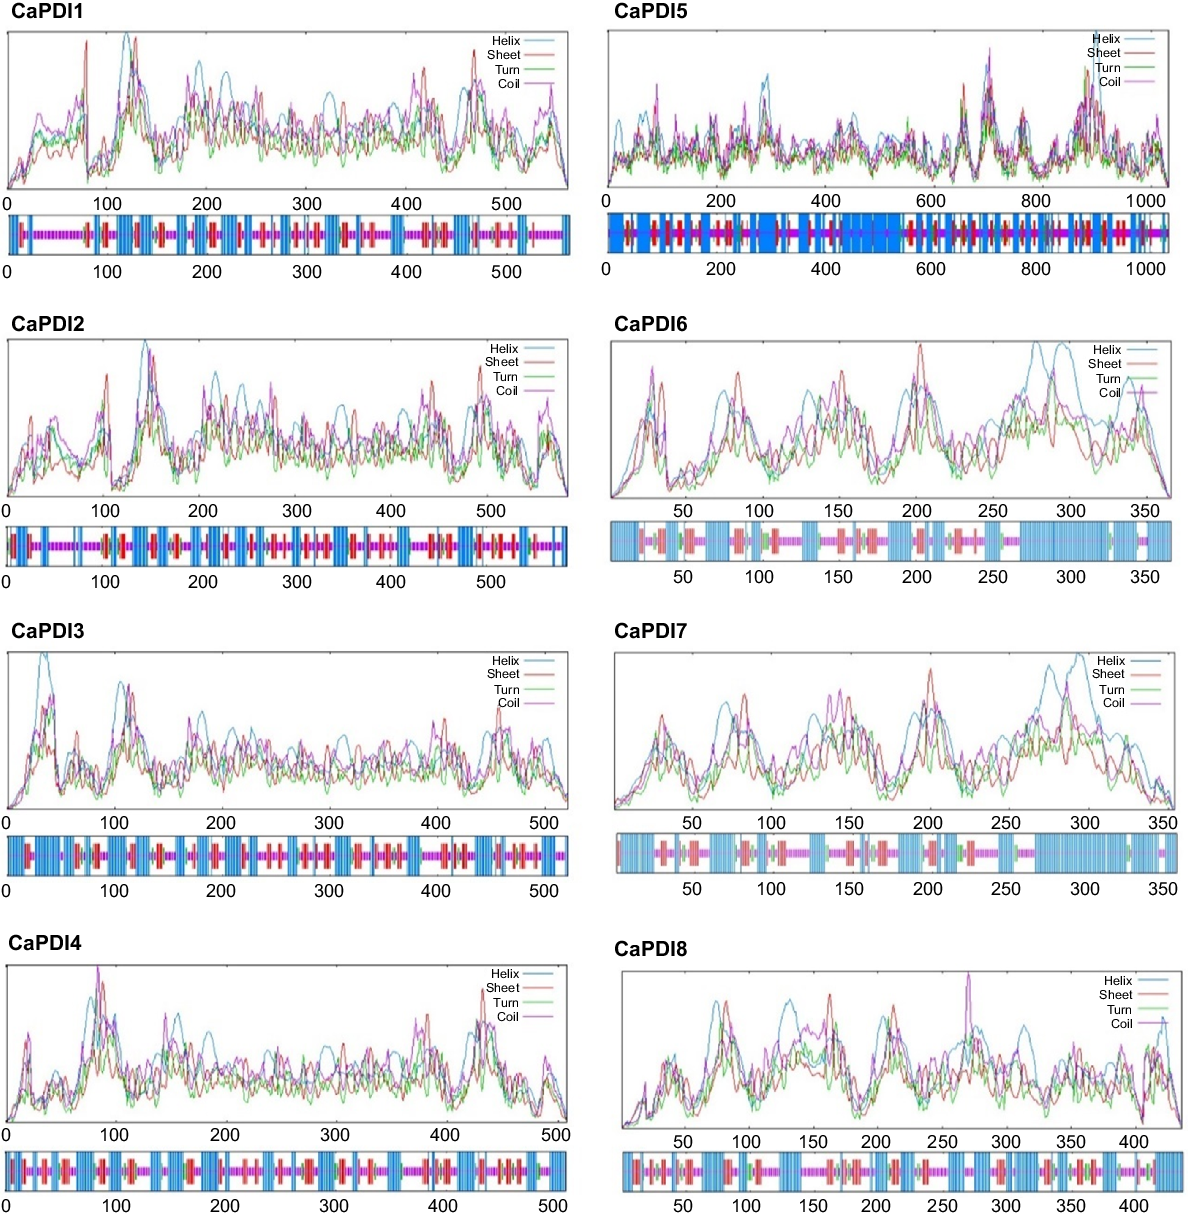
Illustration of the eight CaPDI proteins predicted tertiary structures. Domain colour schemes across all protein structures demonstrate the degree of homology.
| Genes | α-H (%) | β-T (%) | E-strand (%) | RC (%) | |
|---|---|---|---|---|---|
| CaPDI1 | 32.15 | 3.73 | 17.76 | 46.36 | |
| CaPDI2 | 31.51 | 4.97 | 19.86 | 43.66 | |
| CaPDI3 | 40.31 | 4.61 | 21.11 | 33.97 | |
| CaPDI4 | 36.61 | 6.30 | 20.47 | 36.61 | |
| CaPDI5 | 46.56 | 6.21 | 16.29 | 30.94 | |
| CaPDI6 | 51.64 | 6.01 | 14.21 | 28.14 | |
| CaPDI7 | 51.13 | 5.65 | 13.28 | 29.94 | |
| CaPDI8 | 39.68 | 7.11 | 18.58 | 34.63 |
In silico expression indicated that among the eight CaPDI genes, four (CaPDI2, CaPDI6, CaPDI7 and CaPDI8) were expressed in roots of chickpea (Fig. 8). Of these four genes, two (CaPDI2 and CaPDI8) were highly expressed at both vegetative and reproductive growth stages.

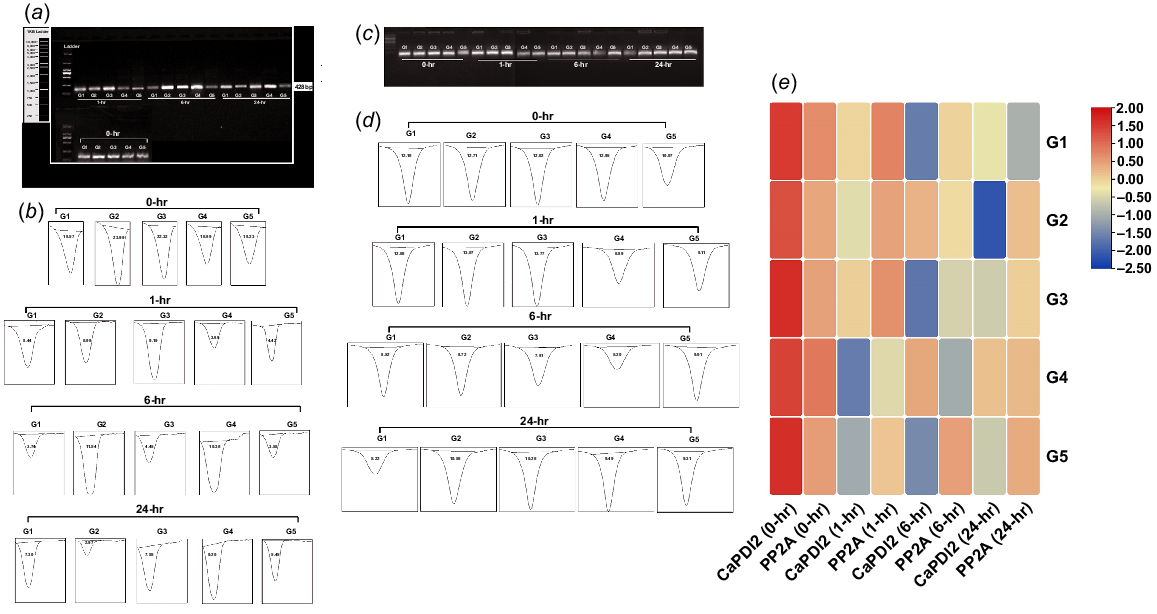
The expression of both genes (CaPDI2 and CaPDI8) was influenced by salt stress (Figs 9 and 10, respectively). The increased expression was observed in both control (0 Mm NaCl) and stressed (100 Mm NaCl) environments. The expression of CaPDI2, CaPDI8 and reference gene CaPP2A was high in all five genotypes at 0 h of stress application. The expression of CaPDI2 at 0 h ranged from the lowest 16.89% in G4 to a maximum of 23.99% in G2, the expression of CaPDI8 ranged from the lowest 5.22% in G2 to the highest 15.16% in G3 and the expression of CaPP2A ranged from the lowest 10.60% in G5 to the highest 12.95% in G4. The expression of CaPDI2 at 1 h ranged from 3.89% in G4 to 9.99% in G3, the expression of CaPDI8 ranged from 4.38% in G2 to 12.28% in G3, and the expression of CaPP2A ranged from 6.89% in G3 to 13.77% in G4. The expression of CaPDI2 at 6 h ranged from 3.55% in G5 to 11.54% in G2, the expression of CaPDI8 ranged from 6.77% in G2 to 8.78% in G1, and the expression of CaPP2A ranged from 5.20% in G4 to 9.91% in G5. The expression of CaPDI2 at 24 h ranged from 2.97% in G2 to 7.55% in G3, the expression of CaPDI8 ranged from 3.32% in G5 to 8.87% in G4 and the expression of CaPP2A ranged from 5.22 % in G1 to 10.56% in G1, respectively.
(a) PCR results of CaPDI2 gene. (b) Band intensity of CaPDI2 gene analysed by ImageJ. (c) PCR results of CaPP2A gene. (d) Band intensity of CaPP2A gene analysed by ImageJ. (e) Comparative heatmap of CaPDI2 and CaPP2A genes under control and salt stress conditions.
(a) PCR results of CaPDI8 gene. (b) Band intensity of CaPDI8 gene analysed by ImageJ. (c) PCR results of CaPP2A genes. (d) Band intensity of CaPP2A gene analysed by ImageJ. (e) Comparative heatmap of CaPDI8 and CaPP2A genes under normal and stress conditions.
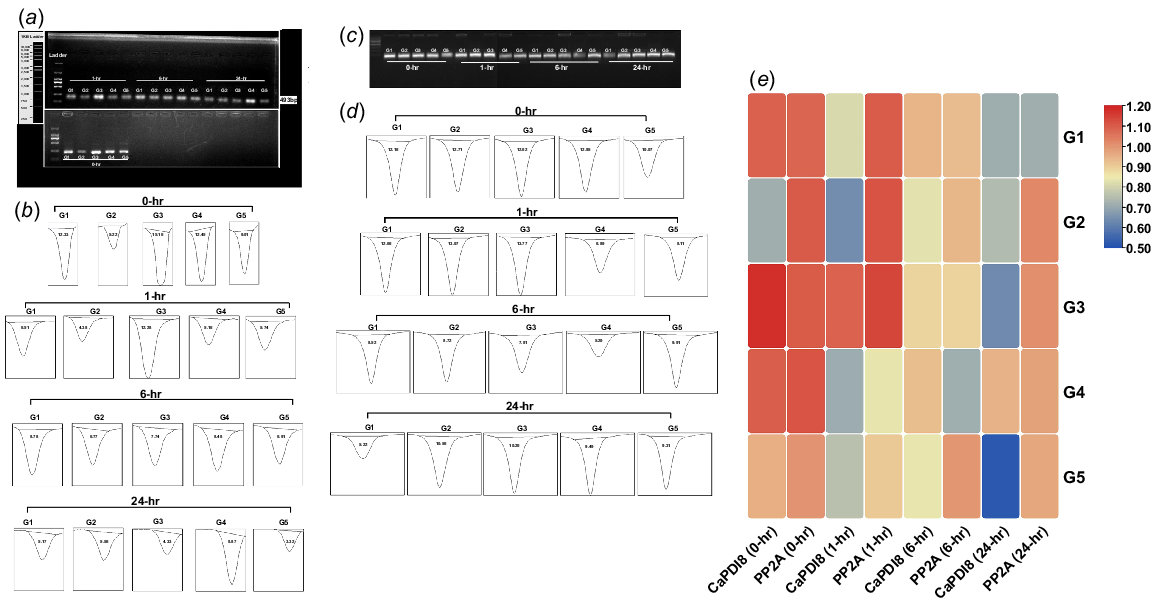
Genotypes G2 and G3 exhibited higher expression levels at 1 and 6 h of stress application. CaPDI2 expression in tolerant genotypes G1 and G3 remained consistently high at 0, 1 and 24 h, while in G2, it increased at 0 and 6 h. In contrast, G4 showed elevated CaPDI2 expression at 0, 6 and 24 h. Notably, the sensitive genotype G5 showed high expression of CaPDI2 at 0 h, but lower expression at 1, 6 and 24 h compared to tolerant genotypes. Regarding CaPDI8, G1 and G3 exhibited elevated expression at 0, 1 and 6 h, while in G2, it increased at 24 h of salt stress. The G5 initially expressed CaPDI8 at 0 h but showed reduced expression at 1, 6 and 24 h compared to tolerant genotypes. Overall, across all genotypes, the expression of CaPDI2 in G2 and CaPDI8 in G3 was maximum as compared to other genotypes during the stress conditions (Figs 9 and 10).
Discussion
Soil salinity significantly reduces the yield of chickpea grown in semi-arid regions of the world (Shanko et al. 2017). The higher salt concentration inhibits the seed germination as well as the development of radicle, plumule and the seedling. If the concentration of salt increases, then plant becomes chlorotic and die (Krishnamurthy et al. 2007) When plants are subjected to abiotic stress, they produce excessive amount of reactive oxygen species (ROS), which damages proteins, lipids and carbohydrates (Das and Roychoudhury 2014). The PDI is an essential redox protein, it controls the synthesis of ROS and triggers defence mechanisms (Stolf et al. 2011). PDI proteins are a part of transcriptional complexes and signal transduction pathways that control the response of genes to external stimuli (Ferrari and Soling 1999). Previously, PDI genes were identified and thoroughly examined in several plant species, including 21 PDI genes in A. thaliana, 12 in O. sativa, 12 in Z. mays, 10 in Vitis vinifera, nine in T. aestivum (Houston et al. 2005), 18 in S. lycopersicum (Wai et al. 2021), 11 in Brachypodium distachyon (Zhu et al. 2014), and 32 in Chinese cabbage (Kayum et al. 2017). In this study, eight PDI genes (CaPDI1–CaPDI8) were identified in C. arietinum. From an evolutionary perspective gene duplication event played an important role for the adaption of plants in various environments it enabled plant species to adjust and also endure the shifting environmental conditions (Li et al. 2014). We found segmentally duplicated gene pairs for CaPDI1/CaPDI2 and CaPDI6/CaPDI7 (Fig. 3, Table 2). The presence of segmental duplications instead of tandem duplications might be responsible for the expansion of the gene family (Abdullaev et al. 2021). The similar patterns of exon/intron organisation and composition of motif were found in these duplicated genes, indicating that CaPDI genes probably have common origin and evolutionary relationship is present among them. The structural variations in exon-intron patterns serves as important marker for the study of evolution of gene families (Xu et al. 2012). The phylogenetic tree showed that the CaPDI genes shared exon-intron pattern and motif distributions (Fig. 1). The comparative phylogenetic tree has illustrated that the 83 PDI proteins are classified into four clades, and a high degree of homology existed among the PDI proteins of C. arietinum, C. reticulatum, L. culinaris, P. acutifolius, P. sativum and O. sativa. Therefore, it is suggested that close evolutionary relationships and functional similarities existed in these plants (Zhu et al. 2014). This phylogeny also indicated that the PDI proteins in C. arietinum are closely related to the C. reticulatum, as all CaPDI proteins clustered with CrPDI proteins. The Ka/Ks values were <1, which refers to the gene family being exposed to purifying selection. It is a stabilising selection which works as a filter by screening harmful mutations and promotes the conservation of specific genes. It aids in the long-term functionality or stability of specific genes or features within a population (Charlesworth 2013). The divergence time (in MYA) indicated that the evolution time of paralogous pairs of PDIs in chickpea was about 12.74–15.79 MYA (Table 2). It is reported that the PDI genes are responsible for inducing salt tolerance to grapevine rootstocks (Çakır Aydemir et al. 2020). Moreover, the expression of SlPDI1-1, SlPDI1-3, SlPDI1-4, SlPDI2-1, SlPDI4-1 and SlPDI51 was found responsible for inducting salt tolerance to the tomato plants (Wai et al. 2021). In this study, the in silico expression profiling of CaPDI genes showed that CaPDI2 and CaPDI8 have higher expression as compared to the other members. PCR results showed that once the chickpea plant is under salt stress, the expression of CaPDI2 and CaPDI8 was increased many folds and this increase was more in salt tolerant genotypes as compared to susceptible. It was concluded that these genes may contribute to salt tolerance in chickpea plants. The information presented here paves the way for further functional characterisation of CaPDI genes, which will help to comprehend the molecular processes that PDI genes control during salt stress.
Conclusion
This is the first genome-wide identification study of protein disulfide isomerase (PDI) gene family in chickpea. We found eight (CaPDI1–CaPDI8) genes in the genome of chickpea and analysed them. PDI genes identified in this study were clustered into four clades of the phylogeny. CaPDIs proteins were localised in endoplasmic reticulum, which interact with other proteins during their folding and facilitates the degradation of mis-folded proteins. The protein-conserved motifs analysis and domain analysis verified the TRX domain in all these proteins. Seven out of eight CaPDI proteins showed strong protein-protein interaction among them. In silico expression analysis indicated that CaPDI2, CaPDI6, CaPDI7 and CaPDI8 were expressed in the roots of chickpea at vegetative and reproductive stages. The predominant expression of CaPDI2 and CaPDI8 suggested their main role in salt stress tolerance. PCR results showed that CaPDI2 and CaPDI8 exhibit high expression in salt tolerant chickpea genotypes, which highlights their role of inducing salt tolerance to the chickpea plants.
Data availability
All data generated or analysed during this study are included in this article and its supplementary information.
Declaration of funding
This work was supported by Australian Centre for International Agricultural Research (ACIAR, project CIM/2015/041).
Author contributions
Kauser Parveen and Muhammad Abu Bakar Saddique designed the study. Kauser Parveen conducted research; Kauser Parveen, Muhammad Abu Bakar Saddique, Muhammad Umair Waqas helped Kauser Parveen to perform the experiments and data collection. Muhammad Abu Bakar Saddique, Muhammad Umair Waqas helped in data analysis, software standardisation and writing of original draft. Kotb A. Attia, Muhammad Rizwan, Asmaa M. Abushady and Imran Haider Shamsi provided technical expertise to improve the article and helped in funding acquisition. Kauser Parveen, Muhammad Abu Bakar Saddique and Muhammad Rizwan revised the manuscript. All authors reviewed and edited the manuscript.
Acknowledgements
The authors thank the Researchers Supporting Project number (RSP-2024R369), King Saud University, Riyadh, Saudi Arabia.
References
Abdullaev ET, Umarova IR, Arndt PF (2021) Modelling segmental duplications in the human genome. BMC Genomics 22, 496.
| Crossref | Google Scholar | PubMed |
Andème Ondzighi C, Christopher DA, Cho EJ, Chang S-C, Staehelin LA (2008) Arabidopsis protein disulfide isomerase-5 inhibits cysteine proteases during trafficking to vacuoles before programmed cell death of the endothelium in developing seeds. The Plant Cell 20(8), 2205-2220.
| Crossref | Google Scholar | PubMed |
Arefian M, Vessal S, Bagheri A (2014) Biochemical changes in response to salinity in chickpea (Cicer arietinum L.) during early stages of seedling growth. Journal of Animal and Plant Sciences 24, 1849-1857.
| Google Scholar |
Atieno J, Li Y, Langridge P, Dowling K, Brien C, Berger B, Varshney RK, Sutton T (2017) Exploring genetic variation for salinity tolerance in chickpea using image-based phenotyping. Scientific Reports 7(1), 1300.
| Crossref | Google Scholar | PubMed |
Balal RM, Aqueel MA, Shahid HT, Siddiqua A (2013) In Pakistan, salinity is one of the country’s most serious environmental problems. AgriHunt. Available at https://agrihunt.com/articles/pak-agri-outlook/in-pakistan-salinity-is-one-of-the-countrys-most-serious-environmental-problems/
Çakır Aydemir B, Yüksel Özmen C, Kibar U, Mutaf F, Büyük PB, Bakır M, Ergül A (2020) Salt stress induces endoplasmic reticulum stress-responsive genes in a grapevine rootstock. PLoS ONE 15, e0236424.
| Crossref | Google Scholar |
Charlesworth B (2013) Stabilizing selection, purifying selection, and mutational bias in finite populations. Genetics 194(4), 955-971.
| Crossref | Google Scholar | PubMed |
Chen C, Chen H, Zhang Y, Thomas HR, Frank MH, He Y, Xia R (2020) TBtools: an integrative toolkit developed for interactive analyses of big biological data. Molecular Plant 13(8), 1194–-1202.
| Crossref | Google Scholar |
Das K, Roychoudhury A (2014) Reactive oxygen species (ROS) and response of antioxidants as ROS-scavengers during environmental stress in plants. Frontiers in Environmental Science 2, 53.
| Crossref | Google Scholar |
Dong Y, Lu J, Liu J, Jalal A, Wang C (2020) Genome-wide identification and functional analysis of JmjC domain-containing genes in flower development of Rosa chinensis. Plant Molecular Biology 102, 417-430.
| Crossref | Google Scholar | PubMed |
d’Aloisio E, Paolacci AR, Dhanapal AP, Tanzarella OA, Porceddu E, Ciaffi M (2010) The protein disulfide isomerase gene family in bread wheat (T. aestivum L.). BMC Plant Biology 10, 101.
| Crossref | Google Scholar | PubMed |
Ferrari DM, Soling H-D (1999) The protein disulphide-isomerase family: unravelling a string of folds. Biochemical Journal 339, 1-10.
| Crossref | Google Scholar | PubMed |
Ge M, Zhong R, Sadeghnezhad E, Hakeem A, Xiao X, Wang P, Fang J (2022) Genome-wide identification and expression analysis of magnesium transporter gene family in grape (Vitis vinifera). BMC Plant Biology 22, 217.
| Crossref | Google Scholar | PubMed |
Han X, Wang Y, Liu X, Jiang L, Ren Y, Liu F, Peng C, Li J, Jin X, Wu F, Wang J, Guo X, Zhang X, Cheng Z, Wan J (2012) The failure to express a protein disulphide isomerase-like protein results in a floury endosperm and an endoplasmic reticulum stress response in rice. Journal of Experimental Botany 63(1), 121-130.
| Crossref | Google Scholar | PubMed |
Houston NL, Fan C, Xiang Q-Y, Schulze J-M, Jung R, Boston RS (2005) Phylogenetic analyses identify 10 classes of the protein disulfide isomerase family in plants, including single-domain protein disulfide isomerase-related proteins. Plant Physiology 137, 762-778.
| Crossref | Google Scholar | PubMed |
Humann JL, Jung S Cheng C-H, Lee T, Zheng P, Frank M, McGaughey D, Scott K, Buble K, Yu J, Hough H, Coyne C, McGee R, Main D (2019) Cool Season Food Legume Genome Database: a resource for pea, lentil, faba bean and chickpea genetics, genomics and breeding. In ‘Proceedings of the International Plant and Animal Genome Conference’, San Diego, CA, USA, January 2019. (International Plant and Animal Genome Conference)
Iwasaki K, Kamauchi S, Wadahama H, Ishimoto M, Kawada T, Urade R (2009) Molecular cloning and characterization of soybean protein disulfide isomerase family proteins with nonclassic active center motifs. The FEBS Journal 276(15), 4130-4141.
| Crossref | Google Scholar | PubMed |
Jalal A, Ali Q, Manghwar H, Zhu D (2022) Identification, phylogeny, divergence, structure, and expression analysis of A20/AN1 zinc finger domain containing stress-associated proteins (SAPs) genes in Jatropha curcas L. Genes 13(10), 1766.
| Crossref | Google Scholar | PubMed |
Julio Armando M-S, Carla Vanessa S-H, Rosalba Mireya H-H, Paola Andrea P-S (2022) The biochemical mechanisms of salt tolerance in plants. In ‘Plant stress physiology: perspectives in agriculture’. (Eds H Mirza, N Kamran) pp. 516–537. (IntechOpen: London, UK) doi:10.5772/intechopen.101048
Kayum MA, Park J-I, Nath UK, Saha G, Biswas MK, Kim H-T, Nou I-S (2017) Genome-wide characterization and expression profiling of PDI family gene reveals function as abiotic and biotic stress tolerance in Chinese cabbage (Brassica rapa ssp. pekinensis). BMC Genomics 18, 885.
| Crossref | Google Scholar | PubMed |
Kemmink J, Darby NJ, Dijkstra K, Nilges M, Creighton TE (1997) The folding catalyst protein disulfide isomerase is constructed of active and inactive thioredoxin modules. Current Biology 7(4), 239-245.
| Crossref | Google Scholar |
Kotula L, Clode PL, Jiménez JDLC, Colmer TD (2019) Salinity tolerance in chickpea is associated with the ability to ‘exclude’ Na from leaf mesophyll cells. Journal of Experimental Botany 70, 4991-5002.
| Crossref | Google Scholar |
Krishnamurthy L, Serraj R, Hash CT, Dakheel AJ, Reddy BVS (2007) Screening sorghum genotypes for salinity tolerant biomass production. Euphytica 156, 15-24.
| Crossref | Google Scholar |
Li Z, Jiang H, Zhou L, Deng L, Lin Y, Peng X, Yan H, Cheng B (2014) Molecular evolution of the HD-ZIP I gene family in legume genomes. Gene 533, 218-228.
| Crossref | Google Scholar | PubMed |
Loudari A, Mayane A, Zeroual Y, Colinet G, Oukarroum A (2022) Photosynthetic performance and nutrient uptake under salt stress: differential responses of wheat plants to contrasting phosphorus forms and rates. Frontiers in Plant Science 13, 1038672.
| Crossref | Google Scholar | PubMed |
Maitlo SA, Syed RN, Rustamani MA, Khuhro RD, Lodhi AM (2014) Comparative efficacy of different fungicides against fusarium wilt of chickpea (Cicer arietinum L.). Pakistan Journal of Botany 46, 2305-2312.
| Google Scholar |
Naveed MM, Shafiq M, Nadeem M, Haq AUH, Zahid MA (2020) “Noor-2013” a bold seeded and high yielding chickpea kabuli variety developed indigenously. The Journal of Animal and Plant Sciences 30, 885-894.
| Google Scholar |
Pushpavalli R, Quealy J, Colmer TD, Turner NC, Siddique KHM, Rao MV, Vadez V (2015) Salt stress delayed flowering and reduced reproductive success of chickpea (Cicer arietinum L.), a response associated with Na+ accumulation in leaves. Journal of Agronomy and Crop Science 202, 125-138.
| Crossref | Google Scholar |
Pushpavalli R, Berger JD, Turner NC, Siddique KHM, Colmer TD, Vadez V (2020) Cross-tolerance for drought, heat and salinity stresses in chickpea (Cicer arietinum L.). Journal of Agronomy and Crop Science 206, 405-419.
| Crossref | Google Scholar |
Rietsch A, Beckwith J (1998) The genetics of disulfide bond metabolism. Annual Review of Genetics 32, 163-184.
| Crossref | Google Scholar | PubMed |
Sarita J, Mehrotra S, Dimkpa C, Goyal V (2023) Survival mechanisms of chickpea (Cicer arietinum) under saline conditions. Plant Physiology and Biochemistry 205, 108168.
| Crossref | Google Scholar |
Shanko D, Jateni G, Debela A (2017) Effects of salinity on chickpea (Cicer arietinum L.) landraces during germination stage. Journal of Biochemistry and Molecular Biology 3(2), 1-5.
| Crossref | Google Scholar |
Singh J, Singh V, Sharma PC (2018) Elucidating the role of osmotic, ionic and major salt responsive transcript components towards salinity tolerance in contrasting chickpea (Cicer arietinum L.) genotypes. Physiology and Molecular Biology of Plants 24(3), 441-453.
| Crossref | Google Scholar | PubMed |
Stolf BS, Smyrnias I, Lopes LR, Vendramin A, Goto H, Laurindo FRM, Shah AM, Santos CXC (2011) Protein disulfide isomerase and host-pathogen interaction. The Scientific World Journal 11, 1749-1761.
| Crossref | Google Scholar |
Szklarczyk D, Franceschini A, Wyder S, Forslund K, Heller D, Huerta-Cepas J, Simonovic M, Roth A, Santos A, Tsafou KP, Kuhn M, Bork P, Jensen LJ, von Mering C (2015) STRING v10: protein-protein interaction networks, integrated over the tree of life. Nucleic Acids Research 43, D447-D452.
| Crossref | Google Scholar | PubMed |
Tang H, Bowers JE, Wang X, Ming R, Alam M, Paterson AH (2008) Synteny and collinearity in plant genomes. Science 320, 486-488.
| Crossref | Google Scholar | PubMed |
Varshney RK, Hiremath PJ, Lekha P, Kashiwagi J, Balaji J, Deokar AA, Vadez V, Xiao Y, Srinivasan R, Gaur PM, Siddique KHM, Town CD, Hoisington DA (2009) A comprehensive resource of drought- and salinity-responsive ESTs for gene discovery and marker development in chickpea (Cicer arietinum L.). BMC Genomics 10, 523.
| Crossref | Google Scholar | PubMed |
Wai AH, Waseem M, Khan ABMMM, Nath UK, Lee DJ, Kim ST, Kim CK, Chung MY (2021) Genome-wide identification and expression profiling of the PDI gene family reveals their probable involvement in abiotic stress tolerance in tomato (Solanum lycopersicum L.). Genes 12, 23.
| Crossref | Google Scholar |
Wang W, Vinocur B, Shoseyov O, Altman A (2004) Role of plant heat-shock proteins and molecular chaperones in the abiotic stress response. Trends in Plant Science 9(5), 244-252.
| Crossref | Google Scholar | PubMed |
Wang X, Wu M-H, Xiao D, Huang R-L, Zhan J, Wang A-Q, He L-F (2021) Genome-wide identification and evolutionary analysis of RLKs involved in the response to aluminium stress in peanut. BMC Plant Biology 21, 281.
| Crossref | Google Scholar | PubMed |
Wu H, Dorse S, Bhave M (2012) In silico identification and analysis of the protein disulphide isomerases in wheat and rice. Biologia 67, 48-60.
| Crossref | Google Scholar |
Xu G, Guo C, Shan H, Kong H (2012) Divergence of duplicate genes in exon–intron structure. Proceedings of the National Academy of Sciences of the United States of America 109, 1187-1192.
| Crossref | Google Scholar |
Yadav S, Yadava YK, Kohli D, Meena S, Kalwan G, Bharadwaj C, Gaikwad K, Arora A, Jain PK (2022) Genome-wide identification, in silico characterization and expression analysis of the RNA helicase gene family in chickpea (C. arietinum L.). Scientific Reports 12, 9778.
| Crossref | Google Scholar |
Zhang Z, Liu X, Li R, Yuan L, Dai Y, Wang X (2018) Identification and functional analysis of a protein disulfide isomerase (AtPDI1) in Arabidopsis thaliana. Frontiers in Plant Science 9, 913.
| Crossref | Google Scholar | PubMed |
Zhu C, Luo N, He M, Chen G, Zhu J, Yin G, Li X, Hu Y, Li J, Yan Y (2014) Molecular characterization and expression profiling of the protein disulfide isomerase gene family in Brachypodium distachyon L. PLoS ONE 9(4), e94704.
| Crossref | Google Scholar | PubMed |