
Spatiotemporal variability of monthly precipitation concentration in Argentina
María Paula Llano A B *
A B *
A Departamento de Ciencias de la Atmósfera y los Océanos – Universidad de Buenos Aires, Intendente Güiraldes 2160, Buenos Aires, Argentina.
B Consejo Nacional de Investigaciones Científicas y Técnicas – CONICET, Buenos Aires, Argentina.
Journal of Southern Hemisphere Earth Systems Science 73(2) 168-177 https://doi.org/10.1071/ES22040
Submitted: 13 December 2022 Accepted: 2 June 2023 Published: 22 June 2023
© 2023 The Author(s) (or their employer(s)). Published by CSIRO Publishing on behalf of the Bureau of Meteorology. This is an open access article distributed under the Creative Commons Attribution-NonCommercial-NoDerivatives 4.0 International License (CC BY-NC-ND)
Abstract
Studies of the spatial and temporal variability of precipitation concentration are necessary. This variability is a significant climate element and also a critical socioeconomic factor. This study aims to contribute to the knowledge of rainfall in Argentina using records of monthly precipitation for 64 stations (period 1991–2021) to calculate the monthly precipitation concentration index (PCI). Precipitation in Argentina, given its vast territory, presents a great variability with a wide range of rainfall regimes; the range of PCI values is 10.6–27.3. Values of PCI range from uniform distribution (less than 10) to strong irregularity of precipitation distribution (greater than 20). The north-west of the country shows a high concentration and the south has a low concentration. Analysis shows that the majority of the stations have positive trends in PCI (although not significant), and this increase in concentration of precipitation could become a risk depending on the evolution of the associated rain.
Keywords: Argentina, climate indices, distribution, monthly precipitation, precipitation concentration index, trends, variability.
1.Introduction
The climate is changing towards increasingly extreme situations, and the behaviour of precipitation demonstrates this with the increasing number of more extreme events. In this type of event, it is necessary to know the precipitation distribution. This is a point of interest given the problems that it can cause (e.g. floods and erosion), and studying the concentration of precipitation allows characterising the climate of a region (Zhang et al. 2019). One problem with a high concentration of precipitation is that it increases the duration of dry seasons, causing a reduction in soil moisture and even extreme situations such as desertification (Ghaedi and Shojaian 2020).
The monthly precipitation concentration index (PCI) was developed by Oliver (1980) to assess the homogeneity of monthly precipitation throughout the year. This index has potential utility for applied climatology because it facilitates regionalisation.
The PCI can be used as an indicator of hydrological hazard risks such as floods and droughts (Gocic et al. 2016). The PCI is used in different regions of the world: de Luis et al. (2011) studied the spatial and temporal changes of precipitation in Spain, Coscarelli and Caloiero (2012) explored the spatial and temporal patterns of the concentration of monthly precipitation in Calabria, Southern Italy. Llano (2018) compared the PCI values in Argentina with other countries. Zamani et al. (2018) studied the concentration of precipitation in India, through the PCI, finding a highly irregular and non-uniform distribution on an annual scale. Caloiero et al. (2019) analysed the effect of climate changes on the rainfall distribution throughout the year by means of the PCI in the Sardinia region. Ghaedi and Shojaian (2020) found that latitude, topography and distance from the Caspian Sea were the best factors explaining the spatial distribution of PCI in Iran.
Several studies have analysed PCI trends, for example, Guo et al. (2020) found that 69% of the stations in China had a negative trend (only 12% significant). In India, Zamani et al. (2018) found that the PCI trend was negative mainly for the area in eastern and north eastern parts of the Jharkhand state. Zhang et al. (2019) analysed the relationships between annual PCI values and five climate indices in China, finding different results according to the region. In Central Asia, Yang P. et al. (2020) concluded that precipitation concentration had close relationships with some climatic indices: North Atlantic Oscillation, El Niño Modoki Index, Pacific Decadal Oscillation (PDO) and Southern Oscillation Index (SOI).
Under the hypothesis that the study of precipitation concentration helps to improve knowledge of the precipitation distribution, the objectives of this work are to analyse the spatial distribution of precipitation concentration on annual and seasonal scales, determine the relationship with geographical parameters and the possible teleconnection with the large-scale circulation pattern (through climate indices), and finally study the changes in PCI over time.
2.Data and methodology
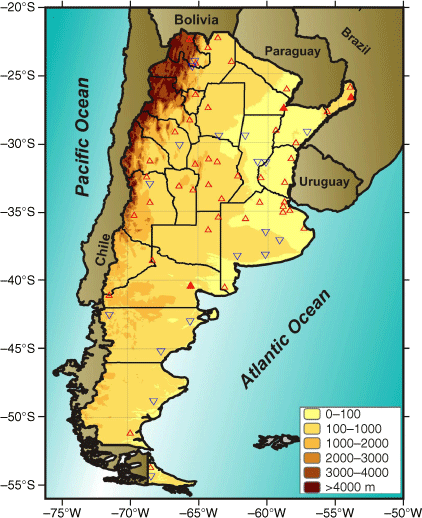
In the present work, 64 meteorological stations are used for the period 1991–2021 provided by the National Meteorological Service (SMN) to study the monthly precipitation through the PCI developed by Oliver in 1980. This index allows quantifying of the relative distribution of precipitation patterns and estimating their seasonality (Coscarelli and Caloiero 2012).
The PCI is described as follows:
where pi represents the monthly precipitation in month i that is calculated for each studied station and for each year throughout the observation period. In addition, the PCI is calculated on a seasonal scale (SPCI) for autumn (March–May), winter (June–August), spring (September–November) and summer (December–February), according to Eqn 2:
A classification of PCI values was suggested by de Luis et al. (2011): under 10, precipitation distribution is uniform (concentration is low); 11–15, concentration is moderate; 16–20, an irregular distribution; and above 20, strong irregularity of precipitation distribution (high concentration).
Annual and seasonal trends are evaluated using the nonparametric Mann–Kendall (M–K) test (Mann 1945; Kendall 1962). This non-parametric test is widely used for changes in different meteorological variables.
The years are classified using a transformed annual precipitation z:
where x is annual precipitation, u is annual mean precipitation and σ is standard deviation of annual precipitation. A year is dry where z ≤ −0.5 and wet if z ≥ 0.5 (Gocic et al. 2016). The PCI is calculated for the two classifications. In each station, the percentage of years in the dry or wet category differs. On average, the PCI in the dry (wet) category is calculated using 9 (8) years.
Kendall’s tau statistic (Siegel 1956) is used to estimate a rank-based measure of association between PCI and the climatic index (temporal) (Yang T. et al. 2020).
3.Results
3.1. Annual accumulated precipitation distribution and PCI
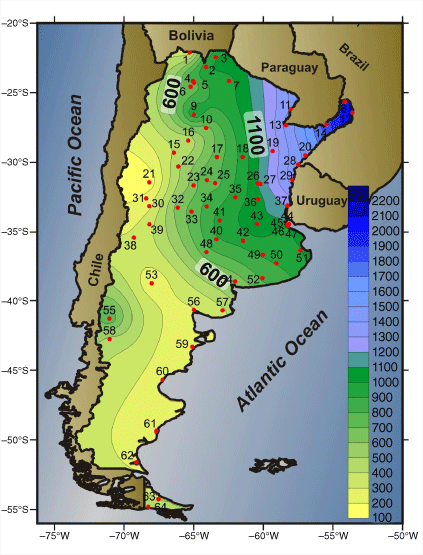
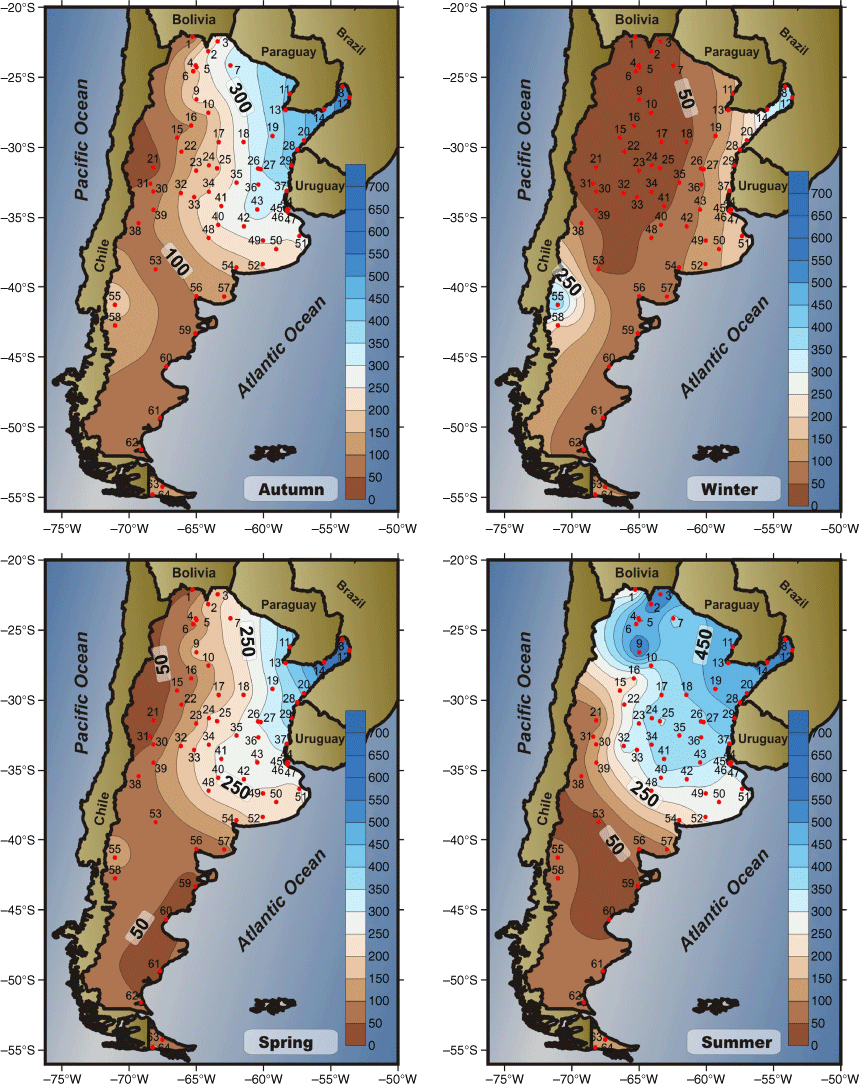
In the north, the distribution of annual precipitation presents a marked east–west gradient. In the east, the annual accumulations exceed 2200 mm, but in the west do not exceed 700 mm, with minima in San Juan and Mendoza (21 and 31 respectively, Fig. 1). In the south of the country, the gradient changes and the relative maximum (800 mm) is in the Andes region, and the coast has values below 300 mm.
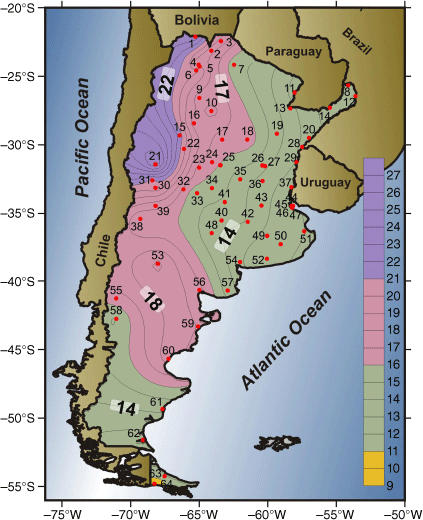
The accumulated precipitation is distributed throughout the year in different forms, according to the region. Once again, there is a marked east–west gradient. The maximum values are in the north-west, presenting a strong irregularity of precipitation distribution (PCI > 20). The west presents the absolute maximum in San Juan station (PCI = 27.3). In the north-east, the PCI values are less than 15, associated with a moderate distribution (Fig. 2). The northern region of Patagonia shows an irregular distribution (PCI of 15–20). These regions with a distribution irregularity are associated with the arid diagonal observed in rainfall (Bruniard 1982). In the south, the Ushuaia station (number 64) has the lowest PCI value (PCI = 10.6), the only locality with a uniform annual distribution.
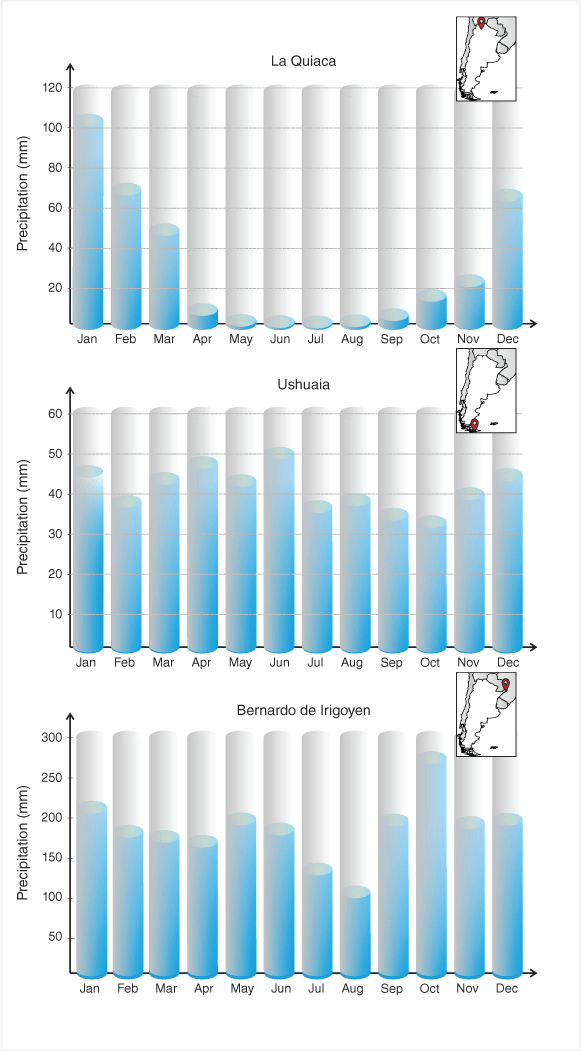
Analysing the PCI values joined with the precipitation shows different particularities. Ushuaia and La Quiaca (number 1) have approximately the same annual accumulations, but the PCIs are very different: Ushuaia has the lowest PCI (10.6), and La Quiaca is a high PCI (23.9). This difference is due to the precipitation distribution (Fig. 3): in Ushuaia this is homogeneous throughout the 12 months, mainly due to the passage of frontal systems throughout the year, whereas La Quiaca has a strongly irregular distribution, with rain only during summer. Ushuaia can also be compared with Bernardo de Irigoyen station (number 12) with a similar PCI (11.1), which station has the maximum annual accumulation (2225 mm) perfectly distributed throughout the year. These three examples show how similar PCI values can be associated with different precipitation accumulations, just as comparable precipitation values can have very different PCIs. The magnitude of PCI is independent of the accumulated precipitation. Fig. 3 shows the three extremes cases: minimum and maximum PCI and maximum precipitation.
3.2. Wet and dry years
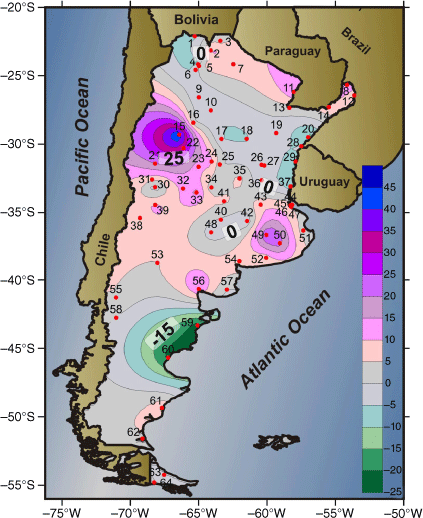
To determine any closer relationship between PCI values and annual accumulation, wet and dry years are selected based on how much they deviate from a standardised value. Fig. 4 shows the percentage of change in PCI between wet and dry years. The spatial distribution has two big centres: the Patagonian coast has a change of ~25%, always in the category of irregular distribution, but wet years have a PCI approximately equal to 21, whereas in the dry years, the value is 16. The north mountain range, La Rioja station (number 15) has PCI of 18 in wet years and 27 in dry years, which represents a 50% increase; Chamical (number 22) shows a 30% increase, going from 17 to 22 between wet and dry. Another case to mention is the east region with two relative centres: in the north, the dry years have lower PCI (~10%); in the south, the PCI is greater in dry years (20%). For example, PCI in Olavarria (number 49) changes between 11 (wet) and 14 (dry).
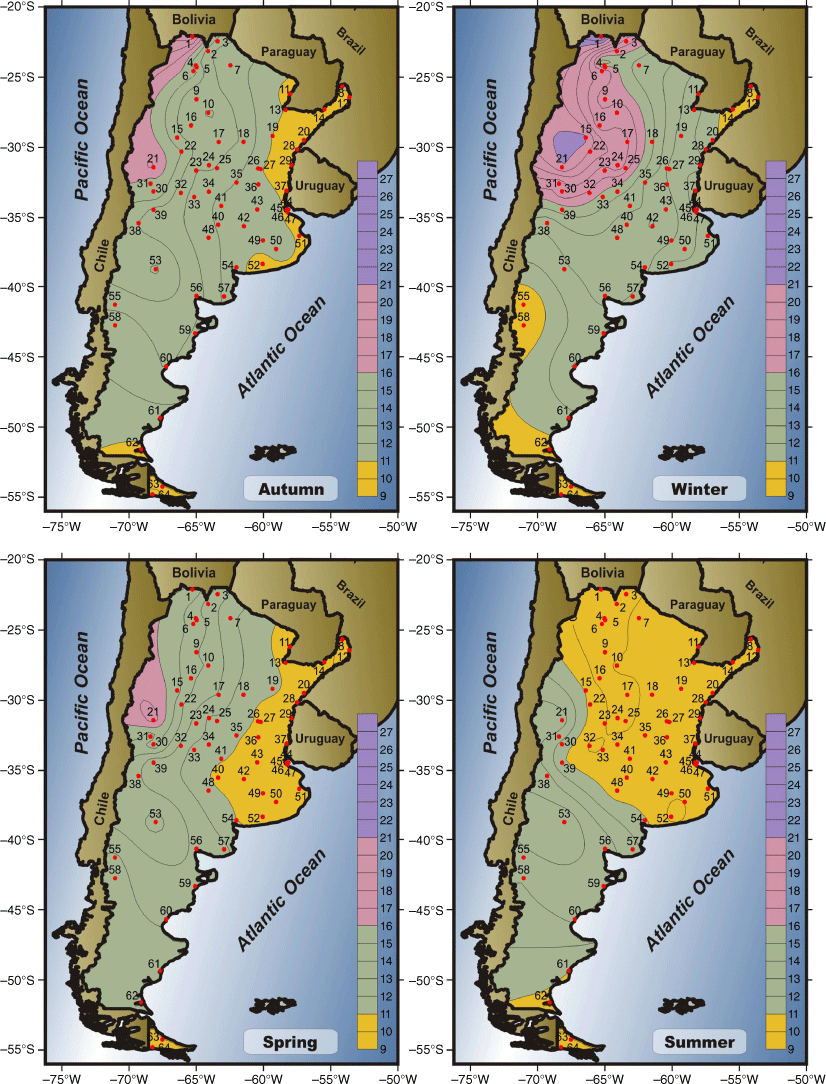
3.3. Seasonal PCI
The PCI is calculated for each season in particular (Fig. 5). Winter is the season that shows the four PCI categories: in the southern mountain range, the distribution is uniform, as well as the extreme north-east of the country. These two regions coincide in that they accumulate the highest precipitation at a seasonal level (Fig. 6). The irregular distribution category is relegated to the north-west, presenting only three station PCI values corresponding to a highly irregular distribution (La Quiaca, 1; La Rioja, 15; and San Juan, 21) with precipitation below 50 mm in the season (low rainfall and poorly distributed). The intermediate categories cover the rest of the territory. The transition seasons (autumn and spring) have very similar behaviour to the east–west gradient, with most of the country within the category of moderate distribution of precipitation (11 < PCI < 15). No stations have a highly irregular distribution. In the central-north region of the country, the distribution of the isolines of PCI shows a similar disposition to the isohyets (where the precipitation is high, the distribution is more homogeneous, and vice versa). The months that comprise these seasons have approximately the same accumulation. Finally, during summer, the north stations have a uniform distribution while the rest of the country shows moderate PCI values. The 250-mm isohyet seems to mark the limit between the two categories of precipitation distribution.
3.4. Temporal changes in PCI
As a first point, the variability of the PCI is analysed. It is noteworthy that the highest standard deviations are for the stations where PCI represents an irregular distribution of precipitation. The precipitation has a marked seasonality, but not all years are the same. There are particular situations, for instance, San Juan station, where most years present a strong irregular distribution. The most extreme year is 1994 (PCI = 69), mainly due to extreme rain in February that doubled the monthly average value (Perucca and Paredes 2005). On some occasions, the PCI indicates a moderate distribution – as for 2000 when, atypically, the months of autumn and winter accumulated rainfall outside the normal values (Fig. 7). San Juan shows the most extreme case, but the situation is similar in the entire Andean region.
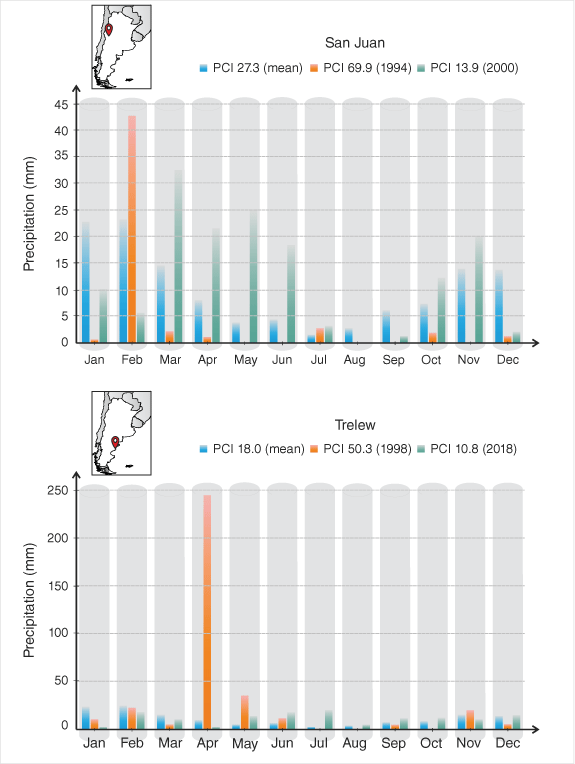
Another point to highlight occurs on the coast of northern Patagonia, with Trelew and Comodoro Rivadavia (station numbers 59 and 60) usually presenting a PCI with an irregular distribution, but in some years the distribution is moderate and in others normal. These cases of strong irregular distribution are caused by extreme events such as the one that occurred in Trelew in 1998, when April precipitation was 10 times the mean value (Chachero 2012), giving a PCI of 50.3. The north-eastern stations, given their regular precipitation regime, show less variation.
The PCI behaviour is analysed using the M–K test. On an annual scale (Fig. 8), only three stations present a significant positive trend, indicating that precipitation is distributed increasingly irregularly in Bernardo de Irigoyen, Corrientes (number 13, in the north-east) and San Antonio Oeste (number 56) in the north of Patagonia. Of the remaining stations, 75% present a positive trend, but not significant, and only in 18 stations are the values of M–K negative, mainly in coast stations and in a band in the central country. At the same time, the analysed trend in the annual precipitation records (data not shown) shows a negative trend for 45 stations, of which only 9 are significant at 5%. No significant positive increases are observed.
The three stations with significant changes in the PCI present negative variations in the accumulated precipitation (but not significant). Over time the amount of precipitation is increasingly less evenly distributed.
On a seasonal scale, the trends in accumulated precipitation and PCI are also analysed jointly. In the four seasons, the PCI values present numerous positive trends (although not significant), and precipitation behaves oppositely. Winter is the most extreme case, with 49 stations showing an increase in PCI, giving rise to a more irregular distribution over the years. However, winter precipitation is less each year (48 of the 64 stations), repeating the behaviour seen on an annual scale (i.e. less precipitation and more irregular).
3.5. Correlation between PCI and climate indices
The PCI values are correlated with different climatic indices (PDO; El Niño 3.4; Antarctic Oscillation, AAO; and SOI) to understand the possible teleconnection of PCI with large-scale circulations. As climate indices may influence the PCI values of a current year (season) and the following year (season), the correlations are calculated for 0 and 1 year ahead and 0 and 1 season ahead (Table 1) between the climatic indices and the PCI values of each station.
| PDO | El Niño | AAO | SOI | ||||||
|---|---|---|---|---|---|---|---|---|---|
| Positive | Negative | Positive | Negative | Positive | Negative | Positive | Negative | ||
| Annual | 0 year | 26 | 38 (1) | 27 (1) | 37 (3) | 32 (3) | 32 (1) | 43 (6) | 21 |
| 1 year | 33 | 31 (1) | 37 | 27 (1) | 27 | 37 (2) | 32 (1) | 32 (1) | |
| Autumn | 0 season | 19 | 45 (2) | 20 (1) | 44 (2) | 27 (2) | 37 (1) | 36 (2) | 28 (1) |
| 1 season | 20 | 44 (4) | 29 (1) | 35 | 38 (4) | 26 | 38 | 26 (1) | |
| Winter | 0 season | 32 | 32 (1) | 32 (4) | 32 (3) | 40 (5) | 24 (1) | 35 (3) | 29 |
| 1 season | 22 | 42 (7) | 25 | 39 (6) | 22 | 41 (10) | 42 (2) | 20 (1) | |
| Spring | 0 season | 36 | 28 | 43 (5) | 21 (3) | 23 (1) | 41 (7) | 23 (2) | 40 (5) |
| 1 season | 39 (6) | 25 | 48 (2) | 16 | 39 (3) | 25 | 11 | 53 (6) | |
| Summer | 0 season | 29 (2) | 33 | 32 (1) | 32 (2) | 26 | 38 (4) | 35 | 28 (2) |
| 1 season | 27 | 37 (1) | 30 (1) | 34 (1) | 27 | 37 (2) | 32 (2) | 30 | |
Significant case are in parentheses.
On an annual scale, non-significant negative correlations (0 years) with PDO and El Niño predominate, whereas for SOI, the correlations are mainly positive (significant in six stations located in the central north of the country). In summer and autumn, this pattern of behaviour is repeated (0 seasons ahead – no lagged correlation). In winter, there is no defined pattern, and the amounts of positive or negative correlations are similar. In spring, the signs of the correlations between PCI and the different indices change: with PDO and El Niño, there is a greater quantity of positive correlations, whereas with AAO and SOI, negative correlations dominate.
The correlations with 1-year lag (climatic indices in the previous year or season) are analysed to find a pattern that allows a forecast. At the annual level, the correlations with El Niño are mainly positive. Between AAO and PCI, the correlations are negative, and with PDO and SOI, the number of stations with positive correlation is similar to that of negative ones. In all cases, significant correlations are few.
On a seasonal level, with a lag of 1 season between the climatic indices and the PCI, the results are dissimilar. In the autumn, between PDO and El Niño, negative correlations dominate – similar to what was found by Zhang et al. (2019). These negative correlations may be for two reasons. (1) Positive El Niño events (associated with higher precipitation in this region). This higher precipitation can be distributed along the months, giving rise to a lower PCI value. (2) Negative El Niño (events associated with less rain). If this precipitation has a poor distribution, it can give rise to higher PCI. For winter, PDO, El Niño and AAO present more negative correlations; depending on the index, between 15 and 25% of the cases are significant, mainly in stations located in the centre of the country.
In spring, the pattern change is that positive correlations dominate. The AAO and precipitation during spring behave oppositely (Silvestri and Vera 2003). High AAO is associated with less rainfall, if this has an irregular distribution, then PCI is high, whereas for the SOI, more than 50 stations show negative correlations. In summer, the amounts of positive or negative correlations are very similar in all cases.
In all cases, the geographical distribution of significant relationships is highly variable, and does not define a clear pattern of behaviour. However, this does not mean that the annual and seasonal PCI are influenced by the climate indices studied.
4.Discussion and conclusions
The precipitation variability in Argentina in the last 30 years is studied using the PCI (Oliver 1980), an indicator of the concentration of monthly precipitation. The analyses are on an annual and seasonal scale in 64 stations provided by the SMN. Its spatial and temporal variability and its relationship with climatic indices are analysed.
The PCI classification comprises four categories (de Luis et al. 2011): low concentration (distribution is uniform), moderate concentration, irregular distribution and strong irregularity of precipitation distribution (high concentration).
In the centre-north of the country, the distribution of annual precipitation presents a marked east–west gradient (between 2200 and 700 mm). This region comprises the La Plata basin and Argentinean Pampa Húmeda, two areas with social and economic importance (the majority of the population lives there, and the principal agricultural activities take form).
The Patagonian stations present lower annual accumulations than those in the north. The precipitation distribution throughout the year is dissimilar. The Andes play a crucial role in determining the climate of Patagonia. The mountains impose a barrier for humid air masses coming from the Pacific Ocean (Paruelo et al. 1998).
The spatial distribution of PCI is consistent with the distribution of precipitation. In the north, there is a marked east–west gradient. The maximum PCI values are in the area of the Andes Mountains as a result of the scarce and poorly distributed precipitation throughout the year. These results are consistent with those of Doyle (2020), who found a strong irregularity of precipitation throughout the year in the Andes region. The minimum values are in the south as a result of frontal systems that provide rain throughout the year. This distribution is reflected in all seasons except summer, when the lowest PCI values occur in the north of the country due to the precipitation regime in that area.
The PCI is analysed using the M–K test. The results show principally non-significant trends, similar to findings of Ghaedi and Shojaian (2020) for 30 years at stations in Iran.
Of the stations, 75% present a positive trend, and only 18 stations have negative values of M–K (not significant in all cases). This positive trend means that precipitation distribution is increasingly irregular.
The annual precipitation shows trends, mostly negative and not significant. The overall results for PCI and precipitation trends show that, with time, precipitation is lower and more irregular.
There is a response to climatic indices (PDO, El Niño, AAO and SOI) for annual and, to a greater extent, seasonal PCI. Zhang et al. (2019) found similar relationships (negative correlations) between the PDO and El Niño indices and the PCI in different regions of China.
The relevance of this work lies in the fact that analysing the behaviour of PCI on a spatial and temporal scale and its relationship with other variables contributes to verifying the effects of climate change on one of the properties of precipitation. In addition, all kinds of studies of the concentration of precipitation (at different temporal scales) are tools for water resources management plans (urban flood management and runoff collecting systems). Knowing the distribution of precipitation, its possible temporal changes and their association with climatic indices allows us to see how this particular rain property behaves in relation to the effects of climate change.
Data availability
Meteorological information was provided by the National Meteorological Service (SMN) (see https://www.smn.gob.ar).
Acknowledgements
I thank anonymous referees for their valuable comments and critical reading of the article. I thank K. Llano and P. Leal for their technical assistance and to Servicio Meteorológico Nacional and Data Storage of DCAO.
References
Bruniard E (1982) La diagonal árida argentina: un límite climático real. [The Argentinian arid diagonal: a real climatic limit.]. Revista Geográfica 95, 5-20 [In Spanish].
| Google Scholar |
Caloiero T, Coscarelli R, Gaudio R, Leonardo GP (2019) Precipitation trend and concentration in the Sardinia region. Theoretical and Applied Climatology 137, 297-307.
| Crossref | Google Scholar |
Chachero MJ (2012) Estudio de precipitaciones en la ciudad de Trelew, análisis estadístico y ecuación de lluvia. [Precipitation study in the city of Trelew, statistical analysis and rain equation.]. Cuadernos de Curiham 18, 23-37 [In Spanish].
| Crossref | Google Scholar |
Coscarelli R, Caloiero T (2012) Analysis of daily and monthly rainfall concentration in Southern Italy (Calabria region). Journal of Hydrology 416–417, 145-156.
| Crossref | Google Scholar |
de Luis M, González-Hidalgo JC, Brunetti M, Longares LA (2011) Precipitation concentration changes in Spain 1946–2005. Natural Hazards and Earth System Sciences 11, 1259-1265.
| Crossref | Google Scholar |
Doyle ME (2020) Observed and simulated changes in precipitation seasonality in Argentina. International Journal of Climatology 40, 1716-1737.
| Crossref | Google Scholar |
Ghaedi S, Shojaian A (2020) Spatial and temporal variability of precipitation concentration in Iran. Geographica Pannonica 24, 244-251.
| Crossref | Google Scholar |
Gocic M, Shamshirband S, Razak Z, Petkovic D, Ch S, Trajkovic S (2016) Long-term precipitation analysis and estimation of precipitation concentration index using three support vector machine methods. Advances in Meteorology 2016, 7912357.
| Crossref | Google Scholar |
Guo E, Wang Y, Jirigala B, Jin E (2020) Spatiotemporal variations of precipitation concentration and their potential links to drought in mainland China. Journal of Cleaner Production 267, 122004.
| Crossref | Google Scholar |
Llano MP (2018) Spatial distribution of the daily rainfall concentration index in Argentina: comparison with other countries. Theoretical and Applied Climatology 133, 997-1007.
| Crossref | Google Scholar |
Mann HB (1945) Non-parametric test against trend. Econometrica 13(3), 245-259.
| Crossref | Google Scholar |
Oliver JE (1980) Monthly precipitation distribution: a comparative index. The Professional Geographer 32(3), 300-309.
| Crossref | Google Scholar |
Paruelo J, Beltrán A, Jobbágy E, Sala O, Golluschi R (1998) The climate of Patagonia: general patterns and controls on biotic processes. Ecología Austral 8, 85-101.
| Google Scholar |
Perucca LP, Paredes JD (2005) Peligro de aluviones en el departamento de Pocito, provincia de San Juan. [Danger of floods in the department of Pocito, province of San Juan.]. Revista de la Asociación Geológica Argentina 60, 48-55 [In Spanish].
| Google Scholar |
Silvestri GE, Vera CS (2003) Antartic oscillation signal on precipitation anomalies over southeastern South America. Geophysical Research Letters 30, 2115.
| Crossref | Google Scholar |
Yang P, Zhang Y, Xia J, Sun S (2020) Investigation of precipitation concentration and trends and their potential drivers in the major river basins of Central Asia. Atmospheric Research 245, 105128.
| Crossref | Google Scholar |
Yang T, Li Q, Chen X, De Maeyer P, Yan X, Liu Y, Zhao T, Li L (2020) Spatiotemporal variability of the precipitation concentration and diversity in Central Asia. Atmospheric Research 241, 104954.
| Crossref | Google Scholar |
Zamani R, Mirabbasi R, Nazeri N, Meshram SG, Ahmadi F (2018) Spatio-temporal analysis of daily, seasonal and annual precipitation concentration in Jharkhand state, India. Stochastic Environmental Research and Risk Assessment 32, 1085-1097.
| Crossref | Google Scholar |
Zhang K, Yao Y, Qian X, Wang J (2019) Various characteristics of precipitation concentration index and its cause analysis in China between 1960 and 2016. International Journal of Climatology 39, 4648-4658.
| Crossref | Google Scholar |