
Evaluation of CMIP6 AMIP climate simulations with the ACCESS-AM2 model
R. W. Bodman A B C E , D. J. Karoly B C , M. R. Dix C , I. N. Harman D , J. Srbinovsky C , P. B. Dobrohotoff C and C. Mackallah CA School of Earth Sciences, The University of Melbourne, Parkville, Melbourne, Vic. 3010, Australia.
B NESP Earth Systems and Climate Change Hub, CSIRO, Aspendale, Australia.
C Climate Science Centre, Oceans and Atmosphere, CSIRO, Aspendale, Australia.
D Climate Science Centre, Oceans and Atmosphere, CSIRO, Canberra, Australia.
E Corresponding author. Email: rwbodman@unimelb.edu.au
Journal of Southern Hemisphere Earth Systems Science 70(1) 166-179 https://doi.org/10.1071/ES19033
Submitted: 13 December 2019 Accepted: 18 March 2020 Published: 4 September 2020
Journal Compilation © BoM 2020 Open Access CC BY-NC-ND
Abstract
The most recent version of the ACCESS-AM2 atmosphere-only climate model is introduced with results from the CMIP6 Atmospheric Model Intercomparison Project (AMIP) experiments configured with two land-surface models: CABLE and JULES. AMIP simulations are required as part of the CMIP6 core experiments. They are forced by prescribed time-varying observed sea surface temperature and sea-ice variations as well as variations in natural and anthropogenic external forcings. We evaluate the performance of the two configurations using three historical realisations for each. Model biases are estimated both globally and for the Australian region. The model shows close agreement with observed interannual variations of global-mean temperature across the latitude range 65°N–65°S. This is also true for the land-only temperature for 65°N–65°S, and a more stringent test of the model is driven by specified observed sea surface temperatures. Patterns of mean precipitation are simulated reasonably well, although there are biases in the amount and distribution of precipitation, typical of longstanding problems in representing this aspect of the climate. Selected features of the atmospheric circulation are discussed, including air temperatures and wind speeds. For the Australian region, in addition to examining the climatological patterns of temperature and precipitation, important drivers of climate variability are reviewed: El Niño-Southern Oscillation, the Indian Ocean Dipole and the Southern Annular Mode. In general, the correlation patterns for precipitation simulated by ACCESS-AM2 are somewhat weaker than in observations, although the ensemble means show better agreement than individual ensemble members. Overall, the two different land-surface schemes perform similarly. ACCESS-AM2 has reduced root mean square errors for both temperature and precipitation of around 15–20% at the global scale compared to the older CMIP5 versions of the model: ACCESS 1.0 and ACCESS 1.3.
Keywords: ACCESS-AM2 atmosphere-only climate model, Australia, climate model evaluation, CMIP6 AMIP simulations, El Niño, global scale.
1 Introduction
An evaluation of the recently developed Australian Community Climate and Earth System Simulator – Atmospheric Model version 2 (ACCESS-AM2) configured for the Coupled Model Intercomparison Project phase 6 (CMIP6) (Eyring et al. 2016) Atmospheric Model Intercomparison Project (AMIP) simulations is presented. Selected features of the simulated surface temperatures, precipitation, mean sea-level pressure and atmospheric circulation are addressed, with a focus on global-mean and Australian annual results along with seasonal variability compared to observations or reanalysis data.
AMIP simulations with a global atmospheric climate model involve simulations over the historical period from 1979 to the present with specified observed sea surface temperature (SST) and sea-ice variations, observed greenhouse gas (GHG) and stratospheric ozone mixing ratios and aerosol emissions. The ACCESS-AM2 configurations were set up as extended AMIP runs (1951–2014 rather than the standard 1979–2014), employing CMIP6 historical forcing data as described in Section 2.2. They represent the atmospheric responses to the SST variations and to the GHG, ozone and aerosol changes, as well as coupling between the atmosphere and the land surface. These simulations generally have smaller biases than simulations with coupled ocean–atmosphere models and can be better evaluated against observed interannual climate variations because they include forcing by observed SST and volcanic aerosol variations. They do, however, lack the two-way interaction with the ocean.
Three realisations were created for each of two model configurations, one set with CABLE as the land-surface model and one set with the JULES land-surface model. This study therefore also provides a test of the role of the land-surface scheme in ACCESS-AM2’s response to climate forcing. Differences in the land-surface models are included with the model outline presented in Section 2.1 along with the CMIP6 forcings, the experiments conducted and the data used for the evaluation.
We primarily focus on evaluation of near-surface air temperature (SAT) and precipitation at the global scale and for the Australian region. Model results are presented considering the global-scale surface temperature, precipitation, mean sea-level pressure, air temperature and wind speeds in Section 3. Then, in Section 4, results for the Australian region are discussed, considering surface temperature and precipitation patterns, followed by the teleconnections or climate drivers that influence precipitation variability, including El Niño-Southern Oscillation (ENSO), the Indian Ocean Dipole (IOD) and the Southern Annular Mode (SAM).
2 Model experiments
2.1 Model outline
The current ACCESS atmosphere-only climate model (hereinafter AM2) configured for CMIP6 is based on the UK Met Office’s (UKMO) Unified Model (UM) Global Atmosphere (GA) 7.1 with some differences to suit local requirements, particularly in regard to having the atmospheric model compatible with the fully coupled version of the model, which uses different ocean, sea ice and land-surface models to that of the UKMO’s climate model, HadGEM3. Details of the ACCESS model are provided in Bi et al. (2020) and the UM is documented in Walters et al. (2019); only a brief outline of the model components is included here.
This climate version of ACCESS is operated at N96 resolution (approximately 1.25° latitude by 1.875° longitude, or roughly 130-km grid box size at mid-latitudes) with 85 vertical levels, 50 levels below 18 km and 35 levels above this.
The land-surface model used with ACCESS-AM2 can be either the Community Atmosphere Biosphere Land Exchange (CABLE) model (AM2) or the Joint UK Land Environment Simulator JULES (AM2j), with the former being the default ACCESS version for the CMIP6 submissions; here we include simulations using both. CABLE version 2.5 is outlined in Bi et al. (2020) and the JULES Global Land 7.0 configuration is documented in Best et al. (2011) and Clark et al. (2011). Differences between the two land-surface models are given in Kowalczyk et al. (2013), although CABLE 2.5 is an updated version of CABLE 1.8 (Kowalczyk et al. 2013) used in ACCESS1.3 for the CMIP5 submission. The CABLE updates address some energy and water conservation problems identified during model development. The land-surface models use a different partitioning of land cover into surface types with differences in the number and types of tiles per grid cell. CABLE has a column of soil below each of its tiles while JULES uses one soil column per grid cell. CABLE uses six soil layers, and JULES uses four. There are other detailed differences, beyond the scope of this paper. Harman et al. (2019) provides a listing of the CABLE updates, while a more comprehensive assessment of the impact of the configuration changes is being prepared for publication.
Each simulation starts from a set of specified initial conditions, with each case using output from a previous coupled historical run with the matching land-surface models. Historical time-varying forcing data are then used to enable climate simulations to run for 1951–2014, a longer period than the standard AMIP setup. At least the first five years are left unused as an adjustment period for the deeper soil levels to respond to the initial conditions. Multiple realisations were achieved by perturbing air temperatures in the initial conditions.
2.2 CMIP6 forcings
The ACCESS-AM2 CMIP6 AMIP model configuration incorporates a set of CMIP6 time-varying forcings, including prescribed monthly SSTs and sea ice concentrations (SICs), solar forcing, GHGs, volcanic aerosol optical depth, aerosol chemistry emissions and ozone (Eyring et al. 2016; Durack et al. 2019). Land-cover forcing variations have not been implemented in the AM2 (CABLE) version as yet and, consequently, these were not included in the JULES version.
Data for the SSTs and SICs was derived from the input4MIPS data base1 and processed by the UKMO. This required interpolation of the 1° × 1° source data to the model grid and associated land–sea fractional mask for N96, modifying the data to ensure daily values computed by the model average to the monthly value in the source data, and production of the ancillary files to the UM’s input format.
Solar forcing includes a revised, lower, mean total solar insolation (TSI) value of 1361.0 ± 0.5 W m−2 (previously set at 1365.65 W m−2 in the CMIP5 versions of ACCESS) along with a spectral file that provides monthly time-varying details for the solar cycle.
Information about changing GHG concentrations is provided in the form of annual mass mixing ratios for carbon dioxide, methane, nitrous oxide, with CFCs and HFCs represented by two equivalents, CFC-12-eq and HFC-134a-eq, with data provided for the period of the AMIP simulation. These are used as globally uniform values.
The volcanic aerosol optical depth (AOD) and associated forcing is determined from a set of ancillary files containing the aerosol optical properties in the solar (shortwave, SW) and terrestrial (long wave, LW) spectrum. Volcanic aerosols in the stratosphere are processed by the Easy Aerosol module (Stevens et al. 2017).
Aerosol chemistry emissions are used for tropospheric aerosols. These data are processed by the UKCA Glomap-mode module (Mann et al. 2010, 2012). The emission files contain monthly aerosol and aerosol precursor emissions from anthropogenic and biomass burning sources that allow for sulfates and black and organic carbon. Biogenic and natural emissions are not supplied by CMIP6; sea salt and DMS emissions are calculated by the model. For ozone, monthly latitude-height resolved fields are used.
2.3 Experiments
Three realisations each with CABLE (labelled C1–C3) and JULES (labelled J1–J3) were completed for this study. All were run for 1951–2014, except J3 which started in 1979. The ensembles (labelled C-ens and J-ens) of the three realisations for each land-surface model provide some scope for considering the range of internal variability exhibited by the model and the degree of overlap or otherwise between the JULES and CABLE versions of the model.
2.4 Evaluation data
A combination of observations and reanalysis data was used for model evaluation. For global near-SATs, HadCRUT4 (Morice et al. 2012) and CRUTEM (Osborn and Jones 2014) observationally derived data were used, and for global precipitation the Global Precipitation Climatology Project (GPCP) (Adler et al. 2017). ERA-Interim reanalysis (Dee et al. 2011) was used for mean sea-level pressure (MSLP), air temperature and eastward wind speed. Model evaluation over Australia was done with Australian Water Availability Project (AWAP) (Jones et al. 2009) data for both SAT and precipitation. Indices were constructed and compared to observations as detailed in the relevant sections.
3 Simulation of main historical climate features
This section addresses the principal features of the global-mean climate as simulated by the ACCESS-AM2 AMIP model, looking at temperature, precipitation, MSLP, air temperature and eastward wind speed with a focus on 1979–2014 climatology.
3.1 Surface air temperature
Simulated and observed near-SAT were compared, with both time series of globally averaged annual means and gridded mean maps.
Time series of annual global-mean SAT simulated by the models (AM2 and AM2j) are illustrated in Fig. 1, with the six realisations and two ensemble means presented as anomalies relative to 1986–2000. The model results show close agreement with the observations at this global scale (Fig. 1a) with correlations of 0.97 for both ensemble means with the observations. Given the model is driven by prescribed SST from about 70% of the earth’s surface, this is as expected. A more stringent test is to look at the land-only SAT anomalies (Fig. 1b). More variability is evident while maintaining close agreement with observations. For these land-only results, the CABLE ensemble mean correlation (r value) is 0.97 and the JULES ensemble r is 0.96. The ensemble means track closer to the observations than individual realisations (CABLE r values: 0.93, 0.96 and 092; JULES r values: 0.93, 0.93 and 0.92). The observed variability, measured by the standard deviation, is 0.28°C, slightly higher for the CABLE ensemble at 0.30 and 0.31 for the JULES ensemble. For the 1998 El Nino event, the J-ens land-only temperature is warmer than C-ens by around 0.2°C, the largest difference in these time series.

|
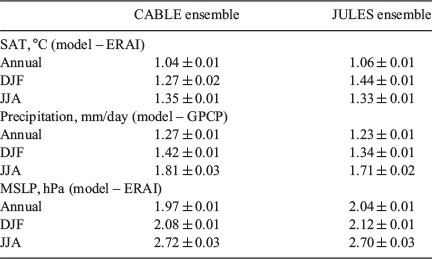
Maps of the modelled SAT for the CABLE and JULES ensembles are shown in Fig. 2 for the annual, DJF and JJA seasonal biases compared to ERA-Interim, averaged over the period 1979–2014. The model realisations all have very similar global-mean temperatures across the period 1979–2014, with the CABLE ensemble mean 14.42°C and the JULES ensemble 14.40°C, and the corresponding ERA-Interim value is 14.38°C. A measure of the model error, the root mean square error (RMSE (area-weighted)) was calculated for the ensembles as a test of relative model performance. These are summarised in Table 1 along with uncertainty estimates based on the spread of the RMSE results across individual realisations. For SAT, these results confirm that the AM2 CABLE and JULES realisations are very similar for the two land-surface models and generally similar when comparing the ensemble means, although with some seasonal difference in the RMSE values for DJF. The CABLE ensemble DJF bias includes warmer temperatures over Antarctica, even though there is a bias towards lower MSLP (see Section 3.3). The JULES DJF is cooler over regions of the northern hemisphere. Biases over the ocean relate to differences between the CMIP6 specified SSTs and ERA-Interim SSTs which are of the order of ±0.5°C, although with a RMSE of just 0.13 across their 1979–2014 mean difference.

|
RMSE values are reduced by about 20% compared with the CMIP5 ACCESS AMIP model versions (ACCESS 1.0 and ACCESS 1.3), although these results were calculated for 1979–2008 due to the different period covered by the older models. The bias patterns have also changed in some respects compared to Kowalczyk et al. (2013), although those results are for screen temperature rather than near-SAT. The DJF Antarctic cool bias in ACCESS 1.3 is reversed in AM2 and Australia has a greater warm bias in the new model, while the warm bias over the Indian sub-continent apparent in JJA is common to all of the models.
|
3.2 Precipitation
Global-mean precipitation rates (Fig. 1c) for the period 1979–2014 were 3.14 and 3.12 mm/day for AM2 and AM2j respectively, very similar to each other but more than the 2.69 mm/day obtained from GPCP observations (Adler et al. 2017) or 2.67 mm/day from CMAP observations (Xie and Arkin 1997). The equivalent ERA-Interim mean is 2.93 mm/day which, if used as the basis for evaluation, narrows the difference. This higher simulated mean precipitation is a longstanding concern with the UM and other global atmospheric models (Collins et al. 2011). Examination of the land (Fig. 1d) and ocean (not shown) mean precipitation reveals that the simulated land-only precipitation is much closer to the observations. However, this agreement is not the case for the ocean, where the mean precipitation differences account for the discrepancy between the simulated and observed global-mean precipitation noted here, with the higher simulated precipitation resulting from problems with simulated precipitation over the ocean (or otherwise the observed precipitation may have biases). Correlations between the CABLE and JULES ensembles and GPCP observations time series for land-only precipitation are 0.84 and 0.85 respectively, indicating good agreement (dropping to 0.60 and 0.50 respectively for global precipitation correlations). Interannual variability for the models’ global precipitation anomalies (Fig. 1c) is smaller than GPCP, but is closer for land-only, even though land has a larger range (note the different vertical axes in Fig. 1c and d, and that the precipitation anomaly is scaled by 100).
Maps of global-mean precipitation for the individual model realisations and ensemble means were produced (Fig. 3) with a comparison to annual and seasonal values as against GPCP observations. Although the broad precipitation patterns are similar for the CABLE ensemble and GPCP, the bias plot indicates noticeable issues around the equatorial regions, with higher than observed precipitation rates over the tropical ocean areas (extending to 25°S and 25°N) but with a dry bias evident for the Maritime continent. The Indian sub-continent has a noticeable dry bias for JJA, that is, the Indian summer monsoon is too dry. This is a common bias in versions of the UM, e.g. Jin et al. (2019). The pattern of annual mean biases (Fig. 3a and b) also show a small dry bias over the tropical ocean areas. The precipitation RMSE results (Table 1) suggest that the JULES version performs a little better than CABLE according to this global-scale metric.

|
The AM2 global RMSE value is reduced by around 14% compared with the CMIP5 ACCESS 1.0 AMIP model and is almost unchanged compared to the ACCESS 1.3 annual RMSE value, although it is reduced around 10% for the DJF and JJA seasonal values. Away from the tropical ocean, ACCESS AM2 has a small dry bias compared to the wet bias in ACCESS 1.0 and 1.3; however, the tropical biases, both wet and dry, appear less pronounced than shown in Kowalczyk et al. (2013).
3.3 Mean sea level pressure
MSLP is another important feature of the earth’s climate simulated by the models, since pressure gradients are related to the atmospheric circulation. Maps of average MSLP for 1979–2014 and model biases for the CABLE ensemble are shown in Fig. 4, and RMSE figures for the CABLE and JULES ensembles are given in Table 1 with similar results across both ensemble versions. The CABLE ensemble global-mean pressure for 1979–2014 is 1011.99 hPa and the JULES ensemble mean is 1012.03 hPa – these are very close to each other and similar to 1011.30 hPa for the ERA-Interim data.

|
The bias maps indicate biases across the Southern Ocean and for some higher topographic regions. A JJA MSLP bias over the Tibetan Plateau, for example, stands out, as well as for Antarctica. In general, the model pressure is higher at high latitudes and low at low latitudes (although not for the tropical Pacific and Indian Oceans) in comparison to the ERA-Interim reanalysis data, which may contribute to errors in regional cloud formation and surface energy fluxes. There is a bias towards lower MSLP over the Antarctic, weaker in DJF than in JJA (Fig. 4c and d). This issue is discussed by Williams et al. (2018), which points towards changes in the UM’s dynamical core and gravity drag scheme as contributors to this problem, with a large high pressure bias over the polar oceans and low pressure bias over the midlatitude continents.
3.4 Global-scale atmospheric circulation
In addition to temperature and precipitation, we consider further features of ACCESS-AM2’s AMIP climate simulation through investigation of zonal mean air temperature and eastward wind speed in the atmosphere for the CABLE ensemble. The ACCESS-AM2 JULES results are similar and not detailed further in this section. A similar analysis of zonal mean air temperature and winds is provided for the UM GA7.1 N96 version in Walters et al. (2019).
3.4.1 Air temperatures
The pattern of climatological zonal mean air temperature (1979–2014) through the atmosphere, based on pressure levels as compared to ERA-Interim reanalysis is shown in Fig. 5 for the CABLE ensemble. The annual mean pattern (Fig. 5a) is as expected with lower temperatures in the troposphere with both higher altitude and latitude, roughly symmetrical about the equator but with a cold stratosphere above Antarctica.

|
The annual mean bias (Fig. 5b) is generally quite small throughout the atmosphere, except for biases at the tropopause level at high latitudes north and south, as well as close to Antarctica. This structure is very similar to that reported by Walters et al. (2019), with a reduction in the upper-tropospheric cold bias for the newer version of the UM. The more complex temperature structure of the tropical tropopause is discussed in more detail by Williams et al. (2018). Further differences are apparent in the DJF and JJA seasonal bias plots (Fig. 5c and d). For comparison to earlier ACCESS models, the C1 realisation zonal mean air temperature (1979–2008) RMSE value is 1.83°C, whereas for ACCESS1.0 and ACCESS1.3 AMIP the respective values are 2.40°C and 2.03°C (see also Rashid et al. 2013).
3.4.2 Wind speeds
The zonal eastward wind circulation provides a picture of the position and strength of the jet streams. Fig. 6a illustrates the annual zonal mean (1979–2014) results for the AM2 ensemble and, in Fig. 6b–d, the bias when compared to ERA-Interim reanalysis corresponding annual and seasonal means. This suggests broad agreement between the model and reanalysis but with some issues at the height of the tropopause. The position and strength of the polar jet streams are similar but with some differences in the eastward wind speed. The DJF and JJA plots indicate that the strength of these biases change between each hemisphere. The JJA wind speeds around Antarctica have a much larger bias than in DJF.

|
The annual zonal mean RMSE error for the CABLE ensemble is close to that of the ACCESS 1.0 AMIP CMIP5 realisation, 2.52 compared to 2.30 m/s, and smaller than for ACCESS 1.3 (3.04 m/s).
4 Australian regional features
In this section we evaluate ACCESS-AM2 AMIP simulations of temperature and precipitation over the Australian region and the teleconnections to regional drivers of climate variability, ENSO, IOD and SAM.
4.1 Australian surface air temperature and precipitation patterns
The modelled near-SAT results for the CABLE ensemble, annual, DJF and JJA seasonal biases compared to AWAP observations (Jones et al. 2009) for the long-term average over the period 1979–2014 are presented in Fig. 7a–d. The high-resolution AWAP data was area-averaged to the resolution of the UM in order to derive the model–observation differences. Table 2 presents the RMSE values from the two ensemble means. For comparison, results for the older ACCESS models from the CMIP5 AMIP experiments are also included in Table 2. These figures show reduced RMSE values for the newer ACCESS-CM2 model (although not a direct comparison for matching periods and a crosscheck for the AM2 results, 1979–2008, reveal only very small changes).

|

|
Similarly, for Australian land-only precipitation (Fig. 7e–h), the local precipitation RMSE values (Table 2) are reduced for the annual and JJA values compared to the corresponding global values. The DJF errors are larger than for annual and JJA. The seasonal precipitation bias maps reveal that larger errors generally occur around the northern and north-eastern coastal areas, with the Austral summer precipitation having a wet bias in the New South Wales region.
Both temperature and precipitation point to high temperature/low precipitation in the Mt Kosciuszko region, perhaps indicative of a topographical and model resolution problem, i.e. the model does not have sufficient horizontal resolution to capture the topography of the mountain range and therefore underestimates the height of mountain peaks and overestimates their temperature. Maps of Australian mean precipitation and temperature available from the Bureau of Meteorology2 as well as the AWAP data plotted at the model resolution have lower temperature and higher precipitation at this location. The model surface height is 500 m whereas this region has a range of mountains, five of which have peaks over 2100 m above sea level.
Time series for Australian SAT and precipitation are included in Fig. 8. Simulated annual means for minimum, mean and maximum temperatures for each ensemble mean are shown along with corresponding AWAP observations and the correlations between them. Individual realisations for ACCESS-AM2 are included to indicate the range of internal variability.

|
The correlations are noticeably weaker than the global case noted previously for mean temperature and precipitation because of the larger internal variability at regional scales. The 65°N–65°S land-only temperature correlations are 0.97 and 0.96 for the CABLE and JULES ensembles respectively, but 0.44 and 0.62 for the Australian land-only domain. Similarly, for precipitation, the 65°N–65°S land-only precipitation correlations are 0.84 and 0.85 respectively for the CABLE and JULES ensembles, but 0.39 and 0.49 across the Australian region. The influence of La Niña events on precipitation is evident, with periods of observed higher precipitation (Fig. 8d) corresponding to negative values in the NINO3.4 index shown in Fig. 8e. However, this alignment is not as clear for observed temperature and is more variable for simulated temperature and precipitation (see also Section 4.2).
4.2 Australian teleconnections
Two of the important modes of natural variability that affect Australia’s climate are ENSO and IOD (Risbey et al. 2009; Cai et al. 2011). Here we show the ability of the ACCESS-AM2 model to simulate ENSO and IOD correlations with Australian precipitation that are similar to those seen in observations.
We utilise indices from ESRL NOAA: a NINO3.4 index3 and an IOD index.4 As we are using SST-forced simulations, the ENSO and IOD signals are effectively prescribed and, hence, the correlation with the model precipitation results from the model’s ability to represent the teleconnection evident in observations.
Figs 9 and 10 illustrate the results for correlations between NINO3.4 and IOD indices respectively for GPCP precipitation and model-simulated precipitation in the Australian region. The pattern correlations for the observations are shown for JJA and SON seasons (1979–2014), then for each of the CABLE realisations, then ending with the CABLE ensemble mean case. The individual realisations are included to indicate the range of variations across Australia; the strong correlation patterns across the Indonesian region are similar but the correlations are weaker than in the observations for continental Australia.

|

|
The ENSO result (Fig. 9) shows the strong teleconnection across the Indonesian region, extending further in SON than in JJA. The model results capture the main features of the correlation, but with more varied patterns over the Australian continent. However, it fails to capture other features such as the large-scale negative correlation of rainfall with NINO3.4 over eastern Australia in SON and the negative correlation of rainfall with the IOD index over southern Australia in JJA. These are important teleconnections driving Australian rainfall variability. Interestingly, the pattern for the ensemble mean reproduces the observed pattern more closely than each of the individual realisations, suggesting the need for ensembles when modelling scenarios of future climate change.
The IOD pattern correlations (Fig. 10) have a similar but weaker structure to that of the ENSO patterns. The IOD has a negative impact on Australian winter precipitation as shown in Fig. 10a. However, this pattern is not as clearly defined in the model results. The observed Australian SON pattern (Fig. 10b) is simulated fairly well by the ensemble mean (Fig. 10j).
The ACCESS-AM2c model is able to capture the main features of ENSO and IOD teleconnection to Australian precipitation, although multiple realisations are needed to make the signal clear; single realisations are unlikely to be reliable for projecting future changes (although using a longer period, e.g. 50 years rather than just 1979–2014, may help to more adequately sample natural variability). It is important to realise that the observed correlation will have some uncertainty due to natural variability as well as variability arising from climate modes such as ENSO, IOD and SAM, which may be as large as the differences in the correlations between the individual simulations from the model ensemble.
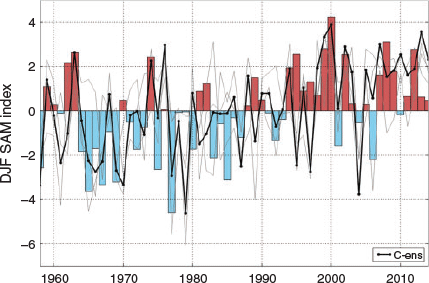
Another important influence on Australian climate is the SAM or Antarctic Oscillation (Karoly 1990; Hendon et al. 2007). Fogt et al. (2009) notes an upward trend in SAM, with the largest forced response in DJF. This is when stratospheric ozone depletion is the main contributor to the observed trend. Observations are based on data available from Marshall (2003). The SAM index is calculated (Gong and Wang 1999) as the difference between the normalised zonal MSLP at 40°S and 65°S, with normalisation based on the mean and standard deviation for 1971–2000.
The model simulations reveal both internal variability and positive trends similar to that found in observations as illustrated in Fig. 11. The CABLE ensemble model trend of 0.50 hPa per decade is similar to the observed trend of 0.45 hPa per decade. Correlations between the SAM index and the model results are 0.35, 0.43 and 0.31 across the three realisations but 0.50 for the ensemble mean, indicating how the ensemble mean can align more closely with the observations than individual realisations. A trend towards a more positive SAM indicates a poleward shift of midlatitude westerly winds, tending to produce less winter and spring precipitation across southeast and southwest Australia (Hendon et al. 2007).
|
5 Concluding remarks
The model results discussed here provide an overview of some of the main features of the earth’s climate system as simulated by the current version of the ACCESS-AM2 climate model configured as an AMIP run with CMIP6 historical forcings. Model results have been compared to observations and reanalysis data at the global scale and for the Australian region.
The ACCESS-AM2 AMIP simulation of annual global-mean SAT matches well to historical observations, and the general pattern of temperatures aligns reasonably well. Given the model is forced by SSTs this is not surprising. However, evaluation of the land-only SAT and precipitation demonstrates good performance as well. At the global scale there are biases at higher latitudes including Antarctica where there are also biases with MSLP, although this is a region which has uncertainties as far as observations and reanalyses are concerned; further analysis is needed to address this aspect of the model. The mean rate of precipitation is overestimated in the model, with particular problems around the equatorial region; most of this is a result of excessive precipitation over the ocean since global-mean precipitation over land compares well to observations. Precipitation amount and distribution are a known problem with the UM and is seen in both coupled and AMIP simulations (Williams et al. 2018). The new ACCESS-AM2 model shows reduced RMSE values compared to the previous model versions, ACCESS 1.0 and ACCESS 1.3, suggesting that the model developments, including reduction in errors for surface heat flux components and improvements in the simulation of clouds (Williams et al. 2018), have improved its performance at least for these global-scale climate features of SAT and precipitation.
Over Australia, ACCESS-AM2 simulates the pattern of annual mean surface air-temperatures similar to historical observations, with reduced RMSE values compared to the older ACCESS models (Table 2). There are also some seasonal biases, with DJF being warmer and JJA cooler than in the observations (Fig. 7c and d) along with the larger RMSE values. Mean precipitation patterns are also simulated closely (Fig. 7f–h), although for the precipitation amounts the year-to-year variability is such that the correlation to observed precipitation is less than that for temperature. Precipitation correlations to ENSO and IOD exhibit generally similar patterns to those found in observations, with the ensemble mean producing better results than single realisations. For SAM, the ACCESS-AM2 model is able to generate an index similar to that observed for DJF in terms of both variability and trend; correlation to Australian rainfall has been left for further analysis.
The ACCESS-AM2 simulations with the CABLE and JULES land-surface models perform similarly for these basic climate variables. Further work is needed to investigate other climate features such as surface radiation and albedo, soil moisture and runoff. The diurnal temperature range is another feature to consider as ACCESS 1.3b with CABLE failed to capture this range adequately (Lorenz et al. 2014). The weaker correlations seen in minimum, maximum and mean temperatures and precipitation across Australia for CABLE (Section 4.1) also point to a need for further analysis.
Further model evaluation work is planned, investigating additional atmospheric features such as the Hadley and Walker cells. Also, of interest is an examination of the dynamics and thermodynamics that give rise to the Australian climate and regional teleconnections and how these relate to deficiencies in the model results, given that the experiments are driven by historical forcings, including SSTs, SICs, GHGs and aerosols.
Additional information
The ACCESS raw model outputs are stored at the Australian NCI National Facility. For more information and/or data access please contact the authors.
Conflicts of interest
The authors declare no conflicts of interest.
Acknowledgments
This work was supported through funding from the Earth Systems and Climate Change Hub of the Australian Government’s National Environmental Science Program. It also draws upon the allied research efforts of the host institutions and the ARC Centre of Excellence for Climate Extremes upon which this work is built. The computation work was carried out at the NCI National Facility at the Australian National University. The UM software is used under the auspices of a partnership agreement between the UK Met Office, CSIRO and the Australian Bureau of Meteorology. Thanks also to Rachel Law and Ian Watterson for their comments and advice. We also appreciate the detailed constructive comments and suggestions from two reviewers (one named, one anonymous).
References
Adler, R. F., Gu, G., Sapiano, M., Wang, J.-J., and Huffman, G. J. (2017). Global Precipitation: Means, Variations and Trends During the Satellite Era (1979–2014). Surv. Geophys. 38, 679–699.| Global Precipitation: Means, Variations and Trends During the Satellite Era (1979–2014).Crossref | GoogleScholarGoogle Scholar |
Best, M. J., Pryor, M., Clark, D. B., Rooney, G. G., Essery, R. L. H., Ménard, C. B., Edwards, J. M., Hendry, M. A., Porson, A., Gedney, N., Mercado, L. M., Sitch, S., Blyth, E., Boucher, O., Cox, P. M., Grimmond, C. S. B., and Harding, R. J. (2011). The Joint UK Land Environment Simulator (JULES), model description – Part 1: Energy and water fluxes. Geosci. Model Dev. 4, 677–699.
| The Joint UK Land Environment Simulator (JULES), model description – Part 1: Energy and water fluxes.Crossref | GoogleScholarGoogle Scholar |
Bi, D., Dix, M., Marsland, S., O’Farrell, S., Sullivan, A., Bodman, R., Law, R., Harman, I., Srbinovsky, J., Rashid, H., Dobrohotoff, P., Mackallah, C., Woodhouse, M., and Fiedler, R. (2020). Configuration and spinup of ACCESS-CM2, the new generation Australian Community Climate and Earth System Simulator Coupled Model. J. South. Hemisph. Earth Sys. Sci. , .
| Configuration and spinup of ACCESS-CM2, the new generation Australian Community Climate and Earth System Simulator Coupled Model.Crossref | GoogleScholarGoogle Scholar |
Cai, W., Rensch, P. V., Cowan, T., and Hendon, H. H. (2011). Teleconnection Pathways of ENSO and the IOD and the Mechanisms for Impacts on Australian Rainfall. J. Clim. 24, 3910–3923.
| Teleconnection Pathways of ENSO and the IOD and the Mechanisms for Impacts on Australian Rainfall.Crossref | GoogleScholarGoogle Scholar |
Clark, D. B., Mercado, L. M., Sitch, S., Jones, C. D., Gedney, N., Best, M. J., Pryor, M., Rooney, G. G., Essery, R. L. H., Blyth, E., Boucher, O., Harding, R. J., Huntingford, C., and Cox, P. M. (2011). The Joint UK Land Environment Simulator (JULES), model description – Part 2: Carbon fluxes and vegetation dynamics. Geosci. Model Dev. 4, 701–722.
| The Joint UK Land Environment Simulator (JULES), model description – Part 2: Carbon fluxes and vegetation dynamics.Crossref | GoogleScholarGoogle Scholar |
Collins, W. J., Bellouin, N., Doutriaux-Boucher, M., Gedney, N., Halloran, P., Hinton, T., Hughes, J., Jones, C. D., Joshi, M., Liddicoat, S., Martin, G., O’Connor, F., Rae, J., Senior, C., Sitch, S., Totterdell, I., Wiltshire, A., and Woodward, S. (2011). Development and evaluation of an Earth-System model – HadGEM2. Geosci. Model Dev. 4, 1051–1075.
| Development and evaluation of an Earth-System model – HadGEM2.Crossref | GoogleScholarGoogle Scholar |
Dee, D. P., Uppala, S. M., Simmons, A. J., Berrisford, P., Poli, P., Kobayashi, S., Andrae, U., Balmaseda, M. A., Balsamo, G., Bauer, P., Bechtold, P., Beljaars, A. C. M., van de Berg, L., Bidlot, J., Bormann, N., Delsol, C., Dragani, R., Fuentes, M., Geer, A. J., Haimberger, L., Healy, S. B., Hersbach, H., Hólm, E. V., Isaksen, L., Kållberg, P., Köhler, M., Matricardi, M., McNally, A. P., Monge-Sanz, B. M., Morcrette, J. J., Park, B. K., Peubey, C., de Rosnay, P., Tavolato, C., Thépaut, J. N., and Vitart, F. (2011). The ERA-Interim reanalysis: configuration and performance of the data assimilation system. Quart. J. Roy. Meteorol. Soc. 137, 553–597.
| The ERA-Interim reanalysis: configuration and performance of the data assimilation system.Crossref | GoogleScholarGoogle Scholar |
Durack, P., Taylor, K. E. and others. (2019). CMIP6 Forcing Datasets Summary. (v6.2.37). Available online: http://goo.gl/r8up31 [Accessed 25 November 2019].
Eyring, V., Bony, S., Meehl, G. A., Senior, C. A., Stevens, B., Stouffer, R. J., and Taylor, K. E. (2016). Overview of the Coupled Model Intercomparison Project Phase 6 (CMIP6) experimental design and organization. Geosci. Model Dev. 9, 1937–1958.
| Overview of the Coupled Model Intercomparison Project Phase 6 (CMIP6) experimental design and organization.Crossref | GoogleScholarGoogle Scholar |
Fogt, R. L., Perlwitz, J., Monaghan, A. J., Bromwich, D. H., Jones, J. M., and Marshall, G. J. (2009). Historical SAM Variability. Part II: Twentieth-Century Variability and Trends from Reconstructions, Observations, and the IPCC AR4 Models. J. Climate 22, 5346–5365.
| Historical SAM Variability. Part II: Twentieth-Century Variability and Trends from Reconstructions, Observations, and the IPCC AR4 Models.Crossref | GoogleScholarGoogle Scholar |
Gong, D., and Wang, S. (1999). Definition of Antarctic Oscillation index. Geophys. Res. Lett. 26, 459–462.
| Definition of Antarctic Oscillation index.Crossref | GoogleScholarGoogle Scholar |
Harman, I. N., Bodman, R. W., Dix, M. and Srbinovsky, J. (2019). CABLE within ACCESS-CM2. CSIRO client report.
Hendon, H. H., Thompson, D. W. J., and Wheeler, M. C. (2007). Australian Rainfall and Surface Temperature Variations Associated with the Southern Hemisphere Annular Mode. J. Climate 20, 2452–2467.
| Australian Rainfall and Surface Temperature Variations Associated with the Southern Hemisphere Annular Mode.Crossref | GoogleScholarGoogle Scholar |
Jin, L., Zhang, H., Moise, A., Martin, G., Milton, S., and Rodriguez, J. (2019). Australia-Asian monsoon in two versions of the UK Met Office Unified Model and their impacts on tropical–extratropical teleconnections. Clim. Dyn. 53, 4717–4741.
| Australia-Asian monsoon in two versions of the UK Met Office Unified Model and their impacts on tropical–extratropical teleconnections.Crossref | GoogleScholarGoogle Scholar |
Jones, D. A., Wang, W., and Fawcett, R. (2009). High-quality spatial climate data-sets for Australia. Aust. Meteorol. Oceanogr. J. 58, 233–248.
| High-quality spatial climate data-sets for Australia.Crossref | GoogleScholarGoogle Scholar |
Karoly, D. J. (1990). The role of transient eddies in low-frequency zonal variations of the Southern Hemisphere circulation. Tellus A 42, 41–50.
| The role of transient eddies in low-frequency zonal variations of the Southern Hemisphere circulation.Crossref | GoogleScholarGoogle Scholar |
Kowalczyk, E. A., Stevens, L., Law, R. M., Dix, M., Wang, Y. P., Harman, I. N., Haynes, K., Srbinovsky, J., Pak, B., and Ziehn, T. (2013). The land surface model component of ACCESS: description and impact on the simulated climatology. Aust. Meteorol. Oceanogr. J. 63, 65–82.
| The land surface model component of ACCESS: description and impact on the simulated climatology.Crossref | GoogleScholarGoogle Scholar |
Lorenz, R., Pitman, A. J., Donat, M. G., Hirsch, A. L., Kala, J., Kowalczyk, E. A., Law, R. M., and Srbinovsky, J. (2014). Representation of climate extreme indices in the ACCESS1.3b coupled atmosphere–land surface model. Geosci. Model Dev. 7, 545–567.
| Representation of climate extreme indices in the ACCESS1.3b coupled atmosphere–land surface model.Crossref | GoogleScholarGoogle Scholar |
Mann, G. W., Carslaw, K. S., Ridley, D. A., Spracklen, D. V., Pringle, K. J., Merikanto, J., Korhonen, H., Schwarz, J. P., Lee, L. A., Manktelow, P. T., Woodhouse, M. T., Schmidt, A., Breider, T. J., Emmerson, K. M., Reddington, C. L., Chipperfield, M. P., and Pickering, S. J. (2012). Intercomparison of modal and sectional aerosol microphysics representations within the same 3-D global chemical transport model. Atmos. Chem. Phys. 12, 4449–4476.
| Intercomparison of modal and sectional aerosol microphysics representations within the same 3-D global chemical transport model.Crossref | GoogleScholarGoogle Scholar |
Mann, G. W., Carslaw, K. S., Spracklen, D. V., Ridley, D. A., Manktelow, P. T., Chipperfield, M. P., Pickering, S. J., and Johnson, C. E. (2010). Description and evaluation of GLOMAP-mode: a modal global aerosol microphysics model for the UKCA composition-climate model. Geosci. Model Dev. 3, 519–551.
| Description and evaluation of GLOMAP-mode: a modal global aerosol microphysics model for the UKCA composition-climate model.Crossref | GoogleScholarGoogle Scholar |
Marshall, G. (2003). Trends in the Southern Annular Mode from Observations and Reanalyses. J. Climate 16, 4134–4143.
| Trends in the Southern Annular Mode from Observations and Reanalyses.Crossref | GoogleScholarGoogle Scholar |
Morice, C. P., Kennedy, J. J., Rayner, N. A., and Jones, P. D. (2012). Quantifying uncertainties in global and regional temperature change using an ensemble of observational estimates: The HadCRUT4 data set. J. Geophys. Res. Atmos. 117, D08101.
| Quantifying uncertainties in global and regional temperature change using an ensemble of observational estimates: The HadCRUT4 data set.Crossref | GoogleScholarGoogle Scholar |
Osborn, T. J., and Jones, P. D. (2014). The CRUTEM4 land-surface air temperature data set: construction, previous versions and dissemination via Google Earth. Earth Syst. Sci. Data 6, 61–68.
| The CRUTEM4 land-surface air temperature data set: construction, previous versions and dissemination via Google Earth.Crossref | GoogleScholarGoogle Scholar |
Rashid, H., Hirst, A., and Dix, M. (2013). Atmospheric circulation features in the ACCESS model simulations for CMIP5: historical simulation and future projections. Aust. Meteorol. Oceanogr. J. 63, 145–160.
| Atmospheric circulation features in the ACCESS model simulations for CMIP5: historical simulation and future projections.Crossref | GoogleScholarGoogle Scholar |
Risbey, J. S., Pook, M. J., McIntosh, P. C., Wheeler, M. C., and Hendon, H. H. (2009). On the Remote Drivers of Rainfall Variability in Australia. Mon. Wea. Rev. 137, 3233–3253.
| On the Remote Drivers of Rainfall Variability in Australia.Crossref | GoogleScholarGoogle Scholar |
Stevens, B., Fiedler, S., Kinne, S., Peters, K., Rast, S., Müsse, J., Smith, S. J., and Mauritsen, T. (2017). MACv2-SP: a parameterization of anthropogenic aerosol optical properties and an associated Twomey effect for use in CMIP6. Geosci. Model Dev. 10, 433–452.
| MACv2-SP: a parameterization of anthropogenic aerosol optical properties and an associated Twomey effect for use in CMIP6.Crossref | GoogleScholarGoogle Scholar |
Walters, D., Baran, A. J., Boutle, I., Brooks, M., Earnshaw, P., Edwards, J., Furtado, K., Hill, P., Lock, A., Manners, J., Morcrette, C., Mulcahy, J., Sanchez, C., Smith, C., Stratton, R., Tennant, W., Tomassini, L., Van Weverberg, K., Vosper, S., Willett, M., Browse, J., Bushell, A., Carslaw, K., Dalvi, M., Essery, R., Gedney, N., Hardiman, S., Johnson, B., Johnson, C., Jones, A., Jones, C., Mann, G., Milton, S., Rumbold, H., Sellar, A., Ujiie, M., Whitall, M., Williams, K., and Zerroukat, M. (2019). The Met Office Unified Model Global Atmosphere 7.0/7.1 and JULES Global Land 7.0 configurations. Geosci. Model Dev. 12, 1909–1963.
| The Met Office Unified Model Global Atmosphere 7.0/7.1 and JULES Global Land 7.0 configurations.Crossref | GoogleScholarGoogle Scholar |
Williams, K. D., Copsey, D., Blockley, E. W., Bodas-Salcedo, A., Calvert, D., Comer, R., Davis, P., Graham, T., Hewitt, H. T., Hill, R., Hyder, P., Ineson, S., Johns, T. C., Keen, A. B., Lee, R. W., Megann, A., Milton, S. F., Rae, J. G. L., Roberts, M. J., Scaife, A. A., Schiemann, R., Storkey, D., Thorpe, L., Watterson, I. G., Walters, D. N., West, A., Wood, R. A., Woollings, T., and Xavier, P. K. (2018). The Met Office Global Coupled Model 3.0 and 3.1 (GC3.0 and GC3.1) Configurations. J. Adv. Model. Earth Syst. 10, 357–380.
| The Met Office Global Coupled Model 3.0 and 3.1 (GC3.0 and GC3.1) Configurations.Crossref | GoogleScholarGoogle Scholar |
Xie, P., and Arkin, P. A. (1997). Global Precipitation: A 17-Year Monthly Analysis Based on Gauge Observations, Satellite Estimates, and Numerical Model Outputs. Bull. Amer. Meteorol. Soc. 78, 2539–2558.
| Global Precipitation: A 17-Year Monthly Analysis Based on Gauge Observations, Satellite Estimates, and Numerical Model Outputs.Crossref | GoogleScholarGoogle Scholar |
1 https://esgf-node.llnl.gov/projects/input4mips/
2 http://www.bom.gov.au/climate/change/index.shtml#tabs=Tracker&tracker=trend-maps (accessed 09/12/2019).
3 http://www.esrl.noaa.gov/psd/gcos_wgsp/Timeseries/Nino34/
4 https://www.esrl.noaa.gov/psd/gcos_wgsp/Timeseries/DMI/