Response time of temperature measurements at automatic weather stations in Australia
G. P. Ayers A B and J. O. Warne AA Bureau of Meteorology, 700 Collins Street, Docklands, Melbourne, Vic. 3001, Australia.
B Corresponding author. Email: greg.ayers@bom.gov.au
Journal of Southern Hemisphere Earth Systems Science 70(1) 160-165 https://doi.org/10.1071/ES19032
Submitted: 20 July 2019 Accepted: 3 March 2020 Published: 5 October 2020
Journal Compilation © BoM 2020 Open Access CC BY-NC-ND
Abstract
Bureau of Meteorology automatic weather stations (AWS) are employed to record 1-min air temperature data in accord with World Meteorological Organization recommendations. These 1-min values are logged as the value measured for the last second in each minute. The Bureau explains that this is appropriate because the inherent measurement system time constant means the 1-s data are not instantaneous, but are an average smoothed over the previous 40–80 s. To test this proposition in the field air temperature data were measured at 1-Hz at two Bureau AWS sites between April and June 2018. The frequency distribution of the differences between each 1-s value and the 60-s average centred on that value provided information on the overall measurement system response time constant. Expressed in terms of an e-folding measurement system response time, the data from the two measurement systems studied yielded response times in the range 50–150 s, largely consistent with the Bureau’s explanation.
Keywords: automatic weather station, AWS, field air temperature, resistance thermometer, response time, temperature measurement, WMO, World Meteorological Organization.
1 Introduction
Recently, temperature measurements at the Bureau of Meteorology’s automatic weather stations (AWS) have been criticised publicly as not following World Meteorological Organization (WMO) guidelines that recommend 1-min data as the basic measurement, because it is 1-s data that are logged. The Bureau records the measurement in the last second of each minute as its 1-min value. It considers this appropriate, arguing that AWS temperature systems have a response time such that each measurement is not a spot measurement, but an average smoothed over the previous 40–80 s, consistent with the WMO guidelines (BoM 2017).
To test whether the 1-s air temperature data (air T) are averaged over a longer period by slow measurement system response time Ayers (2019) compared the Bureau’s 1-min data (recorded as the value in the last second of each minute) with a value averaged from five 1-s measurements in the minute, centred on that second. This was possible since the Bureau records not only the 1-s value for the last second in each minute, but also the highest and lowest 1-s values in each minute, Tmax and Tmin. For any minute, i, and adopting the Bureau’s labelling of the seconds in each minute from 0 to 59, the comparison made by Ayers (2019) was between T59 and the 5-value average incorporating that value and the four Tmax and Tmin values recorded in the minute either side of that value. That methodology is depicted schematically in Fig. 1, reproduced from Ayers (2019).

|
Ayers (2019) concluded that the frequency distribution of the difference between the 1-s value at the end of each minute and the 5-point average centred on that second was consistent with the Bureau’s stated position that the 1-s data were already smoothed appropriately over the prior 40–80 s. Ayers (2019) further suggested that any additional averaging would likely be inappropriate as it might lead to over-damped 1-min values. However, in the absence of measured 1 Hz temperature data, explicit confirmation of these conclusions based on just the 5-point average rather than a full 60-point (60 s) 1-min average was not possible.
This work describes an experiment carried out at two AWS sites, Darwin (NT) and Noarlunga (SA), to provide 1 Hz air temperature data. The purpose was to determine the effects of measurement system response time on smoothing of 1-s data under field conditions, based on measurements every second (60 1-s data points each minute). Properties of the measured 1 Hz datasets were analysed by comparison with the properties of a synthetic dataset of 1-s values smoothed with e-folding times varied from 1 to 180 s.
The specific objective was to estimate measurement system response time, expressed as e-folding time, with this response time being the overall response time for the AWS measurement system (Stevenson Screen plus resistance thermometer).
2 Sites
2.1 Darwin
The Darwin site is located at latitude –12.4239, longitude 130.8925 at a Station Height of 30.4 m. A standard Bureau AWS at the site has air temperature measured by a Rosemount Model ST2041 resistance thermometer mounted in a 60 L Stevenson screen. The AWS is located within the boundary of the observations enclosure, an open grassed area.
2.2 Noarlunga
The Noarlunga site is located at latitude –35.1586, longitude 138.5057 at a Station Height of 55 m. As at Darwin the air temperature measurement is made with a standard Bureau AWS using a Rosemount Model ST2401 resistance thermometer mounted in a 60 L Stevenson screen. The AWS is located within the boundary of the observations enclosure, an open area of natural grass with some small shrubs 20 m to the west and east.
3 Results and analysis
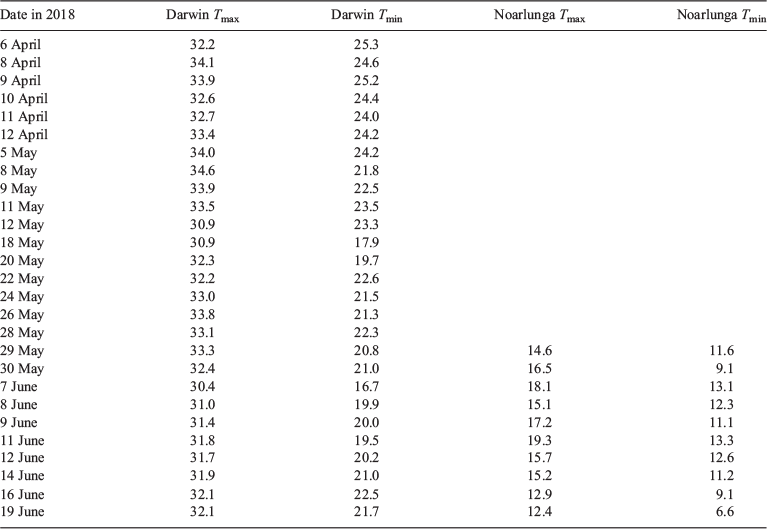
Table 1 lists the 27 days at Darwin and 10 days at Noarlunga in 2018 for which 1 Hz data were recorded, along with the highest daily Tmin and Tmax values recorded in the 1-minuted data.

|
The 1 Hz data collected from Darwin and Noarlunga were analysed by comparison with a synthetic dataset of 1 Hz values produced by Ayers (2019). That dataset mimicked the statistical properties of instantaneous air temperature data measured using fast response sensors by Costa Frola et al. (2014), scaled to approximate the standard deviation of the measured daytime temperature fluctuations in the Australian data analysed (for further details see Ayers 2019).
A randomly selected 1-h period of 3600 s drawn from the synthetic instantaneous data was subjected to two different averaging methods. The first employed smoothing by applying a given e-folding time to the data, varying the time constant used across the range 1–180 s, the second was to take the running mean of 60 data points centred on a point 30 s earlier to provide a 1-min average that would approximate in time the Bureau’s assertion that the measurement system time constants at any point in time smooth the data over the previous 40–80 s.
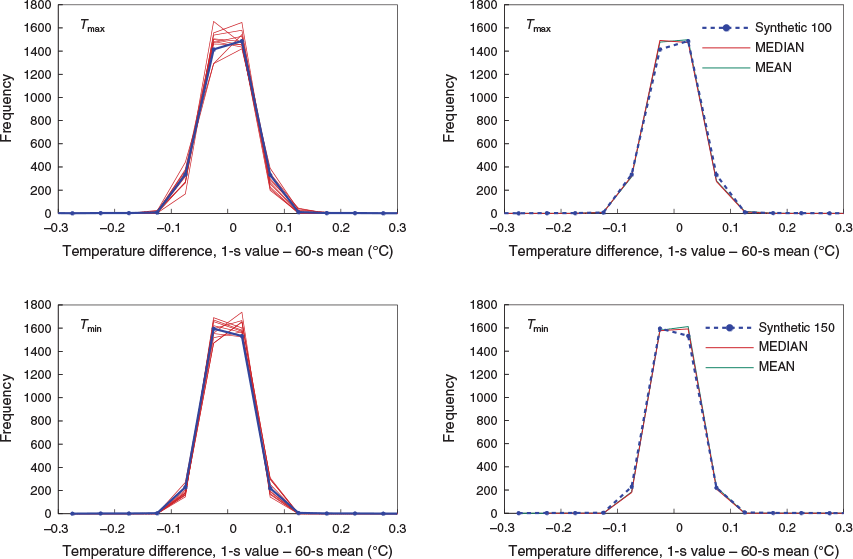
The frequency distributions of the difference between synthetic data subjected to different e-folding times and the 60-s arithmetic mean values for each of the 3600 s in the synthetic hour of data are plotted in Fig. 2 on the same scale as used by Ayers (2019). The most important feature of Fig. 2 is that the difference between the data smoothed by the various e-folding times and the 60-s mean reduces significantly as the e-folding time increases, the distribution narrows. This provides an opportunity to evaluate the smoothing of the 1 Hz data measured under field conditions by comparing the shape of the frequency distribution for the difference between measured 1 Hz data and the 60-s mean of those data with the varying shapes of the synthetic difference frequency curves in Fig. 2.

|
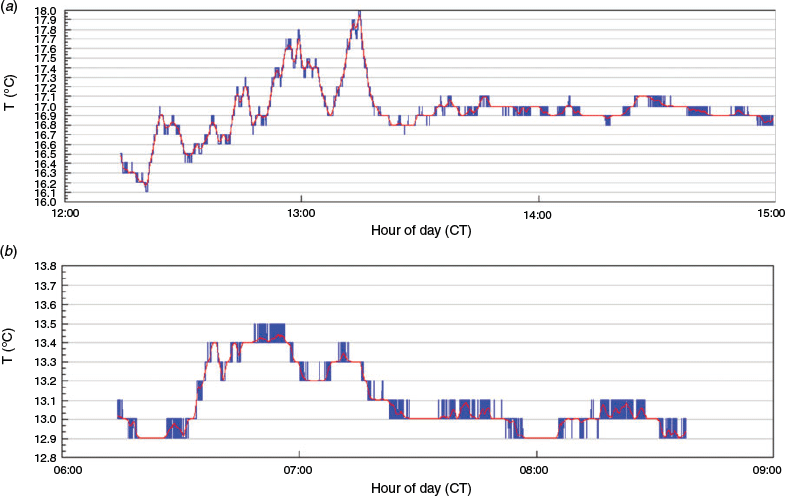
To span the measured daily range of air T, comparisons were made using 1 h of 1-s measured data taken at the times of the daily maximum in Tmax in early afternoon and daily minimum in Tmin early morning the following day. Fig. 3 provides an example of the measured 1-s data from Darwin, Fig. 4 provides an example from Noarlunga.

|

|
Fig. 5 shows the frequency distributions of the difference between the 1 Hz data and the 60-s running mean from each day at Darwin overlaid by the best-fit theoretical distribution (see Fig. 1) (blue line). The estimated system e-folding time in seconds is shown in the right hand panel. Fig. 6 presents the comparable data from Noarlunga.

|

|
There are two notable features of Figs 3 and 4. The first is that, consistent with the observations of Ayers (2019), there is very little difference evident between the measured 1 Hz data and the 60-s running means of those data. This lack of major additional smoothing despite the 60-point average provides a strong indication that the 1 Hz data are already well smoothed in terms of variability at the minute level. The second point is that the small scale variability is larger at the time of Tmax than at the time of Tmin, again consistent with the observation by Ayers (2019) that standard deviation of air T fluctuations was highly correlated with solar irradiance throughout the day, as expected if turbulence in the planetary boundary layer is driven by solar heating that causes small scale convective overturning.
Three initial observations may also be made concerning Figs 5 and 6. The first is that a consistently good fit can be found between the measured differences between the 1 Hz data and 60-s means and best-fit theoretical equivalents. The second is that, as noted regarding Figs 4 and 5, there is a systematic difference between the results for Tmax and Tmin with the estimated measurement system e-folding time doubling at both sites in going from the hour around Tmax to the hour around Tmin. The third point is that there is also a systematic difference apparent between the results from Darwin and those from Noarlunga, with the estimated measurement system e-folding times for both the Tmax and Tmin data being significantly larger for Noarlunga than for the Darwin data.
4 Discussion
The objective of this work was to explore the proposition that 1-s air temperature data measured at Bureau of Meteorology AWSs represent good measurement practice as required by WMO, via measurement system time constants that average the data over the previous 40–80 s, to meet the WMO recommendations for recording 1-min data. Based on statistical analysis of Bureau AWS data recorded for the last second in each minute combined with Tmax and Tmin from the two adjacent minutes Ayers (2019) concluded that this proposition was sound. However an additional test using field data based on explicit measurement of 1 Hz data was recommended to put any conclusion beyond doubt. This work describes the results of that additional test.
Because Ayers (2019) found a strong relationship between the standard deviation of air T fluctuations and solar exposure two sites were chosen for recording of 1 Hz AWS data. The tropical site of Darwin at 12°S has high solar exposure all year in comparison with mid-latitude sites so should well reflect solar-driven variability in air T at short time scales during the day at all times of year. In contrast, the mid-latitude site of Noarlunga at 35°S in winter has significantly less solar exposure and considerably lower air T, so these two sites span a range of environmental and measurement conditions.
Both the Darwin and Noarlunga 1 Hz data sets reproduce the conclusion of Ayers (2019) based on far more limited data (5-point average each minute rather than 60-point average): averaging the 1-s AWS data produces only very minor additional smoothing. The most plausible explanation for this is that the 1-s data are already smoothed at ~1-min timescale so additional smoothing has only minimal effect (see also relevant commentary in WMO 2014, and Bendat and Piersol, 1986). This is consistent with the Bureau’s statement that AWS 1-s data are effectively an average over ~40–80 s.
The overlay of probability distribution functions (pdf) for 1-s data minus 60-s mean data from Darwin (Fig. 5) and Noarlunga (Fig. 6) with the best-fit theoretical pdf provides a more explicit demonstration that the 1-s data reflect smoothing of instantaneous air T data as the Bureau has asserted. The 1-s data in the four of the panels in Figs 5 and 6 closely reproduce the behaviour of the synthetic data smoothed with e-folding times ranging from 50–150 s.
The lower estimated e-folding times for Tmax compared with Tmin at both sites, and the lower estimated e-folding times for both Tmin and Tmax at Darwin compared with Tmin and Tmax at Noarlunga are consistent with the conclusion reached by Ayers (2019) that fluctuations in air temperature scale with solar-driven turbulence in the planetary boundary layer, which is higher in daytime than night-time and higher at Darwin than at Noarlunga. Clearly all air temperature measurement systems will experience the same significant day-night, winter-summer differences in solar-driven turbulent mixing. So no matter how 1-min averages are produced, irrespective of the different approaches that vary by country while still meeting WMO requirements (as noted by Ayers 2019), the data themselves will always reflect these systematic effects of turbulence on the 1-min values that are recorded.
5 Summary and conclusions
The study reported here independently confirms the conclusion reached by Ayers (2019) that the measurement of air temperature by the Bureau’s AWS stations is robust and consistent with WMO requirements. The Bureau’s position that ‘each one second temperature value is not an instantaneous measurement of the air temperature but an average of the previous 40 to 80 seconds’ (BoM 2017) is supported here based on 1 Hz air temperature data measured at Darwin and Noarlunga. Hence, it is appropriate for the Bureau to record the value at the last second of each minute as satisfying WMO sampling requirements for 1-min data.
Conflicts of interest
The author is Editor in Chief of this journal. He was blinded from the review process and had no editorial involvement with this paper, which was handled independently by other members of the Editorial Board. There are no other conflicts.
Acknowledgements
The helpful commentary from two anonymous reviewers is gratefully acknowledged. This research did not receive any specific funding.
References
Ayers, G. P. (2019). A comment on temperature measurement at automatic weather stations in Australia. J. South. Hemisph. Earth Syst. Sci. 69, 172–182.| A comment on temperature measurement at automatic weather stations in Australia.Crossref | GoogleScholarGoogle Scholar |
Bendat, J. and Piersol, A. (1986). Random data: analysis and measurement procedures’. 2nd edn. (John Wiley: New York).
BoM (2017). FAST FACTS: How does the Bureau measure temperature? Available at http://www.bom.gov.au/inside/AWS_Review_Fast_Facts.pdf
Costa Frola, E. C., Mazzino, A., Cassola, F., Mortarini, L., and Ferrero, E. (2014). An experimental study of the statistics of temperature fluctuations in the atmospheric boundary layer. Bound.-layer Met. 150, 91.
| An experimental study of the statistics of temperature fluctuations in the atmospheric boundary layer.Crossref | GoogleScholarGoogle Scholar |
WMO (2014). Guide to meteorological instruments and methods of observation (WMO-No. 8). (World Meteorological Organisation: Geneva, Switzerland).

