The Antarctic ozone hole during 2014
Paul B. Krummel A I , Andrew R. Klekociuk B C , Matthew B. Tully D , H. Peter Gies E , Simon P. Alexander B C , Paul J. Fraser A , Stuart I. Henderson E , Robyn Schofield F G , Jonathan D. Shanklin H and Kane A. Stone F GA Climate Science Centre, CSIRO Oceans and Atmosphere, Private Bag #1, Aspendale, Vic. 3195, Australia.
B Antarctica and the Global System, Australian Antarctic Division, Kingston, ACT, Australia.
C Antarctic Climate and Ecosystems Cooperative Research Centre, Hobart, Tas., Australia.
D Bureau of Meteorology, Melbourne, Vic., Australia.
E Australian Radiation Protection and Nuclear Safety Agency, Melbourne, Vic., Australia.
F School of Earth Sciences, University of Melbourne, Melbourne, Vic., Australia.
G ARC Centre of Excellence for Climate System Science, University of New South Wales, Sydney, NSW, Australia.
H British Antarctic Survey, Cambridge, United Kingdom.
I Corresponding author. Email: Paul.Krummel@csiro.au
Journal of Southern Hemisphere Earth Systems Science 69(1) 1-15 https://doi.org/10.1071/ES19023
Submitted: 25 January 2018 Accepted: 29 May 2019 Published: 11 June 2020
Journal Compilation © BoM 2019 Open Access CC BY-NC-ND
Abstract
We review the 2014 Antarctic ozone hole, making use of a variety of ground-based and space-based measurements of ozone and ultra-violet radiation, supplemented by meteorological reanalyses. Although the polar vortex was relatively stable in 2014 and persisted some weeks longer into November than was the case in 2012 or 2013, the vortex temperature was close to the long-term mean in September and October with modest warming events occurring in both months, preventing severe depletion from taking place. Of the seven metrics reported here, all were close to their respective median values of the 1979–2014 record, being ranked between 16th and 21st of the 35 years for which adequate satellite observations exist.
1 Introduction
As reported in Dameris and Godin-Beekmann et al. (2014), the Antarctic ozone hole has continued to appear each spring since its first detectable appearance in 1979. Due to the still highly elevated levels of ozone-depleting substances (ODS) and their slow rate of decrease in the atmosphere, the severity of the ozone hole from year to year is currently determined primarily by interannual variations in temperature and dynamics. Nonetheless, Dameris and Godin-Beekmann et al. (2014) were able to estimate an underlying increase in Antarctic ozone from 2000 to 2014 of between 10 and 25 DU, while noting that the variability had been somewhat greater in the last decade than had been observed in the 1990s.
It has also been increasingly realised that Antarctic ozone depletion is very likely to have been the dominant driver of the observed changes over recent decades in the southern hemisphere tropospheric circulation in summer, including an increase in the strength of the Southern Annular Mode (SAM), an expansion of the Hadley Cell and a poleward shift of the mid-latitude maximum of precipitation (Arblaster and Gillett et al. 2014).
In this paper, we provide a description of the overall level of Antarctic ozone depletion in 2014 and the relationship with prevailing meteorological conditions using a range of Australian data and analyses including measurements and analyses by the Commonwealth Scientific and Industrial Research Organisation (CSIRO) Oceans and Atmosphere – Climate Science Centre, ozone measurements obtained by the Australian Antarctic Division (AAD) and the Bureau of Meteorology (BoM), and Antarctic ultraviolet measurements from the Australian Radiation Protection and Nuclear Safety Agency (ARPANSA) biometer network. Other data from satellite missions and ground-based instruments are also presented. This work complements analyses of previous Antarctic ozone holes reported by Tully et al. (2008, 2011) and Klekociuk et al. (2011, 2014a, 2014b, 2015), and other analyses of Antarctic atmospheric conditions and ozone depletion during 2014 provided by the World Meteorological Organisation Antarctic Ozone Bulletins (http://www.wmo.int/pages/prog/arep/gaw/ozone/index.html, accessed 30 April 2020), upper air summaries of the National Climate Data Center (NCDC; http://www.ncdc.noaa.gov/sotc/upper-air, accessed 30 April 2020) and by Blunden and Arndt (2015; http://www.ncdc.noaa.gov/bams-state-of-the-climate, accessed 30 April 2020).
2 Total column ozone measurements
2.1 Ozone hole metric summary and rankings
As in previous reports in this series, we use total column ozone measurements from satellite instruments to obtain metrics of the Antarctic ozone hole (see Klekociuk et al. (2015) for details). Here we use data processed with the version 8.5 Total Ozone Mapping Spectrometer (TOMS) algorithm from the TOMS series of satellite instruments, the Ozone Monitoring Instrument (OMI) on the Aura satellite and the Ozone Mapping Profiler Suite (OMPS) on the Suomi National Polar-orbiting Partnership satellite.
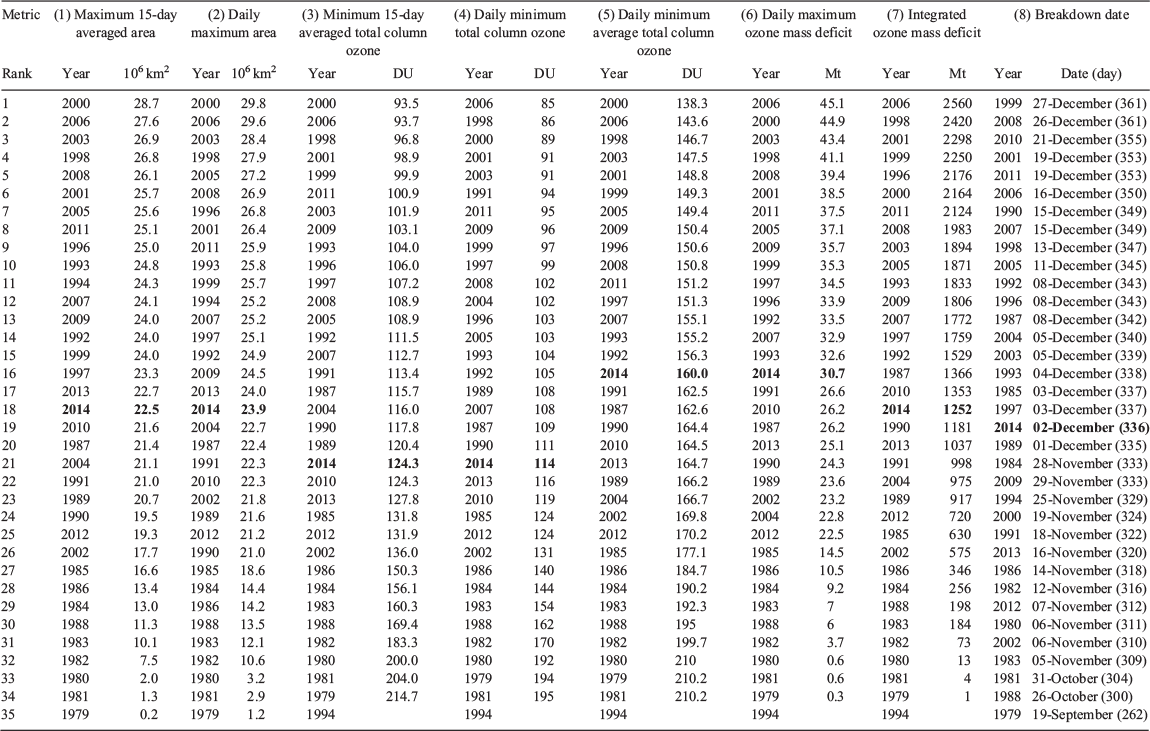
Table 1 contains the ranking for the 35 ozone holes adequately observed by satellite instruments since 1979 using eight metrics that provide different measures of the extent of ozone depletion in each year (see the notes accompanying the table for the definition of each metric). The first seven metrics in Table 1 measure various aspects of the maximum area and depth of the ozone hole; the 2014 ozone hole was ranked between 16th and 21st in terms of severity across these metrics, showing quantitative similarity with ozone holes of the late 1980s, early 1990s and some recent years, particularly 2010 and 2013.
|
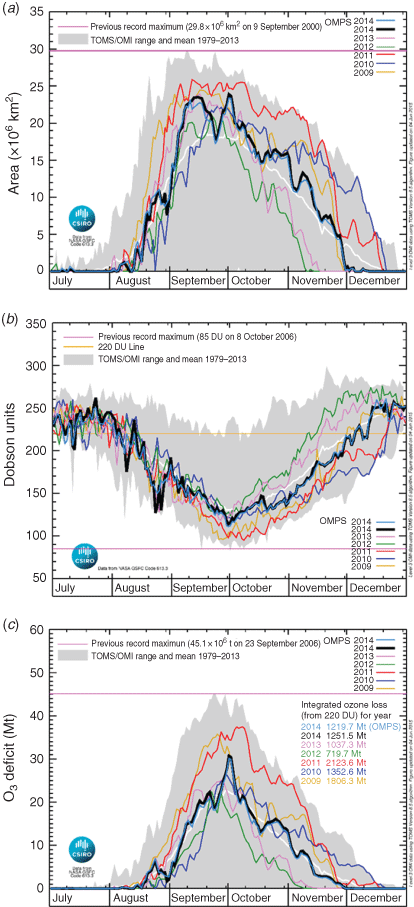
Figure 1 shows time-series of the ozone hole area, minimum polar total column ozone and total ozone deficit within the ozone hole over the latter half of each year from 2009 to 2014. It can be seen that in 2014, the evolution of the ozone hole was generally similar to the long-term mean (white line, which is the average over 1979–2013). Specific notable features in the time-series for Fig. 1a, c are the brief reductions in area and mass deficit during the last few days of August and again around September 25 and the middle of October. These features coincided with disturbances of the polar vortex associated with episodes of poleward heat transport as discussed in Appendix 1 (in association with Figs. A1.2—A1.4). The vortex experienced a relatively undisturbed period at the beginning of October which led to a marked week-long increase in ozone hole area and deficit. The timing of the dissipation of the hole at the beginning of December was similar to the 2009 ozone hole, a few weeks later than that for 2013 which was unusually early and a few weeks earlier than the ozone holes in 2010 and 2011 which were very persistent.
|
A further notable feature are the two relatively low total column values apparent in the OMI instrument data of Fig. 1b towards the end of August; these are on the 23rd and 26th and have values of 127 and 130 DU respectively. No measurements were available from the OMPS instrument on the 23rd, but on the 26th, the minimum value observed was 165 DU. SAOZ (Systeme d’Analyse par Observation Zenithale) total column ozone measurements at Rothera (67.6°S 68.1°W; close to where the OMI minima was recorded) shows 131 DU on the 23rd, and 172 on the 26th, which broadly confirm the OMI figures. The difference between the OMI and OMPS measurements on the 26th highlights that caution is needed interpreting this metric during the formation of the ozone hole, as parts of the polar cap are still in darkness and cannot be measured by these instruments, and effects due to scattering from Polar Stratospheric Clouds at low sun angles can influence the measurements.
A prominent feature of daily maps of total column ozone obtained by satellite instruments during September and October was the ridge of high ozone concentration to the south of Australia (see Krummel et al. 2015). The ridge develops each spring due to transport effects associated with the circulation pattern set up by a wave-1 quasi-stationary planetary wave in the lower stratosphere. Episodes of disturbance in the planetary wave field during these months resulted in the ozone hole being displaced off the pole towards the Atlantic Ocean, and at times up to a third to a half of the Antarctic continent was outside of the ozone hole. During these periods the polar vortex (and hence the ozone hole) became quite elongated, resulting in the tip of South America being on the edge of or within the ozone hole on 14–17 September, 6–7 10 October and 12–14 November.
Between the above-mentioned periods of high ozone, the polar vortex and ozone hole were relatively symmetrical, with the Australian Antarctic stations of Mawson, Davis and Casey being on the edge of or completely inside the ozone hole on 6–7 September, 20–21 September, 26–30 September and 1 October (the date of the peak ozone hole area for 2014). There were also several periods when the stations were outside of the ozone hole: 15, 22–23 September and 16–18 October. The Australian sub-Antarctic station at Macquarie Island spent most of the 2014 ozone hole season under the ozone ridge (see later).
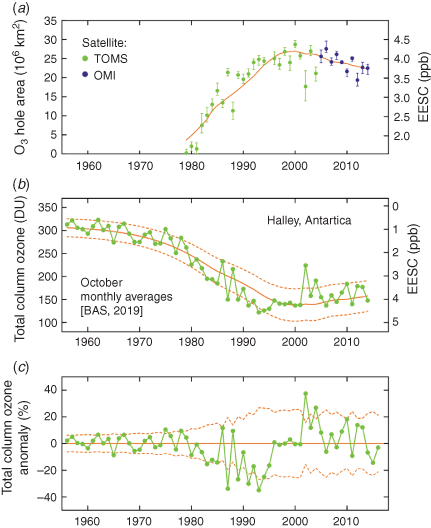
Yearly values from Table 1 for maximum ozone hole area (15-day average) are also presented as a time-series in Fig. 2a, together with the estimated level of Antarctic Equivalent Effective Stratospheric Chlorine (EESC; orange line) (Fraser et al. 2014; Klekociuk et al. 2015), which is a measure of the potential for chemical-ozone depletion in the lower stratosphere. The 2014 value was characteristic of those observed in the early 1990s, and lower than the majority of the intervening years 1993–2013, suggestive of the beginning of ozone hole recovery. However, considerable meteorological variability is also evident, superimposed on the longer term trend, most apparent in the reduced ozone hole area in the dynamically disturbed years of 1986, 1988, 2002, 2004, 2010 and 2012 (Klekociuk et al. 2014b).
|
As a general guide, the averages of the metrics in Table 1 for the peak ozone hole period of 1996–2001 can be compared to the average of the most recent 6-year period (2009–14) ozone hole metrics, for simple indications of ozone hole recovery (keeping in mind these metrics are affected by the meteorological conditions). The 1996–2001 mean of the 15-day ozone hole area was (25.6 ± 2.0) × 106 km2, whereas the 2009–14 mean was (22.5 ± 2.0) × 106 km2, which is indicative of the commencement of possible ozone recovery, but not statistically significant as the 1σ uncertainties overlap. The 1996–2001 mean of the 15-day ozone hole minima was 100 ± 5 DU, whereas the 2009–14 mean was 119 ± 13 DU. There is a strong suggestion that ozone is recovering in this metric with the uncertainties no longer overlapping (at 1σ level). The 1996–2001 mean of the integrated ozone mass deficit was 2180 ± 230 Mt, whereas the 2009–14 mean was 1380 ± 510 Mt, which also suggests the commencement of ozone recovery (uncertainties no longer overlapping at 1σ).
A longer term data record of Antarctic ozone depletion is available from ground-based Dobson spectrophotometer measurements at the British Antarctic Survey’s Halley station (75.6°S and 26.2°W) in Antarctica. Fig. 2b shows the mean October total column ozone obtained at Halley from 1957 to 2014, again with EESC levels.
The Halley total column ozone value for 2014 shown in Fig. 2b of 148 DU was less than that measured in 2012 (197 DU) and 2013 (177 DU), although the value was within 1 standard deviation (σ) of the long-term total column value expected on the basis of regression to EESC (Fig. 2c). Ignoring the dynamically disturbed years of 2002 and 2004 (Klekociuk et al. 2015), the mean October total column ozone value at Halley over 2009–14 (166 ± 18 DU) is higher than that over 1996–2001 (141 ± 4 DU); this increase is statistically significant at the 98% confidence limit based on the Student’s t-test for differences of mean with unequal variances. If we remove 2002 and 2004, the remaining years (1996–2014) show significant ozone growth (recovery) of 1.5 ± 1.2 (2σ) DU/year. For the period 1993–2014, the ozone growth is 1.8 ± 0.8 (2σ) DU/year, although the early 1990s data may be low due to the impact of the Mt Pinatubo and Mt Hudson eruptions, rather than reflecting the minimum of EESC which occurred around the year 2000.
In Fig. 2b, the dynamically disturbed years of 1986, 1988, 2002, 2004, 2010 and 2012 (Klekociuk et al. 2014b) show obvious positive values of the anomaly. The period 1991–95 shows negative anomalies, and these years were potentially affected by enhanced ozone depletion following the volcanic eruptions of Mt Pinatubo (June 1991; Philippines) and Mt Hudson (August 1991; Chile) (Deshler et al. 1992; Aquila et al. 2013). However, the years 1983–85, 1987 and 1989 show negative anomalies that are close to or outside the 95% confidence interval of the fitted regression. For these years, we do not regard that instrumental factors nor underestimation of EESC could alone account for the depth of these anomalies; however, these and other factors deserve more detailed consideration. We note that volcanic effects from the El Chichón eruption in early 1982 are not regarded as having significant negative impacts on Antarctic ozone (Angell et al. 1985; Angell 1997). Further, October vortex mean temperatures were relatively cold during the period from 1987 to 1998.
It is also worth noting the qualitative agreement between Fig. 2a and b, indicating broad agreement between different measures of Antarctic ozone hole depletion.
3 Vertically resolved ozone measurements
3.1 Odin Optical Spectrograph and Infra-Red Imager System stratospheric ozone profiles
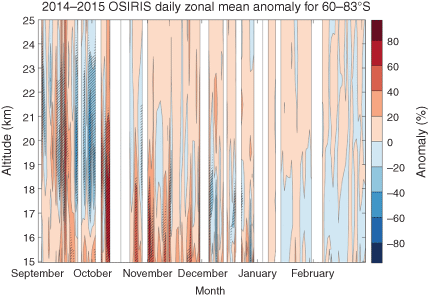
To complement satellite measurements of total ozone during 2014 shown in Fig. 1, the time-height development of the anomaly in ozone density over the southern polar cap (poleward of 60°S) from September 2014 to February 2015 is summarised in Fig. 3. This figure uses vertical profiles of stratospheric ozone number density obtained from the Optical Spectrograph and Infra-Red Imager System (OSIRIS) instrument on the Odin satellite (see Klekociuk et al. (2015) for details), and the anomaly (expressed as a percentage deviation) has been evaluated using the climatological mean over corresponding days between 2003 and 2014.
|
Evident in Fig. 3 are regions of anomalously low ozone (hatched blue regions) above ~17-km altitude in September which gave way to regions of anomalously enhanced ozone below ~21-km altitude in October and November. The timing of the increase in ozone generally coincides with the reduction in the severity of ozone hole metrics shown in Fig. 1, particularly the sharp increase in area and deficit in early October and decrease in mid-October. Note also in Fig. 3 that reduced ozone generally persisted at the lowermost altitudes of the figure from December to February of 2015.
3.2 Aura Microwave Limb Sounder stratospheric ozone profiles
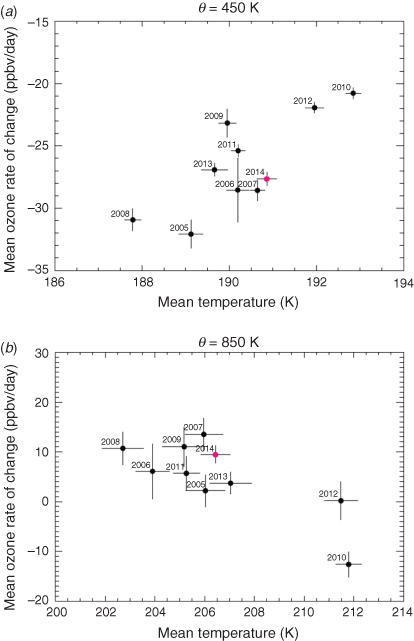
Annual values of the vortex-average rate-of-change of ozone mixing ratio as a function of temperature, averaged over days 200–260 (19 July–17 September in nonleap years), for isentropic levels of 450 K (~18 km height) and 850 K (~31 km height), are shown in Fig. 4a and 4b respectively. These figures essentially summarise characteristics during the period when the ozone hole is generally growing. The values are obtained from Aura Microwave Limb Sounder (MLS) version 3.3 data as described in Appendix 1.
|
On the 450 K isentrope (Fig. 4a), the ozone rate-of-change is positively correlated with temperature (R = 0.79, significant at the 95% confidence limit), with an enhanced ozone loss rate occurring at lower temperatures. Recent years of relatively late ozone hole development, 2010 (Klekociuk et al. 2011) and 2012 (Klekociuk et al. 2015), lie to the upper right in the figure. The growth of the ozone hole is potentially influenced by the amount of chemical processing that has taken place within the vortex over the winter (which is enhanced at lower temperatures by greater polar stratospheric cloud volume), and the amount of the vortex that is illuminated by sunlight after the end of the polar night (which depends on the size and symmetry of the vortex). As both 2010 and 2012 were years in which the polar vortex was relatively disturbed in spring, Fig. 4a suggests that the influence of the warmer temperatures on reducing heterogeneous reactions is a more important factor during the ozone hole growth phase than distortion of the vortex, which would be expected to increase the ozone loss rate by enhancing photolytic destruction as the equatorward fringes of the vortex come under greater solar illumination.
On the 850 K isentrope (Fig. 4b), the correlation between the ozone rate-of-change and temperature is negative (R = −0.78, also significant at the 95% confidence limit), with 2010 and 2012 appearing as anomalous years. At this level, ozone loss is primarily by gas-phase processes which are more efficient at higher temperatures. Overall, the behaviour of 2014 in Fig. 4a, b appears typical in comparison to years in which the polar vortex during late winter and early spring was relatively undisturbed by dynamical activity. As has been discussed with regard to Figs. 1 and 3, in 2014 episodes of poleward transport of heat occurred in late September and the middle of October (see also Fig. A1.2), somewhat later than the day 200–260 period analysed here.
3.3 Ozonesonde measurements at Davis
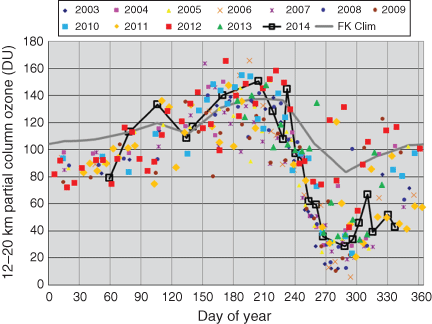
In 2014, the program of ozonesonde measurements at Australia’s Davis station in Antarctica (68.6°S, 78.0°E) continued. This involved launches at approximately weekly intervals from mid-May to late December, and one flight per month for February to April. Figure 5 shows the 12–20 km partial column ozone amount for 2014 in comparison with earlier measurements. Overall, the evolution of the partial column values did not diverge greatly from the average pattern of previous years but did show generally less variability than earlier years during the spring (particularly when compared with 2012 and 2013), and most notably, no values of this partial column less than 20 DU were observed in contrast to many previous years. The steady decline of partial column ozone at Davis between days 200 and 260, at a range in the middle of the climatological spread, is reflective of the rate of decrease in the overall vortex shown in Fig. 4a.
|
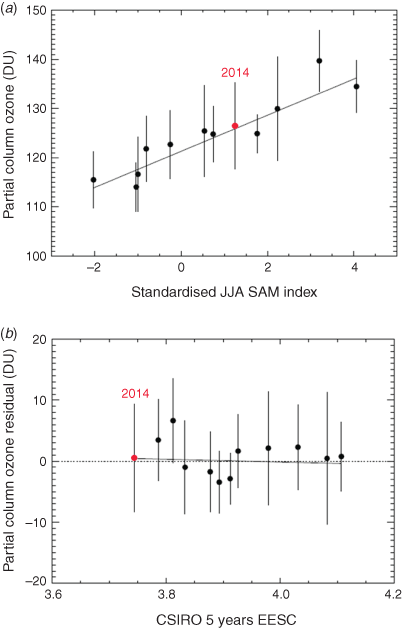
A feature of Fig. 5 is the generally higher interannual variability that is apparent in the winter (June–August, day-of-year 152–243) compared with summer (December–February, 335–59) and autumn (March–May, 60–151). In Fig. 6a, we show the average winter (day-of-year 152–243 in nonleap years) against the standardised SAM index for the corresponding period (Marshall 2003). The period covered is at the time of year when the partial column values do not exhibit a strong seasonal trend, being generally while the vortex is in darkness and thus before ozone undergoes strong depletion. A weighted linear regression of the yearly partial column values (y) against SAM yields the equation

|
where values in parentheses are twice the standard error. The fraction of the variance in the partial column values explained by this relationship is R2 = 0.84.
As described in Appenzeller et al. (2000), a positive correlation is seen between total ozone and the North Atlantic Oscillation (NAO) in winter months in the Northern Hemisphere. These authors showed that the observed behaviour is due to the raising (lowering) of the polar tropopause by the negative (positive) phase of the NAO which, in turn, effectively decreases (increases) the thickness of the stratosphere and hence decreases (increases) the overburden of ozone. A similar mechanism was proposed by Fogt et al. (2009) to explain the winter correlation between model simulations of total column ozone over the South Pole and SAM. We, therefore, examined the relationship of the Davis partial column ozone values with the mean June–August pressure at the lapse-rate tropopause obtained from the ozonesonde measurements between 2003 and 2014. A positive correlation between the tropopause pressure and SAM was found with R = 0.43 (i.e. a higher tropopause when SAM is negative, supporting the mechanism described by Appenzeller et al. (2000) which is significant at the 91% confidence limit. The relatively low significance of the correlation may reflect that the tropopause pressure over Davis is influenced by synoptic-scale meteorological variability that, while affecting height of the tropopause, is unconnected with SAM variations. The correlation between surface pressure and SAM was found to be R = −0.78, whereas correlation between partial column ozone and surface pressure gave R= −0.6; both of these correlations are significant at the 95% confidence limit and lend further support to the hypothesis that large-scale pressure changes provide a dominant influence on ozone in the winter lower stratosphere above Davis.
We note that Miyagawa et al. (2014), from the analysis of Umkehr measurements at Syowa (69.0°S, 39.6°E) from 1977 to 2011 that were necessarily restricted to the months from August to March, find only a weak positive (negative) correlation between ozone in the lower stratosphere and SAM for August during years of high (low) solar activity (see their Fig. 6a). This difference with the response seen at Davis, which was observed over almost a full solar cycle, may reflect zonal asymmetries in the spatial influence of the SAM on the upper troposphere near the Antarctic coast (e.g. fig. 4 of Thompson et al. 2005). Although a large fraction of the interannual variability in the partial column ozone is removed by subtracting the linear regression with SAM, the resulting residuals do not show a significant linear relationship with other relevant ozone-influencing factors, such as EESC (Fig. 6b), June–August standardised quasi-biennial oscillation (QBO) index (e.g. the 30 hPa QBO index discussed in Appendix 1; not shown) or polar cap (65–90°S) temperature anomalies in the lower stratosphere (e.g. anomalies for the levels discussed in Fig. A1.1 of Appendix 1 evaluated for the 1979–2002 base period, not shown).
3.4 Macquarie Island Dobson observations
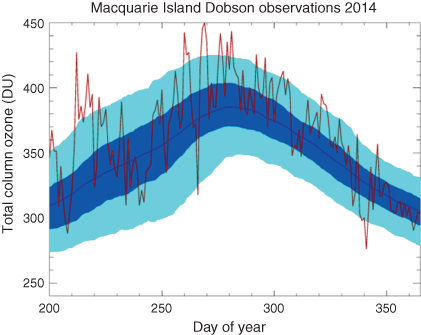
The BoM carries out long-term high quality measurements of total column ozone at sub-Antarctic Macquarie Island (54.5° S, 158.9° E) using the Dobson spectrophotometer, continuing a program dating back to 1957. Observations for 2014 are shown in Fig. 7 (red) compared to the 1987–2013 range. In contrast to Dobson observations from Halley shown in Fig. 2, Macquarie Island generally lies outside the boundary of the polar vortex in spring and sees significant fluctuations in daily total ozone due to variations in the shape and position of the vortex.
|
As referred to earlier, during most of October and November, total ozone was at or above the climatological mean range at Macquarie Island; however, a number of fluctuations were also observed due to the periods of disturbance to the polar vortex noted earlier.
A number of days with very high ozone levels were recorded through late September and early October. The daily average for 25 September 2014 (day-of-year 268) was 458 DU, followed by 450 DU on 26 September. The daily average for 8 October (day-of-year 281) was 443.5 DU. On these occasions, the ozone hole had become elongated due to dynamical disturbance along an axis located away from Macquarie Island.
In contrast, in late August, Macquarie Island was subject to the influence of the polar vortex, and low daily ozone averages were measured of 309.9 DU on 22 August (day-of-year 234) and 309.7 DU on 28 August (day-of-year 240).
An episode of low ozone was also observed in early December with a daily average 276 DU on 7 December (day-of-year 341); however, this event appears attributable to transport from mid-latitudes rather than polar influence.
3.5 Antarctic ultraviolet radiation
Measurements of biologically effective solar ultraviolet (UV) radiation continued in 2014 at Casey (66.3°S, 110.5°E), Mawson (67.6°S, 62.9°E) and Davis (68.6°S, 78.0°E) in Antarctica. Details on the instrumentation and methods used are provided by Tully et al. (2008) and Klekociuk et al. (2015).
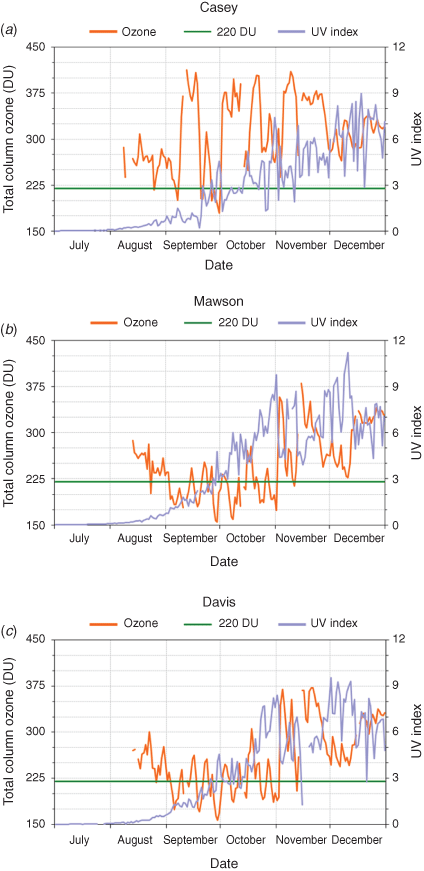
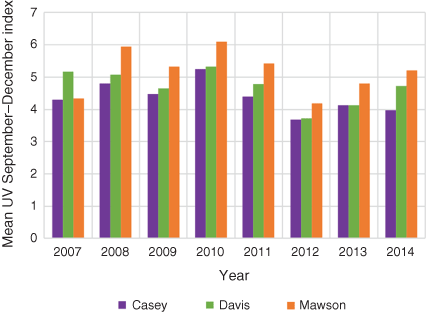
In Fig. 8, measurements of the UV Index at Casey, Mawson and Davis from July to December 2014 are compared with daily total column ozone measurements near local noon from the OMI instrument. There was a period of relatively high UV Index at the three stations in the first half of December as the ozone hole was dissipating. The general level of the UV Index at Mawson can be seen to be higher than at the other two stations in Fig. 8, despite Mawson being intermediate in latitude between Davis, the southernmost of the stations and Casey. This is further apparent in Fig. 9 which shows the September–December mean UV Index for the three stations from 2007 to 2014. The mean levels in these months during 2014 were higher at Davis and Mawson than in 2012 and 2013 when there was relatively less ozone depletion over Antarctica (Fig. 1c). The higher UV exposure at Mawson is potentially the result of the asymmetry of the polar vortex, which tends have its inner edge further from the Mawson coast than for the other stations. Additionally, the surface ice albedo at Mawson is higher which is due primarily to the greater extent and persistence of land-fast sea ice than at the other stations, and this will tend to enhance UV levels through backscattering effects.
|
|
4 Conclusions
We have examined meteorological conditions and ozone concentrations in the Antarctic atmosphere during 2014 using a variety of data sources, including meteorological assimilations, satellite remote sensing measurements and ground-based instruments and ozonesondes.
The polar vortex was only moderately disturbed and was of a size and duration very close to the 1992–2013 mean for most of the season. Stratospheric 65–90°S temperatures were slightly cooler than the long-term mean in July, August and September, and until late September, ozone depletion was significant and the ozone hole relatively large. A dynamical disturbance in late September and another in mid-October resulted in temperatures being slightly above the mean in October which prevented more severe ozone loss from taking place. As a result, all metrics of the ozone hole reported in this work were close to their median values, ranked between 16th and 21st of the 35 years assessed. In many respects, the 2014 ozone hole resembled those of the early 1990s, with less severe depletion measured than during the 1996–2001 peak period. Given meteorological conditions were close to average, the modest ranking of the metrics is suggestive that the ozone hole is now responding to declining levels of ODS in the stratosphere (as indicated by the decline in EESC).
A comparison of the historical ozone hole metrics from the peak period of 1996–2001 to the 2009–14 period suggests that ozone hole recovery may have commenced based on the 15-day average ozone minima and integrated ozone mass deficit metrics using simple statistics, but the decline in the 15-day average ozone hole area is not yet statistically significant.
Acknowledgements
We acknowledge the Australian Department of Environment and Energy for support of this work, and the assistance of the following people: Jeff Ayton and the AAD’s Antarctic Medical Practitioners in collecting the solar UV data, BoM observers for collecting upper air measurements and for expeditioners of the British Antarctic Survey for collecting the Halley measurements. Odin is currently a third-party mission for the European Space Agency. OSIRIS operations and data retrievals are primarily supported by the Canadian Space Agency. The TOMS, OMI and OMPS data used in this study are provided by the NASA Goddard Space Flight Center, Atmospheric Chemistry & Dynamics Branch, Code 613.3. Aura MLS data used in this study were acquired as part of the NASA’s Earth–Sun System Division and archived and distributed by the Goddard Earth Sciences (GES) Data and Information Services Center (DISC) Distributed Active Archive Center (DAAC). MERRA data were acquired from the GES DISC. UKMO data were obtained from the British Atmospheric Data Centre (http://badc.nerc.ac.uk, accessed 30 April 2020). NCEP Reanalysis-2 data were obtained from the National Oceanic and Atmospheric Administration Earth System Research laboratory, Physical Sciences Division. Part of this work was performed under Projects 4012 and 4293 of the Australian Antarctic Science programme. EESC data are derived from ODS observations at Cape Grim, Tasmania – we acknowledge the Cape Grim staff and funding from CSIRO and the Bureau of Meteorology in support of these measurements.
References
Appenzeller C. Weiss A. K. Staehelin J. (2000). North Atlantic Oscillation modulates total ozone winter trends. Geophys. Res. Lett. 27, 1131–1134.| North Atlantic Oscillation modulates total ozone winter trends.Crossref | GoogleScholarGoogle Scholar |
Angell J. K. (1997). Estimated impact of Agung, El Chichon and Pinatubo volcanic eruptions on global and regional total ozone after adjustment for the QBO. Geophys. Res. Lett. 24, 647–650.
| Estimated impact of Agung, El Chichon and Pinatubo volcanic eruptions on global and regional total ozone after adjustment for the QBO.Crossref | GoogleScholarGoogle Scholar |
Angell J. K. Korshover J. Planet W. G. (1985). Ground-based and satellite evidence for a pronounced ozone-minimum in early 1983 and responsible atmospheric layers. Mon. Wea. Rev. 113, 641–646.
| Ground-based and satellite evidence for a pronounced ozone-minimum in early 1983 and responsible atmospheric layers.Crossref | GoogleScholarGoogle Scholar |
Aquila V. Oman, L. D. Stolarski, R. Douglass, A. R. Newman, P. A. (2013). The response of ozone and nitrogen dioxide to the eruption of Mt. Pinatubo at Southern and Northern Midlatitudes. J. Atmos. Sci. 70, 894–900.
| The response of ozone and nitrogen dioxide to the eruption of Mt. Pinatubo at Southern and Northern Midlatitudes.Crossref | GoogleScholarGoogle Scholar |
Arblaster, J. M., Gillett, N. P. (Lead Authors), Calvo, N., Forster, P. M., Polvani, L. M., Son, S.-W., Waugh, D. W., and Young, P. J. (2014). Chapter 4: Stratospheric ozone changes and climate. In ‘Scientific Assessment of Ozone Depletion: 2014, Global Ozone Research and Monitoring Project – Report No. 55’. (World Meteorological Organization: Geneva, Switzerland.)
Baldwin M. P. Dunkerton T. J. (1998). Quasi-biennial modulations of the southern hemisphere stratospheric polar vortex. Geophys. Res. Lett. 25, 3343–3346.
| Quasi-biennial modulations of the southern hemisphere stratospheric polar vortex.Crossref | GoogleScholarGoogle Scholar |
BAS (British Antarctic Survey) (2019). Provisional Monthly Mean Ozone Values for Halley [online]. Available at https://legacy.bas.ac.uk/met/jds/ozone/index.html#data [Verified 15 May 2020].
Blunden J. Arndt. D. S. (2015). State of the climate in 2014. Bull. Am. Meteor. Soc. 96, S1–S267.
| State of the climate in 2014.Crossref | GoogleScholarGoogle Scholar |
Dameris, M. and Godin-Beekmann, S. (Lead Authors), Alexander, S., Braesicke, P., Chipperfield, M., de Laat, A. T. J., Orsolini, Y., Rex, M. and Santee, M. L. (2014). Chapter 3: Update on Polar ozone: past, present, and future. In ‘Scientific Assessment of Ozone Depletion: 2014, Global Ozone Research and Monitoring Project – Report No. 55’. (World Meteorological Organization: Geneva, Switzerland.)
Deshler T. Adriani A. Gobbi G. P. Hofmann D. J. DiDonfrancesco G. Johnson B. J. (1992). Volcanic aerosol and ozone depletion within the Antarctic polar vortex during the austral spring of 1991. Geophys. Res. Lett. 19, 1819–1822.
| Volcanic aerosol and ozone depletion within the Antarctic polar vortex during the austral spring of 1991.Crossref | GoogleScholarGoogle Scholar |
Fogt R. L. Perlwitz J. Pawson S. Olsen M. A. (2009). Intra-annual relationships between polar ozone and the SAM. Geophys. Res. Lett. 36, L04707.
| Intra-annual relationships between polar ozone and the SAM.Crossref | GoogleScholarGoogle Scholar |
Fortuin J. P. F. Kelder H. (1998). An ozone climatology based on ozonesonde and satellite measurements. J. Geophys. Res. 103, 31709–31734.
| An ozone climatology based on ozonesonde and satellite measurements.Crossref | GoogleScholarGoogle Scholar |
Fraser, P., Krummel, P., Steele, P., Trudinger, C., Etheridge, D., Derek, D., O’Doherty, S., Simmonds, P., Miller, B., Muhle, J., Weiss, R., Oram, D., Prinn, R., and Wang, R. (2014). Equivalent effective stratospheric chlorine from Cape Grim Air Archive, Antarctic firn and AGAGE global measurements of ozone depleting substances. In ‘Baseline Atmospheric Program (Australia) 2009–2010’. (Eds N. Derek, P. Krummel and S. Cleland) pp. 17–23. (Australian Bureau of Meteorology and CSIRO Marine and Atmospheric Research: Melbourne, Vic., Australia.)
Kanamitsu M. Ebisuzaki W. Woollen J. Yang S.-K. Hnilo J. J. Fiorino M. Potter G. L. (2002). NCEP-DEO AMIP-II Reanalysis (R-2). Bull. Am. Meteorol. Soc. 83, 1631–1643.
| NCEP-DEO AMIP-II Reanalysis (R-2).Crossref | GoogleScholarGoogle Scholar |
Klekociuk A. R. Tully M. B. Alexander S. P. Dargaville R. J. Deschamps L. L. Fraser P. J. Gies H. P. Henderson S. I. Javorniczky J. Krummel P. B. Petelina S. V. Shanklin J. D. Siddaway J. M. Stone K. A. (2011). The Antarctic ozone hole during 2010. Aust. Met. Oceanog. J. 61, 253–267.
| The Antarctic ozone hole during 2010.Crossref | GoogleScholarGoogle Scholar |
Klekociuk A. R. Tully M. B. Krummel P. B. Gies H. P. Petelina S. V. Alexander S. P. Deschamps L. L. Fraser P. J. Henderson S. I. Javorniczky J. Shanklin J. D. Siddaway J. M. Stone K. A. (2014a). The Antarctic ozone hole during 2011. Aust. Met. Oceanog. J. 64, 293–311.
| The Antarctic ozone hole during 2011.Crossref | GoogleScholarGoogle Scholar |
Klekociuk A. R. Tully M. B. Krummel P. B. Gies H. P. Alexander S. P. Fraser P. J. Henderson S. I. Javorniczky J. Petelina S. V. Shanklin J. D. Schofield R. Stone K. A. (2014b). The Antarctic ozone hole during 2012. Aust. Met. Oceanog. J. 64, 313–330.
| The Antarctic ozone hole during 2012.Crossref | GoogleScholarGoogle Scholar |
Klekociuk A. R. Tully M. B. Krummel P. B. Gies H. P. Alexander S. P. Fraser P. J. Henderson S. I. Javorniczky J. Shanklin J. D. Schofield R. Stone K. A. (2015). The Antarctic ozone hole during 2013. Aust. Met. Oceanog. J. 65, 247–266.
| The Antarctic ozone hole during 2013.Crossref | GoogleScholarGoogle Scholar |
Krummel, P. B., Fraser, P. J. and Derek, N. (2015). The 2014 Antarctic Ozone Hole and Ozone Science Summary: Final Report. iv, 26 pp. (Report prepared for the Australian Government Department of the Environment, CSIRO, Australia.). Available at
Manney G. L. Daffer W. H. Zawodny J. M. Bernath P. F. Hoppel K. W. Walker K. A. Knosp B. W. Boone C. Remsberg E. E. Santee M. L. Harvey V. L. Pawson S. Jackson D. R. Deaver L. McElroy C. T. McLinden C. A. Drummond J. R. Pumphrey H. C. Lambert A. Schwartz M. J. Froidevaux L. McLeod S. Takacs L. L. Suarez M. J. Trepte C. R. Cuddy D. C. Livesey N. J. Harwood R. S. Waters J. W. (2007). Solar occultation satellite data and derived meteorological products: sampling issues and comparisons with Aura Microwave Limb Sounder. J. Geophys. Res. 112, D24S50.
| Solar occultation satellite data and derived meteorological products: sampling issues and comparisons with Aura Microwave Limb Sounder.Crossref | GoogleScholarGoogle Scholar |
Marshall G. J. (2003). Trends in the Southern Annular Mode from observations and reanalyses. J. Clim. 16, 4134–4143.
| Trends in the Southern Annular Mode from observations and reanalyses.Crossref | GoogleScholarGoogle Scholar |
Miyagawa K. Petropavlovskikh I. Evans R. D. Long C. Wild J. Manney G. L. Daffer W. H. (2014). Long-term changes in the upper stratospheric ozone at Syowa, Antarctica. Atmos. Chem. Phys. 14, 3945–3968.
| Long-term changes in the upper stratospheric ozone at Syowa, Antarctica.Crossref | GoogleScholarGoogle Scholar |
Nash E. R. Newman P. A. Rosenfield J. E. Schoeberl M. R. (1996). An objective determination of the polar vortex using Ertel’s potential vorticity. J. Geophys. Res. 101, 9471–9478.
| An objective determination of the polar vortex using Ertel’s potential vorticity.Crossref | GoogleScholarGoogle Scholar |
Schwartz M. J. Lambert A. Manney G. L. Read W. G. Livesey N. J. Froidevaux L. Ao C. O. Bernath P. F. Boone C. D. Cofield R. E. Daffer W. H. Drouin B. J. Fetzer E. J. Fuller R. A. Jarnot R. F. Jiang J. H. Jiang Y. B. Knosp B. W. Krüger K. R. Li J.-L. F. Mlynczak M. G. Pawson S. Russell J. M. Santee M. L. Snyder W. V. Stek P. C. Thurstans R. P. Tompkins A. M. Wagner P. A. Walker K. A. Waters J. W. Wu D. L. (2008). Validation of the Aura Microwave Limb Sounder temperature and geopotential height measurements. J. Geophys. Res. 113, D15S11.
| Validation of the Aura Microwave Limb Sounder temperature and geopotential height measurements.Crossref | GoogleScholarGoogle Scholar |
Swinbank R. O’Neill A. A. (1994). Stratosphere-troposphere data assimilation system. Mon. Wea. Rev. 122, 686–702.
| Stratosphere-troposphere data assimilation system.Crossref | GoogleScholarGoogle Scholar |
Thompson D. W. J. Baldwin M. P. Solomon S. (2005). Stratosphere-troposphere coupling in the southern hemisphere. J. Atmos. Sci. 62, 708–715.
| Stratosphere-troposphere coupling in the southern hemisphere.Crossref | GoogleScholarGoogle Scholar |
Tully M. B. Klekociuk A. R. Deschamps L. L. Henderson S. I. Krummel P. B. Fraser P. J. Shanklin J. D. Downey A. H. Gies H. P. Javorniczky J. (2008). The 2007 Antarctic ozone hole. Aust. Met. Mag. 57, 279–298.
Tully M. B. Klekociuk A. R. Alexander S. P. Dargaville R. J. Deschamps L. L. Fraser P. J. Gies H. P. Henderson S. I. Javorniczky J. Krummel P. B. Petelina S. V. Shanklin J. D. Siddaway J. M. Stone K. A. (2011). The Antarctic ozone hole during 2008 and 2009. Aust. Met. Oceanog. J. 61, 77–90.
| The Antarctic ozone hole during 2008 and 2009.Crossref | GoogleScholarGoogle Scholar |
Watson P. A. G. Gray L. G. (2014). How does the quasi-biennial oscillation affect the stratospheric polar vortex? J. Atmos. Sci. 71, 391–409.
| How does the quasi-biennial oscillation affect the stratospheric polar vortex?Crossref | GoogleScholarGoogle Scholar |
A.1 Polar temperatures and atmospheric indices
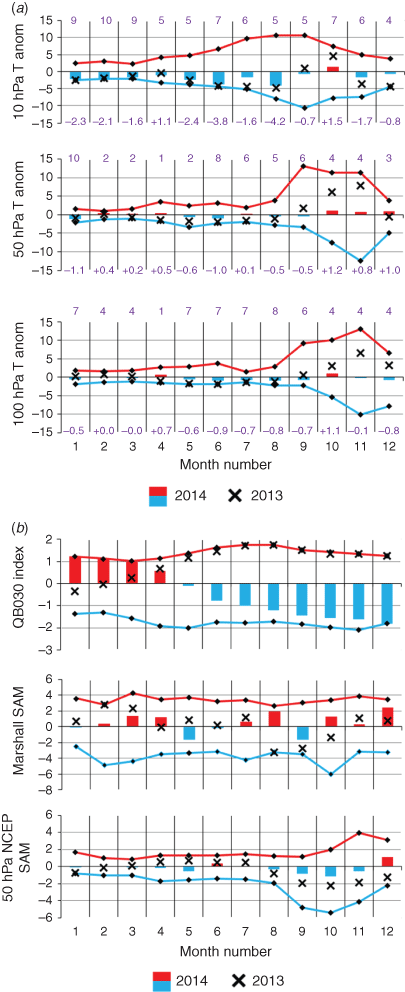
Figure A1.1a shows monthly mean temperature anomalies for the latitude range 90–65°S from the National Centers for Environmental Prediction (NCEP) Reanalysis-2 data (Kanamitsu et al. 2002) with respect to the base period 1979–2013 for three pressure levels. At the 50 and 100-hPa levels, temperatures were within 1.5 K of the long-term mean for all months, and the anomalies were generally mid-ranked in terms of exception compared with the preceding decade (rankings are indicated at the top of each panel in Fig. A1.1a with a rank of 5 or 6 being mid-range). An exception was the January mean temperature at 50 hPa, which as the lowest since 2004. Temperatures at 10 hPa were consistently below the climatological mean in all months except November. For the period January to March, the 10-hPa temperatures were amongst the coldest since 2004. During the remainder of the year, the rankings of the anomalies at this pressure level were generally unexceptional. In particular, the October and November averages at 50 and 100 hPa did not show the pronounced warm anomalies observed in 2012 and 2013 (Klekociuk et al. 2014b, 2015), or the pronounced cold anomalies seen in these months in 2010 and 2011 (Klekociuk et al. 2011, 2014a).
|
During 2014, the NCEP standardised 30-hPa quasi-biennial oscillation (QBO) index (http://www.cpc.ncep.noaa.gov/data/indices/qbo.u30.index, accessed 30 April 2020) was decreasingly positive (eastward) up to April and progressively became more negative (westward) from May through the remainder of the year (eastward; Fig. A1.1b, top panel). The QBO modulates the ability of upward propagating planetary waves to influence extratropical latitudes in the winter hemisphere, and the negative phase favours a stronger and less disturbed polar vortex (Baldwin and Dunkerton 1998; Watson and Gray 2014).
The surface-standardised Southern Annular Mode (SAM) index (Marshall 2003 and http://www.antarctica.ac.uk/met/gjma/sam.html, accessed 30 April 2020) (Fig. A1.1b, middle panel) was mostly positive during the year, but generally within two standard deviations with respect to the 1979–2001 base period (the exception being December when the value of the index was +2.5). See Klekociuk et al. (2015) for a discussion of the significance of SAM index values in relation to tropospheric and stratospheric wave dynamics. The bottom panel of Fig. A1.1b shows the SAM index for 50 hPa evaluated using empirical orthogonal function analysis of NCEP Reanalysis-2 data, following the approach used by the NOAA Climate Prediction Center for their 700-hPa Antarctic Oscillation index (http://www.cpc.ncep.noaa.gov/products/precip/CWlink/daily_ao_index/aao/aao_index.html, accessed 30 April 2020). The 50-hPa SAM index was generally weakly negative in 2014, except in June and December when it was weakly positive. Generally the QBO and SAM indices were indicative of a strong and stable polar vortex with relatively low levels of dynamical disturbance, which contrasted with the situation in the spring of 2013 (Klekociuk et al. 2015).
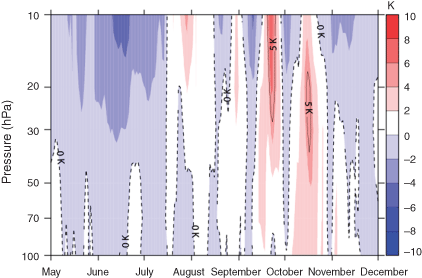
Returning to temperature conditions, a further representation of NCEP Reanalysis-2 temperatures is shown in Fig. A1.2, which show the pressure-time structure of the climatological zonal mean anomaly for the latitude band 55–75°S. Up to mid-September, the generally cold temperatures noted at 10 hPa (Fig. A1.1a) are apparent. Short episodes of warming occurred in the upper levels late in each of July, August and September, as well as mid-October. The September and October warmings extended to the lower levels but were less pronounced than the overall warming at these levels that occurred in the spring of 2013 (Klekociuk et al. 2015).
|
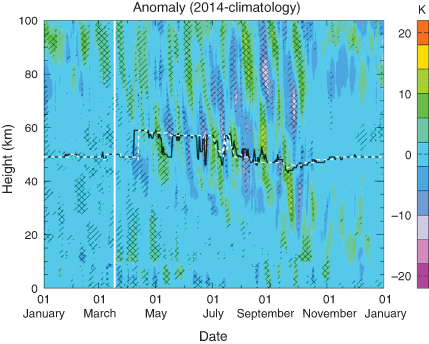
Daily temperature anomalies averaged over the Antarctic region obtained from measurements by the Microwave Limb Sounder (MLS) on the Aura spacecraft (Schwartz et al. 2008) are shown in Fig. A1.3. This figure shows that temperature anomalies throughout the winter and spring were relatively weak and isolated. In particular, the transition to summer was devoid of any significant disturbances at all levels, which contrasted with 2013 for which the lower stratosphere was markedly warm, whereas the upper stratosphere and upper mesosphere were markedly cold (Klekociuk et al. 2015, figure 9).
|
A.2 Dynamical activity
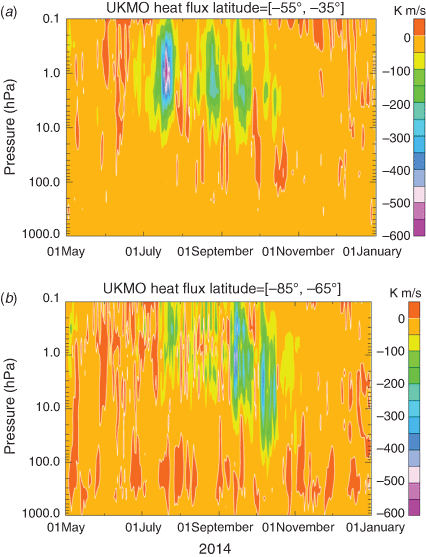
The poleward transport of heat provides a useful indicator of dynamical disturbances to the polar atmosphere produced by planetary waves at low- and mid-latitudes. Figure A1.4 shows the evolution of heat flux (measured by the product of the zonal anomalies in temperature and meridional wind speed) during 2014, using assimilated meteorological data from the United Kingdom Meteorological Office (UKMO). Outbreaks of poleward heat transport in the mid- and upper stratosphere (pressure levels 10–0.2 hPa) primarily occurred in mid-July, late August and mid-September (top panel of Fig. A1.4). The penetration of heat to higher latitudes was generally confined above the height of the 10-hPa level, except in September and more significantly in October when poleward heat transport extended into the lower stratosphere (bottom panel of Fig. A1.4).
|
A.3 The polar vortex
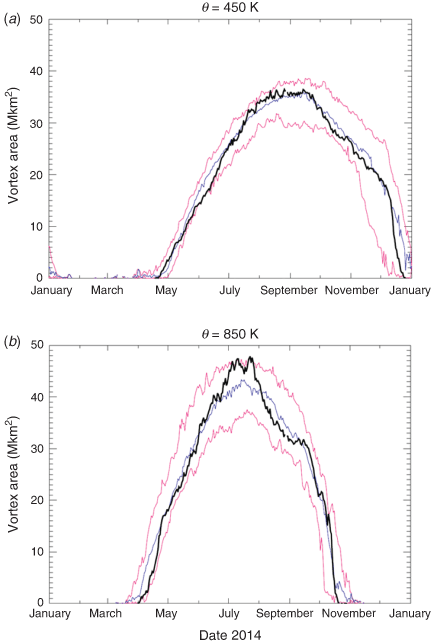
Time-series of proxies for the areal extent of the stratospheric polar vortex are shown in Fig. A1.5 for the 450 and 850 K isentropic surfaces. For both isentropes, the vortex area was notably above the long-term average during July and August (being close to the 95th percentile over the 1993–2013 base period during these months), but otherwise generally close to the climatological mean throughout the year. Overall, the decay of the vortex generally followed the climatological mean, and the dates of eventual breakdown at the two levels (late-December and late-September at 450 and 850 K respectively) were not exceptional.
|
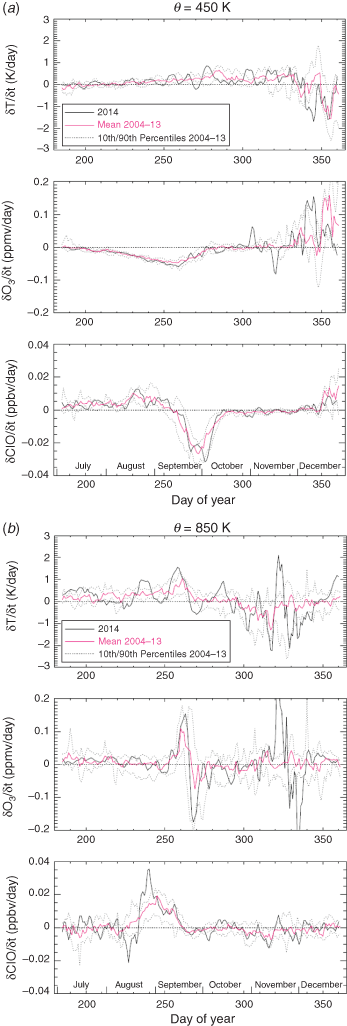
Daily time-series of vortex-average time-derivatives of temperature, ozone mixing ratio and chlorine monoxide (ClO) mixing ratio for isentropic levels of 450 (~18 km height) and 850 K (~31-km height) are shown in Fig. A1.6 a, b respectively along with climatological means and percentiles. The time-series are constructed using soundings from the Aura MLS, and estimates of the vortex edge location are derived from the GEOS5 meteorological reanalysis (Manney et al. 2007). As discussed by Manney et al. (2007), location of the vortex edge can be problematic, particularly outside of winter in the lower stratosphere, and no account has been made here for biases introduced by incorrect diagnosis of the vortex position. As discussed above in relation to Fig. A1.5, the vortex was rapidly breaking down on the 450 and 850 K isentropes during mid-December and mid-October respectively so the behaviour of the time-series shown after these dates in the relevant parts of Fig. A1.6 should be treated with caution.
|
The temperature trend time-series of the top panel in each of Fig. A1.6a, b (black line) show episodes of enhanced warming (maxima in the time derivative) throughout the interval shown. The warming episodes on the 850 K isentrope in late-August (~day 235), mid-September (~day 260) and mid-October (~day 285) correspond to periods of enhanced planetary wave activity (as indicated by corresponding episodes of poleward heat flux shown in Fig. A1.3). Smaller corresponding perturbations are also apparent on the 450 K isentrope. In Fig. A1.6a, ozone shows an increasing loss rate up to ~day 260; up to this date, ClO showed growth indicating that ozone was undergoing catalytic destruction. Overall, it can be seen that the behaviour of the time derivatives of ozone and ClO shown in Fig. A1.6a for 2014 do not appear notable in comparison with the climatological indicators shown.
On the 850 K isentrope, the ozone time derivative shows a feature near day 260, which is repeated in each year of MLS measurements. Over the 4-week period around this date, ozone concentrations show an initial decline, then rapid growth, which is followed by a less pronounced decline that subsequently relaxes. Over the 4 weeks leading up to day 260, both temperature and ClO show general increases. The ClO increase suggests in part that that some of the initial decline in ozone was driven by catalytic reactions. However, the timing of warming in temperature suggests that other processes are at play, potentially including horizontal transport of ozone-rich air into the vortex (providing the transient ozone increase before day 260) and upward mixing of ozone-depleted air (providing the transient ozone decrease after day 260). In terms of the behaviour during 2014 shown in Fig. A1.6b, the time derivatives of temperature and ClO between days 220 (8 August) and 245 (2 September) were at times outside of the 10th or 90th percentiles of the climatological period. This period generally corresponded to enhanced poleward heat flux at high southern latitudes near the 10-hPa level (Fig. A1.3b), and generally below-average area of the vortex on the 850-K isentrope (Fig. A1.5b).

 left axis) from Ozone Monitoring Instrument (OMI) measurements and daily ground-based UV Index measurements (
 right axis) during 2013 for (a) Casey (66.3°S and 110.5°E) and (b) Mawson (67.6°S and 62.9°E) and (c) Davis (68.6°S and 78.0°E). The 220 DU ozone hole threshold is also marked (
 left axis).