The impact of snow survey frequency on Australian snow depth records
Shane Bilish A * and Mic Clayton A
A
Abstract
Regular manual measurements of snow depth have been made in the Australian Alps since the 1950s and snow courses such as Spencers Creek continue to provide a primary record of snowpack variability in this region, being used for a range of scientific studies while also attracting considerable public interest. In this study, we investigate how the frequency of snow surveys within a season affects uncertainty in the representation of snow depth as well as in commonly derived seasonal metrics. Automatic measurements of snow depth at two locations, one with relatively persistent snow cover and the other more marginal, were used to simulate sequences of snow surveys at sampling intervals of between 1 and 4 weeks. Uncertainty was related to how well these sequences approximated actual temporal variability and, in each metric, increased with an increasing sampling interval. However, we show that the increase in uncertainty with time is greatest in the first week following a survey, suggesting that even weekly snow surveys should not be assumed to provide a complete representation of actual snowpack variability. The impact of the sampling interval on the estimation of snow depth varied intra-annually and was greatest during periods of rapid change, most notably later in the season as the snowpack underwent ablation. An awareness of the factors influencing uncertainty in manual snow depth records can be used to guide decisions relating to operational measurement programs and will also be beneficial to end users of these datasets.
Keywords: Australian Alps, historical records, marginal snow, measurements, snow course, snow depth, snow survey, snowpack, Spencers Creek, uncertainty.
1.Introduction
The Australian Alps extend across New South Wales, Victoria and the Australian Capital Territory, and include the principal seasonally snow-covered area on the Australian mainland. They feature areas of significant natural beauty, cultural significance and conservation value (Slattery 2015) and are a destination for both winter and summer tourism. The region is also a major source of inflows to the Murray–Darling Basin (Donohue et al. 2011), with snow accumulation and melt an important component of catchment hydrology at the higher elevations.
The most well-known of the Australian long-term snow depth records are maintained by Snowy Hydro Ltd (formerly the Snowy Mountains Hydro-Electric Authority). Construction of the Snowy Mountains Hydro-electric Scheme began in 1949, and routine measurement of the snowpack started in 1954 as an input for water resource management. The approach adopted was heavily influenced by contemporary practices in North America for the forecasting of seasonal runoff, which had expanded significantly in the 1930s. At the time, snow surveys in the western USA were typically performed monthly during the peak season between January and May (Helms et al. 2008), whereas in Canada, fortnightly snow surveys have been the standard since the first half of the twentieth century (Brown et al. 2019). There were originally more than 50 operational snow courses in NSW, with manual snow surveys conducted monthly in many cases and up to weekly at a smaller number of sites. Following the conclusion of the investigations phase of the Snowy Scheme, the number of snow courses was reduced to 13 by the early 1970s. Each snow course generally consists of between 4 and 10 measurement points at which snow depth and snow water equivalent (SWE) are measured using a Federal sampler. Although SWE is often considered to be the primary variable measured at snow courses because of its relevance to catchment hydrology, there can be much scientific and public interest in snow depth and its measurement also allows the calculation of bulk snow density. The Spencers Creek snow course has become a common point of reference for snow depth in the Australian Alps owing to its long and continuous record, publicly available data and proximity to major snow resorts.
Many studies of the Australian alpine area have used data from the NSW snow courses (and Spencers Creek in particular) as a primary input. Analyses of snowpack trends include those by Ruddell et al. (1990), Nicholls (2005), Davis (2013) and McGowan et al. (2018). The influence of atmospheric circulation and climate drivers on the snow season were explored by Budin (1985) and Pepler et al. (2015) respectively. Snow course data have also contributed to research into the physical properties (Sanecki et al. 2006; Bormann et al. 2013) and distribution (Green and Pickering 2009; Bilish et al. 2019) of the snowpack, as well as its influence on hydrology (Bormann et al. 2014; Bilish et al. 2020) and alpine vegetation (Edmonds et al. 2006; Verrall et al. 2023).
Although past studies have sometimes used snow course records to draw conclusions about the broader Australian alpine region, or those zones at similar elevations, snow courses are not intended to be representative of snow depth or SWE across a wider area (Dressler et al. 2006). Furthermore, there is increasing recognition of the complexity of snowpack dynamics in marginal snow environments such as the Australian Alps and the need for additional measurement points to adequately represent spatio-temporal variability (Bilish et al. 2019; López-Moreno et al. 2024). Advances in measurement technology, as well as a developing awareness of and interest in the sensitivity of the region to climate change (e.g. Di Luca et al. 2018; Ji et al. 2022), have encouraged an increase in the breadth and volume of data being collected to supplement the historical records. The Australian Mountain Research Facility (see https://www.amrf.org.au/amrf-sites/) has begun to measure a range of ecological and hydrometeorological variables, including snow depth, at sites across New South Wales, Victoria, Tasmania and the Australian Capital Territory. The collection of some datasets is motivated by specific commercial applications: Fiddes et al. (2015) reported on daily resolution snow depth data collected by three Victorian resorts, and Snowy Hydro Ltd is making increased use of automatic measurements of both snow depth and SWE in New South Wales. In time, such records will provide increased knowledge of spatial variability, complementing satellite observations of snow-covered area (Bormann et al. 2012; Thompson 2016; Rasouli et al. 2022). Nevertheless, snow courses will continue to have value for the foreseeable future as long-term, high-quality indicators of environmental variability and change, and will be needed to supplement the records started more recently.
In addition to issues of spatial variability and representativeness, consideration must also be given to the temporal aspects of snow course records. The Australian snowpack is highly responsive to meteorological drivers and can undergo rapid changes at any point in the season (Bilish et al. 2018). Manual snow surveys provide a temporally sampled representation of conditions at a snow course, yet there appears to have been no analysis to date of the impact of survey timing on the uncertainty in the dataset or the applications that make use of it.
It is the aim of this paper to investigate the sensitivity of snow depth and key variables derived from the Australian snow course datasets to the frequency of the constituent snow surveys. Given the central role of the Spencers Creek record in Australian alpine research, we begin with a short examination of the timing of snow surveys at this site over the historical record. We then simulate manual snow depth records at two different sites over a range of sampling intervals by applying a Monte Carlo approach to automatic snow depth measurements. We examine the implicit (yet unverified) assumption that the nominally weekly surveys of the historical record accurately represent temporal variability in the snowpack at point locations in the Australian Alps and estimate the impact on uncertainty of any variation to the sampling interval.
2.Data and methods
Snowy Hydro Ltd makes manual and automatic measurements of the snowpack at multiple locations across the catchments of the Snowy Mountains Scheme. All snowpack data are maintained in an internal quality-controlled hydrometeorological database.
2.1. Spencers Creek snow course
The Spencers Creek snow course is located in the southern part of Kosciuszko National Park (36.425°S, 148.348°E) at an elevation of 1830 m above sea level. Its seven measurement points are arranged in a cruciform pattern measuring ~120 by 64 m. The snow course is on a hillslope with a southeasterly aspect and the snow there tends to be deeper and more persistent than over much of the surrounding area (Bilish et al. 2019). The snow depth record from Spencers Creek was characterised here using data collected between 1954 and 2023. No automatic measurements have been made at this site to date; the sheltered hillside location makes the operation of instruments challenging, and any such measurements would not be directly comparable with the historical record unless made at all seven of the existing snow course poles.
2.2. Automatic measurement sites
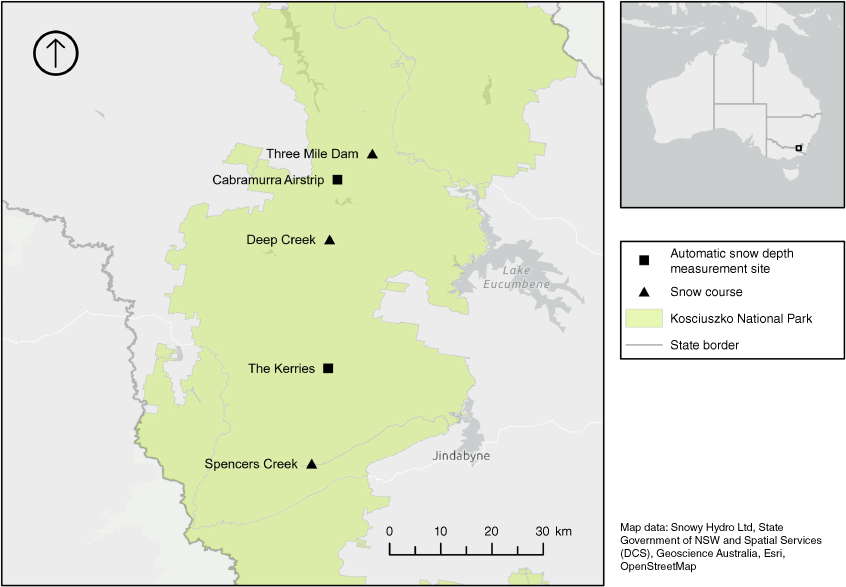
Two measurement sites with an extended period of automatic snow depth measurements were chosen for inclusion in the main analysis (Fig. 1 and Table 1). Though lower in elevation than the Spencers Creek snow course, The Kerries typically features a snowpack that is moderately persistent in the Australian context. Cabramurra Airstrip is ~200 m lower in elevation than The Kerries and is a more marginal site with shorter seasons, lower peak snow depths and more intermittent cover. Because these more marginal conditions represent an important component of snowpack variability in the Australian Alps, a comparison of the results from these two sites will help to ensure that the overall findings take account of existing variability in the region. This will also provide insight to the potential role of snow courses in a future with reduced snow cover and changing snowpack dynamics. Snow depth was measured at each site using The Probe ultrasonic level monitors (Siemens Milltronics Process Instruments, Peterborough, ON, Canada).
| Site | Elevation (m) | Latitude | Longitude | Analysis period | |
|---|---|---|---|---|---|
| The Kerries | 1740 | 36.260°S | 148.377°E | 2014–2022 | |
| Cabramurra Airstrip | 1543 | 35.932°S | 148.393°E | 2006–2014 |
Different experimental periods were selected for the two sites owing to there being periods of lower-quality and missing data in the complete record, including those following the bushfire that affected Cabramurra in summer 2019–2020. This is not expected to have a significant adverse effect on the analysis as the present study does not seek to make direct comparisons of specific years. Instead, the primary requirement was to represent the typical intra- and interannual variability in snow depth at each site, and this was achieved by including 9 years of continuous high-quality data in each case.
2.3. Generation and evaluation of simulated snow surveys
Daily-resolution reference datasets were created for both automatic measurement sites by extracting the 60-min mean snow depth measured at midnight Australian Eastern Standard Time. This step provided a standard product for verification of the datasets derived subsequently, retaining a suitable temporal resolution while minimising the impact of sub-daily (mainly temperature dependent) variability in the data. The reference datasets were then resampled with replacement to generate sets of simulated snow survey sequences, applying 1-, 2-, 3- and 4-week sampling intervals in turn (n = 1000 for each interval). A 2-week interval, for example, means that one survey takes place every second week, not that surveys are necessarily 14 days apart. To reflect usual operational practice, simulated survey values were drawn only from measurements made between Monday and Friday, with no surveys taking place on weekends.
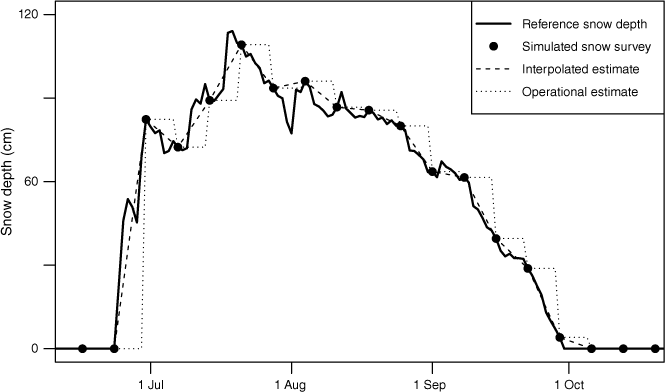
Snow course data have been and continue to be used in a variety of ways, and a full examination of the influence of snow survey frequency on uncertainty requires a validation of both snow depth and derived seasonal metrics. Discrepancies in snow depth at a daily time step were examined first by comparing each of the simulated snow survey sequences with the reference datasets, and calculating mean absolute error (MAE) and mean bias error (MBE) as a function of ordinal day. Daily snow depth can be derived from lower-frequency measurements in multiple ways, depending on the application. Seasonal plots of snow course data typically show the interpolated snow depth record, and a daily record may be obtained by applying linear interpolation between the less frequent survey measurements. However, in an operational or other near-real-time setting, it may be more appropriate to use the value from the most recent survey as an estimate of current conditions until a subsequent survey is completed, because the interpolated record can only be calculated retrospectively (snowpack modelling using techniques such as data assimilation (e.g. Magnusson et al. 2016) lies outside the scope of this paper). Fig. 2 illustrates how daily interpolated and operational estimates of snow depth may differ, based on one simulated sequence of snow surveys at The Kerries in a single year. The operational approach is likely to provide a more conservative representation of the error in estimates of snow depth, and it was therefore used in this study for the primary analysis, although the interpolated snow depth records were also evaluated to test for any significant differences.
Comparison of the two featured approaches for estimating daily snow depth from simulated snow course records (The Kerries 2014).
In addition, snow course records may be used to calculate seasonal metrics of interest such as peak snow depth, timing of the peak and accumulated centimetre-days (the latter being the integral of the snow depth time series). As mentioned previously, many Australian studies have used such metrics based on data from Spencers Creek, and there is a need to understand how these derived values are affected by survey frequency. Values of these three seasonal metrics were calculated based on each simulated snow survey sequence, grouped by sampling interval and validated against those calculated from the reference datasets.
3.Results
3.1. Frequency and timing of Spencers Creek snow surveys
The total number of snow surveys conducted per year is sensitive to the duration of the snow season and is therefore not a robust metric to compare years. Instead, the mean time between surveys during the snow season was used as a measure of sampling frequency and to quantify changes to measurement strategy over time. Following a period of variability in the 1950s as the snow survey program was established, the mean time between surveys lay between 6 and 8 days for 90% of the years during the period 1961–2020 (Fig. 3a). This interval increased in 2021 and 2022, with fewer surveys taking place in the first part of each season and a greater focus on the period after the peak in snow depth, but decreased slightly again in 2023, partly as a result of an early seasonal peak.
Characteristics of the Spencers Creek snow survey program (1954–2023): (a) mean time between surveys; (b) timing of surveys by day of the week.
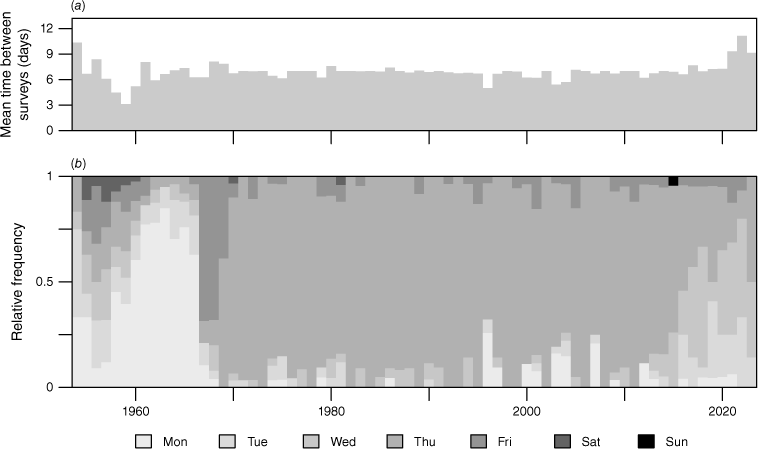
In the historical record, there are seven instances of the time between surveys exceeding 20 days, most recently in 1981. The maximum recorded interval was 40 days, in 1956. Two 19-day spacings in 2022 constitute the maximum time between surveys in the past decade.
The timing of snow surveys by day of the week gives an additional perspective on changes that have been made to survey strategy in the past. In the first few years of the record, there was no clear preference for sampling day, and the presence of a workers’ camp at Spencers Creek allowed a small number of surveys to be conducted on Saturday (Fig. 3b). Surveys were most frequently made on Monday between 1958 and 1966, on Friday in 1967 and 1968, then on Thursday from 1969 until 2015. This long-term focus on Thursday was initially in support of the perceived value of the measurements to local weekend tourism rather than for any scientific or operational reason. Since 2016, prioritisation of field personnel safety and operational flexibility have seen the timing of the surveys spread more evenly across the working week, but particularly between Tuesday and Thursday.
3.2. Simulated snow surveys from automatic measurements
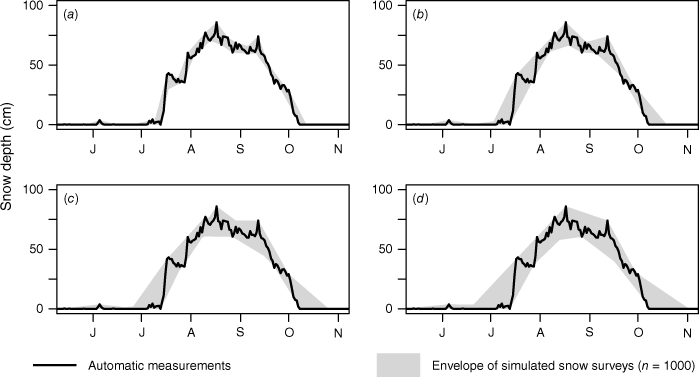
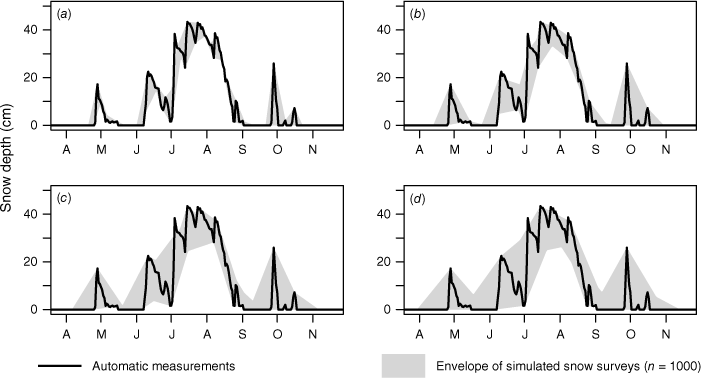
Snow survey sequences were simulated from automatic measurements of snow depth at The Kerries and Cabramurra Airstrip. Fig. 4 and 5 illustrate the influence that the sampling interval has on the representation of a snow season. Each shaded area represents the ensemble of simulated snow survey sequences at the given interval. Qualitatively, deviations of the various sequences from the daily-resolution curves show that the overall accuracy of such a sequence tends to decrease with an increasing sampling interval. A 1-week interval may provide a reasonable depiction in many respects, although there may be variability at shorter time scales that is not well represented. At the longer intervals, there is some potential for the overall shape of the curve to be adequately represented when the snowpack is reasonably persistent, though this depends on the timing of the surveys relative to the main accumulation and ablation events and may not extend to all quantitative aspects. A fair representation becomes increasingly unlikely in marginal locations or seasons where there may be one or more full accumulation–ablation cycles between successive surveys, giving a lower probability of the accurate portrayal or even detection of transient snow (e.g. Fig 5c, d, April–May and September–October events).
Illustrative impact of snow survey frequency on the representation of snowpack behaviour at The Kerries (2015), based on sampling intervals of (a) 1 week, (b) 2 weeks, (c) 3 weeks and (d) 4 weeks.
As in Fig. 4, for Cabramurra Airstrip (2009) based on sampling intervals of (a) 1 week, (b) 2 weeks, (c) 3 weeks and (d) 4 weeks.
3.3. Uncertainty in snow depth
The MAE and MBE statistics for daily snow depth estimated from the simulated snow survey sequences are provided for The Kerries and Cabramurra Airstrip in Tables 2 and 3 respectively. These values are a measure of the overall uncertainty in each month, with error in the estimates always zero on the day of a survey. Intra-annual variations in MAE averaged over all years in the respective datasets are also displayed in Fig. 6.
| Metric | Sampling interval (weeks) | May | June | July | August | September | October | |
|---|---|---|---|---|---|---|---|---|
| MAE (cm) | 1 | 4.9 | 6.5 | 7.0 | 7.5 | 8.5 | 10.8 | |
| 2 | 6.5 | 10.6 | 11.3 | 11.4 | 13.2 | 20.6 | ||
| 3 | 6.9 | 13.6 | 15.4 | 14.8 | 16.9 | 28.3 | ||
| 4 | 6.9 | 15.6 | 18.9 | 18.3 | 19.7 | 34.6 | ||
| MBE (cm) | 1 | −1.5 | −3.1 | −3.7 | −2.6 | 5.3 | 9.2 | |
| 2 | −2.1 | −6.3 | −8.1 | −5.5 | 9.5 | 18.7 | ||
| 3 | −2.9 | −9.1 | −12.4 | −8.7 | 12.6 | 26.8 | ||
| 4 | −3.4 | −11.5 | −15.9 | −12.3 | 14.2 | 33.4 |
| Metric | Sampling interval (weeks) | May | June | July | August | September | October | |
|---|---|---|---|---|---|---|---|---|
| MAE (cm) | 1 | 2.9 | 4.1 | 5.3 | 6.0 | 5.1 | 3.2 | |
| 2 | 3.6 | 5.7 | 8.4 | 9.4 | 8.4 | 3.4 | ||
| 3 | 3.8 | 6.4 | 10.7 | 12.0 | 11.2 | 3.4 | ||
| 4 | 4.0 | 6.7 | 13.0 | 14.2 | 13.1 | 3.7 | ||
| MBE (cm) | 1 | 0.4 | −1.6 | −2.2 | 0.6 | 3.2 | 0.7 | |
| 2 | −0.1 | −2.7 | −4.9 | 1.3 | 6.1 | 0.6 | ||
| 3 | −0.5 | −3.8 | −7.6 | 1.3 | 8.4 | 0.6 | ||
| 4 | −0.4 | −4.5 | −10.4 | 1.0 | 9.9 | 0.8 |
Mean absolute error in estimated snow depth at (a) The Kerries and (b) Cabramurra Airstrip for selected sampling intervals. Grey vertical lines show the timing of the peak snow depth in each year in the respective datasets.
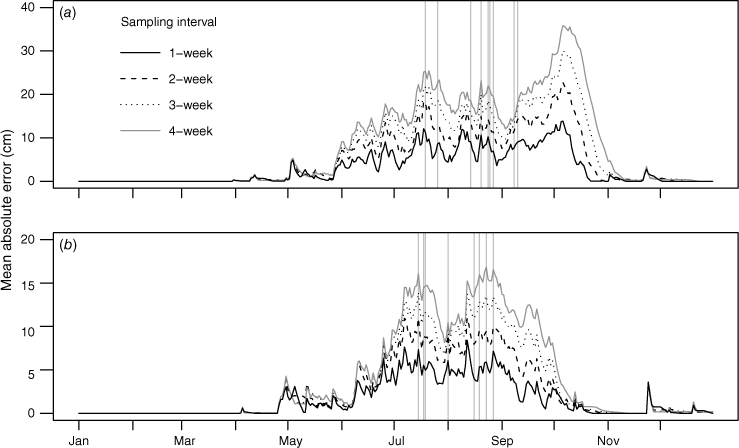
The error in estimated snow depth is influenced by the sampling interval, with MAE increasing when surveys are conducted less frequently. Error is further related to the rate of change of actual snow depth, becoming more significant during periods of rapid accumulation or ablation. There is also some interaction between these terms; where conditions are more stable over time, the impact of the sampling interval becomes less pronounced.
Earlier in the season, negative MBE indicates a tendency for snow depth to be underestimated during periods of accumulation, as any snow falling after the measurement will not be included in the daily estimate. MBE switches from increasingly negative to positive values as ablation becomes climatologically more likely than accumulation and past measurements more frequently overestimate current snow depth. An increase in sampling interval has a proportionally higher effect on MBE than it does on MAE.
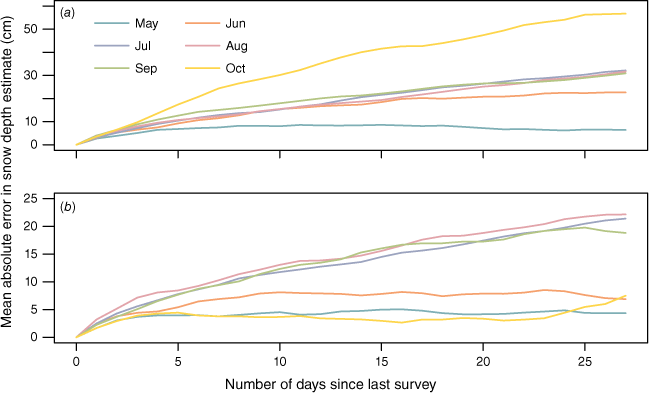
In order to further investigate the impact of the length of time between surveys, MAE was plotted as a function of time since the last survey (Fig. 7). Error tended to increase with greater time between surveys but with some notable caveats. For most months, the largest fraction of the error developed in the first week after the survey was completed, with the rate of increase slowing given additional time without another survey. The main exception to the latter point was observed in October at The Kerries: at a site with persistent snow, continuing ablation towards the end of the season leads to an increasingly positive bias over time. During the shoulder months (particularly May at The Kerries, and May and October at Cabramurra Airstrip), error did not increase significantly after the first 3–5 days as lower and more variable snow depths did not allow residuals to continue to accumulate over time.
Mean absolute error in estimated snow depth as a function of time elapsed since last snow survey at (a) The Kerries and (b) Cabramurra Airstrip.
As mentioned in Section 2, evaluating the interpolated snow depth records, rather than the operational estimates, against the reference dataset would have an impact on the uncertainty metrics presented. Although these results are not shown here in full, the magnitude of both MAE and MBE were somewhat less for the interpolated record, as anticipated, and the MBE did not retain the clear seasonal variation reported above.
3.4. Uncertainty in seasonal metrics
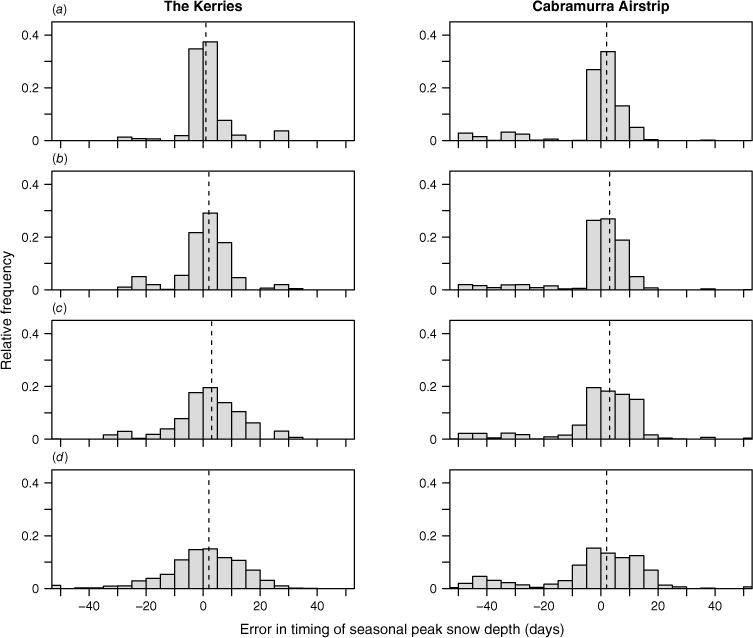
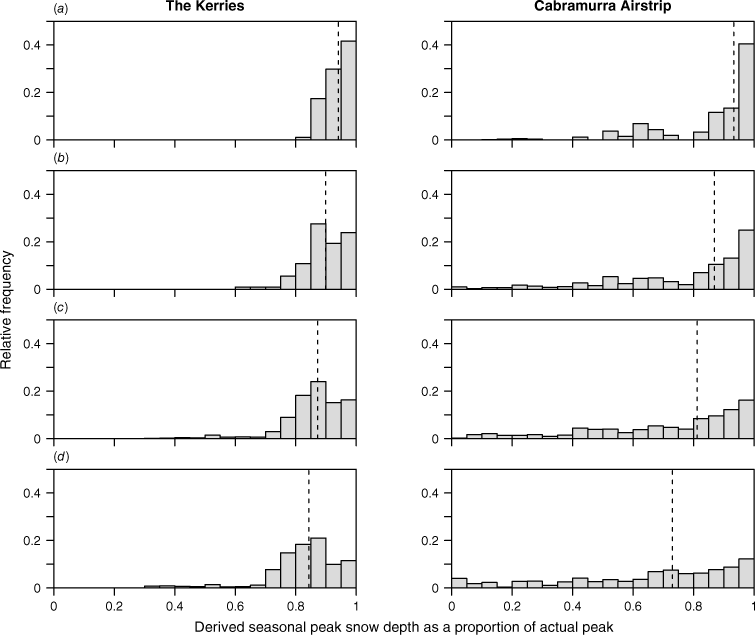
The frequency of snow surveys affected the calculation of all of the seasonal metrics considered here. Peak snow depth derived from snow course records will always be less than or equal to the true maximum snow depth for the season, and measured peaks were increasingly likely to deviate from the actual values with longer sampling intervals (Fig. 8). This was particularly the case for marginal snow, with a proportionally smaller deviation where the snow was more persistent.
Impact of snow survey frequency on estimation of seasonal peak snow depth at The Kerries and Cabramurra Airstrip, for sampling intervals of (a) 1 week, (b) 2 weeks, (c) 3 weeks and (d) 4 weeks. Dashed lines indicate median values.
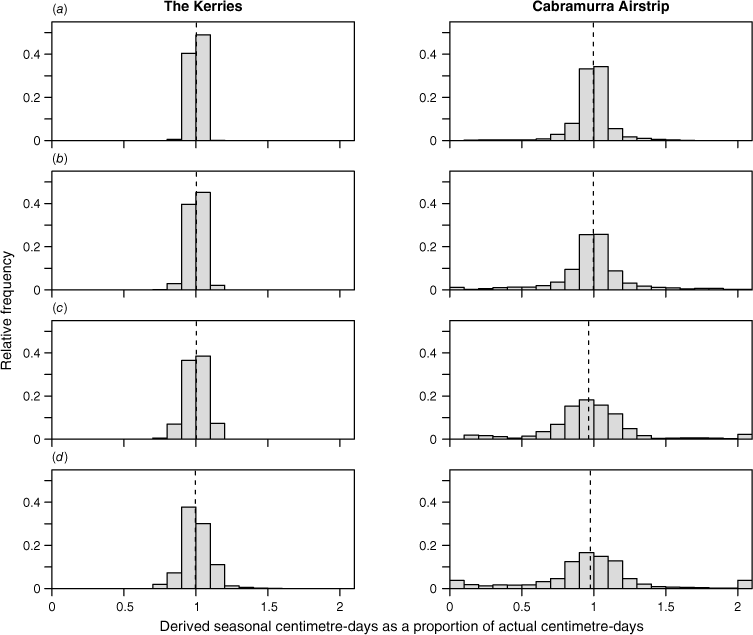
For both the timing of the peak snow depth (Fig. 9) and seasonal centimetre-days (Fig. 10), the primary impact of a longer sampling interval was an increase in uncertainty. The timing of the peak was positively biased (that is, the estimated peak occurred later than the actual seasonal peak) at both locations for all intervals considered, although the magnitude of the mean bias was small (1–3 days) and there was not a consistent increase with less frequent surveys.
4.Discussion
In the previous section, uncertainty metrics were presented for snow depth at two point locations in the Australian Alps. Importantly, these values include only the uncertainty resulting from the temporal sampling of a continually varying snowpack, which has not previously been investigated in this setting. Other sources of error, arising from the measurement process or the use of snow course point data to represent other locations or scales, are not within the scope of this analysis but may be significant (Bilish et al. 2019).
4.1. Residual uncertainty in weekly surveys
The three primary snow courses in New South Wales – Spencers Creek, Deep Creek and Three Mile Dam – have been surveyed weekly over much of their history, yet it is essential to note that, even at this resolution, these records have always provided only an approximation of temporal variability at the snow courses. A key outcome of the current work is the quantification of the residual uncertainty likely to be present in Australian long-term snow depth records. This has been made possible by the collection of high-frequency snow depth data using automatic instruments, as such an analysis could not be performed using only the snow course records themselves. This uncertainty propagates into any analysis making use of these datasets and should be considered in such studies during the interpretation of results.
The use of snow course records to calculate seasonal metrics results in a spread in each metric for all sampling intervals examined here (Fig. 8–10). This indicates that these calculations are affected by the timing of each survey relative to the underlying temporal variability in the snowpack even when surveys are conducted frequently. The exact impact may only be discernible retrospectively. In practice, the scheduling of a survey is likely to be determined by a combination of logistical and operational factors. For example, in anticipation of a significant accumulation event, it may be preferable to delay sampling until after snowfall has stopped as this may help the measurements to retain their relevance for longer. By contrast, a survey may preferentially be scheduled ahead of a predicted melt event in order to forecast potential runoff, though the measurements would then be expected to be less representative of the snowpack after the conclusion of the event. In either case, the prioritisation of measurements at a particular point in time must be balanced against the reduced accuracy on the other side of an event. Similar considerations apply even if the scheduling of surveys is carried out less actively (for example, if sampling were to routinely occur on the same day each week); overall accuracy relates to how well the sampled dataset is able to represent the higher frequency variability present in the environment.
4.2. Potential impact of changes to snow surveys
A reduction in the frequency of snow surveys leads to an increase in uncertainty, whether considered in terms of the representation of snow depth at a point in time or of the various metrics used to characterise and compare snow seasons. It is, however, essential to assess any increase against an appropriate baseline, because a change in the nominal frequency does not introduce a new source of uncertainty to the data but, rather, involves the modification of a source that has been present throughout the historical record. The accuracy metrics presented in this paper provide one means of doing so objectively.
In one sense, the values provide a relatively conservative representation, at least in terms of the impact of survey frequency on the seasonal metrics, as the analysis assumes that a fixed nominal frequency is applied throughout the season. Between 2021 and 2023, surveys at Spencers Creek occurred less frequently at the start of the season and returned to a near-weekly frequency during the period of more significant ablation. Where there has been a mixed sampling interval, the overall uncertainty in the seasonal metrics would have been somewhat less than that had the longer interval been applied throughout the season. Of particular note from a planning perspective, however, is that it is not possible to reliably anticipate when the seasonal peak will occur. If a key objective is to obtain an accurate representation of snowpack conditions from the time of the peak, it is recommended that a conservative approach be adopted to ensure that weekly surveys have commenced prior to the peak even in the event of a moderately early occurrence.
With respect to the uncertainty in estimated snow depth, these values have been calculated over the snow season (Fig. 6) and also averaged by month (Tables 1 and 2), so evaluating the impact of a mixed sampling interval is more straightforward. As the effect of reducing sampling frequency is greatest when snow depth is changing most rapidly, it follows that the best return on maintaining frequent sampling occurs at these times. For a persistent snowpack – at The Kerries (Fig. 6a) and, even more so, at Spencers Creek – this generally occurs later in the season. This suggests that, assuming a constrained number of snow surveys annually, the decision to have an increased focus on the second half of the season is justified at the present time in terms of the benefit to the overall representation of snow depth, aside from the clear value to snowmelt forecasting at this time of the year.
Minor procedural considerations such as the careful selection of the timing of the start-of-season zero point provide an incremental benefit to the overall accuracy of the record at little to no cost and may help mitigate the impact of any increase in the mean sampling interval. The first zero point is typically inserted into the snow depth record once the first non-zero snow survey has been completed. It is, itself, not necessarily the direct result of a site visit, as it can be estimated with a very high degree of confidence and is best placed close to the start of actual accumulation, regardless of the nominal sampling interval. Operational decisions of this type can be optimised by making use of recent observations from field personnel, webcam imagery and telemetered measurements of precipitation, air temperature and snow depth from nearby stations.
4.3. Snowpack persistence and marginality
A comparison of the results from The Kerries and Cabramurra Airstrip shows snowpack persistence to be an important factor in the uncertainty in snow course records. It is worth considering the implications for snowpack measurements in Australia, in the context of both existing spatio-temporal variability and likely future changes in a warming climate.
The results from The Kerries, particularly those regarding the impact of survey frequency, are likely to be broadly applicable to sites at the higher elevations, including the Spencers Creek snow course. Quantitatively, it is hypothesised that the latter, less than 100 m higher in elevation than The Kerries but located in an identified zone of persistent snow, may be subject to slightly higher absolute errors through the season but lower proportional uncertainty in the seasonal metrics.
The Australian Alps constitute a marginal snow environment, in which the traditional conceptual model of a single, well-defined accumulation season followed by an ablation season frequently does not apply. Much of the snow-covered area, particularly at the lower elevations, has ephemeral properties (Sanecki et al. 2006) while ablation (i.e. snowmelt) can occur throughout the season even as the snowpack as a whole is accumulating (Bilish et al. 2019). As a result, many of the assumptions behind the use of snow courses are already being challenged.
Although the Spencers Creek snow course tends to conform with the stable accumulation–ablation model at the present time, this may not continue to be the case indefinitely with continued warming and increasing marginality. The dynamic scheduling of snow surveys, where particular emphasis is placed on periods of change at any point in the season by assessing available ancillary information (such as described in Section 4.2), is already a beneficial approach but will become more important with increasing temporal variability and early-season snowmelt.
At the lower elevations and in the more ephemeral zones, uncertainty in snow depth and the main seasonal metrics is proportionally higher, with snow surveys performed at a given frequency less able to adequately represent the higher temporal variability. Although sometimes disregarded in favour of areas with more consistent snow, there may be sound justification for the measurement of ephemeral snow, because it makes up an important component of the total snow-covered area in the Australian Alps and, being highly vulnerable to change, may be an environment of specific interest. However, while acknowledging the value of existing long-term records, we contend that the temporal frequency offered by snow courses is not suitable for the measurement of snow at the most marginal sites, where even weekly surveys may poorly represent snow depth variability and provide limited useful information for hydrological forecasting. Instead, automatic instruments that allow higher frequency measurements to be made available in (near-) real-time offer much greater potential for understanding snowpack variability in this particular environment.
5.Conclusions
This study investigated the relationship between the frequency of measurements in a snow depth record and its ability to represent actual snowpack variability over time. Reductions in simulated snow survey frequency led to increases in uncertainty in estimates of snow depth as well as in the derived seasonal metrics of peak snow depth, timing of the peak and accumulated centimetre-days. Even so, the inherent uncertainty in the simulated snow course datasets based on weekly surveys was found to be consistently greater than the increase in uncertainty associated with a theoretical change to fortnightly surveys. This does not negate the impact of a change in snow survey frequency, though it is important that any such change is viewed in the context of the comparable uncertainty in the historical snow course datasets, which, to the authors’ knowledge, has not been quantified or discussed in the literature previously.
The seasonal snowpack in the Australian Alps exhibits high interannual variability as well as being responsive to a changing climate, and the need for snowpack measurement programs to be well designed remains as critical as ever. Automatic measurements offer significant opportunities to better understand and represent the spatial and temporal variability of the snowpack, building on the valuable long-term manual records that exist, yet not immediately superseding them. Importantly, both manual and automatic measurements must continue to meet specific user needs and be fit for purpose in a changing environment.
Data availability
The Snowy Hydro website (www.snowyhydro.com.au) displays snow depths for public information and is updated throughout each snow season. More comprehensive quality-controlled datasets may be available to researchers through a data licence agreement.
Declaration of funding
This research was completed within the scope of the authors’ employment by Snowy Hydro Ltd and did not receive any specific funding.
Acknowledgements
The authors thank Suzanne Kenyon, James Pirozzi and Jeremy Kinley for their support of this research and their comments on the manuscript. The contributions of two anonymous reviewers and the Associate Editor are also acknowledged with thanks.
References
Bilish SP, McGowan HA, Callow JN (2018) Energy balance and snowmelt drivers of a marginal subalpine snowpack. Hydrological Processes 32, 3837-3851.
| Crossref | Google Scholar |
Bilish SP, Callow JN, McGrath GS, McGowan HA (2019) Spatial controls on the distribution and dynamics of a marginal snowpack in the Australian Alps. Hydrological Processes 33, 1739-1755.
| Crossref | Google Scholar |
Bilish SP, Callow JN, McGowan HA (2020) Streamflow variability and the role of snowmelt in a marginal snow environment. Arctic, Antarctic, and Alpine Research 52, 161-176.
| Crossref | Google Scholar |
Bormann KJ, McCabe MF, Evans JP (2012) Satellite based observations for seasonal snow cover detection and characterisation in Australia. Remote Sensing of Environment 123, 57-71.
| Crossref | Google Scholar |
Bormann KJ, Westra S, Evans JP, McCabe MF (2013) Spatial and temporal variability in seasonal snow density. Journal of Hydrology 484, 63-73.
| Crossref | Google Scholar |
Bormann KJ, Evans JP, McCabe MF (2014) Constraining snowmelt in a temperature‐index model using simulated snow densities. Journal of Hydrology 517, 652-667.
| Crossref | Google Scholar |
Brown RD, Fang B, Mudryk L (2019) Update of Canadian historical snow survey data and analysis of snow water equivalent trends, 1967–2016. Atmosphere-Ocean 57(2), 149-156.
| Crossref | Google Scholar |
Budin GR (1985) Interannual variability of Australian snowfall. Australian Meteorological Magazine 33, 145-159.
| Google Scholar |
Davis CJ (2013) Towards the development of long‐term winter records for the Snowy Mountains. Australian Meteorological and Oceanographic Journal 63, 303-313.
| Crossref | Google Scholar |
Di Luca A, Evans JP, Ji F (2018) Australian snowpack in the NARCliM ensemble: evaluation, bias correction and future projections. Climate Dynamics 51, 639-666.
| Crossref | Google Scholar |
Donohue RJ, Roderick ML, McVicar TR (2011) Assessing the differences in sensitivities of runoff to changes in climatic conditions across a large basin. Journal of Hydrology 406, 234-244.
| Crossref | Google Scholar |
Dressler KA, Fassnacht SR, Bales RC (2006) A comparison of snow telemetry and snow course measurements in the Colorado River Basin. Journal of Hydrometeorology 7, 705-712.
| Google Scholar |
Edmonds T, Lunt ID, Roshier DA, Louis J (2006) Annual variation in the distribution of summer snowdrifts in the Kosciuszko alpine area, Australia, and its effect on the composition and structure of alpine vegetation. Austral Ecology 31, 837-848.
| Crossref | Google Scholar |
Fiddes SL, Pezza AB, Barras V (2015) A new perspective on Australian snow. Atmospheric Science Letters 16, 246-252.
| Crossref | Google Scholar |
Green K, Pickering CM (2009) The decline of snowpatches in the Snowy Mountains of Australia: importance of climate warming, variable snow, and wind. Arctic, Antarctic, and Alpine Research 41, 212-218.
| Crossref | Google Scholar |
Ji F, Nishant N, Evans JP, Di Luca A, Di Virgilio G, Cheung KKW, Tam E, Beyer K, Riley ML (2022) Rapid warming in the Australian Alps from observation and NARCliM simulations. Atmosphere 13, 1686.
| Crossref | Google Scholar |
López-Moreno JI, Callow N, McGowan H, Webb R, Schwartz A, Bilish S, Revuelto J, Gascoin S, Deschamps-Berger C, Alonso-González E (2024) Marginal snowpacks: the basis for a global definition and existing research needs. Earth-Science Reviews 252, 104751.
| Crossref | Google Scholar |
Magnusson J, Winstral A, Stordal AS, Essery R, Jonas T (2016) Improving physically based snow simulations by assimilating snow depths using the particle filter. Water Resources Research 53, 1125-1143.
| Crossref | Google Scholar |
McGowan HA, Callow JN, Soderholm J, McGrath GS, Campbell M, Zhao J (2018) Global warming in the context of 2000 years of Australian alpine temperature and snow cover. Scientific Reports 8, 4394.
| Crossref | Google Scholar | PubMed |
Nicholls N (2005) Climate variability, climate change and the Australian snow season. Australian Meteorological Magazine 54, 177-185.
| Google Scholar |
Pepler AS, Trewin B, Ganter C (2015) The influences of climate drivers on the Australian snow season. Australian Meteorological and Oceanographic Journal 65, 195-205.
| Crossref | Google Scholar |
Rasouli AA, Cheung KKW, Mohammadzadeh Alajujeh K, Ji F (2022) On the detection of snow cover changes over the Australian Snowy Mountains using a dynamic OBIA approach. Atmosphere 13, 826.
| Crossref | Google Scholar |
Sanecki GM, Green K, Wood H, Lindenmayer D (2006) The characteristics and classification of Australian snow cover: an ecological perspective. Arctic, Antarctic, and Alpine Research 38, 429-435.
| Crossref | Google Scholar |
Thompson JA (2016) A MODIS-derived snow climatology (2000−2014) for the Australian Alps. Climate Research 68, 25-38.
| Crossref | Google Scholar |
Verrall B, Norman P, Mackey B, Fisher S, Dodd J (2023) The impact of climate change and wildfire on decadal alpine vegetation dynamics. Australian Journal of Botany 71, 231-251.
| Crossref | Google Scholar |

