Tornado scar on the Nullarbor Plain, Australia
Matej Lipar A B *
A B *
A
B
Abstract
A newly discovered erosional scar on the Nullarbor Plain in southern Australia was analysed and hypothesised to be a consequence of a tornado event. The scar, identified using satellite imagery, stretches ~11 km in length and varies between 160 and 250 m in width, with notable cycloidal marks indicating activity of suction vortexes. The timing of the scar formation, constrained by Landsat and Sentinel imagery, is between 16 and 18 November 2022, coinciding with a significant weather event on 17 November 2022. The scar’s characteristics and the associated weather patterns strongly suggest it was formed by a tornado. Based on the scar’s dimensions and the pattern of cycloidal marks, the tornado’s strength is estimated to be within the F2 or even F3 category on the Fujita scale, with wind speeds likely exceeding 200 km h–1, moving in an eastward direction and swirling clockwise.
Keywords: Australia, climate, erosion, Nullarbor Plain, tornado, tornado path, tornado scar, tornado trail.
1.Introduction
Tornadoes are powerful and destructive weather phenomena characterised by a rotating column of air that extends from the base of the parent cloud updraft, generally a cumulonimbus (Davies-Jones et al. 2001; Markowski and Richardson 2010; Bluestein 2013). These vortices with their funnel-like appearance can cause extensive damage where they contact the ground due to their intense wind speeds and pressure differentials (Bluestein 2013; Elsner et al. 2014).
Most tornadoes last ~10 min, although some have been known to persist for an hour or more. The diameter of tornadoes varies from 10 m to up to 2000 m, and are usually ~200 m (Bluestein 2013). The whirling wind speeds within a tornado can exceed 140 m s–1 (~500 km h–1), but most tornadoes have winds of less than 50 m s–1 (180 km h–1) (Markowski and Richardson 2010; Bluestein 2013). The wind speed scale is expressed in F-scale (Fujita scale) (Fujita 1971a) or EF-scale (Enhanced Fujita scale), which was adopted for the USA (Doswell et al. 2009; Markowski and Richardson 2010; Bluestein 2013).
Tornado paths leave behind a scarred landscape, which can indicate tornado intensity. The focus is most often on damage investigation of buildings and other anthropogenic structures (Monfredo 2003; Marshall et al. 2008), but tornadoes also have significant erosional effects on the earth’s surface, including stripping away topsoil, uprooting vegetation and scouring the ground. These processes can also lead to the formation of distinct features such as cycloidal marks, indicating suction vortexes (Fujita and Smith 1993).
Tornadoes are most commonly found in the Great Plains region of the United States, and in the north-east region of India–Bangladesh; however, they have been reported on every continent except Antarctica (Davies-Jones et al. 2001; Markowski and Richardson 2010). In Australia, tornadoes occur in a wide range of meteorological settings (Allen and Allen 2016). The first documented tornado in Australia occurred in 1795 in the suburbs of Sydney, but the first scientific documentation of such an event did not occur until the late 1800s despite numerous subsequent observations (Allen and Allen 2016). Documented instances of tornadoes in Australia include, for example, the tornado that struck the town of Bucca in Queensland in 1992, causing extensive damage to properties and flora (Harper et al. 2000; Bureau of Meteorology 2024a); the tornado outbreak in New South Wales in 2013, which resulted in considerable agricultural and structural damage (Allen et al. 2021; Bureau of Meteorology 2024a); and a severe thunderstorm outbreak with at least seven tornadoes that affected central and eastern parts of South Australia (Zovko-Rajak et al. 2023).
Accurate prediction and understanding of tornadoes is important, as timely dissemination of warnings helps facilitate protective action (Zovko-Rajak et al. 2023). This requires extensive knowledge of tornado behaviours in general and in specific regions. Many tornado reports are only observational and not officially confirmed through ground surveys (Bureau of Meteorology 2024a). In challenging observational conditions such as blinding rain, nighttime or remoteness of the area, tornado paths can provide useful guidance to forecasters alongside other storm-scale metrics and environmental information (Zovko-Rajak et al. 2023).
In this manuscript, we explore an erosional scar on the Nullarbor Plain (southern Australia) that is hypothesised to be a consequence of a tornado. By analysing the characteristics and timing of this scar, we aim to understand when and in what conditions the tornado occurred and what was its strength.
2.Methods
Google Earth satellite imagery was primarily used to locate the erosional scar. These images were then imported into Global Mapper software to analyse the scar’s dimensional characteristics.
Landsat (Williams et al. 2006) and Sentinel (Berger et al. 2012) satellite data were examined to determine the timeframe of the scar’s appearance. This was performed through online applications ArcGIS Living Atlas of the World (see https://livingatlas.arcgis.com/en/home/) and EO Browser of Sentinel Hub on the Planet Insights Platform (see https://www.sentinel-hub.com/explore/eobrowser/). Natural/true colour images were examined for the visual inspection of the scar sudden appearance, whereas Normalised Difference Water Index (NDWI) images were used to provide additional supporting data on small-scale flooded patches left behind after the presumed tornado-storm event. If NDWI images were not available, terrestrial chlorophyll index (OTCI) images were used; low OTCI values usually signify water, sand or snow.
To link the timing of the scar formation with the local weather, historical weather satellite images showing the cloud cover were obtained through the Meteoblue online application (see https://www.meteoblue.com/). Their satellite data are primarily provided by EUMETSAT, which offers a combination of data from various geostationary and polar-orbiting satellites. These satellites include, but are not limited to, the Meteosat series and Metop satellites. In addition, the rainfall data for Eucla and Forrest meteorological stations, and a summary monthly weather report for the time of scar formation were also obtained from the Australian Bureau of Meteorology webpage (see http://www.bom.gov.au/).
Field work in the area with an erosional scar was conducted in May 2024 to photograph the scar and observe differences between the erosional scar and the neighbouring landscape. The photographs of the storm clouds on the day of the event in November 2022 were taken ~90 km south-west from the scar.
3.Results
3.1. The location and characteristics of the erosional scar
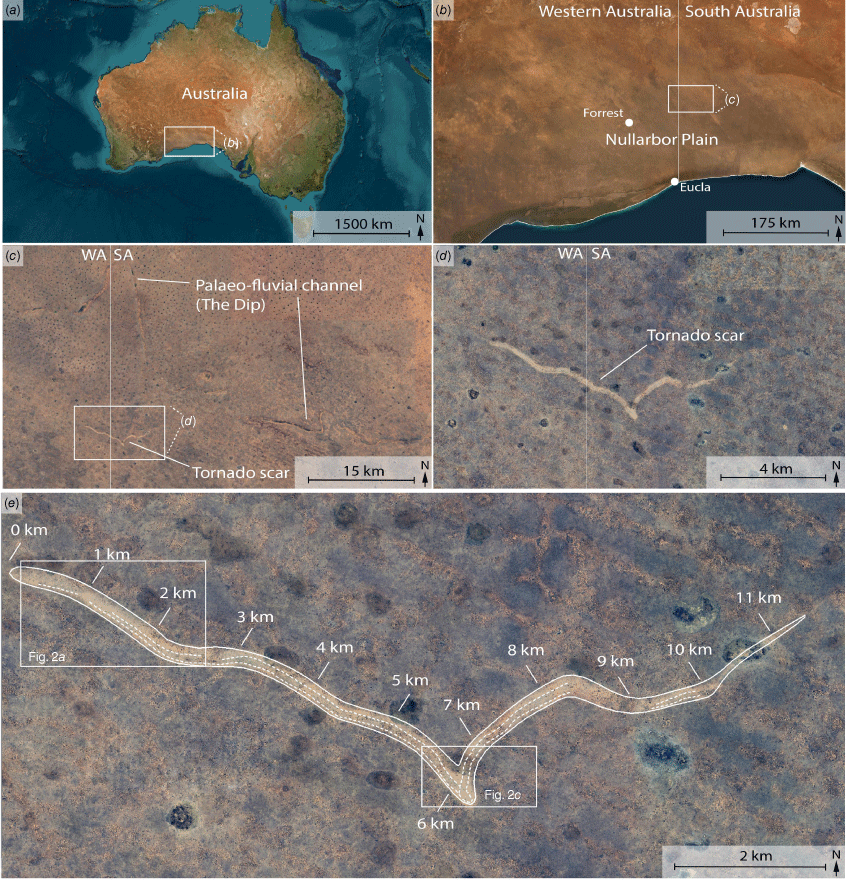
The erosional scar is located in the remote area of the semiarid to arid and treeless Nullarbor Plain in southern Australia, 22 km north of the Trans-Australian Railway and 90 km east-north-east of Forrest (Fig. 1). The scar stretches from Western Australia over the border to South Australia.
The locality map of the erosional scar. The approximate extent of the Nullarbor Plain (a), the scar’s location in relation to Eucla and Forrest (b), and the scar appearance in relation to palaeo-fluvial channels (c). Note main two landform patterns in (d, e), the dayas – darker circular patterns – and shallow ridges and swales (NW to SE direction). In (e), the solid line indicates the outer area of the scar and the dashed line indicates the inner part of the scar with cycloidal marks. Satellite imagery obtained from Google Earth.
The topography where the scar occurs is generally flat. From west to east, in the first 8 km of the scar the landscape slopes downwards only for 2.5 m, whereas at 8–9 km in length the landscape slopes downwards for another 5 m due to vertical tectonical displacement. The other micro-topographical disturbances (generally less than 2 m of relief) are represented by dayases (circular dissolutional depressions; Goudie 2010) and alternating ‘ridges and swales’ topography (Burnett et al. 2020). The surface geology is represented by calcretised middle Cenozoic shallow-water limestone that has been uplifted and exposed to subaerial denudation since the middle Miocene (~14 Ma) (O’Connell et al. 2012). The vegetation is dominated by bluebush, saltbush, tussock grass and succulents, whereas the soils are thin, stony, well-drained loams and sands (Webb and James 2023).
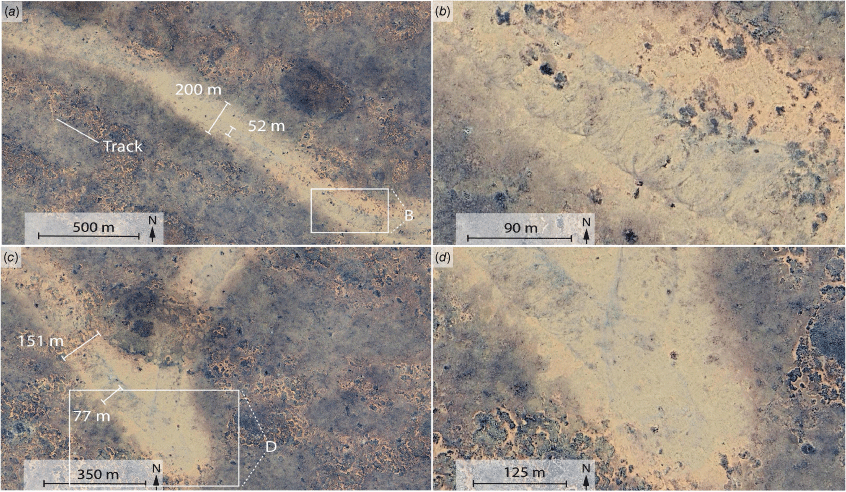
The overall length of the scar is ~10 km with an extra 1.1 km of a narrower ‘fading out’ scar in the east (for the following description of the scar dimensions in this paragraph, see Fig. 1e, which illustrates length in kilometres). The inner part of the scar has cycloidal marks (Fig. 2) and its width ranges within 40–100 m, whereas overall width of the scar is 160–250 m. Examining from west to east based on the Google satellite images dated to 13 September 2023 (0–9 km) and 26 March 2024 (9–11 km), the inner part of the scar with cycloidal marks becomes noticeable ~350 m after the overall scar begins, but its true width can only be determined at ~1.3 km in length, which begins with ~40 m and grows to more than 90 m at ~2.5 km in length (Fig. 2a). The overall scar width ranges within 215–240 m. At ~2.6–2.8 km in length, the inner scar becomes blurred out, but becomes notable again at ~2.9 km in length with ~56 m of width, which sporadically widens to ~90 m at 3.2 km in length. In the next few kilometres, the width of the inner scar ranges within 75–90 m, whereas the width of the whole scar is 210–230 m. After 6 km in length, the path direction suddenly changes (loops) from south-east to north and after 7 km towards the north-east (Fig. 2c, d). During the change in direction, the width of the inner part of the scar remains at 75–80 m, and the width of the whole scar remains at 200–210 m. At ~8 km in length the inner scar widens to more than 100 m, being the widest during the entire track, and the whole scar up to 250 m. At 8.2 km in length the inner part of the scar becomes untraceable and the path direction changes towards the east-south-east, and at 9 km in length again towards the east-north-east. The overall width decreases to ~160 m. The inner part of the scar is visible again at 9–10 km in length with width of 40–64 m. From 10 km in length, the overall scar direction turns towards the north-east for another 1.1 km with ~40–50 m visible diameter.
Cycloidal marks. (a, b) Cycloidal marks on the western side of the scar (see Fig. 1e for location details). (c, d) An area where the proposed tornado made a small loop.
3.2. The timing of erosional scar appearance and climatic conditions at that time
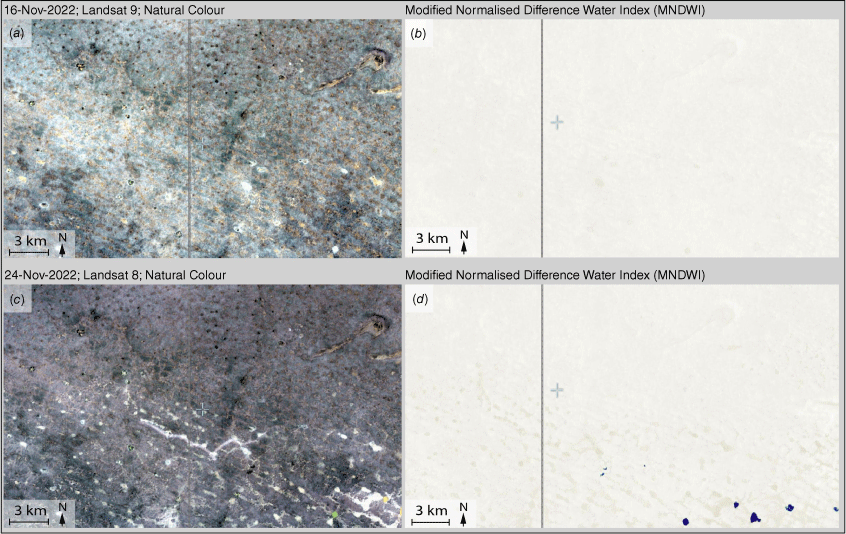
Inspection of visible Landsat indicates that scar formation occurred between the 16 and 24 November 2022 satellite passes (Fig. 3a, c; Landsat 8 and 9). In addition, Sentinel-2 imagery bounds the formation of the scar between 11 and 22 November 2022 (Fig. 4a, c), and Sentinel-3 imagery bounds the formation of the scar between 16 and 18 November 2022 (Fig. 4e, f), which is the narrowest timeframe that was possible to obtain.
Landsat satellite imagery before (a, b) and after (c, d) the appearance of the scar. Note blue circular patterns on the MNDWI image (d) that appeared together with the scar, indicating standing flooded dayases. Imagery obtained from ArcGIS Living Atlas of the World (see https://livingatlas.arcgis.com/en/home/).
Sentinel satellite imagery before (a, b, e, f) and after (c, d, g, h) the appearance of the scar. Note the flooded areas in NDWI and OTCI images (d, h) after the appearance of the scar, indicating a rainfall event. The imagery obtained from EO Browser of Sentinel Hub on the Planet Insights Platform (see https://www.sentinel-hub.com/explore/eobrowser/).
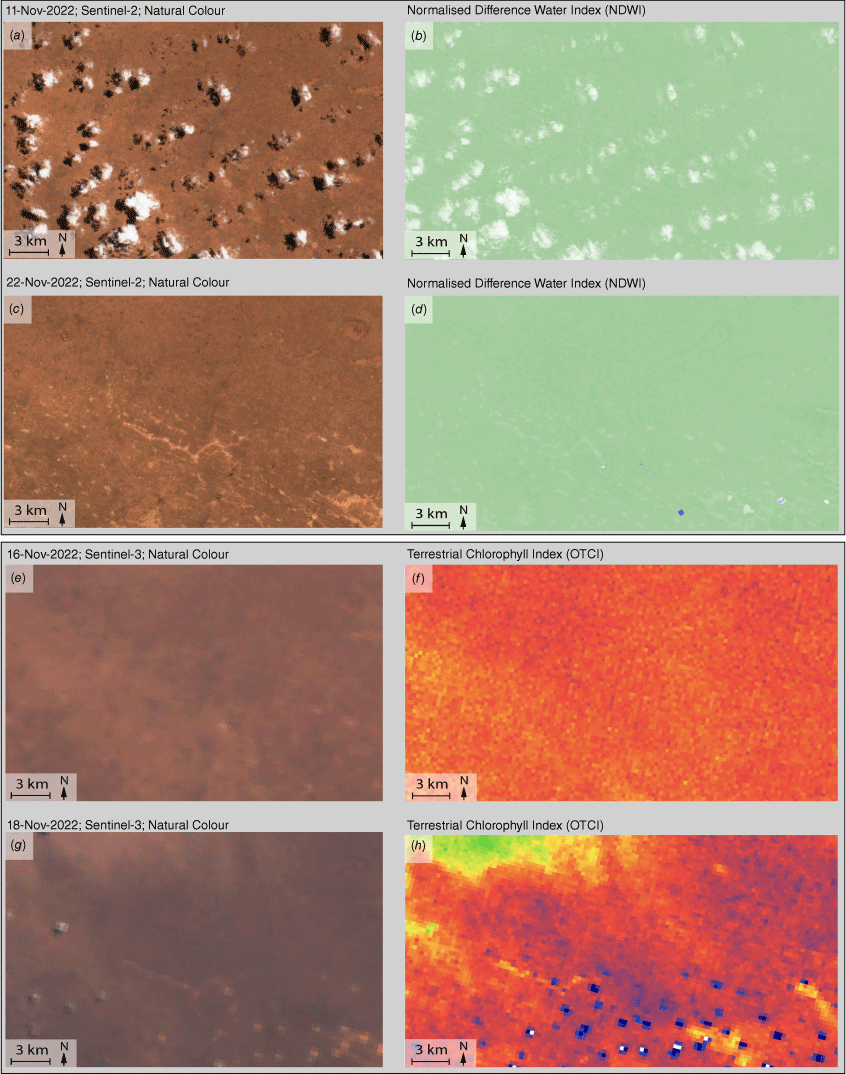
All acquired satellite timeframes show flooded areas after the formation of the scar, whereas prior to formation of the scar no water was detected (see Fig. 3b, d for Landsat comparison, Fig. 4b, d for Sentinel-2 comparison, and Fig. 4f, h for Sentinel-3 comparison). Flooded areas appear as circular shapes because the water remained for longest in impermeable clay-rich circular dayas depressions.
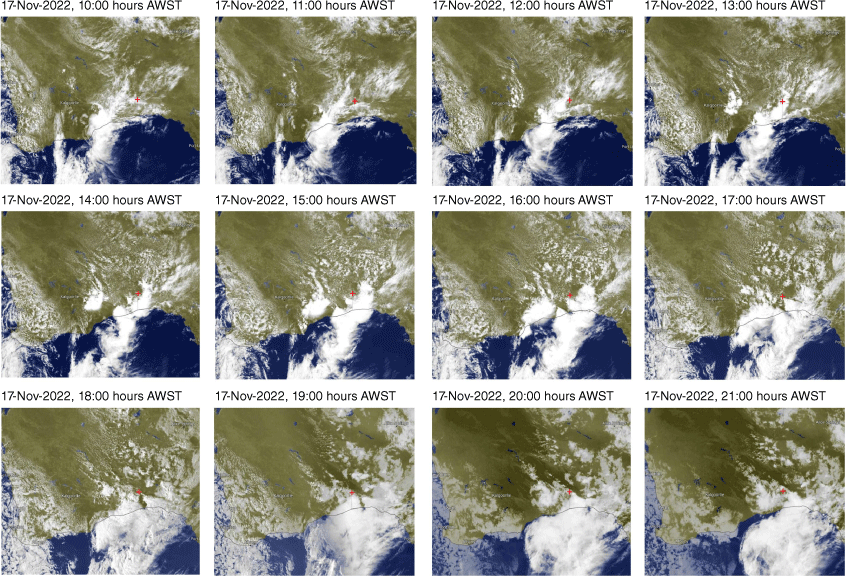
Cloud imagery from Meteoblue on 17 November 2022 above Australia indicates passing of the strong front from west to east, with the most intensive cloud cover around the region of the erosional scar c. 16:00 and 19:00 hours local Australian Western Standard Time (AWST; UTC +8; Fig. 5). The closest Australian Bureau of Meteorology rain gauges located at Forrest (90 km west-south-west) and Eucla (124 km south) measured significant daily rainfall accumulations from the event (which are reported at 09:00 hours AWST for the preceding 24-h period) (Table 1) (Bureau of Meteorology 2024b).
Weather satellite images for Australia on 17 November 2022. The red symbol marks the location of the tornado scar. The imagery obtained from Meteoblue online application (see https://www.meteoblue.com/).
| Rainfall (mm) | |||
|---|---|---|---|
| Dates in November 2022 | Eucla | Forrest | |
| 14 | 1.8 | 0 | |
| 15 | 1 | 0 | |
| 16 | 0 | 0 | |
| 17 | 0 | 0 | |
| 18 | 42.8 | 12.8 | |
| 19 | 0 | 0 | |
| 20 | 0.2 | 0 | |
| 21 | 0 | 0 | |
| 22 | 0 | 0 | |
See Fig. 1b for location of the weather stations.
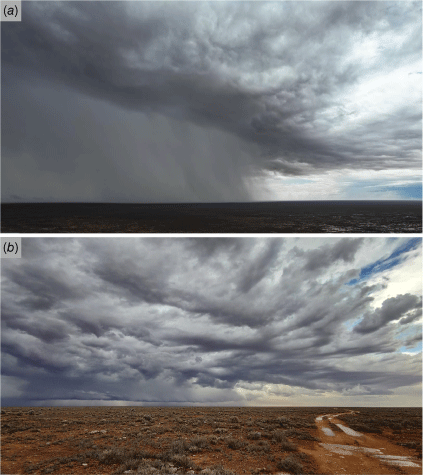
On 17 November 2022, photo documentation taken 90 km south-west from the scar clearly indicates major storms and a high amount of rain, evident by the flooded landscape immediately after the storms (Fig. 6).
Passing storms on 17 November 2022 as seen at 12:00 (a) and at 17:00 hours AWST (b). In both instances the camera is facing north-north-westwards. Note that these particular thunderstorms in the photographs did not produce the tornado as they appeared ~90 km south-west from the scar; however, they nevertheless illustrate the convective environment on this particular date.
4.Discussion
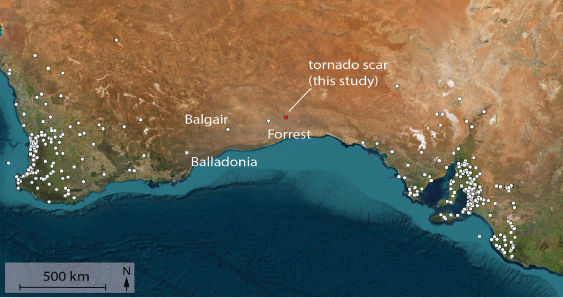
The erosional scar observed on the Nullarbor Plain shows significant characteristics consistent with a strong tornado event. It differs from the linear features on the Nullarbor Plain, discovered in infrared images, which are the result of storm tracks crossing the plain and are much greater in size (up to 400 km long and 10–20 km wide) (Barton and Prata 2010). Previously reported tornadoes on the Nullarbor Plain are rare. Data from the Severe Thunderstorm Archive, developed by the Bureau of Meteorology only holds three records of tornadoes for the region (Fig. 7). The most likely reasons for very few documented events on the Nullarbor Plain are that they are unreported due to the remoteness of the area and consequently the lack of eye witnesses and direct damage to properties and infrastructure. The closest documented tornado occurred near Forrest on 9 November 1986, followed by the tornado near Balgair (~25 km west of Rawlinna) on 12 November 1997. The westernmost one near Balladonia was reported on 29 November 1982. Interestingly, all of the reported tornadoes, including the one discussed in this study, occurred in November.
Tornado events location for Western Australia and South Australia based on the Severe Thunderstorm Archive, developed by the Australian Bureau of Meteorology (data from 1795 to 2014). The location of the tornado scar in the study is shown with a red marker.
The most convincing tornado characteristics are cycloidal marks of the inner part of the scar, also reported, for example, for the North Platte Valley (Nebraska, USA) tornado outbreak of in 1955 (Van Tassel 1955), Barrington (Illinois, USA) Tornado in 1967 (Fujita and Smith 1993) and Parersburg (Iowa, USA) Tornado in 2008 (Marshall et al. 2008). An illustrative collection of cycloidal marks is provided by Fujita (1981) in figure 14 therein. The cycloidal marks are usually a band of debris deposit and represent a suction vortex action of a tornado; due to the enhanced convergence but smaller diameter than that of the parent tornado, the vortex gathers near-ground debris towards its rotation axis but cannot pick up debris directly at the centre of rotation, leaving a narrow band of debris along its path (Fujita 1971b; Fujita and Smith 1993). The observational discontinuity of the suction vortex cycloidal marks on the Nullarbor Plain are most likely due to change in vegetation as noticeable on satellite images, but it is also possible that the initial vortex dissipated and was later reformed. This rapidly changing nature of orbiting vortexes (and even multiple simultaneous vortexes in one tornado) is explained in detail by Fujita and Smith (1993).
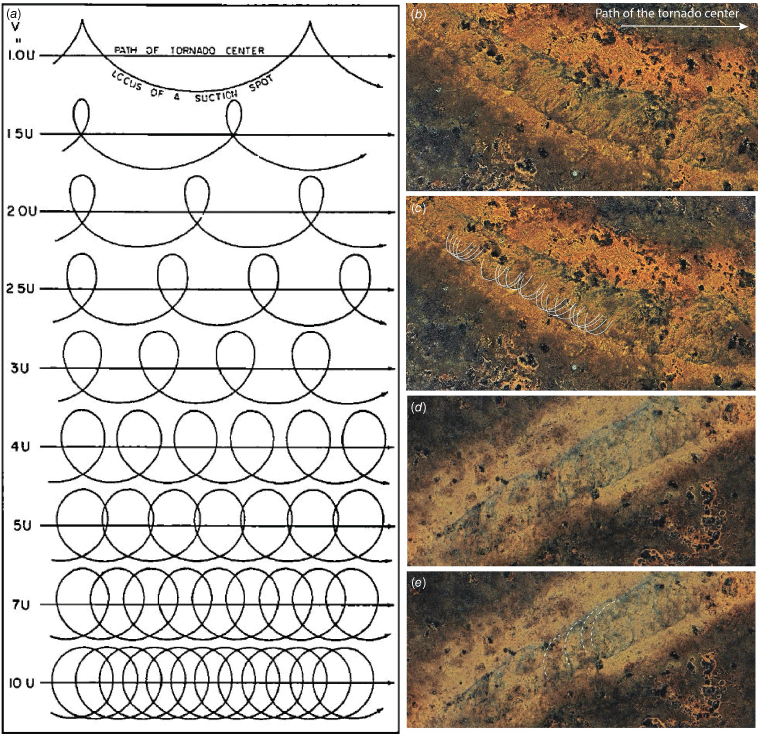
Fujita et al. (1970) demonstrated that the shape of a cycloidal mark is directly related to the velocity ratio, defined as the rotational velocity (V) divided by the translational velocity (U). By varying the velocity ratio from 1 to 10, they observed changes in the ground mark shapes (Fig. 8a). At a velocity ratio of 1.00, no loop forms; instead, a suction vortex remains stationary, creating a stepping spot (i.e. where orbiting suction vortices pause momentarily). As the velocity ratio increases, the loop size enlarges, approaching a near-circular shape when the ratio nears 10. The discontinuity of the loop marks of the suction vortexes on the Nullarbor Plain limits the possibility for a complete calculation, but it nevertheless provides two important conclusions. Firstly, the loops themselves indicate that the velocity ratio exceeded 1, whereas the ellipsoidal appearance of the loops indicates that the velocity ratio was smaller than 10 (Fig. 8b, c). Furthermore, due to the large number of overlapping loops in some areas (e.g. clearly noticed in Fig. 8b, c), there were most likely multiple suction vortexes present. Secondly, the positions of the loops in relation to the tornado moving direction indicate that the whirling wind within the tornado had a clockwise direction (Fig. 8d, e). Although this is in accordance with the understanding that tornadoes generally swirl cyclonically, which is clockwise in the southern hemisphere (Fujita 1977), such erosional indicators are important because tornadoes can also swirl anticyclonically, but are usually small and short-lived (Fujita 1977).
Cycloidal marks of tornadoes. The geometric paths of the suction vortexes (a) incorporated in the figure is from Fujita and Smith (1993, their fig. 5). Multiple loops of the cycloidal marks (b–d) identified within the scar on the Nullarbor Plain. Note the well-visible loop pattern in b and d (annotated with white lines in c and e), being more elongated on the northern side of the scar (and moving eastwards), which indicates clockwise swirling of the tornado; this is the opposite when compared to Fujita and Smith (1993) diagram, where elongated loops are located on the southern side (and tornado also moving eastwards).
The sudden change of the Nullarbor tornado path after 6 km in length where it made a distinctive ‘loop’ is not uncommon and was, for example, also reported by Marshall et al. (2008). Furthermore, the predominantly visible edges of the cycloidal marks of the inner scar towards the north in comparison to the scar towards the south-east at the section where tornado made a loop suggests its superimposition on the latest and consequently the direction of the tornado from west to east. This corresponds also to the general west-to-east moving fronts in this region (Bureau of Meteorology 2022).
No significant landscape features were found to influence the tornado behaviour, as the region is largely flat. Minor features, such as dayas and ‘ridges and swales’ provide less than 2 m of relief, which is insufficient to markedly affect the tornado’s dynamics.
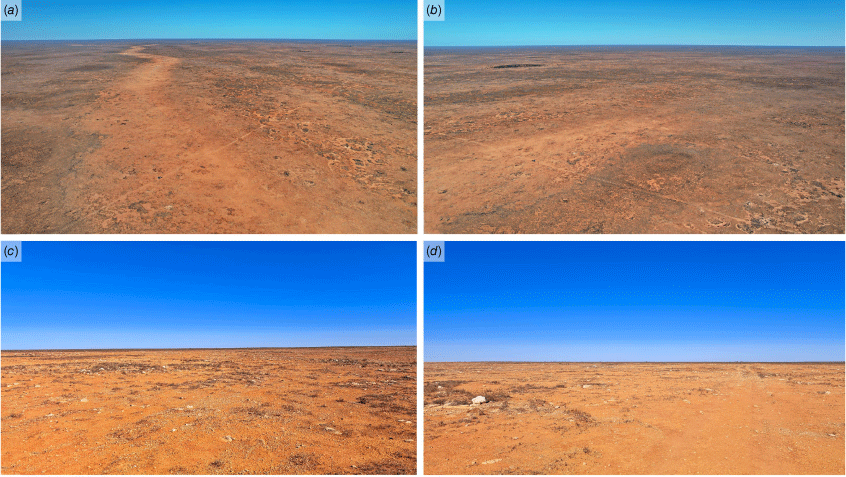
The remarkable characteristic of the scar is its longevity. Although the tornado occurred in November 2022, the scar is well visible from Google satellite imagery dated to 13 September 2023 (0–9 km) and 26 March 2024 (9–11 km). In addition, field observations in May 2024 confirmed its persisting apparent erosional mark (Fig. 9). This is most likely due to the semiarid to arid climate in the area and consequently slow rate of vegetation overgrowth of the overturned soil and rock clasts.
Tornado scar as seen on 17 May 2024. Drone photos (a and b) and photos taken from the ground (c and d); all photos were taken where the dirt track crosses the scar (note a dirt track in a, b and c; see Fig. 2a for the location of the track), which is almost at the beginning of the scar on the western side. In (a) the camera is facing eastwards, in (b) the camera is facing west-south-westwards, in (c) the camera is facing south, and in (d) the camera is facing north.
4.1. The strength of the tornado
According to the analyses by Elsner et al. (2014), Schaefer et al. (1980), Agee and Childs (2014) and Malamud and Turcotte (2012), tornado intensity can be estimated based on the width and length of the damage path. However, although tornado diameter and duration generally increase with intensity, there are many assumptions, and consequently inferring the intensity based solely on these parameters can be highly uncertain (Markowski and Richardson 2010). In addition, the presence of suction vortexes indicates that the winds within the tornado are concentrated inside the suction vortexes and therefore the wind strength in the tornado is not evenly distributed, which means that the most extreme winds would only be ~1–2 m wide (Fujita 1981).
The absence of human-built structures furthermore limits the assumption of the tornado strength based on the damage it left behind. In our particular case, for example, even the movement of larger rocks or materials that might have been displaced by the tornado were unreliable because the region has experienced several significant flooding events after the formation of the tornado, notably in March 2024. The unique silty clay composition of the Nullarbor region, which becomes highly fluid when wet, complicates any clear interpretation of rock movements. These conditions cause surface rocks to sink into the silty clay and even shift after rainfall events, erasing potential evidence of tornado-induced movement. Additionally, the widespread presence of loose calcreted carbonate rocks across the surface renders any analysis of rock displacement inconclusive. Nevertheless, it is worth noting that the observed micro-disturbances that cause the change in colour of the scar compared to the surrounding landscape are most likely abraded biological mats on the silty clay and rocks. These features, though, fall outside the primary focus of this study and may warrant further investigation by specialists in other fields.
In general, given the scar’s length of 11 km and width of 160–250 m, the tornado intensity likely falls within the F-scale 2 (Brooks 2004) or the F-scale 2–3 tornado (Schaefer et al. 1980), correlating with wind speeds of ~51–92 m s–1 (~180 and 330 km h–1) (Schaefer et al. 1980), or within the EF-scale 2 (Elsner et al. 2014; Strader et al. 2015), correlating with wind speeds of 49–62 m s–1 (176–223 km h–1) (Elsner et al. 2014). Limiting both extremes, the likely wind speed was 51–62 m s–1 (182–223 km h–1). This is also consistent with the study of Malamud and Turcotte (2012), who estimated the strength of a tornado in relation to its path length of touchdown.
Tornadoes generally tend to move with the speed of the parent thunderstorm (Fujita et al. 1970). Assuming the general speed of moving cold fronts at 50 km h–1 (but can reach up to 100 km h–1; Bureau of Meteorology 2016), means that the tornado lasted most likely 7–13 min. Although it is hypothesised that the tornado occurred later in the afternoon, c. 17:00 hours AWST, potentially following an earlier batch of storms at 12:00 hours, there is insufficient evidence to confirm this timing, and thus it remains speculative.
4.2. Supporting climatic conditions
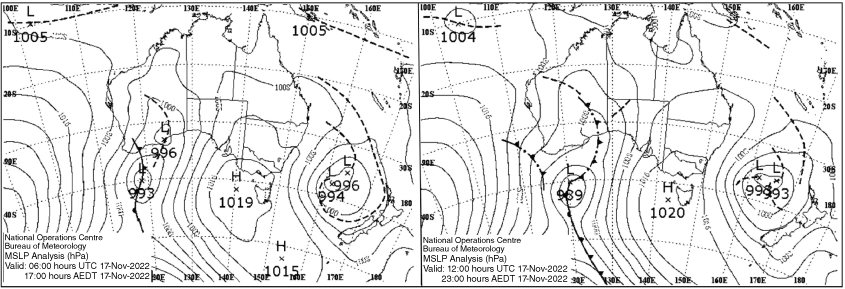
The weather conditions during this period were marked by a significant low-pressure system over the region, which created an environment conducive to severe weather. Based on the satellite data and the Australian Bureau of Meteorology report for Western Australia in November 2022 (Bureau of Meteorology 2022), the passage of a cold front coupled with tropical moisture was present over the region on 17 November 2022 (Fig. 10). This is also convincing evidence that the scar very likely formed on 17 November 2022, bounded by the narrowest timeframe of the scar formation based on the Sentinel-3 imagery between 16 and 18 November 2022.
Mean sea-level pressure analysis map for Australian continent on 17 November 2022 (14:00 hours AWST left and 20:00 hours AWST right). The archive maps obtained from Australian Bureau of Meteorology (see http://www.bom.gov.au/).
The Eucla weather station measured record high November daily rainfall with 42.8 mm. The combination of these synoptic-scale features created a highly favourable environment for severe thunderstorm outbreaks, including the tornado that caused the erosional scar on the Nullarbor Plain. Similarly, a strong cold front in 2016 that was associated with an intense low pressure system also produced at least seven tornadoes during the thunderstorm outbreak in central and eastern parts of South Australia (Zovko-Rajak et al. 2023).
5.Conclusion
An 11 km long and 160–250 m wide erosional scar with cycloidal marks was identified on the Nullarbor Plain, southern Australia. The formation of the scar was constrained to a narrow timeframe between 16 and 18 November 2022. The weather patterns during this period were marked by the passage of a strong cold front from west to east, coupled with tropical moisture, creating an environment conducive to severe weather. Cloud imagery indicated intensive cloud cover over the region on 17 November 2022, and nearby weather stations recorded significant rainfall, correlating with the observed scar formation.
The results strongly suggest that the erosional scar was formed by a tornado. The characteristics of the scar, including its cycloidal marks indicative of suction vortexes activity, and the analysis of associated weather patterns, indicate a tornado moving in an eastward direction and swirling clockwise, with an estimated strength within the F2 or even F3 category on the Fujita scale, with wind speeds likely exceeding 200 km h–1.
This finding is particularly important because tornadoes on the Nullarbor Plain are not frequently reported due to the area’s remoteness and consequently the lack of eye witnesses and direct damage to properties and infrastructure. The preservation and analysis of this scar provide valuable insights into the occurrence and intensity of tornadoes in this region, contributing to the broader understanding of tornado behaviour in remote and less-studied areas. Additionally, this study emphasises the importance of utilising satellite imagery and meteorological data in identifying and analysing weather phenomena in remote locations, where traditional observational methods are limited; with enough examples identified, this can also lead to the development (i.e. deep learning) of the automated analysis of satellite imagery to detect tornado events in arid regions. The improved understanding of tornadoes in such regions can enhance predictive capabilities and aid in the timely dissemination of warnings, ultimately contributing to better preparedness and risk mitigation strategies.
Data availability
The data used to generate the results in this paper are available online through various meteorological and satellite agencies. The internet addresses are provided in the Methods section.
Declaration of funding
This research has been supported by the Slovenian Research and Innovation Agency (grant numbers J6-50213, P6-0101 and I0-0031).
Acknowledgements
Murray Collins was the first that noted the erosional scar on the Nullarbor Plain and Ian Lutherborrow informed the author of this paper. Constructive comments from David Dunkerley and Joshua Soderholm substantially improved the manuscript.
References
Agee E, Childs S (2014) Adjustments in tornado counts, F-scale intensity, and path width for assessing significant tornado destruction. Journal of Applied Meteorology and Climatology 53(6), 1494-1505.
| Crossref | Google Scholar |
Allen JT, Allen ER (2016) A review of severe thunderstorms in Australia. Atmospheric Research 178–179, 347-366.
| Crossref | Google Scholar |
Allen JT, Allen ER, Richter H, Lepore C (2021) Australian tornadoes in 2013: Implications for Climatology and Forecasting. Monthly Weather Review 149(5), 1211-1232.
| Crossref | Google Scholar |
Barton IJ, Prata AJ (2010) Storm tracks on the Nullarbor Plain. International Journal of Remote Sensing 18(17), 3677-3682.
| Crossref | Google Scholar |
Berger M, Moreno J, Johannessen JA, Levelt PF, Hanssen RF (2012) ESA’s sentinel missions in support of Earth system science. Remote Sensing of Environment 120, 84-90.
| Crossref | Google Scholar |
Bluestein HB (2013) Tornadoes. In ‘Severe Convective Storms and Tornadoes’. (Ed. HB Bluestein) pp. 307–416. (Springer-Verlag) 10.1007/978-3-642-05381-8_6
Brooks HE (2004) On the relationship of tornado path length and width to intensity. Weather and Forecasting 19(2), 310-319.
| Crossref | Google Scholar |
Bureau of Meteorology (2016) The big chill: what is a cold front? 11 July 2016. (Commonwealth of Australia) Available at https://media.bom.gov.au/social/blog/1001/the-big-chill-what-is-a-cold-front/
Bureau of Meteorology (2022) Western Australia in November 2022: fourth wettest November on record. Monday, 5 December 2022 – Monthly Climate Summary for Western Australia – Product code IDCKGC11R0. (Commonwealth of Australia) Available at http://www.bom.gov.au/climate/current/month/wa/archive/202211.summary.shtml
Bureau of Meteorology (2024a) Severe Storms Archive. Specific storm type: tornado; search area: Australia; date range: 01-01-1700–21-11-2024. (Commonwealth of Australia) Available at http://www.bom.gov.au/australia/stormarchive/
Bureau of Meteorology (2024b) Climate data online. (Commonwealth of Australia) Available at http://www.bom.gov.au/climate/data/index.shtml
Burnett S, Webb JA, White S, Lipar M, Ferk M, Barham M, O’Leary MJ, Glover FS (2020) Etched linear dunefields of the Nullarbor Plain; a record of Pliocene–Pleistocene wind patterns across southern Australia. Palaeogeography, Palaeoclimatology, Palaeoecology 557, 109911.
| Crossref | Google Scholar |
Davies-Jones R, Trapp RJ, Bluestein HB (2001) Tornadoes and tornadic storms. In ‘Severe Convective Storms’. (Ed. CA Doswell) pp. 167–221. (American Meteorological Society: Boston, MA, USA) 10.1007/978-1-935704-06-5_5
Doswell CA, Brooks HE, Dotzek N (2009) On the implementation of the enhanced Fujita scale in the USA. Atmospheric Research 93(1, 3), 554-563.
| Crossref | Google Scholar |
Elsner JB, Jagger TH, Elsner IJ (2014) Tornado intensity estimated from damage path dimensions. PLoS ONE 9(9), e107571 PMCID: PMC4168131.
| Crossref | Google Scholar |
Fujita TT (1971b) Proposed mechanism of suction spots accompanied by tornadoes. In ‘Proceedings of 7th Conference on Severe Local Storms’, 5–7 October 1971, Kansas City, MO, USA. pp. 208–213. (American Meteorological Society: Boston, MA, USA) Available at http://hdl.handle.net/10605/294441
Fujita TT (1977) Anticyclonic tornadoes. Weatherwise 30(2), 51-64.
| Crossref | Google Scholar |
Fujita TT (1981) Tornadoes and downbursts in the context of generalized planetary scales. Journal of the Atmospheric Sciences 38(8), 1511-1534.
| Crossref | Google Scholar |
Fujita TT, Bradbury DL, Thullenar CFV (1970) Palm Sunday tornadoes of April 11, 1965. Monthly Weather Review 98(1), 29-69.
| Crossref | Google Scholar |
Fujita TT, Smith BE (1993) Aerial survey and photography of tornado and microburst damage. In ‘The Tornado: Its Structure, Dynamics, Prediction, and Hazards’. (Eds C Church, D Burgess, C Doswell, R Davies-Jones) Vol. 79, pp. 479–493. (American Geophysical Union) 10.1029/GM079p0479
Goudie AS (2010) Dayas: distribution and morphology of dryland solutional depressions developed in limestones. Zeitschrift für Geomorphologie 54(2), 145-159.
| Crossref | Google Scholar |
Harper B, Granger K, Hall S (2000) Chapter 6: Severe thunderstorm risks. In ‘Natural Hazards and the Risks they Pose to South-East Queensland’. (Eds K Granger, M Hayne) pp. 6.1–6.15. (Australian Geological Survey Organisation) Available at https://www.ga.gov.au/pdf/GA1489.pdf
Malamud BD, Turcotte DL (2012) Statistics of severe tornadoes and severe tornado outbreaks. Atmospheric Chemistry and Physics 12(18), 8459-8473.
| Crossref | Google Scholar |
Marshall T, Jungbluth KA, Baca A (2008) The Parkersburg, IA tornado: May 25, 2008. In ‘Proceedings of 24th Conference on Severe Local Storms’, 27–31 October 2008, Savannah, GA, USA. Poster Session P3.3. (American Meteorological Society) Available at https://ams.confex.com/ams/24SLS/webprogram/Paper141533.html
Monfredo W (2003) Investigating tornado scars in Texas. The Southwestern Geographer 7, 27-48.
| Google Scholar |
O’Connell LG, James NP, Bone Y (2012) The Miocene Nullarbor limestone, southern Australia; deposition on a vast subtropical epeiric platform. Sedimentary Geology 253-254, 1-16.
| Crossref | Google Scholar |
Schaefer JT, Kelly DL, Abbey RF Jr (1980) Tornado track characteristics and hazard probabilities. In ‘Wind Engineering – Proceedings of the Fifth International Conference’, July 1979, Fort Collins, CO, USA. (Ed. JE Cermak) Vol. 1, pp. 95–109. (Pergamon) 10.1016/B978-1-4832-8367-8.50015-2
Strader SM, Ashley W, Irizarry A, Hall S (2015) A climatology of tornado intensity assessments. Meteorological Applications 22(3), 513-524.
| Crossref | Google Scholar |
Van Tassel EL (1955) The North Platte Valley tornado outbreak of June 27, 1955. Monthly Weather Review 83(11), 255-264.
| Crossref | Google Scholar |
Webb JA, James JM (2023) Nullarbor. In ‘Australian Caves and Karst Systems’. (Eds JA Webb, S White, GK Smith) pp. 171–187. (Springer: Cham, Switzerland) 10.1007/978-3-031-24267-0_11
Williams DL, Goward S, Arvidson T (2006) Landsat. Photogrammetric Engineering & Remote Sensing 72(10), 1171-1178.
| Crossref | Google Scholar |
Zovko-Rajak D, Tory KJ, Kepert JD, Rea A (2023) A case study of South Australia’s severe thunderstorm and tornado outbreak 28 September 2016. Journal of Southern Hemisphere Earth Systems Science 73(2), 178-193.
| Crossref | Google Scholar |

