The influence of megacities on global atmospheric chemistry: a modelling study
Timothy M. Butler A B and Mark G. Lawrence AA Max Planck Institute for Chemistry, J.-J.-Becher Weg 27, D-55128 Mainz, Germany.
B Corresponding author. Email: tim.butler@mpic.de
Environmental Chemistry 6(3) 219-225 https://doi.org/10.1071/EN08110
Submitted: 18 December 2008 Accepted: 7 April 2009 Published: 18 June 2009
Environmental context. Over half of the population of the world now live in urban areas, and the number of so-called ‘megacities’, with populations of ~10 million or more, is growing at a tremendous rate. We show how these patterns of urbanisation have the potential to influence the atmospheric chemical environment on a global scale, particularly through the effects of emissions from megacities on the reactive nitrogen cycle. With the growing worldwide interest in the study of the effects of megacities at all spatial scales, such as current European Union projects MEGAPOLI and CityZen, our study represents the first of many future studies that examine the effects of megacities on atmospheric chemistry on the global scale.
Abstract. We present the first study of the effects of megacities on global atmospheric chemistry using a global three-dimensional chemical transport model. The effects on air quality, radiative forcing and atmospheric oxidation capacity are disproportionately smaller than the proportion of anthropogenic emissions due to megacities. Disproportionately large effects of megacities are modelled for reactive nitrogen compounds, in particular PAN (peroxy acetyl nitrate), which has increased in abundance globally by 9% due to megacities under year 2000 conditions, with 23% of the Earth experiencing an increase of 10% or more. These influences decrease under two very different future emission scenarios. Under a low-emission future scenario, the influence of megacities is generally reduced, and under a high-emission future scenario, although the local influence of megacities is increased, the geographical extent of the influence becomes smaller. In our model, the individual grid cells that contain megacities respond to the megacity emissions differently depending on their latitude. Tropical megacity grid cells generally show increased ozone year-round, while northern extratropical megacities generally show reduced ozone year-round. Better parameterisation of the sub-grid effects of megacities is an important issue for future work.
Additional keywords: emissions, global atmospheric chemistry, megacities.
Introduction
It has long been recognised that the study of air quality in urban areas and the effects of these urban areas on the air quality of downwind regions is important. Model simulations of urban air quality using urban air-shed models, well as simulations of the regional scale effects of urban areas using regional scale models have been common. A recent example of both is the CityDelta project.[1] It is estimated that in 2007, for the first time in history, the world’s urban population exceeded the rural population.[2,3] At present, there are ~20 cities worldwide with a population of 10 million or more and ~30 with a population of ~7 million or more. Such coherent urban areas with more than ~5 or 10 million people are loosely referred to as megacities (there is presently no clear threshold or formal definition of a megacity). The rate of growth of megacities with populations that exceed 10 million has been tremendous, increasing from only 3 in 1975. These numbers are expected to continue to grow in the future, potentially influencing atmospheric oxidising capacity,[4] climate radiative forcing,[5] terrestrial ecosystems[6] and oceanic ecosystems[7] on a global scale. The investigation of these global effects of megacities, both under present conditions and future scenarios, requires the use of a global-scale model. This study is the first such quantification of the effects of emissions from megacities on a global scale.
The only previous study of the effects of urban emissions on global air quality[8] included a parameterisation of polluted urban environments in a two-dimensional global model of background atmospheric chemistry. The focus of this previous work was not specifically on the effects of megacities, but rather on urban emissions in general. Urban areas were identified based on their signature in an emissions inventory. It was found that the parameterised treatment of the urban component of the emissions resulted in global decreases of NOx, OH and O3. This was mainly due to the higher efficiency of conversion of NOx into NOy reservoirs such as PAN (peroxy acetyl nitrate) in urban areas. It is not clear how well their two-dimensional model represents the transport of NOy in polluted airmasses away from urban areas to surrounding regions, where it can subsequently release NOx.
A related study[9] performed an artificial tracer simulation (without the effects of chemistry) using a three-dimensional model in order to investigate the transport characteristics for several selected megacities and major population centres. The present study aims to take a substantial step beyond these earlier works by employing a global three-dimensional model of atmospheric transport and chemistry to specifically examine the effects of emissions from megacities on the gas phase chemistry of the global atmosphere. We examine present-day conditions as well as three different future development scenarios for the year 2030.
Our use of a global model also gives us a unique opportunity to examine the local and regional effects of megacity emissions for a large number of different megacities in a consistent modelling framework, with each megacity being approximately at the scale of a model grid cell.
Computational methods
We use the global three-dimensional chemistry transport model (CTM) MATCH-MPIC (Model of Atmospheric Transport and Chemistry–Max Planck Institute for Chemistry version). This model has been described and evaluated in detail.[10–13] MATCH-MPIC was involved in a multi-model intercomparison project[14] that formed part of the IPCC-AR4. Detailed comparisons were reported for CO,[15] NOx[16] and O3.[17]
In this study we use the same model setup and emission scenarios as were used for this intercomparison project. These emission scenarios are described elsewhere,[18] and we use the nomenclature of S1–S4: The S1 dataset refers to year 2000 emissions. S2 refers to projected 2030 emissions based on current emissions control legislation and national expectations of economic growth, under which global CO emissions slightly decrease and NOx emissions slightly increase. S3 is a maximum feasible reduction scenario, based on the same growth forecast as S2, but created assuming the full application of all currently available emission control technologies, under which both CO and NOx emissions decrease globally. S4 is a pessimistic ‘worst case’ scenario based on the SRES A2p scenario used in the IPCC Third Assessment Report, under which emissions increase by ~50% compared with the year 2000. Previous work using these emissions scenarios[14] has shown that global surface ozone in 2030 increases by 1.5 ± 1.2 nmol mol–1 under the S1 scenario, and by 4.3 ± 2.2 nmol mol–1 under the S4 scenario. Global surface ozone decreases by –2.3 ± 1.1 under the more progressive S3 scenario.
All simulations discussed here are performed using input meteorological data for the year 2000 from the NCEP/NCAR reanalysis project,[19] at a horizontal resolution of T62 (192 × 92 grid points, or ~1.9°) and with 28 levels in the vertical. MATCH-MPIC is run in a semi-offline mode, relying only on a limited set of input fields (surface pressure, geopotential, temperature, horizontal winds, surface latent and sensible heat fluxes, and zonal and meridional wind stresses). These fields are interpolated in time to the model time-step of 30 min, and used to diagnose online the transport by advection, vertical diffusion and deep convection, as well as the tropospheric hydrological cycle (water vapour transport, cloud condensate formation and precipitation).
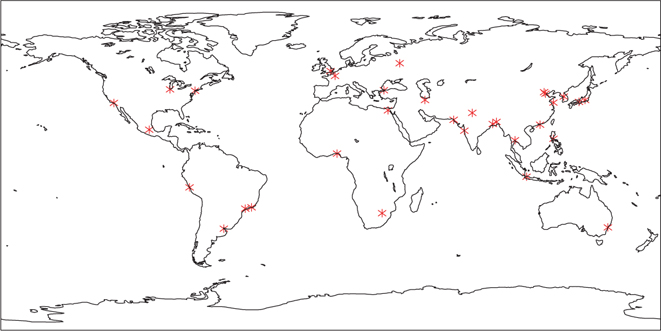
We assess the effects of emissions from megacities under each of our simulated emissions scenarios using a source removal methodology. For each emissions scenario we perform two simulations: one with the standard emissions dataset, and another in which the emissions from the megacities have been removed. The difference between the two simulations thus represents the effects of adding the emissions from these cities into an atmosphere in which they were previously not present. We use the same 32 cities as chosen for a previous study,[20] which are shown in Fig. 1. The anthropogenic emissions from these cities are removed from the emissions datasets at their native 1° × 1° resolution before being interpolated to the model grid. Together, these cities account for ~10% of the population of the world, and 10% of the anthropogenic emissions of NOx, CO and non-methane hydrocarbon (NMHC). Under the S1, S2 and S4 emission scenarios, these cities account for ~4% of the total (anthropogenic plus natural) present day CO and NOx emissions. Under the S3 scenario, in which both anthropogenic emissions and the share of anthropogenic emissions due to urban population decrease, the megacities considered in our study contribute ~2% to total emissions of CO and NOx. Megacities only contribute a very small amount to global total NMHC emissions.[20]
In the real world, some cities are highly influenced by urban-scale meteorological conditions or orographical features. The grid cells that contain the megacities are treated in our model in the same way as every other grid cell, with the same chemistry and the same treatment of surface exchange processes. The size of a T62 grid cell is approaching the size of some of the geographically larger megacities (such as Los Angeles), although our model grid cells are still about four times the surface area of the grid cells in the underlying emissions inventory.
Results and discussion
Local effects
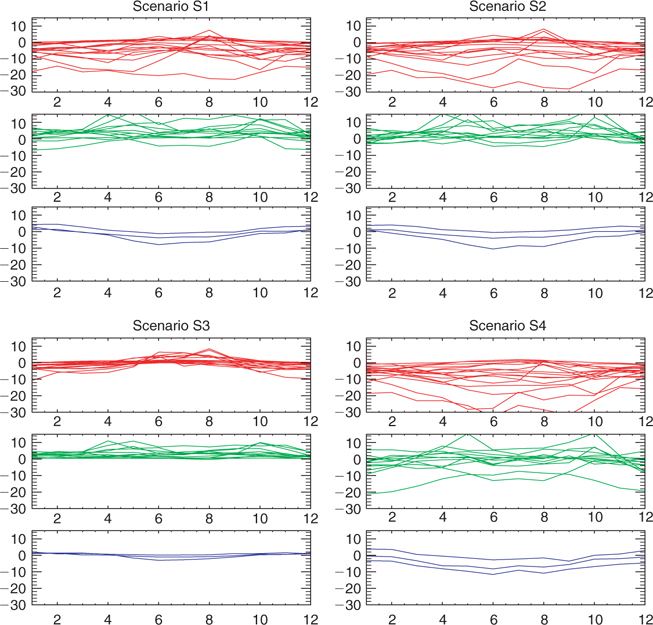
Fig. 2 shows the time series of the modelled influence of megacity emissions on O3 mixing ratio in our megacity grid cells. Our methodology for calculating this influence, and descriptions of the S1–S4 emission scenarios are described above. The latitudinal location of a city seems to have a distinct effect on the influence of its emissions on the modelled O3 mixing ratio. Southern extratropical city grid cells show a relatively unchanged pattern under the four emission scenarios, of moderate O3 production in summer, and moderate destruction in winter due to the megacity emissions.
Tropical model grid cells respond to emissions from megacities almost exclusively with year-round increases in local O3 mixing ratios in the year 2000 S1 scenario, in the ‘current legislation’ future S2 and in the ‘maximum feasible reduction’ S3 future emission scenarios. Under the higher emission S4 future scenario, some tropical city grid cells, most notably the grid cell that contains Mexico City, begin to show decreases in O3 mixing ratios during the winter months, a seasonal pattern similar to northern extratropical cities.
The northern extratropical megacity grid cells are generally in an O3 removal chemical regime, showing year-round decreases in the local O3 mixing ratio due to megacity emissions. In some cases, such as the grid cells that contain Los Angeles, New York and Seoul, the local megacity grid cell ozone mixing ratio is decreased by up to 20 nmol mol–1. In other cases, such as the grid cells that contain Istanbul, Karachi, and Osaka, the changes in grid cell O3 mixing ratio due to megacity emissions are very small (around zero). While we hesitate to draw any conclusions about individual cities due to the lack of a detailed sub-grid parameterisation of cities in our model (as discussed earlier), these general differences between tropical and extratropical cities in our model can, however, be related to the differences in modes of transport of tracers away from the cities, as previously reported.[9,21] Tropical cities are influenced more by rapid convective transport, while extratropical cities allow a greater local pollution buildup, and thus have greater potential for titration of O3 by NOx.
Under the S2 scenario, the northern extratropical megacity grid cells are relatively unchanged compared with the S1 scenario. However, under the cleaner S3 scenario, none of the northern extratropical megacity grid cells show this decrease with megacity emissions during the middle of summer. Some of these northern cities even switch to an O3 production regime during summer under the S3 scenario, becoming more like southern extratropical cities. Under the S4 scenario, the distribution of the changes for these northern extratropical cities becomes a lot more spread out, in contrast to the S1, S2 and S3 scenarios, under which several of these northern cities show O3 mixing ratio changes of approximately zero with almost no seasonal cycle.
Global effects
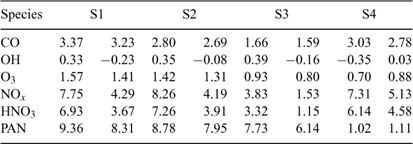
The percentage changes due to emissions from megacities of the annually averaged global burden of CO, NOx, O3 and OH, along with some other species are shown in Table 1, for both the surface model layer and for the whole troposphere. CO shows only small differences between the surface layer and the whole troposphere, with the percentage change in CO burden slightly smaller than the percentage contribution of megacities to the total CO source. The OH burden is affected very little by emissions from megacities, less than 1% at both the surface and in the whole troposphere. This is due to the opposing effects of the changes in CO and NOx on OH. Under the S1, S2 and S3 scenarios the emissions from megacities lead to a slight increase of global surface OH concentration, and a slight decrease in global tropospheric OH burden, while the S4 scenario shows the opposite. The effect of megacity emissions on O3 burden is similar at the surface to the whole troposphere, and is reduced under all future scenarios compared with the year 2000, with the high emissions S4 scenario showing the smallest influence of megacities on the global O3 burden.
|
Reactive nitrogen, on the other hand, appears to be quite strongly affected globally by emissions from megacities, with potential consequences for terrestrial and oceanic ecosystems. NOx at the surface in all scenarios is increased by a slightly larger amount by megacity emissions than the total contribution of megacities to the global NOx source, with a smaller increase in the whole troposphere. These increases in NOx are accompanied by similar increases in HNO3. PAN is also increased by ~8–9% at the surface, and by almost as much in the whole troposphere for the S1, S2 and S3 scenarios. The increase in PAN in the S3 scenario is especially impressive given the small contribution of megacity emissions to the total NOx source in the reduced-emissions S3 scenario. Under the S4 scenario, PAN is only modestly increased, despite megacity emissions of NOx contributing a similar amount to the total NOx source as under the S1 scenario. This could possibly be related to the widespread increase in emissions of NOx (not just in megacities) under the S4 scenario, which leads to enhanced PAN production outside of the cities, and the resulting decrease in the relative importance of the megacity PAN. It should be noted that the formation of PAN involves reactive precursors, whose mixing ratios are potentially highly heterogeneous. This heterogeneity is not well simulated by our large scale model. Future work should focus on better integration of the small scale (plumes) with the large scale (global atmosphere).
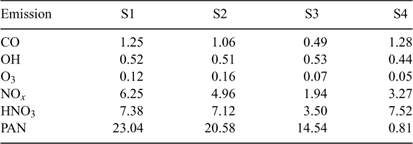
Another way to asses the influence of megacities is by examining their chemical ‘footprint’. Similarly to previous work,[22] we calculate the area of the Earth’s surface over which the surface mixing ratio or concentration of various chemical species is increased by more than 10%. The threshold of 10% is chosen because the megacities themselves account for ~10% of the Earth’s population. This chemical footprint is thus a measure of how much of a disproportionate effect the megacities have on the atmosphere. We present these chemical footprints as the percentage of the total surface area of the Earth in Table 2. For O3, the size of the chemical footprint is comparable to the area taken up by the megacity grid cells themselves, ~0.16%, while the megacity footprint is larger for all other species, especially in the case of reactive nitrogen. The footprints of NOx, HNO3 and PAN extend well beyond the city limits. Despite the similarity of megacity NOx emissions as a proportion of total NOx emissions under the S1, S2 and S4 scenarios, the chemical footprint of NOx is smaller under S2 than under S1, and smaller again under S4. The S2 scenario has higher NOx emissions than the S1 scenario, and the emissions in the S4 scenario are higher still. The smaller influence of megacities on global PAN mixing ratios under the S4 scenario (Table 1) is again evident in the megacity PAN footprint (Table 2).
|
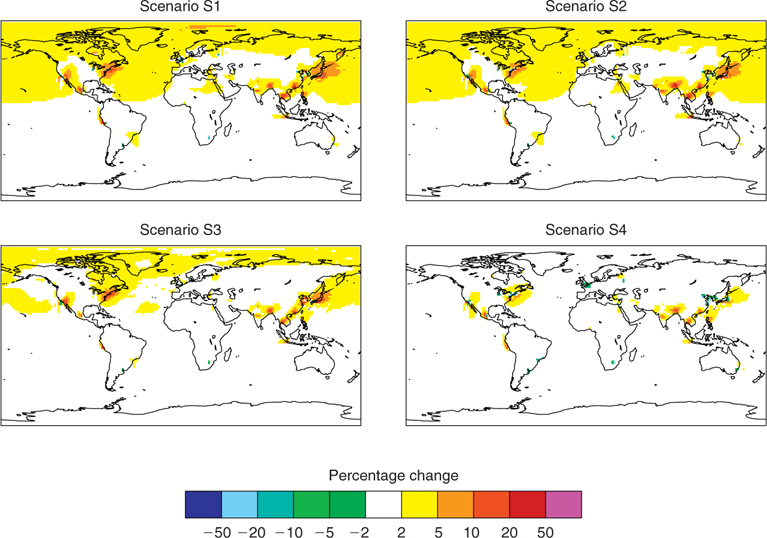
As shown in Fig. 2, local O3 mixing ratios in megacity grid cells can show a seasonal dependence. The effect of megacity emissions on the global annual average O3 surface mixing ratio as a percentage change in mixing ratio due to the addition of megacity emissions is shown for July in Fig. 3. The local grid cell scale depletion of O3 seen in summer for the northern extratropical cities in Fig. 2 is accompanied by an increase in O3 mixing ratio in the grid cells near the emission centres, as can be seen, for example, for Los Angeles and New York. This influence extends to remote regions of the northern hemisphere, especially in the S1 and S2 scenarios, which again appear more similar to each other than any of the other emissions scenarios. Under the S3, and to a greater extent the S4 scenario, the geographical extent of the influence of all megacities on the surface O3 mixing ratio is reduced compared with the other scenarios.
|
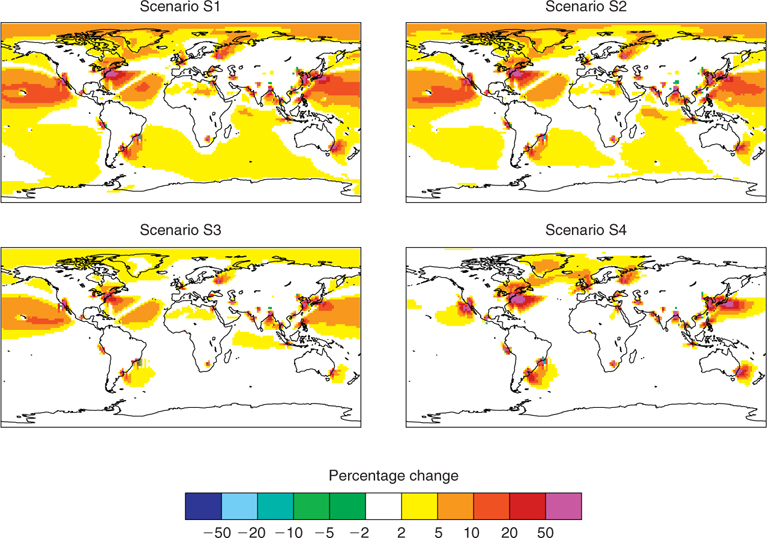
Fig. 4 shows the effect of megacity emissions on the global annual average NOx surface mixing ratio. The S1 and S2 scenarios are quite similar, with distinct plumes of influence spreading out from many of the emissions centres, as well as widespread regions of enhanced NOx mixing ratio in remote oceanic regions. Neither the lower-emission S3 scenario nor the higher-emission S4 scenario show as great an influence of megacities on the NOx mixing ratio in remote regions. Under the S3 scenario the influence of megacities is generally reduced, while under the S4 scenario, megacities have a larger influence closer to the emission centres and a smaller influence remote from them, when compared with the S1 scenario.
|
Conclusions
We have presented the first assessment of the effects of emissions from megacities on the chemistry of the global atmosphere using a three-dimensional global model. In our model, the effect of the emissions from megacities on the model grid cells that contain the megacities is dependent to a large extent on the latitude of the city: cities in the northern extratropics are generally in a year-round ozone depleting chemical regime, emissions from tropical cities generally produce ozone locally, and cities in the southern hemisphere show a seasonal cycle, changing from moderate local ozone production in summer to moderate local ozone depletion during the winter.
The global scale effects of megacities on the oxidising capacity of the atmosphere (by the OH radical) and global air quality and radiative forcing (through ozone) are generally quite small, and also disproportionately smaller than the proportion of anthropogenic emissions due to megacities. Global scale effects of megacities on reactive nitrogen, on the other hand, can be disproportionately large, even under the ‘maximum feasible reduction’ S3 future scenario.
Of all of the future scenarios, the ‘current legislation’ S2 scenario is the most similar to the year 2000 S1 scenario. Under the S3 scenario, the northern extratropical cities become less ozone depleting, and some even start to show moderate ozone production in summer, similarly to the year 2000 southern extratropical cities. The high-emission S4 scenario seems to push things into quite a new chemical regime: locally, tropical megacity grid cells begin to behave more like northern extratropical grid cells, and globally, the reactive nitrogen chemistry appears to change, with the long-range transport of reactive nitrogen through PAN from megacities being less important than under the lower-emission scenarios.
In our study, we have used the relatively simple source removal methodology in order to gain a basic idea of the likely effects of emissions from megacities. Future work should extend these ideas by using techniques such as perturbation methods, in which emissions from megacities are reduced (or increased) by smaller amounts, or alternative urbanisation emission scenarios. We have also neglected to treat any sub-grid scale effects of megacities on the chemistry or dynamics. This is normal for state-of-the-art global CTMs such as MATCH-MPIC.
As well as further investigation of the effects of megacities on terrestrial and oceanic ecosystems through reactive nitrogen chemistry, which we have shown here to be of potential global significance, an important future improvement beyond these results will be the development of parameterisations of the sub-grid scale effects of megacities appropriate for use in global models, and their application in scenarios similar to those shown here.
Acknowledgements
This work was supported in part by BMBF AFO2000 project ‘SAPHIRE’, the Max Planck Gesellschaft, and the EU FP7 project ‘MEGAPOLI’. The authors thank Jos Lelieveld for useful discussions during the preparation of this manuscript.
[1]
C. Cuvelier ,
P. Thunis ,
R. Vautard ,
M. Amann ,
B. Bessagnet ,
M. Bedogni ,
R. Berkowicz ,
J. Brandt ,
et al. CityDelta: a model intercomparison study to explore the impact of emission reductions in European cities in 2010.
Atmos. Environ. 2007
, 41, 189.
| Crossref | GoogleScholarGoogle Scholar |
CAS |

[2]
[3]
[4]
J. Lelieveld ,
F. J. Dentener ,
W. Peters ,
M. C. Krol ,
On the role of hydroxyl radicals in the self-cleansing capacity of the troposphere.
Atmos. Chem. Phys. 2004
, 4, 2337.
|
CAS |

[5]
D. T. Shindell ,
H. Levy ,
M. D. Schwarzkopf ,
L. W. Horowitz ,
J.-F. Lamarque ,
G. Faluvegi ,
Multimodel projections of climate change from short-lived emissions due to human activities.
J. Geophys. Res. 2008
, 113,
| Crossref | GoogleScholarGoogle Scholar | PubMed |

[6]
W. D. Bowman ,
C. C. Cleveland ,
L. Halada ,
J. Hresko ,
J. S. Baron ,
Negative impact of nitrogen deposition on soil buffering capacity.
Nature Geosci. 2008
, 1, 767.
| Crossref | GoogleScholarGoogle Scholar |
CAS |

[7]
R. A. Duce ,
J. LaRoche ,
K. Altieri ,
K. R. Arrigo ,
A. R. Baker ,
D. G. Capone ,
S. Cornell ,
F. Dentener ,
et al. Impacts of atmospheric anthropogenic nitrogen on the open ocean.
Science 2008
, 320, 893.
| Crossref | GoogleScholarGoogle Scholar |
CAS |
PubMed |

[8]
M. Mayer ,
C. Wang ,
M. Webster ,
R. G. Prinn ,
Linking local air pollution to global chemistry and climate.
J. Geophys. Res. 2000
, 105, 22869.
| Crossref | GoogleScholarGoogle Scholar |
CAS |

[9]
M. G. Lawrence ,
T. M. Butler ,
J. Steinkamp ,
B. R. Gurjar ,
J. Lelieveld ,
Regional pollution potentials of megacities and other major population centres.
Atmos. Chem. Phys. 2007
, 7, 3969.
|
CAS |

[10]
P. J. Rasch ,
Representations of transport, convection, and the hydrologic cycle in chemical transport models: Implications for the modelling of short lived and soluble species.
J. Geophys. Res. 1997
, 102, 28127.
| Crossref | GoogleScholarGoogle Scholar |
CAS |

[11]
M. G. Lawrence ,
P. J. Crutzen ,
P. J. Rasch ,
B. E. Eaton ,
N. M. Mahowald ,
A model for studies of tropospheric photochemistry: description, global distributions and evaluation.
J. Geophys. Res. 1999
, 104, 26245.
| Crossref | GoogleScholarGoogle Scholar |
CAS |

[12]
M. G. Lawrence ,
P. J. Rasch ,
R. von Kuhlmann ,
J. Williams ,
H. Fischer ,
M. de Reus ,
J. Lelieveld ,
P. J. Crutzen ,
et al. Global chemical weather forecasts for field campaign planning: predictions and observations of large-scale features during MINOS, CONTRACE, and INDOEX.
Atmos. Chem. Phys. 2003
, 3, 267.
|
CAS |

[13]
R. von Kuhlmann ,
M. G. Lawrence ,
P. J. Crutzen ,
A model for studies of tropospheric ozone and nonmethane hydrocarbons: model evaluation of ozone-related species.
J. Geophys. Res. 2003
, 108,
| Crossref | GoogleScholarGoogle Scholar | PubMed |

[14]
F. Dentener ,
D. Stevenson ,
K. Ellingsen ,
T. van Noije ,
M. Schultz ,
M. Amann ,
C. Atherton ,
N. Bell ,
et al. The global atmospheric environment for the next generation.
Environ. Sci. Technol. 2006
, 40,
| Crossref | GoogleScholarGoogle Scholar |
CAS |
PubMed |

[15]
D. T. Shindell ,
G. Faluvegi ,
D. S. Stevenson ,
M. C. Krol ,
L. K. Emmons ,
J. F. Lamarque ,
G. Pétron ,
F. J. Dentener ,
et al. Multi-model simulations of carbon monoxide: Comparison with observations and projected near-future changes.
J. Geophys. Res. 2006
, 111,
| Crossref | GoogleScholarGoogle Scholar |

[16]
T. P. C. van Noije ,
H. J. Eskes ,
F. J. Dentener ,
D. S. Stevenson ,
K. Ellingsen ,
M. G. Schultz ,
O. Wild ,
M. Amann ,
et al. Multi-model ensemble simulations of tropospheric NO2 compared with GOME retrievals for the year 2000.
Atmos. Chem. Phys. 2006
, 6, 2943.
|
CAS |

[17]
D. S. Stevenson ,
F. J. Dentener ,
M. G. Schultz ,
K. Ellingsen ,
T. P. C. van Noije ,
O. Wild ,
G. Zeng ,
M. Amann ,
et al. Multi-model ensemble simulations of present-day and near-future tropospheric ozone.
J. Geophys. Res. 2006
, 111,
| Crossref | GoogleScholarGoogle Scholar |
CAS |

[18]
F. Dentener ,
D. Stevenson ,
J. Cofala ,
R. Mechler ,
M. Amann ,
P. Bergamaschi ,
F. Raes ,
R. Derwent ,
The impact of air pollutant and methane emission controls on tropospheric ozone and radiative forcing: CTM calculations for the period 1990–2030.
Atmos. Chem. Phys. 2005
, 5, 1731.
|
CAS |

[19]
E. Kalnay ,
M. Kanamitsu ,
R. Kistler ,
W. Collins ,
D. Deaven ,
L. Gandin ,
M. Iredell ,
S. Saha ,
et al. The NCEP/NCAR 40-year reanalysis project.
Bull. Am. Meteorol. Soc. 1996
, 77, 437.
| Crossref | GoogleScholarGoogle Scholar |

[20]
T. M. Butler ,
M. G. Lawrence ,
B. R. Gurjar ,
J. van Aardenne ,
M. Schultz ,
J. Lelieveld ,
The representation of emissions from megacities in global emission inventories.
Atmos. Environ. 2008
, 42, 703.
| Crossref | GoogleScholarGoogle Scholar |
CAS |

[21]
T. Berntsen ,
J. Fuglestvedt ,
M. Joshi ,
K. Shine ,
N. Stuber ,
M. Ponater ,
R. Sausen ,
D. Hauglustaine ,
et al. Response of climate to regional emissions of ozone precursors: sensitivities and warming potentials.
Tellus B 2005
, 57, 283.
| Crossref | GoogleScholarGoogle Scholar |

[22]
S. K. Guttikunda ,
Y. Tang ,
G. R. Carmichael ,
G. Kurata ,
L. Pan ,
D. G. Streets ,
J. H. Woo ,
N. Thongboonchoo ,
A. Fried ,
Impacts of Asian megacity emissions on regional air quality during spring 2001.
J. Geophys. Res. 2005
, 110,
| Crossref | GoogleScholarGoogle Scholar |
CAS |


