RP-HPLC measurement and quantitative structure–property relationship analysis of the n-octanol–water partitioning coefficients of selected metabolites of polybrominated diphenyl ethers
Yijun Yu A , Weihua Yang A , Zishen Gao A , Michael H. W. Lam B C , Xiaohua Liu A , Liansheng Wang A and Hongxia Yu A CA State Key Laboratory of Pollution Control and Resource Reuse, School of the Environment, Nanjing University, Nanjing 210093, China.
B Department of Biology and Chemistry, City University of Hong Kong, Hong Kong SAR, China.
C Corresponding authors. Email: bhmhwlam@cityu.edu.hk; yuhx@nju.edu.cn
Environmental Chemistry 5(5) 332-339 https://doi.org/10.1071/EN08036
Submitted: 27 June 2008 Accepted: 28 August 2008 Published: 31 October 2008
Environmental context. Polybrominated diphenyl ethers (PBDEs) are ubiquitous environmental contaminants and numerous studies have demonstrated a marked increase in the levels of PBDEs in human biological tissues and fluids, especially breast milk. How PBDEs are transported through the environment, taken up by biota, transported across membranes, and metabolised depends strongly on such fundamental properties as lipophilicity (log KOW). However, very little data on log KOW exist for PBDEs. In the present paper, the authors determine PBDE metabolites’ log KOW using reversed-phase high performance liquid chromatography, as recommended by the Organisation for Economic Co-operation and Development and US Environmental Protection Agency, along with quantitative structure–property relationships.
Abstract. n-Octanol–water partitioning coefficient (log KOW) values of selected hydroxylated and methoxylated polybrominated diphenyl ether metabolites were measured for the first time by reversed-phase high performance liquid chromatography (RP-HPLC) using a C18 stationary phase with a water/methanol mixture as a mobile phase. The retention parameters, log kw (extrapolated retention indices) and k′ (gradient retention indices) were calibrated to log KOW by a set of calibration standards. For the PBDE metabolites investigated, extrapolated retention indices from isocratic elution seem to be more reliable and their RP-HPLC-derived log KOW values were found to range from 4.63 to 7.67. Some commonly available software, including ClogP, KowWin, AclogP, MlogP, AlogP, MilogP, and XlogP, was used to estimate the log KOW values of the analytes. Significant correlations were obtained between the RP-HPLC-derived log KOW and the software-computed log KOW, with squared correlation coefficients (R2) ranging from 0.793 to 0.922, but the difference between them was also significant. Then a quantitative structure–property relationship model based on topological descriptors was established and showed good reliability and predictive power for the estimation of RP-HPLC-derived log KOW values of PBDE metabolites. It was applied to estimate the log KOW values of some PBDE metabolites that are commercially available or have appeared in the literature. Lastly, factor analysis was carried out using the theoretical linear salvation/free-energy relationships, which indicated the average polarisability (α) and the most negative atomic partial Mulliken charge in the molecule (q–) were the most important parameters affecting their partition between n-octanol and water, supporting the factorisation of log KOW in bulk and electronic terms.
Additional keywords: extrapolated capacity factors, gradient elution, Kier’s shape index, log KOW, molecular connectivity indices.
Introduction
In recent years, there has been a specific environmental focus on polybrominated diphenyl ethers (PBDEs), an important class of brominated flame retardants (BFRs) that are widely used as additives in various kinds of polymers, resins, and other substrates at concentrations ranging from 5 to 30%.[1] They can leak out into the environment during the entire life-cycle of the products, including final waste deposition. Although their use reduces fire hazard, PBDEs also pose a risk to the environment as well as human health as they are persistent and bioaccumulative. They have already been recognised as ubiquitous environmental contaminants,[2] and numerous studies have demonstrated a marked increase in the levels of PBDEs in human biological tissues and fluids, especially breast milk.[3–5]
PBDEs are structurally similar to polychlorinated biphenyls (PCBs). Therefore, their chemical properties, persistence, distribution in the environment, and metabolism in biota follow similar patterns. Hydroxylated-PBDEs (HO-PBDEs) and methoxylated-PBDEs (MeO-PBDEs) are two common classes of PBDE metabolites. Though some MeO-PBDEs found in the sea appear to be of biogenic origin,[6] the metabolism was confirmed in biota. For example, cytochrome P450 (CYP) enzyme-mediated biotransformation of PBDEs has been shown to lead to the formation of HO-PBDEs in rodents dosed with 2,2′,4,4′-tetrabromodiphenyl ether (BDE-47),[7,8] and MeO-PBDEs can be generated via direct methoxylation of PBDEs or enzyme-mediated methylation of HO-PBDEs.[8,9] There are already numerous studies showing that HO-PBDEs and MeO-PBDEs are present in wildlife species at high trophic levels.[8–13]
Lipophilicity, often expressed by the n-octanol/water partition coefficient (log KOW), is an important property that affects the environmental fate such as absorption, trans-membrane transport, bioavailability, metabolism as well as toxicity of molecules.[14–16] Thus, the log KOW value of PBDE metabolites is an important factor affecting their tissue distribution within the body. Many methods for its determination or estimation have been developed. Reversed-phase high performance liquid chromatography (RP-HPLC) is one of the commonly adopted experimental methodologies for the measurement of lipophilicity of chemical species. It is a promising method for those relatively highly lipophilic compounds (log KOW > 4) that are difficult to determine reliably by the shake-flask method,[17] and it has been recommended by the Organisation for Economic Co-operation and Development (OECD) and US Environmental Protection Agency (US EPA). It can be operated on both isocratic and gradient elution, whereas the latter was considered to be more suitable for highly lipophilic chemicals.[18–20]
Quantitative structure–property relationships (QSPR) study is another widely accepted way to estimate log KOW and other properties. It is based on the premise that molecular properties may be related to the chemical structures, which can be characterised by some structural descriptors. QSPR has been successfully applied in the partition property prediction of PBDEs.[21,22] However, a training set is needed to set up the relationships between the properties and structural descriptors.
To the best of our knowledge, no experimental log KOW data of HO-PBDEs and MeO-PBDEs are available in the literature. Therefore, the objective of the present paper is to measure the log KOW values of selected PBDE metabolites by RP-HPLC under both isocratic and gradient elution. A series of widely applied algorithms for log KOW estimation are evaluated for their ability to predict log KOW values of the PBDE metabolites. Correlations between the RP-HPLC-derived and calculated log KOW are analysed and discussed. A QSPR model based on topological descriptors and RP-HPLC-derived log KOW is developed for the RP-HPLC-derived log KOW estimation of some PBDE metabolites reported in the literature or commercially available, which have not been determined by the RP-HPLC methods presented. Further, the factor analysis is carried out by the theoretical linear salvation/free-energy relationships (TLSER) to screen the most important parameters affecting their partition between n-octanol and water.
Experimental
Theory of measurement of k′, kw and KOW
The RP-HPLC capacity factor, k′, of a sample species can be expressed by Eqn 1:

where tR and t0 are the retention time of the species under investigation and the dead time, respectively. This capacity factor is related to the volume fraction of methanol (φ) in the mobile phase. Their relation can be expressed by Eqn 2:

where kw is the chromatographic hydrophobicity parameter of the species (i.e. the RP-HPLC capacity factor of the species when pure water is used as mobile phase), and S is a solute-dependent solvent strength parameter specific to the organic modifier in the stationary phase under consideration.[19,23,24] kw can be obtained by plotting a series of log k′ values measured at various mobile phase compositions against the proportion of methanol in the mobile phase and extrapolation to 0% methanol.
The n-octanol–water partitioning coefficient, log KOW, of the species can be correlated with its chromatographic hydrophobicity parameter, kw by Eqn 3[25]:

where a and b are empirical constants.
The gradient elution was also employed to describe analytes’ hydrophobic indices because it can reduce retention times of highly hydrophobic compounds, and also reduce peak spreading during the elution. In this situation, the estimation relies on k′ v. log KOW regressions, and the relationship is no longer linear but can be approximated by an exponential relationship[20]:

where A, B and C are empirical constants.
Chemicals
2,2′,4,4′-tetrabromodiphenyl ether (BDE-47) and 2,2′,4,4′,6-pentabromodiphenyl ether (BDE-100) were obtained from Cambridge Isotope Laboratories, Inc. (Andover, MA, USA). Phenanthrene (Phen) was obtained from Sigma–Aldrich (St. Louis, MO, USA). p,p′-dichloro-diphenyl-trichloro-ethane (p,p′-DDT) was obtained from the Agro-Environmental Protection Institute of the Ministry of Agriculture, China. All other chemicals (pyrene, 2,4-dichlorophenol (DCP), 2,4,6-trichlorophenol (TCP) and pentachlorophenol (PCP)) were purchased from Acros (Geel, Belgium). These chemicals were used as calibration standards for log KOW measurement by RP-HPLC, and their log KOW were found in the literature.[17,26–28]
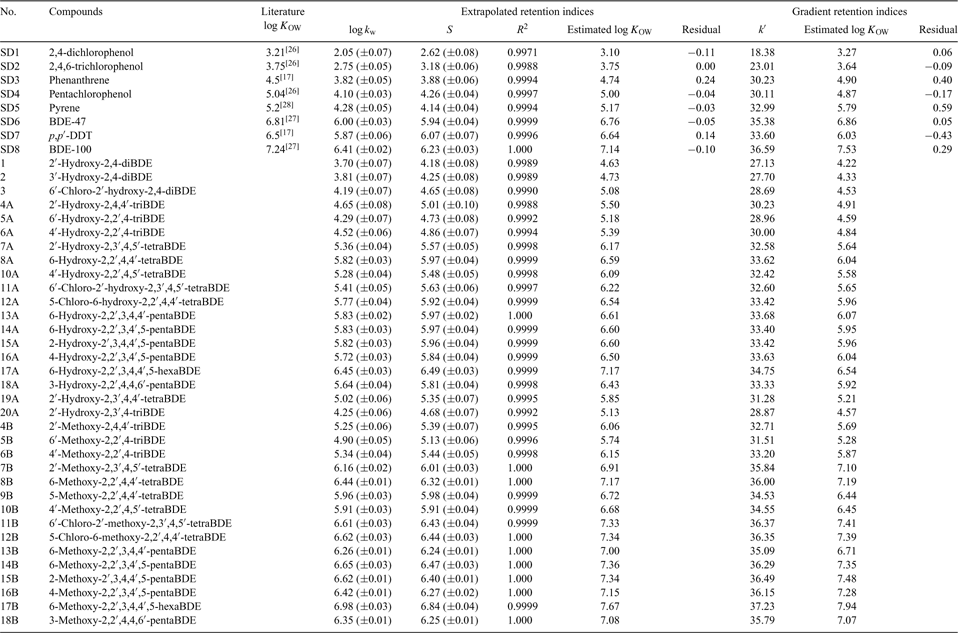
PBDE metabolites used in the present study were synthesised according to the literature method[29] and were characterised by nuclear magnetic resonance (1HNMR), mass spectrometry (MS) and gas/liquid chromatography–mass spectrometry(GC/LC-MS). All these analytes are listed in Table 1. Methanol was of HPLC grade and was obtained from Tedia (Fairfield, OH, USA).
RP-HPLC conditions
An Agilent 1200 Series HPLC (Palo Alto, CA, USA) with a quaternary pump, vacuum degasser, autosampler, and a controlled thermostat was used in all experiments. Analytes were detected with an Agilent 1200 Series diode array detector set at 254 and 210 nm and a bandwidth of 4 nm. Measurements were made at 30°C, on an Agilent Rx-C18 column (5 μm, 250 × 4.6 mm inner diameter, i.d.), a column made by chemically bonding a monolayer of dimethyl-octadecyl silane stationary phase to a porous-silica microsphere with a controlled pore size of 80 Å.
Mobile phases for isocratic elution ranged from 75 to 95% (75, 80, 85, 90, and 95%, respectively) methanol with 0.2% (v/v) acetic acid in water. The pH values of different composition mobile phases ranged from 4.2 to 4.9. A flow rate of 1.0 mL min–1 was adopted. Sodium nitrate was used as an unretained compound to determine the dead time (t0). For gradient elution, methanol content of the mobile phase was increased linearly from 20 to 100% over 60 min at a flow rate of 1.3 mL min–1. Dead time (t0) was determined under isocratic elution with water/methanol at a volume ratio of 80 : 20 using sodium nitrate as the unretained compound.[19]
In all chromatographic runs, samples were dissolved in methanol and concentrations generally ranged from 100 to 500 μg mL–1. All the analytes were injected as single standards and the injection volume was 10 μL.
Estimation of log KOW
log KOW of the selected HO-PBDE and MeO-PBDE metabolites were estimated using a series of widely adopted algorithms, including ClogP, KowWin, AclogP, MlogP, AlogP, MilogP and XlogP. AlogP is based on E-state indices (neural network), MilogP is based on counting atoms, bonds, fragments or functional groups, XlogP is based on atom contributions with correction factors, and the remaining algorithms are fragment-based. ClogP was implemented in ChemBioOffice Ultra 2008 Trial Version (Cambridge Software Co., Cambridge, MA, USA); all the others were obtained from the internet calculator: http://www.vcclab.org/lab/alogps/ (accessed 6 October 2008).
Calculation of structural descriptors and QSPR analysis
Molecular geometry was optimised and quantum chemical descriptors were calculated by the semi-empirical orbital MOPAC 7.0 procedures according to method AM1. The calculated individual structural descriptors were the average polarisability (α), dipole moment (μ), energy of the highest occupied molecular orbital (Ehomo), energy of the lowest unoccupied molecular orbital (Elumo), the most positive partial Mulliken charge on a hydrogen atom (qH+), and the most negative atomic partial Mulliken charge in the molecule (q–). Molecular volume (Vm) was calculated using the HyperChem package 7.5 (Evaluation Version) (Hyper-Cube, Waterloo, Canada). Molecular connectivity indices and Kier’s molecular shape index were calculated according to their definitions by Matlab 7.0.
Statistical analysis and model validation
All the regressions were performed on SPSS 11.5 (SPSS Inc., Chicago, IL, USA). The goodness of the correlation was tested by the correlation coefficient (R2), the F-test (F), and standard error of estimation (s.e.).
Cross-validation is a practical and reliable method for testing the significance of a model. Hence, the leave-one-out (LOO) method was used to validate the final model. In LOO cross-validation of the current work, in the first step one of the target compounds was excluded from the training set, and a model was built for n – 1 samples between descriptors and log KOW using multilinear regression. Next, the value of log KOW was predicted from the model for the excluded compound. The procedure above was repeated until every sample in the total data set was used for a prediction. The predictive ability of the models is characterised by the cross-validated correlation coefficient (Rcv2) given by:

where Yi, Ŷi and
Results and discussion
Measured log KOW by RP-HPLC
Under isocratic elution, linear relationships (R2 > 0.99) between log k′ and φ were observed for all the calibration standards and PBDE metabolites. All the log kw, extrapolated retention indices, and S values obtained are tabulated in Table 1. A plot of log kw v. S of PBDE metabolites revealed a straight line conforming to Eqn 6, and the good linearity indicated a uniform retention mechanism.[30]

where n = 34, R2 = 0.9905, s.e. = 0.0668, and F = 3401.5.
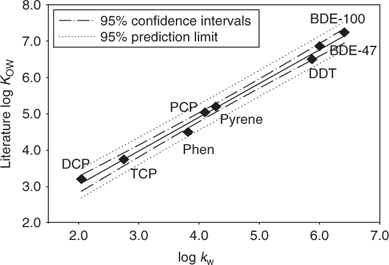
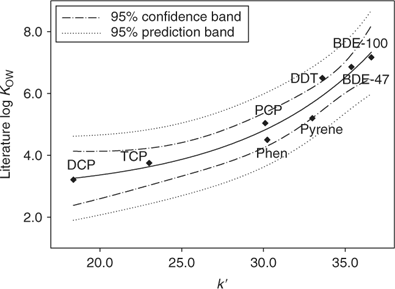
Figs 1 and 2 show the calibration curves correlating the values of log kw (extrapolated retention indices) and k′ (gradient retention indices) of the calibration standards to their literature log KOW values. A linear correlation was observed between log kw and log KOW, whereas an exponential relationship was obtained between log KOW and k′.
|
|
The log KOW values of the PBDE metabolites obtained from their measured capacity factors are listed in Table 1. The two sets of estimated log KOW values obtained by extrapolated retention indices (log KOW(Extra)) and gradient retention indices (log KOW(Gra)) bear a statistically significant correlation (Eqn 7):

When log KOW(Extra) < 7, log KOW estimated by extrapolated retention indices were slightly higher than those obtained from gradient elution, and the difference generally narrowed as the hydrophobicity of the compounds increased; in other cases, log KOW estimated by gradient elution were slightly higher than those obtained from extrapolated retention indices (Fig. A1 of the Accessory publication). This is partly consistent with the phenomena observed in the literature.[31,32] The high organic modifier fraction required for the highly hydrophobic compounds in the isocratic elution may make the similarity between the stationary phase–eluent system and the octanol–water system become increasingly tenuous, and gradient elution is considered to be more suitable for the highly hydrophobic compounds,[18,20] but linear correlation between log kw and log KOW has been observed in the literature for log KOW as high as 8.[32] Judging from the significant similarity of these two calibration curves between log kw and log KOW for log KOW ≤ 7.2 of calibration chemicals in the present study, the log KOW values of the PBDE metabolites estimated by extrapolated retention indices appears to be more reliable, based on the stronger statistical correlation of that regression.
However, previous studies found that gradient elution gave better estimates of log KOW values.[18–20] This contradicted findings were due to the methods utilised, including initial composition of the mobile phase, the increased rate and mode (linear or non-linear) of methanol content, and the flow rate. The set of reference compounds and their uncertain log KOW values may have had an influence as well.
QSPR analysis
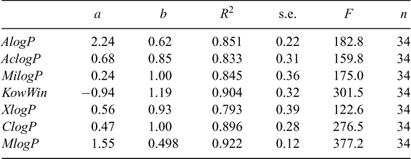
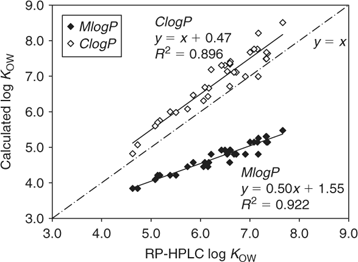
Computer-assisted calculation is a useful tool to estimate log KOW values of chemicals when no experimental values are available. Table A1 of the Accessory publication lists all the log KOW values of the PBDE metabolites calculated by some popular methods. Table 2 in the present paper summarises the correlations between the RP-HPLC-measured log KOW and those obtained by computation. It can be seen that log KOW estimated by the computation software correlates significantly with the RP-HPLC-measured values (α = 0.05); ClogP is considered as the reference algorithm for log KOW calculation taking R2, a and b into account (Table 2).
|
Fig. 3 shows the plot of the RP-HPLC-measured log KOW against the estimated log KOW values by ClogP and the method with the highest R2, MlogP, both using fragment-based algorithms. Obviously both methods describe the same trend revealed by RP-HPLC measurements; ClogP simulated the log KOW values very well but overestimated by ~0.4 log units generally, whereas MlogP underestimated and the difference grew larger as the hydrophobicity of the compounds increased.
|
The deviations between universal calculated and RP-HPLC-derived log KOW are significant, which may be attributed to the deficient log KOW database for fragment generation. It seems necessary to establish models suited to PBDE metabolites with high accuracy based on the specific PBDE metabolites’ RP-HPLC-derived log KOW. In the current work, molecular topological descriptors, including molecular connectivity indices, which have proved to be particularly successful in estimating various partitioning properties of persistent organic pollutants,[33] and Kier’s shape index (Kappa index), which can reflect the flexibility attributes of structures,[34] were used to set up the QSPR.
The resulting model, Eqn 8, is given by stepwise regression analysis of log KOW of the compounds v. these molecular topological descriptors.

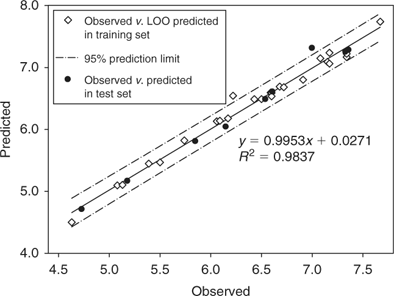
where n = 34, R2 = 0.984, Rcv2 = 0.981, s.e. = 0.107, and F = 936.4.
It is evident that the model is able to correlate log KOW to the third-order Kier’s shape index (3K) and the seventh-order molecular connectivity index (7χ) with high statistical significance (R2 = 0.984 and Rcv2 = 0.981). Results also showed 7χ explained 86.0% of the total variance according to the analysis of variance. Both 7χ and 3K are related to the molecular volume (Vm) (Eqns 9–10); 3K also can reflect the relative positions of the HO (or MeO) group and the bromine substituents on the PBDE metabolites. For example, the 3K values of the isomeric 6-methoxy-2,2′,4,4′-tetraBDE (8B) and 5-methoxy-2,2′,4,4′-tetraBDE (9B) are 4.1401 and 3.8925, respectively.


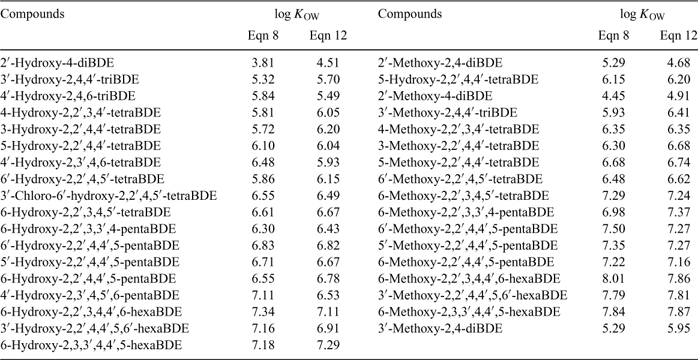
In order to assess the reliability and external predictive power of the model (Eqn 8) developed in the present study, the whole data set was divided into the test set and the training set, and LOO cross-validation for the training set was performed. The test set contained nine PBDE metabolites (2, 5A, 19A, 6B, 12A, 13A, 13B, 11B, 14B). Results show the predicted log KOW values are consistent with the experimental values (R2 for the training set and the test set were 0.983 and 0.988 respectively), which confirmed the good reliability and predictive power of the QSPR model. Fig. 4 shows the plot of the predicted v. experimental log KOW for the training set and the test set. Finally, the QSPR model was used to estimate the log KOW values of some of the PBDE metabolites that are commercially available or have appeared in the literature. Results are tabulated in Table 3.
|
|
MTLSER analysis
Topological descriptors are considered to be the most efficient in describing and quantifying properties related to non-specific molecular interactions such as hydrophobic and dispersion forces.[33] However, they are not so good at interpreting physical meaning, but linear salvation/free-energy relationships (LSERs) are.[35,36] In order to get some insightful information in the present study, a modified theoretical LSER (MTLSER) model,[37] as shown in Eqn 11, was employed because there is no experimental solvatochromic parameter available for PBDE metabolites.

where XYZ represents solubility or solvent-dependent properties (often expressed as the logarithm of measured properties), and α, μ, Ehomo, Elumo, qH+ and q– represent average polarisability, dipole moment, energy of the highest occupied molecular orbital, energy of the lowest unoccupied molecular orbital, the most positive partial Mulliken charge on a hydrogen atom, and the most negative atomic partial Mulliken charge in the molecule, respectively, with m, s, ai, bi (i = 1, 2) being empirical constants.
For all the log KOW data analysed, the step-wise regression result was expressed as Eqn 12:

where n = 34, R2 = 0.930, Rcv2 = 0.916, s.e. = 0.22, and F = 205.6.
It seems that the polarisability (α) and q– of the analytes are the two most significant parameters affecting PBDE metabolite log KOW. It is consistent with the concept that lipophilicity is the outcome of bulk (expressed by α here) and polar factors (expressed by q– here).[38] Greater molecular size resulted in higher log KOW, and increasing absolute values of q– led to a decrease in log KOW values because q– characterises the molecular ability to donate electrons or accept protons in intermolecular electrostatic interaction and PBDE metabolites with large absolute values of q– tend to have great intermolecular electrostatic interaction. It is also quite similar to the phenomena observed by Wang et al.[21] in their study of PBDE partition between n-octanol and air (KOA) where q–, μ and α were found to be the most significant parameters.
Eqn 12 was also used to predict these PBDE metabolite log KOW values, which are listed in Table 3. Compared with the values calculated by Eqn 8, most agreed very well, with deviations lower than 0.49,[38] except four cases, with the highest deviation at 0.70. However, Eqn 12-derived log KOW values are conformation-dependent; the deviations may be reduced by sufficient optimisation of the geometries of all analytes.
Conclusions
In the present study, both isocratic elution and gradient elution RP-HPLC have been used to measure the n-octanol–water partitioning coefficients of selected hydroxylated and methoxylated metabolites of polybrominated diphenyl ethers. To the best of our knowledge, this is the first time that KOW of PBDE metabolites are experimentally measured. Based on the stronger statistical correlation of that regression between the extrapolated log kw and log KOW of the calibration standards up to 7.2, the extrapolated retention index-derived log KOW values appeared to be more reliable for the PBDE metabolites. These RP-HPLC-measured log KOW values were compared with those obtained by computation using various available software, and a fragment-based algorithm was found to produce estimated values closest to the measured log KOW. Then a QSPR model of good reliability and predictive power for the estimation of RP-HPLC-derived log KOW of PBDE metabolites was established and applied. Theoretical linear salvation/free-energy relationship analysis showed that the two most important parameters affecting PBDE metabolites’ partition between water and n-octanol are polarisability and the most negative atomic partial Mulliken charge in the molecule (q–), which confirmed the concept that lipophilicity can be factorised in bulk and polarity terms.
Acknowledgements
The present work was jointly funded by the National Natural Science Foundation of China and the Research Grants Council of the Hong Kong Special Administrative Region, China (grant 20518002/N_CityU110/05), and the National Natural Science Foundation of China (grants 20577020 and 20737001).
[1]
[2]
U. Sellstrom ,
A. Kierkegaard ,
C. de Wit ,
B. Jansson ,
Polybrominated diphenyl ethers and hexabromocyclododecane in sediment and fish from a Swedish river.
Environ. Toxicol. Chem. 1998
, 17, 1065.
| Crossref | GoogleScholarGoogle Scholar |
CAS |

[3]
J. L. Domingo ,
Human exposure to polybrominated diphenyl ethers through the diet.
J. Chromatogr. A 2004
, 1054, 321.
| Crossref | GoogleScholarGoogle Scholar |
CAS |
PubMed |

[4]
K. Akutsu ,
S. Hori ,
Polybrominated diphenyl ether flame retardants in foodstuffs and human milk.
J. Food Hyg. Soc. Jpn 2004
, 45, 175.
|
CAS |

[5]
A. Sjodin ,
L. Hagmar ,
E. Klasson-Wehler ,
K. Kronholm-Diab ,
E. Jakobsson ,
A. Bergman ,
Flame retardant exposure: polybrominated diphenyl ethers in blood from Swedish workers.
Environ. Health Perspect. 1999
, 107, 643.
| Crossref | GoogleScholarGoogle Scholar |
CAS |
PubMed |

[6]
E. L. Teuten ,
L. Xu ,
C. M. Reddy ,
Two abundant bioaccumulated halogenated compounds are natural products.
Science 2005
, 307, 917.
| Crossref | GoogleScholarGoogle Scholar |
CAS |
PubMed |

[7]
G. Marsh ,
M. Athanasiadou ,
I. Athanassiadis ,
A. Sandholm ,
Identification of hydroxylated metabolites in 2,2′,4,4′-tetrabromodiphenyl ether-exposed rats.
Chemosphere 2006
, 63, 690.
| Crossref | GoogleScholarGoogle Scholar |
CAS |
PubMed |

[8]
J. Verreault ,
G. V. Gabrielsen ,
S. G. Chu ,
D. C. G. Muir ,
M. Andersen ,
A. Hamaed ,
R. J. Letcher ,
Flame retardants and methoxylated and hydroxylated polybrominated diphenyl ethers in two Norwegian Arctic top predators: glaucous gulls and polar bears.
Environ. Sci. Technol. 2005
, 39, 6021.
| Crossref | GoogleScholarGoogle Scholar |
CAS |
PubMed |

[9]
K. Valters ,
H. X. Li ,
M. Alaee ,
I. D’Sa ,
G. Marsh ,
A. Bergman ,
R. J. Letcher ,
Polybrominated diphenyl ethers and hydroxylated and methoxylated brominated and chlorinated analogues in the plasma of fish from the Detroit River.
Environ. Sci. Technol. 2005
, 39, 5612.
| Crossref | GoogleScholarGoogle Scholar |
CAS |
PubMed |

[10]
A. Kierkegaard ,
A. Bignert ,
U. Sellstrom ,
M. Olsson ,
L. Asplund ,
B. Jansson ,
C. A. de Wit ,
Polybrominated diphenyl ethers (PBDEs) and their methoxylated derivatives in pike from Swedish waters with emphasis on temporal trends, 1967–2000.
Environ. Pollut. 2004
, 130, 187.
| Crossref | GoogleScholarGoogle Scholar |
CAS |
PubMed |

[11]
G. Marsh ,
M. Athanasiadou ,
A. Bergman ,
L. Asplund ,
Identification of hydroxylated and methoxylated polybrominated diphenyl ethers in Baltic Sea salmon (Salmo salar) blood.
Environ. Sci. Technol. 2004
, 38, 10.
| Crossref | GoogleScholarGoogle Scholar |
CAS |
PubMed |

[12]
S. Sinkkonen ,
A. L. Rantalainen ,
J. Paasivirta ,
M. Lahtipera ,
Polybrominated methoxy diphenyl ethers (MeO-PBDEs) in fish and guillemot of Baltic, Atlantic and Arctic environments.
Chemosphere 2004
, 56, 767.
| Crossref | GoogleScholarGoogle Scholar |
CAS |
PubMed |

[13]
A. Malmvarn ,
G. Marsh ,
L. Kautsky ,
M. Athanasiadou ,
A. Bergman ,
L. Asplund ,
Hydroxylated and methoxylated brominated diphenyl ethers in the red algae Ceramium tenuicorne and blue mussels from the Baltic Sea.
Environ. Sci. Technol. 2005
, 39, 2990.
| Crossref | GoogleScholarGoogle Scholar | PubMed |

[14]
J. A. Platts ,
S. P. Oldfield ,
M. M. Reif ,
A. Palmucci ,
E. Gabano ,
D. Osella ,
The RP-HPLC measurement and QSPR analysis of log Po/w values of several Pt(II) complexes.
J. Inorg. Biochem. 2006
, 100, 1199.
| Crossref | GoogleScholarGoogle Scholar |
CAS |
PubMed |

[15]
W. B. Neely ,
D. R. Branson ,
G. E. Blau ,
Partition coefficient to measure bioconcentration potential of organic chemicals in fish.
Environ. Sci. Technol. 1974
, 8, 1113.
| Crossref | GoogleScholarGoogle Scholar |
CAS |

[16]
F. A. Gobas ,
J. M. Lahittete ,
G. Garofalo ,
W. Y. Shiu ,
D. Mackay ,
A novel method for measuring membrane–water partition coefficients of hydrophobic organic chemicals: comparison with 1-octanol–water partitioning.
J. Pharm. Sci. 1988
, 77, 265.
| Crossref | GoogleScholarGoogle Scholar |
CAS |
PubMed |

[17]
[18]
S. J. Hayward ,
Y. D. Lei ,
F. Wania ,
Comparative evaluation of three high-performance liquid chromatography-based Kow estimation methods for highly hydrophobic organic compounds: polybrominated diphenyl ethers and hexabromocyclododecane.
Environ. Toxicol. Chem. 2006
, 25, 2018.
| Crossref | GoogleScholarGoogle Scholar |
CAS |
PubMed |

[19]
A. Kaune ,
R. Bruggemann ,
A. Kettrup ,
High-performance liquid chromatographic measurement of the 1-octanol–water partition coefficient of s-triazine herbicides and some of their degradation products.
J. Chromatogr. A 1998
, 805, 119.
| Crossref | GoogleScholarGoogle Scholar |
CAS |

[20]
A. Kaune ,
M. Knorrenschild ,
A. Kettrup ,
Predicting 1-octanol–water partition coefficient by high-performance liquid chromatography gradient elution.
Fresen. J. Anal. Chem. 1995
, 352, 303.
| Crossref | GoogleScholarGoogle Scholar |
CAS |

[21]
Z.-Y. Wang ,
X.-L. Zeng ,
Z.-C. Zhai ,
Prediction of supercooled liquid vapor pressures and n-octanol/air partition coefficients for polybrominated diphenyl ethers by means of molecular descriptors from DFT method.
Sci. Total Environ. 2008
, 389, 296.
| Crossref | GoogleScholarGoogle Scholar |
CAS |
PubMed |

[22]
H. Y. Xu ,
H. W. Zou ,
Q. S. Yu ,
Y. H. Wang ,
H. Y. Zhang ,
H. X. Jin ,
QSPR/QSAR models for prediction of the physicochemical properties and biological activity of polybrominated diphenyl ethers.
Chemosphere 2007
, 66, 1998.
| Crossref | GoogleScholarGoogle Scholar |
CAS |
PubMed |

[23]
K.-H. Lam ,
H.-Y. Wai ,
K. M. Y. Leung ,
V. W. H. Tsang ,
C.-F. Tang ,
R. Y. H. Cheung ,
M. H. W. Lam ,
A study of the partitioning behavior of Irgarol-1051 and its transformation products.
Chemosphere 2006
, 64, 1177.
| Crossref | GoogleScholarGoogle Scholar |
CAS |
PubMed |

[24]
S. Kayillo ,
G. R. Dennis ,
R. A. Shalliker ,
An assessment of the retention behaviour of polycyclic aromatic hydrocarbons on reversed phase stationary phases: selectivity and retention on C18 and phenyl-type surfaces.
J. Chromatogr. A 2006
, 1126, 283.
| Crossref | GoogleScholarGoogle Scholar |
CAS |
PubMed |

[25]
L. R. Snyder ,
J. W. Dolan ,
J. R. Gant ,
Gradient elution in high-performance liquid chromatography I. Theoretical basis for reversed-phase systems.
J. Chromatogr. A 1979
, 165, 3.
| Crossref | GoogleScholarGoogle Scholar |
CAS |

[26]
Y. Z. Song ,
J. F. Zhou ,
S. J. Zi ,
J. M. Xie ,
Y. Ye ,
Theoretical analysis of the retention behavior of alcohols in gas chromatography.
Bioorg. Med. Chem. 2005
, 13, 3169.
| Crossref | GoogleScholarGoogle Scholar |
CAS |
PubMed |

[27]
E. Braekevelt ,
S. A. Tittlemier ,
G. T. Tomy ,
Direct measurement of octanol–water partition coefficients of some environmentally relevant brominated diphenyl ether congeners.
Chemosphere 2003
, 51, 563.
| Crossref | GoogleScholarGoogle Scholar |
CAS |
PubMed |

[28]
L. K. Granier ,
P. Lafrance ,
P. G. C. Campbell ,
An experimental design to probe the interactions of dissolved organic matter and xenobiotics: bioavailability of pyrene and 2,2′,5,5′-tetrachlorobiphenyl to Daphnia magna.
Chemosphere 1999
, 38, 335.
| Crossref | GoogleScholarGoogle Scholar |
CAS |
PubMed |

[29]
G. Marsh ,
R. Stenutz ,
A. Bergman ,
Synthesis of hydroxylated and methoxylated polybrominated diphenyl ethers – natural products and potential polybrominated diphenyl ether metabolites.
Eur. J. Org. Chem. 2003
, 2566.
| Crossref | GoogleScholarGoogle Scholar |
CAS |

[30]
D. Vrakas ,
I. Panderi ,
D. Hadjipavlou-Litina ,
A. Tsantili-Kakoulidou ,
Investigation of the relationships between logP and various chromatographic indices for a series of substituted coumarins. Evaluation of their similarity/dissimilarity using multivariate statistics.
QSAR Comb. Sci. 2005
, 24, 254.
| Crossref | GoogleScholarGoogle Scholar |
CAS |

[31]
A. Paschke ,
P. L. Neitzel ,
W. Walther ,
G. Schuurmann ,
Octanol/water partition coefficient of selected herbicides: determination using shake-flask method and reversed-phase high-performance liquid chromatography.
J. Chem. Eng. Data 2004
, 49, 1639.
| Crossref | GoogleScholarGoogle Scholar |
CAS |

[32]
A. Paschke ,
M. Manz ,
G. Schuurmann ,
Application of different RP-HPLC methods for the determination of the octanol/water partition coefficient of selected tetrachlorobenzyltoluenes.
Chemosphere 2001
, 45, 721.
| Crossref | GoogleScholarGoogle Scholar |
CAS |
PubMed |

[33]
A. Sabljic ,
QSAR models for estimating properties of persistent organic pollutants required in evaluation of their environmental fate and risk.
Chemosphere 2001
, 43, 363.
| Crossref | GoogleScholarGoogle Scholar |
CAS |
PubMed |

[34]
L. B. Kier ,
A shape index from molecular graphs.
Quant. Struct.-Act. Rel. 1985
, 4, 109.
| Crossref | GoogleScholarGoogle Scholar |
CAS |

[35]
X. L. Liu ,
H. Tanaka ,
A. Yamauchi ,
B. Testa ,
H. Chuman ,
Lipophilicity measurement by reversed-phase high-performance liquid chromatography (RP-HPLC): a comparison of two stationary phases based on retention mechanisms.
Helv. Chim. Acta 2004
, 87, 2866.
| Crossref | GoogleScholarGoogle Scholar |
CAS |

[36]
R. Kaliszan ,
M. A. van Straten ,
M. Markuszewski ,
C. A. Cramers ,
H. A. Claessens ,
Molecular mechanism of retention in reversed-phase high-performance liquid chromatography and classification of modern stationary phases by using quantitative structure–retention relationships.
J. Chromatogr. A 1999
, 855, 455.
| Crossref | GoogleScholarGoogle Scholar |
CAS |
PubMed |

[37]
J. Chen ,
L. Wang ,
Using MTLSER model and AM1 Hamiltonian in quantitative structure–activity relationship studies of alkyl (1-phenylsulfonyl)cycloalkane-carboxylates.
Chemosphere 1997
, 35, 623.
| Crossref | GoogleScholarGoogle Scholar |
CAS |

[38]
D. Vrakas ,
A. Tsantili-Kakoulidou ,
D. Hadjipavlou-Litina ,
Exploring the consistency of logP estimation for substituted coumarins.
QSAR Comb. Sci. 2003
, 22, 622–629.
| Crossref | GoogleScholarGoogle Scholar |
CAS |


