Effects of plant population and row spacing on grain yield of aerial-sown and drill-sown rice
B. W. Dunn A D , T. S. Dunn A , J. H. Mitchell
  B and J. Brinkhoff C
A NSW Department of Primary Industries, Yanco Agricultural Institute, Yanco, NSW 2703, Australia.
B School of Agriculture and Food Sciences, The University of Queensland, St Lucia, Qld 4072, Australia.
C University of New England, Applied Agricultural Remote Sensing Centre, Armidale, NSW 2351, Australia.
D Corresponding author. Email: brian.dunn@dpi.nsw.gov.au
Crop and Pasture Science 71(3) 219-228 https://doi.org/10.1071/CP19421
Submitted: 14 October 2019 Accepted: 17 January 2020 Published: 1 April 2020
Journal compilation © CSIRO 2020 Open Access CC BY-NC-ND
Abstract
Objective guidelines about plant population are essential to ensure that yield potential of rice grain is not compromised. Drill-sowing of rice is increasing in popularity in many rice-growing regions of the world in response to a requirement for increased water productivity, but little information is available on row-spacing widths required to maximise grain yield potential. This research investigated the impacts of plant population on grain yield and yield components for aerial- and drill-sown rice, and the effects of row-spacing width for drill-sown rice grown in a temperate environment. Ten aerial-sown and five drill-sown experiments were conducted in south-eastern Australia over three seasons using four semi-dwarf rice varieties. Plant populations ranged from 7 to 396 plants m–2.
Plant populations as low as 30 plants m–2 were able to achieve grain yields >12 t ha–1 but only when the plants were uniformly distributed. At a population of ~100 plants m–2, the impact of plant-stand distribution was negligible. Grain yield was maintained across a large range of plant populations, mainly through compensatory effects of more tillers per plant and more grains per panicle at lower plant populations.
For aerial-sown rice, maximum grain yield (up to 14.9 t ha–1) was always achieved with a minimum plant population of 100 plants m–2, and likewise for drill-sown rice provided the row spacing was ≤27 cm. At equivalent plant populations, 36-cm row spacing produced lower grain yield than narrower row spacings. When large gaps existed between plants within the rows, neighbouring plants could not compensate for the gap at the wider 36-cm row spacing, and grain yield was reduced. A practical optimal plant population of 100–200 plants m–2 was found to be suitable for the semi-dwarf varieties used in this study for both aerial- and drill-sowing methods.
Introduction
Successful establishment is the first step to achieving a high-yielding and profitable crop of rice (Oryza sativa L.). Across all sowing and irrigation practices, the initial aim is to achieve a uniform plant stand that has sufficient plants to ensure that grain yield potential is not limited by plant number. The dominant method used for sowing rice in south-eastern Australia in the 1990s was aerial sowing of pre-germinated seed into flooded fields (McDonald 1994). In response to a requirement for increased water productivity, drill sowing of seed into dry soil, followed by intermittent irrigation to establish plants (Dunn and Ford 2018), is increasing in popularity, accounting for >40% of rice grown in the 2017–18 season and 70% in 2018–19 (C. Quirk, SunRice, pers. comm., 2018).
As Australian growers adopted sowing methods suitable for their soil types, irrigation layout, crop rotations and water availability, they continued to follow the plant-population recommendation of 200–300 plants m–2 developed from farmer surveys of mainly aerial-sown crops (NSW DPI 2012); however, the reliability of the recommendation has been questioned (Chaudhary et al. 2002).
In other countries where the production of rice is highly mechanised, research has been conducted to determine the optimal plant population requirements to achieve maximum grain yield. The seed-rate recommendation for drill-seeded conventional rice varieties in Arkansas is 323 seeds m–2 to obtain an optimum plant population of 93–185 plants m–2 (Hardke et al. 2016). In Louisiana, the recommendation was 215–323 seeds m–2 to obtain a plant population of 108–161 seedlings m–2 (Harrell and Blanche 2010). In tropical rice-growing areas where crop yield may be impacted by disease, reducing seed rates can be useful in disease management (Hardke et al. 2016). Diseases are not a significant problem in the temperate rice-growing areas of south-eastern Australian; therefore, plant-population recommendations can be based primarily on an agronomic and physiological basis to maximise grain yield.
Recent years have seen an increase in drill-sown rice, particularly in highly mechanised, broadacre rice-growing environments. The uptake of drill sowing has been driven by several factors including the opportunity to reduce input costs without reducing productivity and reduced risk of poor establishment due to birds, wind and slime (Dunn and Ford 2018), as well as the most critical factor of reducing water use (Dunn and Gaydon 2011). At the same time, row spacing has increased up to widths of 30 cm owing to the expansion of reduced-tillage and stubble-retention systems in winter cropping, with the same equipment often used for drill sowing of rice. Wide row spacing also increases the opportunity for inter-row cultivation and spraying. Recommendations on row-spacing width for drill-seeded rice in Arkansas are 15–20 cm to produce maximum yields, and as row spacing increases, the importance of uniform stand density also increases (Hardke et al. 2016). No information on the influence of row spacing on grain yield of rice grown in south-eastern Australia is currently available.
The objectives of this paper were to: (i) determine the optimum plant population to maximise grain yield for Australian semi-dwarf rice varieties when aerial- and drill-sowing methods are used in a temperate environment; (ii) determine the appropriate row spacing to maximise grain yield of drill-sown rice in the same environment.
Methods
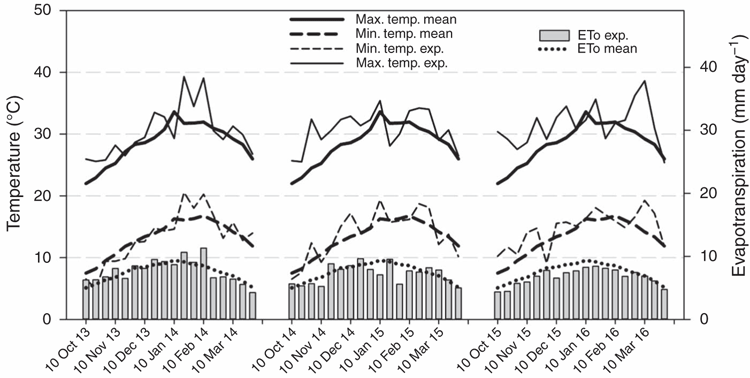
Field experiments were established in aerial- and drill-sown commercial rice fields over three seasons (2013–14, 2014–15 and 2015–16). The experiments were performed in the Murrumbidgee and Murray Valleys (~34–36°S, 143–147°E). These are the major rice-growing regions of south-eastern Australia and cover the range of soil types commonly used for rice growing. Initial soil properties of the experimental fields are presented in Table 1. The region has a temperate climate characterised by hot dry summers with low humidity. One-third of a month (i.e. ~10-day) mean (57 years) temperatures and reference evapotranspiration (ETo) for Griffith (40 and 45 km, respectively, from the Leeton Field Station and Yanco Agricultural Institute experimental sites) are presented in Fig. 1, together with the values recorded during the three experimental seasons.

|
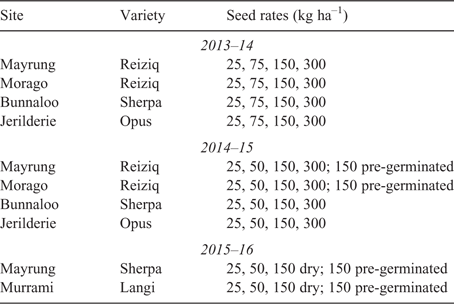
Ten experiments were established in commercial rice fields being prepared for aerial sowing (Table 2) and using the same variety as grown in the remainder of the field. The growers prepared the experimental sites with the same fertiliser rates (nitrogen (N) and phosphorus) and herbicide and pesticide treatments as used on their field (Troldahl and Stevens 2019). In the first season (2013–14), all seed-rate treatments (25, 75, 150 and 300 kg ha–1) were established by spreading dry seed onto the dry soil surface within 2 days before permanent water being applied (Table 2). Once permanent water is applied, the field remains continuously flooded until drained for harvest. A 1.8-m-wide drop spreader (Gandy, Owatonna, MN, USA) was used to establish plots 2 m wide by 10 m long. This sowing method was used to simulate aerial sowing, while ensuring an even distribution of seed across the plots. All aerial-sown experiments included four replications of the seed-rate treatments, which were fully randomised within replicates.
|
In the second season (2014–15), a pre-germinated seed treatment (seed rate 150 kg ha–1) was included in two experiments, and in the third season (2015–16), the pre-germinated seed treatment (150 kg ha–1) was included in all aerial-sown experiments (Table 2). The seed for the pre-germinated treatments was soaked in water for 24 h, drained for 24 h, and then hand-spread onto the flooded plots. The aim of the pre-germinated seed treatment was to achieve higher plant populations than had been achieved in the previous seasons when dry seed was spread onto the soil surface before permanent water.
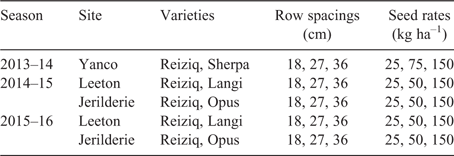
Over the three seasons of the study, five drill-sown experiments examining plant population and row spacing were also established. These experiments were at Yanco Agricultural Institute (Yanco, 34°36′56″S, 146°25′06″E) and Leeton Field Station (Leeton, 34°36′25″S, 146°21′44″E) in the Murrumbidgee Valley, and at ‘Old Coree’ (Jerilderie, 35°20′02″S, 145°31′40″E) in the Murray Valley. Details including the treatments and varieties used in the drill-sown experiments are presented in Table 3. The row-spacing and seed-rate treatments were sown with a double-disc seeder to create plots 1.8 m wide by 10 m long with the seed placed at a depth of ~3 cm. The drill-sown experiments all involved a split-split plot design with variety and row spacing as the main plots, and seeding rate as the subplots. Each treatment had three replications. The drill-sown experiments were flush-irrigated three times, and when the rice seedlings reached the 4-leaf stage, a commercial rate of N (92–240 kg N ha–1 as 200–520 kg ha–1 of urea) was applied to the dry soil surface immediately before application of permanent water. Weed control was undertaken as per standard commercial practice for drill-sown rice in southern Australia (Troldahl and Stevens 2019).
|
The plant population in the aerial-sown experiments was measured when the plants reached the 2–3-leaf stage. The number of seedlings within a 1-m–2 area was counted at three locations in each plot, with the centre of each location marked with an identifier peg. In the drill-sown experiments, plant numbers were counted before application of permanent water with a 1-m length of six, four or three rows counted, respectively, for the 18-, 27-, and 36-cm row-spacing treatments. The counts were taken at three locations in each plot, each marked with an identifier peg so that future plant samples could be collected at sites of known plant population. There was no reduction in plant population due to pests in any of the experiments.
At both panicle initiation (PI) and maturity, aboveground biomass samples were hand-harvested from the marked location of the plant-establishment counts so that a direct comparison with actual plant population was possible. At PI, a 1-m–2 sample was collected from each plot at one of the marked locations for determination of dry matter, number of tillers, plant N percentage, and N uptake. At physiological maturity, two 1-m–2 samples were collected from the remaining two marked locations in each plot for determination of dry matter, harvest index, grain yield (14% moisture), number of panicles, number of grains per panicle, floret sterility, 1000-grain weight, and total plant N uptake.
Statistical analyses
Data from each experiment were individually statistically analysed by analysis of variance (ANOVA), using Genstat Release 18.1 (VSN International, Hemel Hempstead, UK). Comparisons of treatment means were performed using the least significant difference test (l.s.d.) at P = 0.05. Correlation analysis was conducted on the means. The relationships were explored between dependent variables (grain yield, number of tillers per plant, number of panicles per m2, number of grains per panicle) and the independent variable (plant population counts). In all cases, a log–log relationship between plant population and the dependent variables was found to fit the data well. Therefore, the final form of the relationships was y = ebxa, where y is the dependent variable and x is the independent variable. The relationships were determined by using ordinary least-squares linear regression on the linearised form of the above equation, ln(y) = a.ln(x) + b. The degree to which plant population explained the variation in the dependent variables was determined by using the coefficient of determination (R2), and the significance of the relationship was determined by examining the P-value. In addition, analysis of covariance (ANCOVA) was performed to assess whether the relationships with different sowing categories (aerial vs drill, and different row spacings) were significantly different.
Results
Establishment
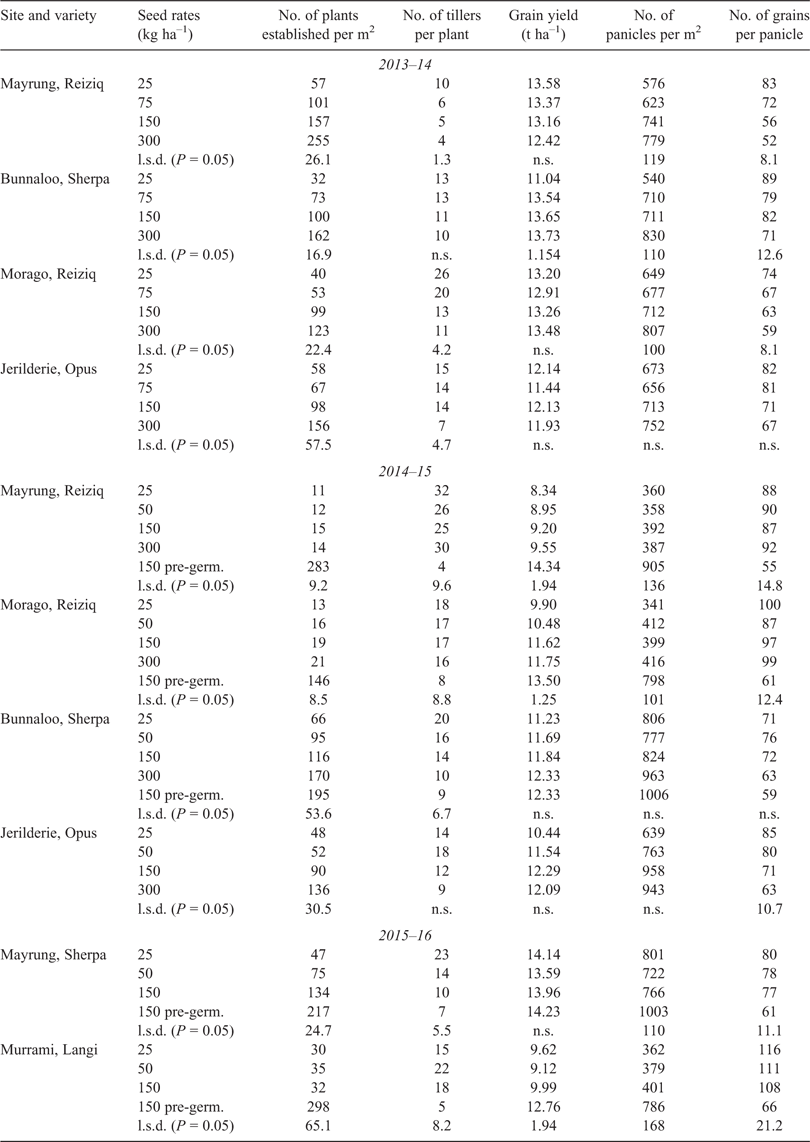
Increased rate of dry seed spread on the soil surface before application of permanent water significantly increased the number of plants established in seven of the 10 aerial-sown experiments; in the other three aerial-sown experiments, 150 kg ha–1 of pre-germinated seed was the only treatment significantly different from the others (Table 4). This treatment always resulted in significantly more established plants (average 228 plants m–2) than 150 kg ha–1 of dry seed pre-flood (average 63 plants m–2) (Table 4).
Establishment was more consistent in the drill-sown experiments than in the aerial-sown experiments. There was a significant difference between varieties for plant establishment in the 2014–15 Yanco experiment but not in the other drill-sown experiments (Table 5). In three of the five drill-sown experiments, narrower row spacings resulted in significantly more established plants than wider row spacings, whereas higher seed rates resulted in significantly more plants established in all experiments (Table 5). There was no significant interaction between variety, row spacing or seed rate for establishment in any of the five drill-sown experiments (data not presented).
When results for the variety Reiziq were analysed across the four drill-sown, row spacing × seeding rate experiments that tested the same seed rates at two locations (Leeton and Jerilderie) in both the 2014–15 and 2015–16 seasons, there was no significant difference in establishment between row-spacing treatments (Table 6). There were, however, significant differences in establishment between seed rates (Table 6), with a higher seed rate resulting in more plants established.
When averaged across experiments, the method of spreading dry seed onto the dry soil surface and then applying permanent water resulted in only 21% of the seeds applied becoming established plants. On the other hand, when pre-germinated seed was sown into water, 45% of seeds on average became established plants, and in the drill-sown experiments 48% of seeds became established plants.
Assessments at the panicle initiation stage
As seed rate increased, the number of tillers per plant significantly decreased in five of the 10 aerial-sown experiments and in all five of the drill-sown experiments (Tables 4 and 5). The number of tillers per plant at PI was significantly higher for seed rate treatments that resulted in low plant numbers than seed rates that resulted in high plant numbers in eight of the 10 aerial-sown experiments and all five of the drill-sown experiments (Tables 4 and 5).
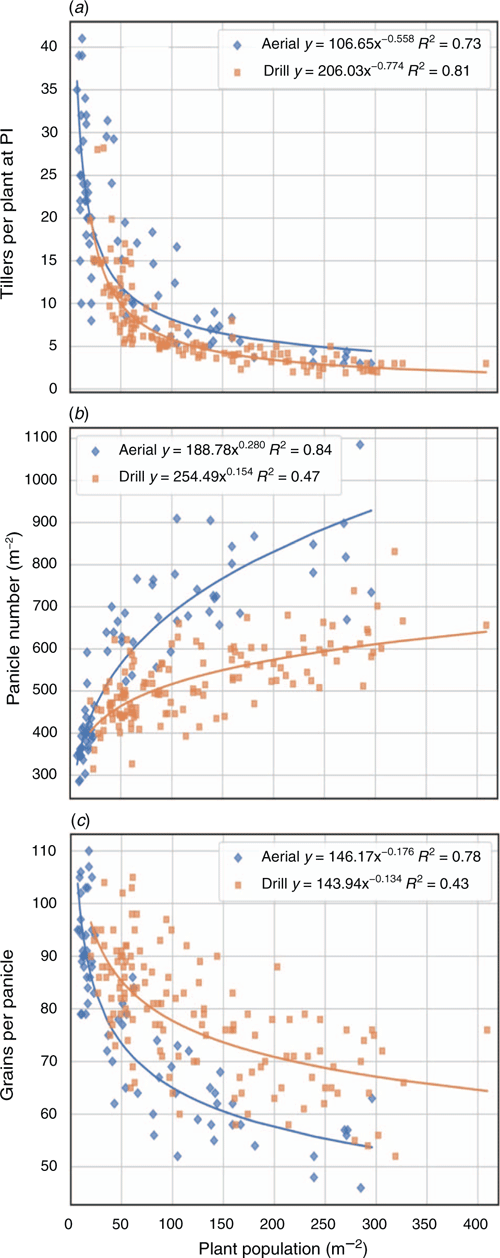
There were no significant differences in number of tillers per plant at PI among varieties or row spacings in any of the drill-sown experiments (Table 5). When the data for number of tillers per plant at PI for the variety Reiziq were analysed across the four drill-sown experiments that had the same seed-rate treatments, there were also no significant differences due to row spacing, but as seed rate decreased, the number of tillers per plant significantly increased (Table 6). A significant negative relationship existed between plant population and number of tillers per plant at PI for both aerial- and drill-sown Reiziq crops. As plant population decreased, the number of tillers per plant increased, especially below ~50 plants m–2 (Fig. 2a).
|
Grain yield
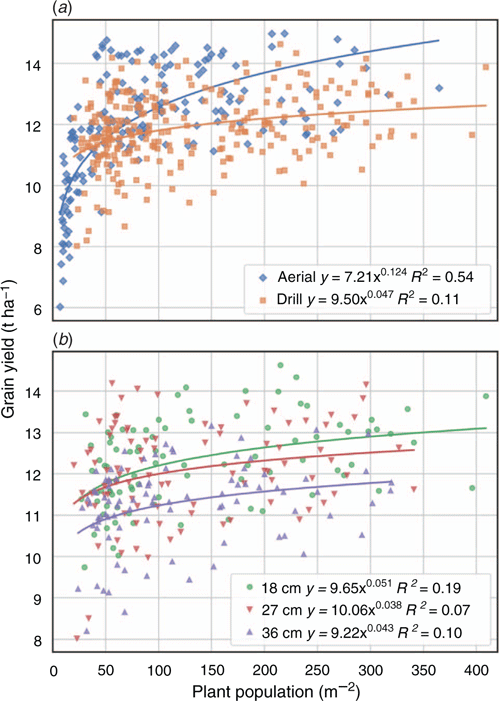
Grain yield was significantly different among seed rates in four of the 10 aerial-sown experiments. In each of these four experiments, grain yield was significantly lower in seed-rate treatments that resulted in plant populations of ≤35 plants m–2 (Table 4). In two of the drill-sown experiments, there was a significant difference among seed rates when averaged across variety and row spacing (Table 5). Grain yield was relatively independent of plant population >~100 plants m–2 for both aerial- and drill-sowing methods (Fig. 3a). Drill sowing produced a lower grain yield than aerial sowing when all row spacings were considered (Fig. 3a). However, when the drill-sown data were separated into row spacings, the 36-cm row-spacing treatment was largely responsible for the lower grain yields (Fig. 3b).
|
The 36-cm row-spacing treatment produced significantly lower grain yield than both the 18- and 27-cm row-spacing treatments, which produced similar yields in four of the five drill-sown experiments (Table 5). There was a significant variety difference in only one of the five drill-sown experiments, with Reiziq producing higher yield (12.88 t ha–1) than Langi (12.14 t ha–1) in the 2015–16 Leeton experiment (Table 5). There were no significant interactions between treatments for grain yield in any of the five drill-sown experiments.
When data for the individual variety Reiziq were analysed across the four drill-sown experiments that had the same seed-rate treatments, the 36-cm row spacing had a significantly lower grain yield (11.36 t ha–1) than the 18- and 27-cm spacings, which were similar at 12.25 and 12.10 t ha–1, respectively (Table 6). Among seed-rate treatments, 25 kg ha–1 had a significantly lower grain yield (11.54 t ha–1) than both the 50 and 150 kg ha–1, which were similar at 12.08 and 12.09 t ha–1, respectively (Table 6).
Yield components
The number of panicles per m2 was significantly higher for seed rates that produced more established plants in seven of the 10 aerial-sown experiments and all of the drill-sown experiments (Tables 4 and 5). There was a significant difference between varieties for panicle number in four of the five drill-sown experiments, and panicle number was significantly lower for the 36-cm row spacing than the 18- and 27-cm row spacings in three of the five drill-sown experiments (Table 5). When data for the variety Reiziq were analysed across the four drill-sown experiments that had the same seed-rate treatments, each increase in seed rate significantly increased panicle number, whereas each increase in row-spacing width did the opposite, significantly reducing panicle number (Table 6). When the aerial- and drill-sown treatments were compared using the same variety, Reiziq, the aerial-sown treatments produced more panicles per m2 than the drill-sown treatments at the same plant population, except at very low plant populations where they were similar (Fig. 2b).
The number of grains per panicle was significantly different among seed rates in eight of the 10 aerial-sown experiments, with lower plant populations having more grains per panicle (Table 4). In the drill-sown experiments, the number of grains per panicle was significantly different among varieties in three experiments, among row spacings in two experiments, and among seed rates in all five experiments (Table 5). When data for the variety Reiziq were analysed across the four drill-sown experiments that had the same seed-rate treatments, there was no significant difference in number of grains per panicle across row spacings; however, each decrease in seed rate significantly increased the number of grains per panicle (Table 6). There was no significant interaction between row spacing and seed rate for number of grains per panicle in any of the drill-sown experiments (Table 5). When the aerial and drill sown treatments were compared using only data for Reiziq, the drill-sown treatments produced more grains per panicle than the aerial-sown treatments at the same plant population. However, at very low plant populations, the numbers of grains per panicle were similar (Fig. 2c).
In three aerial-sown and four drill-sown experiments, there was a significant difference in grain weight across seed-rate treatments. The seed-rate treatments that produced low plant populations had a significantly lower grain weight than those that produced higher plant populations (data not presented). There were significant differences among varieties in all five drill-sown experiments, but no significant row spacing × seed rate interactions. When data for the variety Reiziq were analysed across the four drill-sown experiments that had the same seed rate treatments, there was no significant difference in grain weight across row spacings; however, each decrease in seed rate significantly decreased grain weight (Table 6).
Discussion
Spreading dry seed onto the soil surface and then applying permanent water to the field resulted in an average of only 21% of seeds becoming established plants. At the Mayrung and Morago sites in the 2014–15 season, where establishment was particularly poor, surface-soil samples (0–10 cm) collected before flooding confirmed that soil sodicity levels were high (exchangeable sodium percentage of 5.7 at Mayrung and 6.4 at Morago). High surface-soil sodicity increases soil dispersion on flooding (Rengasamy et al. 1984), potentially limiting oxygen supply to the seed, which is required for germination and seedling growth (Ella et al. 2010); this may have contributed to the low plant establishment. When establishing rice by spreading dry seed onto the soil surface, especially on soils with a sodic surface layer, the field must be flooded and then drained for up to a week to allow partial drying of the soil so the seed can access oxygen before the field is permanently flooded (Troldahl 2018). At the Murrami site in 2015–16 season, where establishment of the dry-seed treatment was also poor, the soil surface was very cloddy; this would have led to increased seed coverage by soil even though soil sodicity levels were not high at this site (Table 1).
The most reliable method for establishing an aerial-sown rice crop is to pre-germinate the seed before spreading it into an already flooded field. This method produced consistent results across five experiments and two seasons, with an average of 45% of seeds becoming established plants. Aerial sowing with pre-germinated seed and drill sowing had a similar level of establishment, with an average of 48% of seeds becoming established plants in the drill-sown experiments.
Plant population had a similar impact on grain yield for both aerial- and drill-sown rice provided the row spacing for the drill-sown rice was not excessively wide (i.e. >27 cm). Both aerial- and drill-sown rice plants were able to increase the number of tillers per plant and the number of grains per panicle to maintain grain yield at relatively low plant populations. A combination of increased tillering and number of grains per panicle was also reported by Counce and Wells (1990) as responsible for rice maintaining grain yield at low plant populations. When plant population was reduced, each plant produced more tillers, which resulted in a more consistent number of panicles per m2 at maturity across the range of plant populations.
Although aerial- and drill-sown rice crops both used panicle number and grains per panicle to maintain yield at low plant populations, aerial sowing generally produced more panicles than drill sowing. This may be a result of increased competition between plants along the drill-sowing line, particularly at wide row spacings, compared with aerial sowing in which the plants are more evenly distributed across the whole area. Drill-sown rice was able to compensate for its lower panicle number and maintain grain yield by producing more grains per panicle than aerial-sown rice. The different establishment methods are contributing to the maintenance of grain yield via different yield components. The relationship between lower plant population and increased number of grains per panicle in drill-sown rice has been reported in other studies (Bond et al. 2005; Ottis and Talbert 2005; Harrell and Blanche 2010), but differences between aerial- and drill-sowing methods were not reported.
The third grain yield component, grain weight, was found to decrease as plant population decreased in several of the experiments in this study. Bond et al. (2009) also reported a decrease in grain weight at lower plant populations for semi-dwarf varieties. Grain weight has been reported as a relatively stable varietal character (Jones and Snyder 1987; Sheehy et al. 2001) mainly determined by genetics, along with temperature and moisture during grain filling, and does not have a significant impact on variation in grain yield for a specific variety. The reduction in grain weight at low plant populations was associated with an increase in grain number per panicle; thus, assimilate availability per grain was reduced.
Rice growers are unsure of the most suitable row spacing for drill-sown rice in temperate rice-growing environments. Grain yield was significantly lower from the 36-cm row-spacing plots than the 18- and 27-cm row-spacings plots in several experiments. Whenever large gaps existed between plants at 36-cm row spacing, grain yields were lower than for the same plant population at the narrower 18- and 27-cm row spacings. As the width between plant rows increases, there comes a point at which any significant gap between plants in the plant row can no longer be compensated for by neighbouring plants or plants in adjacent rows, and the importance of a uniform plant distribution increases (Hardke et al. 2016). The results obtained in our study suggest that row spacing widths of 18–27 cm should be recommended.
These results are in contrast to research conducted in the subtropical climate of southern Florida by Jones and Snyder (1987), who investigated row spacings of 15, 20 and 25 cm and reported a higher grain yield from the 15-cm row spacing. Their study had an average plant population of 251 plants m–2 and grain yield of 5.06 t ha–1, and considerable climatic differences exist between their growing region and the temperate environment. No research results have been found on the impact of row spacing on rice grown in a temperate environment.
Plant populations as low as 30 plants m–2 were able to achieve grain yields >12 t ha–1 (Fig. 3) but the consistency of achieving high grain yield was variable because plant distribution was less uniform at low plant populations (Hardke et al. 2016). Once a plant population of ~100 plants m–2 was reached, the impact of uniformity of plant distribution appeared negligible, and in only one experiment did a plant population >100 plants m–2 (i.e. 106 plants m–2, 2015–16 Leeton; Table 5) have a significantly lower grain yield than the higher plant populations in the same experiment. The results provide evidence that, for both aerial- and drill-sown rice, maximum grain yield can be achieved with a minimum plant population of 100 plants m–2, provided row spacings are not wider than 27 cm when drill-sown. The plant population of 100 plants m–2 above which maximum grain yield is achieved is considerably lower than the Ricecheck recommendation of 200–300 plants m–2 (NSW DPI 2012).
In some seasons, plant establishment is lower than expected owing to unsuitable soil conditions or adverse weather (temperature, wind, etc.). In such seasons, a rice producer needs guidance based on plant counts to decide whether the most economical option is to re-plant or to abandon the crop. Results from this study show that yields of >10 t ha–1 can be achieved from a plant population of only 10 plants m–2 provided the plants are uniformly spaced, have no weed competition, and have adequate nutrition to promote tillering. However, to minimise the risk of yields <10 t ha–1, we suggest that crops be re-sown if there are fewer than 30 plants m–2 and plant distribution is not uniform. This plant population is lower than recommended by Bond et al. (2005), who suggest that in Midsouth USA, it may be more beneficial to manage a stand of rice that averages as few as 60 plants m–2 rather than terminating the stand and replanting. This pertains to a different climate, shorter growing season, varieties that may have different tillering potentials and possibly different N-management practices.
High plant populations (up to 396 plants m–2) did not lead to decreased grain yield for either aerial- or drill-sowing method in the experiments reported here. In some rice-growing areas across the world, plant densities above the optimum density have been shown to increase disease susceptibility, plant height and lodging (Hardke et al. 2016). Disease is not a significant problem in the temperate rice-growing region of south-eastern Australia, and lodging was not associated with higher plant populations for the semi-dwarf varieties in our study. Sheehy et al. (2001) reported that increased tillering increased lodging susceptibility in high-yielding irrigated crops, but this was not evident in our study. The main value in applying an upper plant population limit would therefore be based on the practical and economic aspects of not sowing greater amounts of seed than required to ensure an adequate plant population to maximise yield.
A practical optimal plant-population recommendation for the semi-dwarf varieties used in this study, when either aerial- or drill-sown in south-eastern Australia, would be 100–200 plants m–2. This provides a margin of safety on the low side where grain yield can still be maintained if establishment percentage of the seed is lower than expected. The new plant-population recommendation is considerably lower than the previous recommendation of 200–300 plants m–2 (NSW DPI 2012).
The experiments in this study investigated both aerial- and drill-sowing methods but did not investigate the effect of plant population on grain yield of drill-sown crops that had a delayed application of permanent water. Delaying permanent water is a management practice used to reduce rice water use, with permanent water applied much later than for conventional drill sowing and close to PI (Dunn and Gaydon 2011; Dunn 2018). As the practice of delayed permanent water is becoming more popular because of it water-saving benefits, the importance of plant population should be investigated for this new water-management practice. The delay in application of permanent water may reduce plant tillering, making plant-population requirements different from those with conventional water-management practices under aerial and drill sowing.
Conflicts of interest
The authors declare no conflicts of interest regarding this manuscript.
Acknowledgements
The research was co-funded by AgriFutures Australia and NSW Department of Primary Industries. Excellent technical support was provided by Craig Hodges and Chris Dawe and the authors acknowledge the significant input that John Fowler from Local Land Services provided to the project.
References
Bond JA, Walker TW, Bollich PK, Koger CH, Gerard P (2005) Seeding rates for stale seedbed rice production in the midsouthern United States. Agronomy Journal 97, 1560–1563.| Seeding rates for stale seedbed rice production in the midsouthern United States.Crossref | GoogleScholarGoogle Scholar |
Bond JA, Walker TW, Bushring NW (2009) Impact of nitrogen rate on the performance of three rice cultivars seeded at varying densities. Research Report Vol. 24, No. 5. Mississippi State University, Starkville, MS, USA.
Chaudhary RC, Nanda JS, Tran DV (2002) ‘Guidelines for identification of field constraints to rice production.’ (Food & Agriculture Organization of the United Nations: Rome)
Counce PA, Wells BR (1990) Rice plant population density effect on early-season nitrogen requirement. Journal of Production Agriculture 3, 390–393.
| Rice plant population density effect on early-season nitrogen requirement.Crossref | GoogleScholarGoogle Scholar |
Dunn BW (2018) Delaying permanent water in drill sown rice. Primefact 1238. 3rd edn. NSW Department of Primary Industries, Orange, NSW. Available at: https://www.dpi.nsw.gov.au/__data/assets/pdf_file/0007/438955/delaying-permanent-water-on-drill-sown-rice.pdf
Dunn BW, Ford R (2018) Management of drill sown rice. Primefact 1253 3rd edn. NSW Department of Primary Industries, Orange, NSW. Available at: https://www.dpi.nsw.gov.au/__data/assets/pdf_file/0019/445312/management-of-drill-sown-rice.pdf
Dunn BW, Gaydon DS (2011) Rice growth, yield and water productivity responses to irrigation scheduling prior to the delayed application of continuous flooding in southeast Australia. Agricultural Water Management 98, 1799–1807.
| Rice growth, yield and water productivity responses to irrigation scheduling prior to the delayed application of continuous flooding in southeast Australia.Crossref | GoogleScholarGoogle Scholar |
Ella ES, Dionisio-Sese ML, Ismail AM (2010) Proper management improves seedling survival and growth during early flooding in contrasting rice genotypes. Crop Science 50, 1997–2008.
| Proper management improves seedling survival and growth during early flooding in contrasting rice genotypes.Crossref | GoogleScholarGoogle Scholar |
Hardke J, Wamishe Y, Lorenz G, Bateman N (2016) Rice stand establishment. In ‘Arkansas rice production handbook’. Ch. 4. (University of Arkansas Division of Agriculture: Little Rock, AR, USA) Available at: https://www.uaex.edu/publications/pdf/mp192/chapter-4.pdf
Harrell DL, Blanche SB (2010) Tillage, seeding and nitrogen rate effects on rice density, yield, and yield components of two rice cultivars. Agronomy Journal 102, 592–597.
| Tillage, seeding and nitrogen rate effects on rice density, yield, and yield components of two rice cultivars.Crossref | GoogleScholarGoogle Scholar |
Jones DB, Snyder GH (1987) Seeding rate and row spacing effects on yield and yield components of drill-seeded rice. Agronomy Journal 79, 623–626.
| Seeding rate and row spacing effects on yield and yield components of drill-seeded rice.Crossref | GoogleScholarGoogle Scholar |
McDonald DJ (1994) Technical rice technology for the 21st century: and Australian example. Australian Journal of Experimental Agriculture 34, 877–888.
| Technical rice technology for the 21st century: and Australian example.Crossref | GoogleScholarGoogle Scholar |
NSW DPI (2012) Ricecheck recommendations: a management guide for improving yields, grain quality, profits and sustainability. NSW Department of Primary Industries, Orange, NSW
Ottis BV, Talbert RE (2005) Rice yield components as affected by cultivar and seeding rate. Agronomy Journal 97, 1622–1625.
| Rice yield components as affected by cultivar and seeding rate.Crossref | GoogleScholarGoogle Scholar |
Rengasamy P, Greene RSB, Ford GW, Mehanni AH (1984) Identification of dispersive behaviour and the management of red-brown earths. Australian Journal of Soil Research 22, 413–431.
| Identification of dispersive behaviour and the management of red-brown earths.Crossref | GoogleScholarGoogle Scholar |
Sheehy JE, Dionora MJA, Mitchell PL (2001) Spikelet numbers, sink size and potential yield of rice. Field Crops Research 71, 77–85.
| Spikelet numbers, sink size and potential yield of rice.Crossref | GoogleScholarGoogle Scholar |
Troldahl D (Ed.) (2018) Rice growing guide 2018. NSW Department of Primary Industries, Orange, NSW. Available at: https://www.dpi.nsw.gov.au/__data/assets/pdf_file/0007/829330/RGG-accessible-22Aug2018.pdf
Troldahl D, Stevens M (Eds) (2019) Rice crop protection guide 2019–20. NSW DPI Management Guide. NSW Department of Primary Industries, Orange, NSW. Available at: https://www.dpi.nsw.gov.au/__data/assets/pdf_file/0009/1186083/Rice-CPG-2019-FINAL-24Oct-.pdf


