Using new solvatochromic parameters to investigate dye–solvent interactions
Victor Akpe A B * , Timothy J. Biddle
  A , Christian Madu
  C , Tak H. Kim
  A B , Christopher L. Brown
  A B and Ian E. Cock
  A B *
A B *
A School of Environment and Science, Griffith University, Nathan Campus, Qld 4111, Australia.
B Environmental Futures Research Institute, Griffith University, Nathan Campus, Qld 4111, Australia.
C Department of Chemistry, Collin College, Preston Ridge Campus, Frisco, TX 75035, USA.
Handling Editor: Manabu Abe
Australian Journal of Chemistry 75(3) 206-219 https://doi.org/10.1071/CH21201
Submitted: 17 August 2021 Accepted: 26 November 2021 Published: 24 February 2022
© 2022 The Author(s) (or their employer(s)). Published by CSIRO Publishing. This is an open access article distributed under the Creative Commons Attribution-NonCommercial-NoDerivatives 4.0 International License (CC BY-NC-ND)
Abstract
Solvatochromic behaviours of triazine substituted dyes were evaluated using a novel approach derived from the red shift index (RsI) and associated solvation energy (ASE). These parameters were used to describe the solvation trends of the dye–solvent interactions based on their polarity changes. The concept demonstrates the effect of substituent changes on the triazine scaffold and the induced solvent polarity changes as solvated dyes go through the HOMO–LUMO (highest occupied molecular orbital-lowest uncopied molecular orbital) phases. Primarily, these phases were characterised by evaluating the wavelength of the absorption and emission spectra in different solvents, which, in conjunction with the recently reported computational approaches, provides a well-adjusted model for predicting spectra polarity changes between the dye (solute) and the solvent. Based on the results from this study, predictive polarity changes on the triazine scaffold in different solvents can be empirically monitored both in ground and excited states. Moreover, the solvatochromic parameters can be extended to evaluate the predictive behaviours of different spectra dyes.
Keywords: implicit solvation model systems of dyes, positive and negative solvatochronism, solvatochromic behaviours of dyes, solvatochromic variation of dyes, solvent parameters, solvent polarity indicators, solvent polarity scale, solvent-effect.
Introduction
Solvatochromic effects are the changes that chemical species undergo during interactions with their local environments (solvents). These changes have been studied by several investigators to have a profound effect on the spectral shapes of organic dyes, and are not limited to the solution phase alone but have been extended to the gaseous state depending on the solvent type.[1–3] Molecules express these spectral changes when dissolved in a variety of solvents, and these have been previously investigated using theoretical frameworks and experimental data.[1,3] For instance, the solvatochromic effect has been used to explain the charge-induced transfer between proxy molecules during intra-molecular transfer,[4,5] predict the direction of spectra shifts,[6] or track protein molecules in biological systems using fluorescent probes.[7,8]
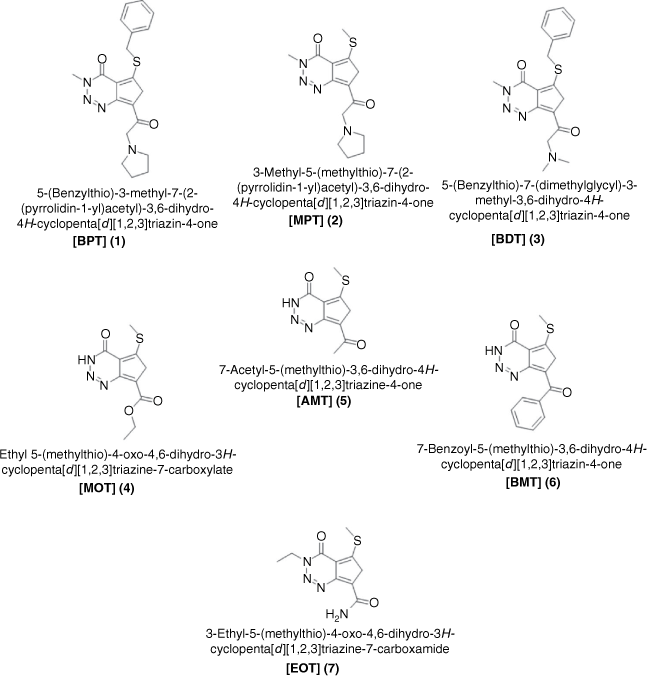
To date, polarity changes in dye–solvent interactions have been predominantly explained using microscopic changes that occur during solvation. These examples have been reported for the dipole–dipole interactions of dye behaviour in different solvents.[9–22] Solvation dynamics of organic dye molecules have also been described macroscopically using spectral properties of the dyes in the ground and excited states.[23–25] The ground state is the lowest unoccupied molecular orbital (LUMO) of a molecule or an atom. It is also the most stable configuration as electrons are diamagnetically positioned within the orbitals. The excited state is the highest occupied molecular orbital (HOMO) energy representation of a molecule. Because the conformation at the excited state is short-lived due to single (unpaired) electron in the orbitals, the excited states may exhibit more drastic changes than in the ground state. Hence, the objective of this study was to evaluate the influence of substituent effect and solvent inclusion in solvated triazine dyes. Therefore, using the absorption and emission values of a class of triazine substituted dyes, 1–7 (Fig. 1) along with the new solvatochromic parameters developed, the dynamic changes in solute–solvent interactions in the ground and excited states were evaluated. These solvatochromic parameters developed in this current study can be extended to evaluate the predictive behaviours of different spectra dyes.
|
Theoretical framework
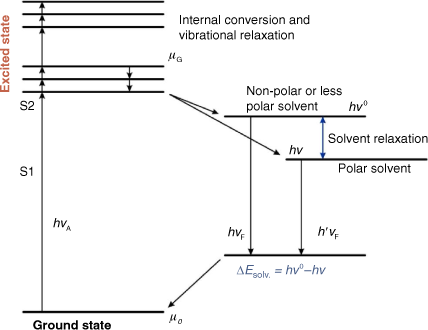
The solvation process involves the interaction of solute with solvent species, resulting in charge stabilisation of the solute in solution. This process underpins all chemical equilibria in solutions. Fig. 2 illustrates the HOMO–LUMO energy of a solvated dye required to stabilise the ground and first excited states. According to the Franck–Condon principle, the first excited state (‘Franck–Condon state’) possesses the same shape as the equilibrium ground state, and the molecule remains in the excited state by reaching the equilibrium solvation. Subsequently, the fate of electron relaxation from the excited state depends on the interaction between the dye and solvent polarities, which initially results in a non-equilibrium Franck–Condon ground state, and finally to a ground state with equilibrium solvation. The transition of an organic dye in solution and vapour states with frequencies v and vo, respectively, can be expressed as:

ΔEsolv. is the solvation energy of the HOMO–LUMO transition state and h is the Planck’s constant.
|
Fig. 2 also suggests that the solvation energies of both polar and non-polar interactions of organic dyes can also influence the spectral changes and can be empirically evaluated. In this study, triazine dyes with varying substituent moieties have been investigated. It is expected that a change in the functional moiety within the triazine cyclic atom can result in wavelength changes of spectra because of substituent effect and solvent-effect interactions. As a result, there can either be an increase or a decrease of aggregated dye molecules during solvation. Furthermore, substituent effects of this class of triazine dyes can also affect the cyclic atoms bearing the π-electrons, causing shifts in wavelength positions of the absorption or emission spectra.
Computational details
Computational data for triazine dyes 1 to 7 were obtained from our recent article.[26] The calculations for 2-methylthio-3-methyluracil (2-MT-3MU) were completed under vacuum using an analogous method reported in this literature.[26] The structure of 2-methylthio-3-methyluracil was produced and visualised using Avogadro (software version 1.90.0).[27] Calculations were completed using Gaussian 16 software (Wallingford, Connecticut, USA) (full reference provided in the supplementary information, S1) for all methods utilised. The 2-methylthio-3-methyluracil structure was initially subjected to geometry optimisation through the Berny analytical gradient method[28] incorporated into Gaussian 16 followed by vibrational frequency analysis. The resulting structures were confirmed to be stable intermediates (minima on the potential energy surface) and it was ensured that no imaginary frequencies were present during simulation.
For the semi-empirical approaches, the structures were optimised using either the Austin Model 1 (AM1),[29] parametric method 3 (PM3),[30,31] or parametric method 6 (PM6)[32] method followed by single-point energy (SPE) calculations at the ZINDO/S semi-empirical level,[33] specifying ten singlet excited states. For the TDDFT analysis, the ωB97X-D long-range corrected hybrid exchange–correlation function[34] was selected in combination with the 6-31G(d) basis set[35,36] specifying six singlet excited states.
Polarisation efficiency of spectra dyes
According to Bayliss et al.[9,10], dye–solvent interactions have momentary transition dipoles in the ground state and in the excited state (Fig. 2). Herein, the polarisation red shift, Δλ has been defined as the wavelength of the spectra absorption difference of dye in solution and the vapour phase. However, in the vapour phase, there is no distortion of molecules caused by intermolecular interactions[37] and solvent-effect changes are expected to be negligible. Here, the wavelength of absorption  of the experimentally reported value of 2-methylthio-3-methyluracil in the vapour phase[37] has been used as the reference compound. Also, it has been assumed that the wavelength of the absorption or emission (λ) of the investigated dye in the solution phase is greater than the wavelength of the absorption or emission of the reference compound in the vapour phase,
  . To validate this assertion, 2-methylthio-3-methyluracil scaffold conformation was compared with triazine dyes investigated using a computational chemistry approach provided in the Supplementary material.
Thus, at the ground state, the polarisation red shift is defined by:

where,  is the wavelength of the absorption of the investigated dye in the ground state. Also, at the excited state, the polarisation red shift is defined by,
  :
:

 is the wavelength of the emission spectra of dye. The polarisation efficiency of a dye sample transitioning from the ground state to the excited state has been defined as the ratio of the polarisation red-shift at the ground state to the polarisation red shift at the excited state:
Polarisation efficiency of a dye,

Associated solvation energy (ASE) and red shift index (RsI)
During the solvation process, energy is released when a solute associates with a solvent.[38] Therefore, when a dye transitions from the ground to the excited states, there is a measure of internal thermodynamic energy. Some investigators have been able to show the predictability of the solute–solvent behaviours using the spectral approaches.[1,24,25,39]
The solvated energy is directly proportional to the frequency by a constant velocity expressed by c = vλ, and the energy in terms of wavelength expressed by  . The ASE of spectra dyes in solution and vapour states with frequencies v and
  respectively can therefore be expressed as in Eqn 1.

ΔEsolv. is defined as the ASE at the ground state, h is the Planck’s constant and v is the frequency. From Eqn 1,


Again, since the wavelength is inversely proportional to the frequency, Eqn 5 becomes:


The difference between the wavelengths of the investigated dye  and the reference standard (λo) can be expressed as
  :
:

Therefore:

Multiplying Eqn 6 through by the ratio of the scaling factor of the dye, Ndye and  :
:

Therefore, considering the right hand side of Eqn 7, the red shift index of an organic dye, RsI, is defined as the fraction of the polarisation red-shift of the dye (sample) to the wavelength of the reference compound in the vapour phase[37] multiplied by a scaling factor, Ndye

Ndye is a scaling factor applied to a dye dissolved in a particular solvent. For the present study, Ndye was determined for each dye 1 to 7. Here, Ndye has been calculated by dividing the polarisation red-shift of the dye when dissolved in the solvent with the highest polarity index for which the dye is soluble  by the difference between
  and the wavelength of the reference compound (2-methylthio-3-methyluracil) at the Q-band in the vapour phase
  , multiplied by 10.[24,25,39]
Therefore, Ndye was calculated as:

DMSO possessed the highest polarity index of all the solvents in which dyes 1 to 7 were dissolved and therefore was utilised for obtaining  . The scaling number (in this study, 10) is an arbitrary number and was also used by Freed et al.[24] in their investigation for simplicity.
Also, from Eqn 7:

the ASE of a dye sample at the ground state, ΔEsolv. defined above can be simplified to Eqn 10, so that,

Therefore, Eqn 10 represents the empirical ASE at the ground state of the dye while Eqn 9 is the empirical RsI at the ground state. The speed of light is c. Similarly, the RsI and ASE were used to deduce the excited states of the dye, following the stepwise equations previously derived elsewhere.[25,39]
Results and discussion
The bond polarity of a dye can be defined as the electronegative difference between two or more atoms. The polarity becomes more apparent in the solvent–dye interactions in the solvated state. Herein, the polarity of triazine substituted dyes has been evaluated using new solvatochromic concepts described by the red shift index (RsI) and associated solvation energy (ASE). The derived formula was used to empirically evaluate the ground and excited states of these dyes as the substituent changes.
The computational chemistry approach was used to validate the choice of the reference compound, 2-methylthio-3-methyluracil. The computational data calculations validate lower absorption and emission maxima of the reference compound to the triazine dyes 1 to 7 investigated. This study was confirmed using the semi-empirical optimisation methods of AM1, PM3, and PM6 utilised for vertical excitation energies combined with the ZINDO/S semi-empirical method. Each of these calculations indicated that the absorption maximum of 2-methylthio-3-methyluracil was lower than that of the triazine dyes 1 to 7[26] (supplementary information, S2, Supplementary Table S1).
Additionally, the absorption and emission data were evaluated using time-dependent density functional theory (TDDFT) at the ωB97X-D/6-31G(d) level. The calculations showed that 2-methylthio-3-methyluracil provided considerably lower values than 3-Ethyl-5-(methylthio)-4-oxo-4,6-dihydro-3H-cyclopenta [d][1,2,3] triazine-7-carboxamide EOT (supplementary information, S3, Supplementary Table S2). Hence, the results confirmed the choice of 2-methylthio-3-methyluracil as a suitable reference compound for the investigated dyes.
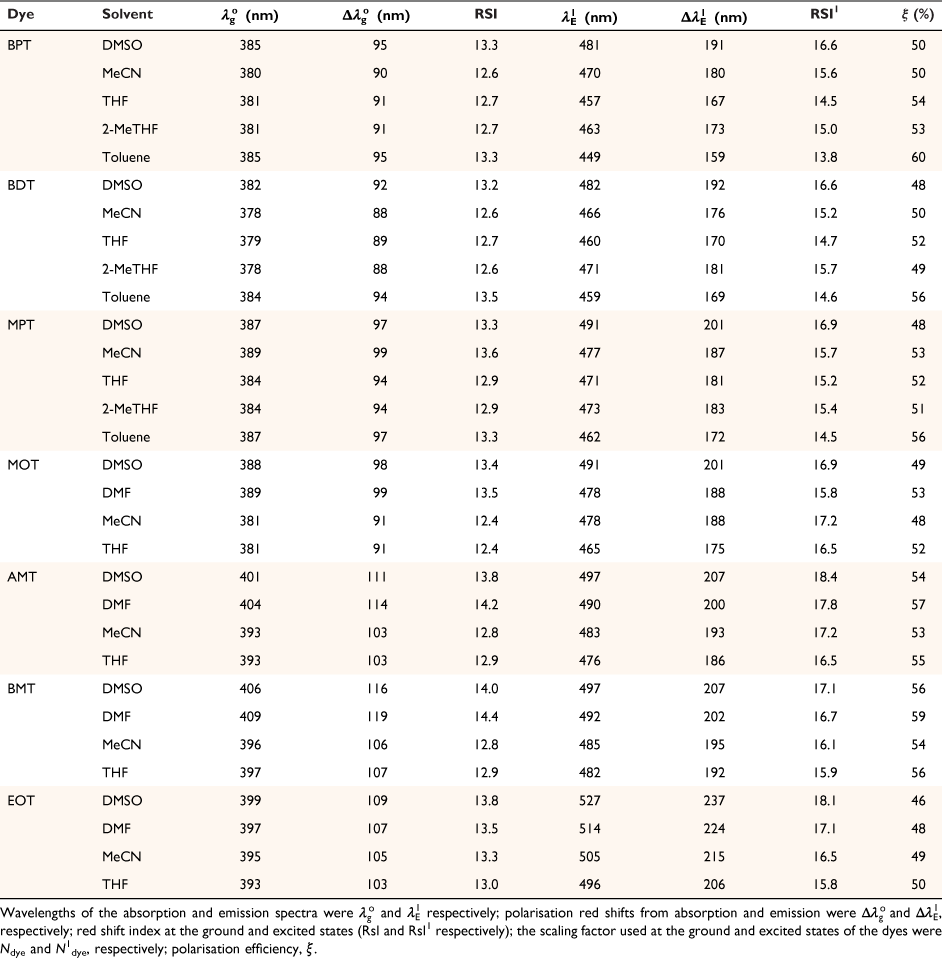
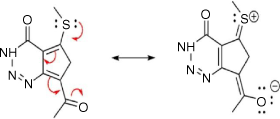
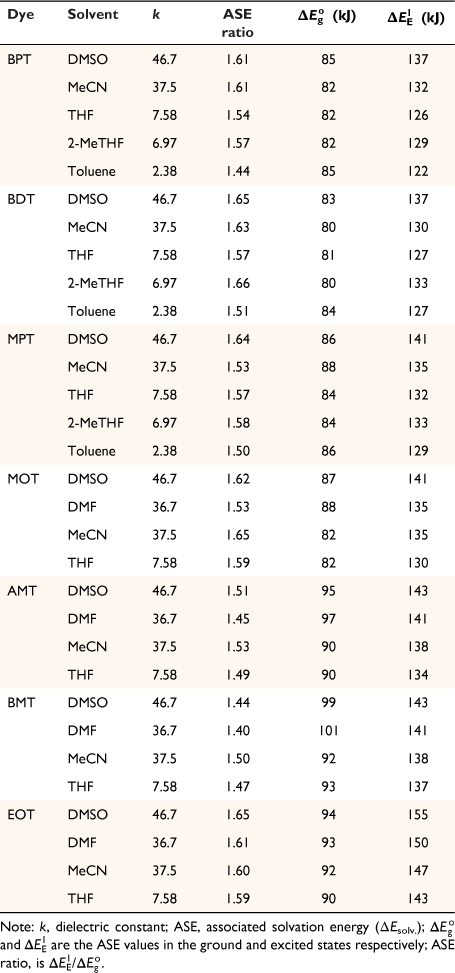
Solvatochromic behaviour of triazine substituted dyes (Fig. 1) in different polar and non-polar solvents was studied using spectra properties derived from Eqn 1 to 10. The solvatochromic shifts in the studied solutions focused on the effect of substituent changes and the dye–solvent interactions in the ground and excited states (Fig. 2). Particularly, substituent change within a dye molecule can influence the spectra changes but can also cause solvent-induced changes during solvation. Table 1 are the parameters used to evaluate the dye–solvent behaviours. From Scheme 1, the delocalisation of electrons within an aromatic cyclic structure is expected to improve charge distribution and separation between electron donor and acceptor of the triazine scaffold. Subsequently, the effect of these dynamic changes was investigated in polar and non-polar solvents.
|
|
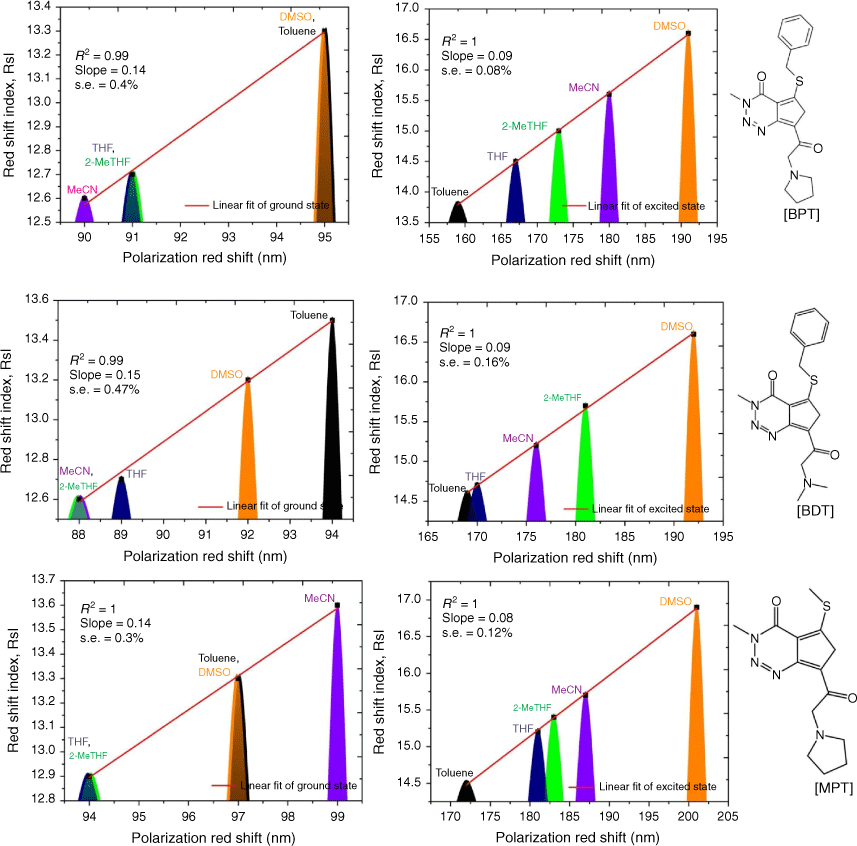
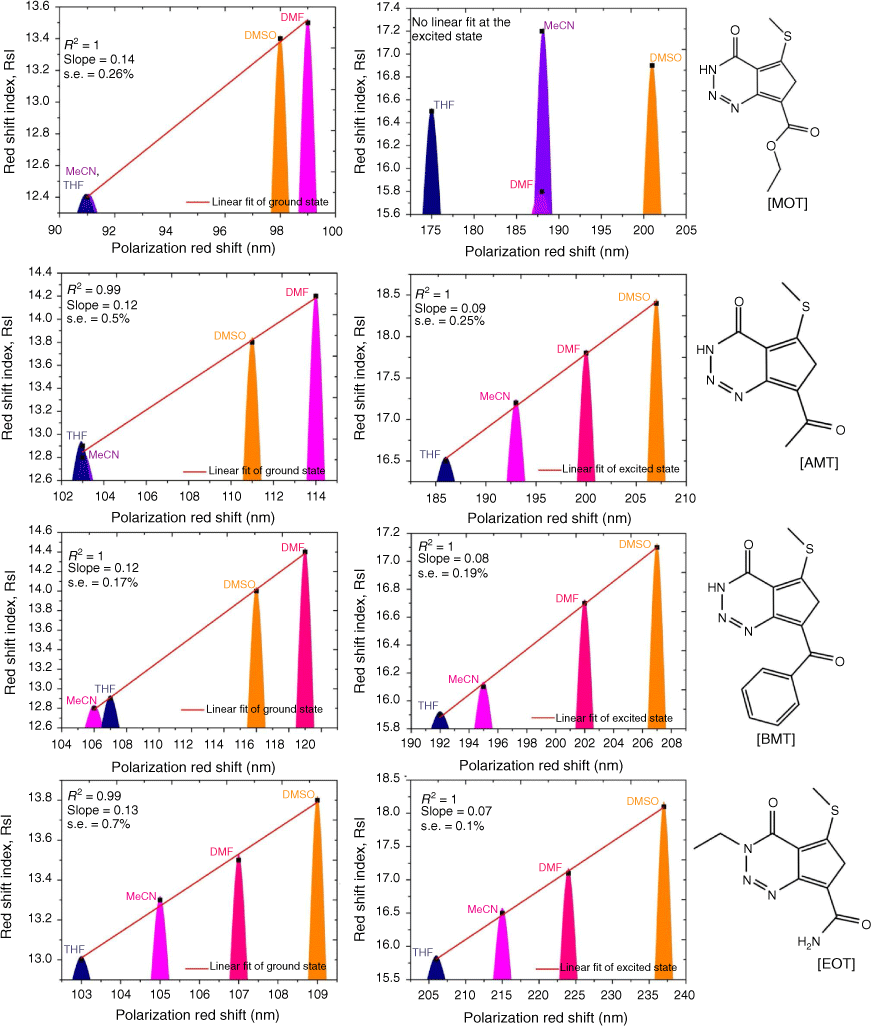
Firstly, we compared triazine scaffolds that differed at the 2-pyrrolidine position, BPT; 5-methylthio position, MPT; 7-dimethylglycl derivative position, BDT. An example of the intramolecular charge transfer of the triazine substituted dye has been shown in Scheme 1. From equation 8, the RsI was plotted against Δλ to obtain the solvatochromic shift of the dye in different solvents. For BPT triazine substituted dye, the 2-pyrrolidine position interactions with DMSO and toluene had greater charge stabilisation in the ground state than MeCN for the same substituted dye. Nonetheless, transition of BPT at the excited state increased the charge stabilisation effect of MeCN and placed the solvent position (at n = 2) after DMSO (at n = 1), and toluene (at n = 5) for the dye–solvent interactions. A similar solvatochromic shift was evaluated for the graphs of BDT and MPT. Secondly, we compared triazine scaffolds that differed at the 7-carboxylate position, MOT; 7-acetyl position, AMT; 7-benzoyl position, BMT; 3-ethyl and 7-carboxamide positions, EOT. The RsI was again plotted against Δλ to obtain graphs delineated in Fig. 3, 4 The result of the triazine substituted MOT at the excited state suggests that the dye–solvent interactions is largely destabilising (Fig. 4).
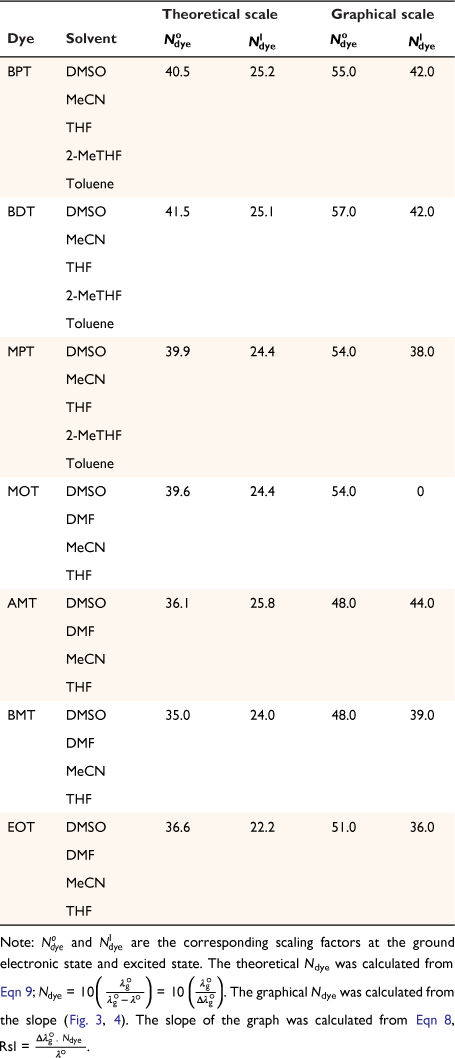
Another parameter considered in this study is the dielectric constant, which, despite being used as a guide to categorise solvents into polar and non-polar, does not implicitly correlate to the dye–solvent trends, as indicated by this order: DMSO (46.7), MeCN (37.5), DMF (36.7), THF (7.58), 2-Me-THF (6.97) and toluene (2.38). Based on the relative polarity of the triazine substituted spectra values, there was no clear correlation to justify that the solvent polarity only can be used to evaluate the dye–solvent interactions. Furthermore, in Fig. 4 triazine substituted MOT graph had solvent positions occupied at n = 1 for DMSO, toluene and the least position for MeCN at n = 3 in the ground state. Unequivocally, the solvatochromic shift observed in the absorption and emission spectra is caused by the net-charge changes during solvation. The influence of these pseudo-polarity changes of dye–solvent interactions has also been demonstrated from the following studies.[1,25,39] It was therefore imperative to establish a polarity scale that reflects the dynamic changes of the dye–solvent interactions and not the solvent polarity only. From Eqn 9, the parameter ‘Ndye’, which represents the dynamic polarity scale of the dye–solvent interactions was introduced into the equation. Ndye is defined as the relative ratio of the absorption or emission spectrum of the dye to the polarisation red in the ground or excited state. Table 2 provides the theoretical and actual or graphical Ndye scale for each of the dyes. Theoretical value was calculated from Eqn 9 while the graphical Ndye was calculated from the solvatochromic shifts at the ground and excited states.
|
|
|
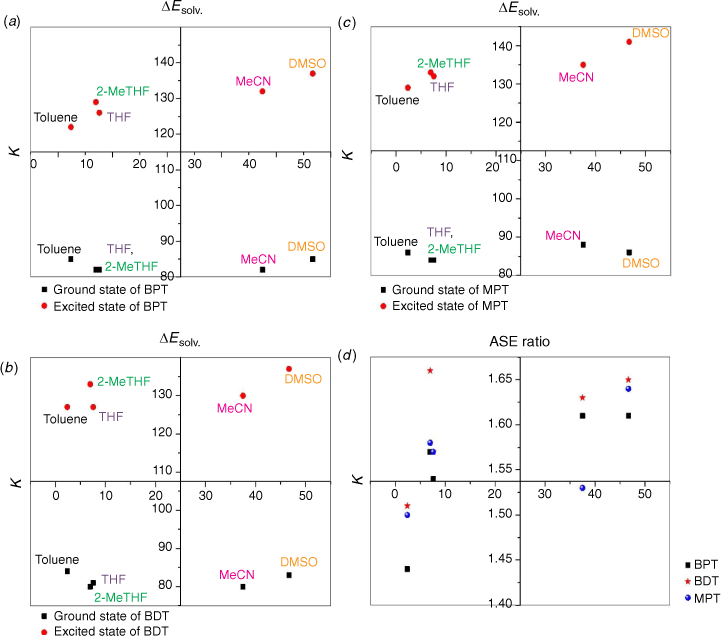
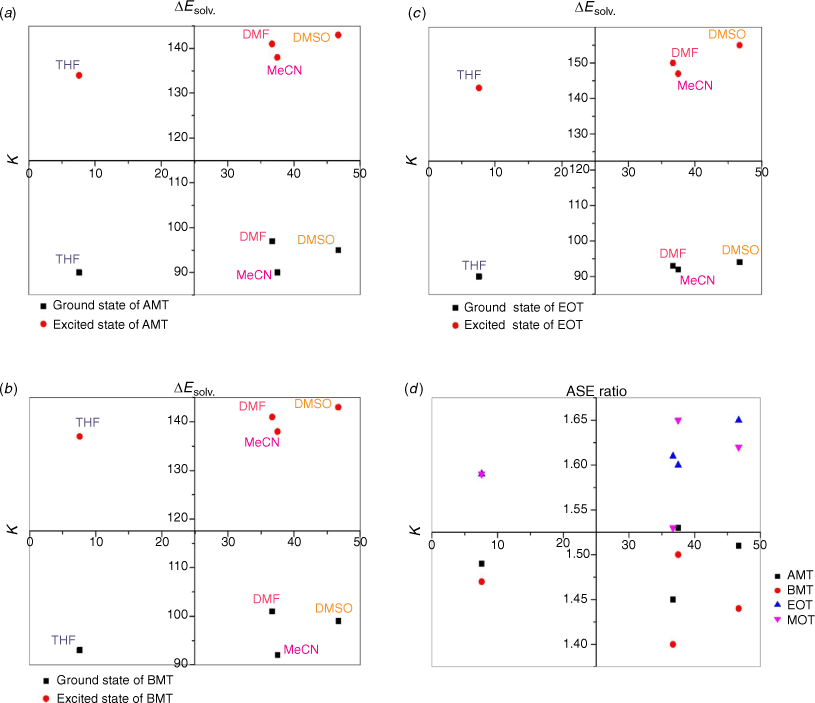
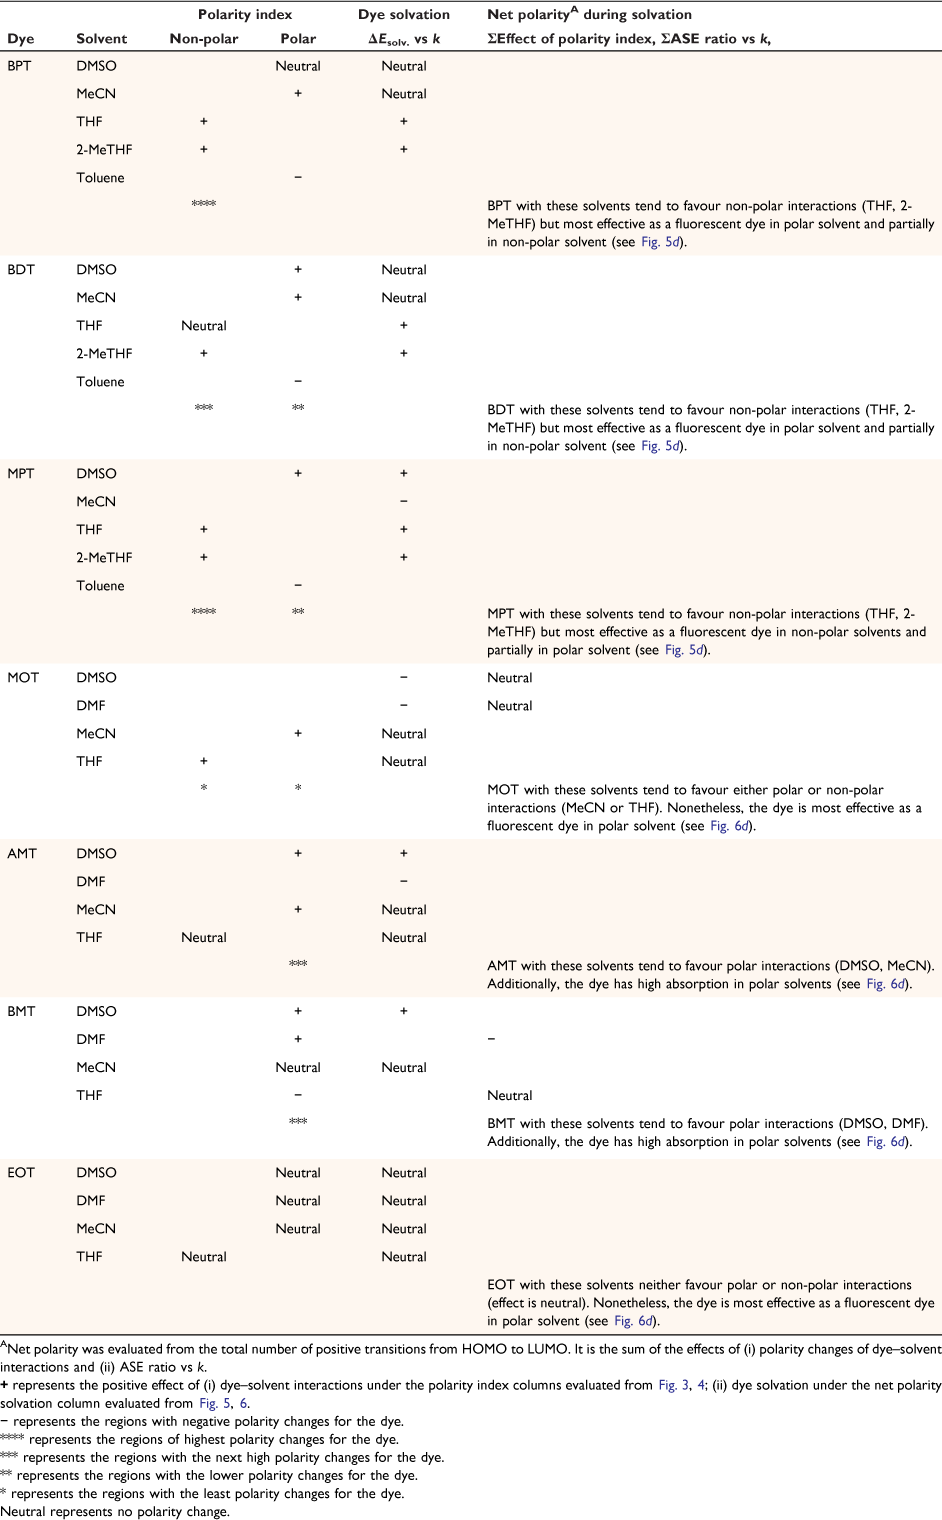
The ASE parameter was used to predict the net-charge changes of dye–solvent interactions delineated in Fig. 5, 6. Fig. 5 shows graphs from the scattered central plots of triazine substituted scaffolds at the 2-pyrrolidine, BPT; 5-methylthio, MPT; 7-dimethylglycl derivative positions, summarised in Table 3. The first and second graph plots (ΔEsolv. versus k) were used to allocate solvent positions within the different solvents considered. These graphs were then used to evaluate the resultant net charge solvation effect of the dye–solvent interactions. The same evaluation was considered for triazine substituted scaffolds at the 7-carboxylate position, MOT; 7-acetyl position, AMT; 7-benzoyl position, BMT; 3-ethyl and 7-carboxamide positions, EOT, summarised in Table 4.
|
|
Therefore, in comparison to previous models for solvatochromic behaviours of dyes using spectral approaches,[1,24,25,39] the newly developed concept provides more insight into the dynamic behaviours of dye–solvent interactions. In addition to the polarity changes measured by spectra indices using the RsI versus polarisation red shift in Fig. 3, 4 for the HOMO–LUMO transitions, the scattered central plot in Fig. 5, 6 was used to describe semi-quantitative behaviours of the triazine substituted dyes. A summary of the semi-quantitative transitions of the dyes has been provided in Table 4. Particularly, Table 4 provides a detailed description of the dye–solvent interactions.
|
|
Conclusions
Overall, this study demonstrates a novel approach to evaluate the solvatochromic behaviours of triazine substituted dyes in different solvents using the RsI, polarisation red shift and ASE. This concept can be used for any type of dye that displays solvatochromic behaviours in a wide range of solvents, therefore the theoretical framework discussed should prove useful to researchers investigating the solvatochromic properties of other classes of dyes for a range of applications. For the first class of triazine substituted dyes evaluated, BPT tend to favour non-polar interactions (THF, 2-MeTHF), but it is the most effective as a fluorescent dye in polar solvent and partially in non-polar solvent. BDT with these solvents tend to favour non-polar interactions (THF, 2-MeTHF), but is most effective as a fluorescent dye in polar solvent and partially in non-polar solvents. MPT with these solvents tend to favour non-polar interactions (THF, 2-MeTHF), but is most effective as a fluorescent dye in non-polar solvents and partially in polar solvent. For the other class of triazine substituted dyes evaluated, MOT with these solvents either favour polar or non-polar interactions (MeCN or THF). Nonetheless, the dye is most effective as a fluorescent dye in polar solvent. AMT with these solvents tends to favour polar interactions (DMSO, MeCN). Additionally, the dye has a high absorption in polar solvents. BMT with these solvents tends to favour polar interactions (DMSO, DMF). Additionally, the dye has a high absorption in polar solvents. EOT with these solvents neither favour polar nor non-polar interactions (effect is neutral). Nonetheless, the dye is most effective as a fluorescent dye in polar solvent.
NOTE: The triazine substituted dyes have either been previously synthesised or modified and characterised.[40,41] The wavelengths of the absorption and emission of the dyes were obtained using a Cary 50 Bio UV/Vis and Fluorolog 22 (Jobin Yvon Horiba) spectrophotometer, respectively. The work reported in this study is original and is an extension of author’s published previous works.[25,39]
Data availability
All data is either included in the manuscript or is available from the corresponding author on request.
Conflicts of interest
All authors declare no conflicts of interest.
Declaration of funding
The authors declare no funding.
Abbreviations
Supplementary material
Supplementary material is available online.
Acknowledgements
Dr Kristine Kilså Jensen is thanked for the gift of the triazine derivative dyes and some of the absorption and emission data obtained from her previous work.[41]
References
[1] C Reichardt, Solvatochromic Dyes as Solvent Polarity Indicators. Chem Rev 1994, 94, 2319.[2] S Nigam, S Rutan, Principles and Applications of Solvatochromism. Focal Point 2001, 55, 362A.
| Principles and Applications of Solvatochromism.Crossref | GoogleScholarGoogle Scholar |
[3] MA Rauf, S Hisaindee, Studies on solvatochromic behavior of dyes using spectral techniques. J Mol Struct 2013, 1042, 45.
| Studies on solvatochromic behavior of dyes using spectral techniques.Crossref | GoogleScholarGoogle Scholar |
[4] J Kerfoot, KV Korolkov, AS Nizovtsev, R Jones, T Taniguchi, K Watanabe, I Lesanovsky, B Olmos, NA Besley, E Besley, PH Beton, Substrate-induced shifts and screening in the fluorescence spectra of supramolecular adsorbed organic monolayers. J Chem Phys 2018, 149, 054701.
| Substrate-induced shifts and screening in the fluorescence spectra of supramolecular adsorbed organic monolayers.Crossref | GoogleScholarGoogle Scholar | 30089387PubMed |
[5] H Zhu, M Li, J Hu, X Wang, J Jie, Q Guo, C Chen, A Xia, Ultrafast Investigation of Intramolecular Charge Transfer and Solvation Dynamics of Tetrahydro[5]-helicene-Based Imide Derivatives. Sci Rep 2016, 6, 24313.
| Ultrafast Investigation of Intramolecular Charge Transfer and Solvation Dynamics of Tetrahydro[5]-helicene-Based Imide Derivatives.Crossref | GoogleScholarGoogle Scholar | 27074814PubMed |
[6] V Venkatraman, AE Yemene, J de Mello, Prediction of Absorption Spectrum Shifts in Dyes Adsorbed on Titania. Sci Rep 2019, 9, 16983.
| Prediction of Absorption Spectrum Shifts in Dyes Adsorbed on Titania.Crossref | GoogleScholarGoogle Scholar | 31740733PubMed |
[7] EC Jensen, Use of Fluorescent Probes: Their Effect on Cell Biology and Limitations. Anat Rec 2012, 295, 2031.
| Use of Fluorescent Probes: Their Effect on Cell Biology and Limitations.Crossref | GoogleScholarGoogle Scholar |
[8] EA Specht, E Braselmann, AE Palmer, A Critical and Comparative Review of Fluorescent Tools for Live-Cell Imaging. Annu Rev Physiol 2017, 79, 93.
| A Critical and Comparative Review of Fluorescent Tools for Live-Cell Imaging.Crossref | GoogleScholarGoogle Scholar | 27860833PubMed |
[9] NS Bayliss, EG McRae, Solvent Effects in Organic Spectra: Dipole Forces and the Franck–Condon Principle. J Phys Chem 1954, 58, 1002.
[10] NS Bayliss, EG McRae, Solvent Effects in the Spectra of Acetone, Crotonaldehyde, Nitromethane and Nitrobenzene. J Phys Chem 1954, 58, 1006.
[11] AT Amos, BL Burrows, Solvent-Shift Effects on Electronic Spectra and Excited-State Dipole Moments and Polarizabilities. Adv Quantum Chem 1973, 7, 289.
| Solvent-Shift Effects on Electronic Spectra and Excited-State Dipole Moments and Polarizabilities.Crossref | GoogleScholarGoogle Scholar |
[12] M Orozco, FJ Luque, Theoretical Methods for the Description of the Solvent Effect in Biomolecular Systems. J Chem Rev 2000, 100, 4187.
| Theoretical Methods for the Description of the Solvent Effect in Biomolecular Systems.Crossref | GoogleScholarGoogle Scholar |
[13] S Kumar, VC Rao, RC Rastogi, Excited-state dipole moments of some hydroxycoumarin dyes using an efficient solvatochromic method based on the solvent polarity parameter, ETN. Spectrochim Acta A Mol Biomol Spectrosc 2001, 57, 41.
| Excited-state dipole moments of some hydroxycoumarin dyes using an efficient solvatochromic method based on the solvent polarity parameter, ETN.Crossref | GoogleScholarGoogle Scholar | 11209865PubMed |
[14] F Würthner, G Archetti, R Schmidt, H-G Kuball, Solvent Effect on Color, Band Shape, and Charge-Density Distribution for Merocyanine Dyes Close to the Cyanine Limit. Angew Chem Int 2008, 47, 4529.
| Solvent Effect on Color, Band Shape, and Charge-Density Distribution for Merocyanine Dyes Close to the Cyanine Limit.Crossref | GoogleScholarGoogle Scholar |
[15] SN Baker, GA Baker, FV Bright, Temperature-dependent microscopic solvent properties of ‘dry’ and ‘wet’ 1-butyl-3-methylimidazolium hexafluorophosphate: correlation with ET(30) and Kamlet–Taft polarity scales. Green Chem 2002, 4, 165.
| Temperature-dependent microscopic solvent properties of ‘dry’ and ‘wet’ 1-butyl-3-methylimidazolium hexafluorophosphate: correlation with ET(30) and Kamlet–Taft polarity scales.Crossref | GoogleScholarGoogle Scholar |
[16] W Jarzeba, GC Walker, AE Johnson, MA Kahlow, PF Barbara, Femtosecond microscopic solvation dynamics of aqueous solutions. J Phys Chem 1988, 92, 7039.
[17] JK Hwang, A Warshel, Microscopic examination of free-energy relationships for electron transfer in polar solvents. J Am Chem Soc 1987, 109, 715.
[18] J Lu, CL Liotta, CA Eckert, Spectroscopically Probing Microscopic Solvent Properties of Room-Temperature Ionic Liquids with the Addition of Carbon Dioxide. Phys Chem A 2003, 107, 3995.
| Spectroscopically Probing Microscopic Solvent Properties of Room-Temperature Ionic Liquids with the Addition of Carbon Dioxide.Crossref | GoogleScholarGoogle Scholar |
[19] JR Mannekutla, BG Mulimani, SR Inamdar, Solvent effect on absorption and fluorescence spectra of coumarin laser dyes: evaluation of ground and excited state dipole moments. Spectrochim Acta A Mol Biomol Spectrosc 2008, 69, 419.
| Solvent effect on absorption and fluorescence spectra of coumarin laser dyes: evaluation of ground and excited state dipole moments.Crossref | GoogleScholarGoogle Scholar | 17540614PubMed |
[20] J-F Guillemoles, V Barone, L Joubert, C Adamo, A Theoretical Investigation of the Ground and Excited States of Selected Ru and Os Polypyridyl Molecular Dyes. J Phys Chem A 2002, 106, 11354.
| A Theoretical Investigation of the Ground and Excited States of Selected Ru and Os Polypyridyl Molecular Dyes.Crossref | GoogleScholarGoogle Scholar |
[21] N Srividya, P Ramamurthy, VT Ramakrishnan, Solvent effects on the absorption and fluorescence spectra of some acridinedione dyes: determination of ground and excited state dipole moments. Spectrochim Acta A Mol Biomol Spectrosc 1997, 53, 1743.
| Solvent effects on the absorption and fluorescence spectra of some acridinedione dyes: determination of ground and excited state dipole moments.Crossref | GoogleScholarGoogle Scholar |
[22] US Raikar, CG Renuka, YF Nadaf, BG Mulimani, AM Karguppikar, MK Soudagar, Solvent effects on the absorption and fluorescence spectra of coumarins 6 and 7 molecules: determination of ground and excited state dipole moment. Spectrochim Acta A Mol Biomol Spectrosc 2006, 65, 673.
| Solvent effects on the absorption and fluorescence spectra of coumarins 6 and 7 molecules: determination of ground and excited state dipole moment.Crossref | GoogleScholarGoogle Scholar | 16524762PubMed |
[23] RS Moog, DD Kim, JJ Oberle, SG Ostrowski, Solvent Effects on Electronic Transitions of Highly Dipolar Dyes: A Comparison of Three Approaches. J Phys Chem A 2004, 108, 9294.
| Solvent Effects on Electronic Transitions of Highly Dipolar Dyes: A Comparison of Three Approaches.Crossref | GoogleScholarGoogle Scholar |
[24] BK Freed, J Biesecker, WJ Middleton, Spectral polarity index: a new method for determining the relative polarity of solvents. J Fluorine Chem 1990, 48, 63.
| Spectral polarity index: a new method for determining the relative polarity of solvents.Crossref | GoogleScholarGoogle Scholar |
[25] V Akpe, H Brismar, T Nyokong, PO Osadebe, Photophysical and photochemical parameters of octakis (benzylthio) phthalocyaninato zinc, aluminium and tin: red shift index concept in solvent effect on the ground state absorption of zinc phthalocyanine derivatives. J Mol, Struct 2010, 984, 1.
| Photophysical and photochemical parameters of octakis (benzylthio) phthalocyaninato zinc, aluminium and tin: red shift index concept in solvent effect on the ground state absorption of zinc phthalocyanine derivatives.Crossref | GoogleScholarGoogle Scholar |
[26] V Akpe, TJ Biddle, C Madu, CL Brown, TH Kim, IE Cock, A computational comparative study for the spectroscopic evaluation of triazine derivative dyes in implicit solvation model systems using semi-empirical and time-dependent density functional theory approaches. Aust J Chem 2021, 74, 856.
| A computational comparative study for the spectroscopic evaluation of triazine derivative dyes in implicit solvation model systems using semi-empirical and time-dependent density functional theory approaches.Crossref | GoogleScholarGoogle Scholar |
[27] MD Hanwell, DE Curtis, DC Lonie, T Vandermeersch, E Zurek, GR Hutchison, Avogadro: an advanced semantic chemical editor, visualization, and analysis platform. J Cheminformatics 2012, 4, 1.
| Avogadro: an advanced semantic chemical editor, visualization, and analysis platform.Crossref | GoogleScholarGoogle Scholar |
[28] HB Schlegel, Optimization of equilibrium geometries and transition structures. J Comput Chem 1982, 3, 214.
| Optimization of equilibrium geometries and transition structures.Crossref | GoogleScholarGoogle Scholar |
[29] MJ Dewar, EG Zoebisch, EF Healy, JJ Stewart, Development and use of quantum mechanical molecular models. 76. AM1: a new general purpose quantum mechanical molecular model. J Am Chem Soc 1985, 107, 3902.
| Development and use of quantum mechanical molecular models. 76. AM1: a new general purpose quantum mechanical molecular model.Crossref | GoogleScholarGoogle Scholar |
[30] JJP Stewart, Optimization of parameters for semiempirical methods. II. Applications. J Comput Chem 1989, 10, 221.
| Optimization of parameters for semiempirical methods. II. Applications.Crossref | GoogleScholarGoogle Scholar |
[31] JJP Stewart, Optimization of parameters for semiempirical methods. III extension of PM3 to Be, Mg, Zn, Ga, Ge, As, Se, Cd, In, Sn, Sb, Te, Hg, Tl, Pb, and Bi. J Comput Chem 1991, 12, 320.
| Optimization of parameters for semiempirical methods. III extension of PM3 to Be, Mg, Zn, Ga, Ge, As, Se, Cd, In, Sn, Sb, Te, Hg, Tl, Pb, and Bi.Crossref | GoogleScholarGoogle Scholar |
[32] JJP Stewart, Optimization of parameters for semiempirical methods V: modification of NDDO approximations and application to 70 elements. J Mol Model 2007, 13, 1173.
| Optimization of parameters for semiempirical methods V: modification of NDDO approximations and application to 70 elements.Crossref | GoogleScholarGoogle Scholar |
[33] AD Bacon, MC Zerner, An intermediate neglect of differential overlap theory for transition metal complexes: Fe, Co and Cu chlorides. Theor Chim Acc 1979, 53, 21.
| An intermediate neglect of differential overlap theory for transition metal complexes: Fe, Co and Cu chlorides.Crossref | GoogleScholarGoogle Scholar |
[34] J-D Chai, M Head-Gordon, Long-range corrected hybrid density functionals with damped atom–atom dispersion corrections. Phys Chem Chem Phys 2008, 10, 6615.
| Long-range corrected hybrid density functionals with damped atom–atom dispersion corrections.Crossref | GoogleScholarGoogle Scholar | 18989472PubMed |
[35] MJ Frisch, JA Pople, JS Binkley, Self‐consistent molecular orbital methods 25. Supplementary functions for Gaussian basis sets. J Chem Phys 1984, 80, 3265.
| Self‐consistent molecular orbital methods 25. Supplementary functions for Gaussian basis sets.Crossref | GoogleScholarGoogle Scholar |
[36] R Krishnan, JS Binkley, R Seeger, JA Pople, Self‐consistent molecular orbital methods. XX. A basis set for correlated wave functions. J Chem Phys 1980, 72, 650.
| Self‐consistent molecular orbital methods. XX. A basis set for correlated wave functions.Crossref | GoogleScholarGoogle Scholar |
[37] H Rostkowska, A Barski, K Szczepaniak, M Szczesniak, WB Person, The tautomeric equilibria of thioanalogues of nucleic acids: spectroscopic studies of 2-thiouracils in the vapour phase and in low temperature matrices. J Mol Struct 1988, 176, 137.
| The tautomeric equilibria of thioanalogues of nucleic acids: spectroscopic studies of 2-thiouracils in the vapour phase and in low temperature matrices.Crossref | GoogleScholarGoogle Scholar |
[38] D Ben-Amotz, B Widom, Generalized Solvation Heat Capacities. J Phys Chem B 2006, 110, 19839.
| Generalized Solvation Heat Capacities.Crossref | GoogleScholarGoogle Scholar | 17020369PubMed |
[39] V Akpe, A Ogunsipe, C Madu, H Brismar, Red-Shift Index Concept in Solvent Effects of Chromophore-Substituted Metallophthalocyanines: A Look at the Empirical Relationship of the Macroscopic Properties of the Solute–Solvent Interactions. J Solution Chem 2015, 44, 307.
| Red-Shift Index Concept in Solvent Effects of Chromophore-Substituted Metallophthalocyanines: A Look at the Empirical Relationship of the Macroscopic Properties of the Solute–Solvent Interactions.Crossref | GoogleScholarGoogle Scholar |
[40] L Henriksen, H Autrup, The chemistry of 1,1-dithiolates: Thieno-1,2,3-triazines by diazotation of 3-Amino-thiophene-2-and-4-carboxamides. Acta Chem Scand 1972, 26, 3342.
[41] L Zhu, HC Becker, L Henriksen, K Kilså, A class of fluorescent heterocyclic dyes revisited: Photophysics, structure, and solvent effects. Spectrochim Acta A Mol Biomol Spectrosc 2009, 73, 757.
| A class of fluorescent heterocyclic dyes revisited: Photophysics, structure, and solvent effects.Crossref | GoogleScholarGoogle Scholar | 19457716PubMed |


