Evaluation of the evaporation route of a liquid droplet on Au coated and non-coated glass surfaces
Victor Akpe A B * , Timothy J. Biddle
  A and Ian E. Cock
  A B *
A B *
A School of Environment and Science, Griffith University, Nathan Campus, Qld 4111, Australia.
B Environmental Futures Research Institute, Griffith University, Nathan Campus, Qld 4111, Australia.
Handling Editor: Richard Hoogenboom
Australian Journal of Chemistry 75(3) 220-230 https://doi.org/10.1071/CH21197
Submitted: 12 August 2021 Accepted: 6 December 2021 Published: 27 February 2022
© 2022 The Author(s) (or their employer(s)). Published by CSIRO Publishing. This is an open access article distributed under the Creative Commons Attribution-NonCommercial-NoDerivatives 4.0 International License (CC BY-NC-ND)
Abstract
The contact angle was used to estimate the rate of evaporation of liquid droplets on bare glass or gold (Au) sputtered glass surfaces. The rate of evaporation of water (a pure liquid) was higher than non-pure liquid composed of a 3 wt% solution of silica nanoparticles (SNP) on these two solid supports. Despite using the same initial drop volume (1 µL) throughout the experiment, the base diameter of the liquid droplet after evaporation on the different surfaces interestingly showed variations. While the liquid–solid interface displayed slip-length and contact angle variations throughout the evaporation time, the slip-length variations were more pronounced with colloidal SNP on Au-sputtered glass surfaces than pure liquid on bare glass surface. Potential application of this study was also investigated in the surface control of uniform silica microwires from colloidal SNP on Au-sputtered glass surface under low temperature conditions.
Keywords: colloidal particle, contact angle, droplet evaporation, dew point, liquid interface, surface coating, surface wetting, silica microwires.
Introduction
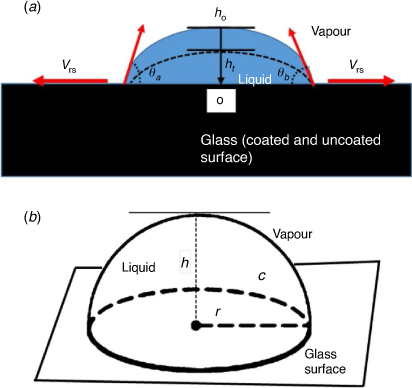
There has been a considerable interest in understanding liquid droplet motion on surfaces. Fundamentally, a drop of liquid on a flat surface spreads eventually[1] but the extent depends on the surface types: (i) smooth, homogeneous (ii) smooth, heterogeneous (iii) rough, homogeneous (iv) rough, heterogeneous. As shown in Fig. 1, a liquid meets at the interface of air and solid support, defined as a three-phase contact line (at the vapour–liquid–solid lines). Also, for a liquid droplet to have a momentary equilibrium on the three-phase contact line, there must be a thermodynamic driving force that can minimise the interfacial surface energies at the point of intersection.[2] The modified Young equation, along with other complementary methods have been used by investigators to measure the contact line tension (CLT) to be in the range of 10−12–10−5 J m−1.[3–8] More so, it has been established that obtaining the accurate quantity of the CLT requires high resolution microscopy, and arguably remains the most controversial measurement in surface phenomena.[6,7]
|
Evaporation is useful in many practical life situations and researchers have used the principle to control drop shapes on surfaces and assemble unprecedented nanostructured materials,[9–15] for example to fabricate microwires from colloidal suspensions of silica nanoparticles (SNP).[16,17] Further, microwires are employed in special applications, including accurate sensors within the field of optics.[18–20] Thus, understanding the evaporation mechanism of the colloidal droplet may lead to the fabrication of nanostructured materials with precise control. Moreover, during evaporation of a dissolved liquid at a critical contact angle on the CSL, particle–surface interactions, particle–particle interactions and convective particle motion may play a dominant role. This comprehensive underlying principle of the evaporation process of dissolved liquids has been investigated and extended to other major field applications such as microfluidic flow devices,[21,22] gene mapping,[23,24] and as an alternative and faster route to bioassay preparation.[25–27] Therefore, control of drops, kinetics of drop evaporation from surfaces, evaporation process, contact line and drying dynamics make the theoretical and practical considerations relating to a drop of liquid on different surfaces remain an open and active research area.
Other models that have been reviewed in the past include wetting transition and fluid dynamics as the key factors involved in spreading during evaporation.[28] The surface conditions have also been reported to influence forced or spontaneous spreading of liquid droplets t.[29] Additionally, modelling studies conducted on the spreading of circular droplets support that contact angle has significant impact on the surface boundary and bears a direct correlation with the contact line during spreading.[30] Further, the significant difference between non-wetting and wetting transitions of a liquid drop on a solid support has been pointed out by Birdi et al.[31] and Rowan et al.[32], respectively. Recent reviews[33–35] have provided a comprehensive view of drop evaporation theory on a spherical cap drop and a sessile drop, including drying dynamics and stick–slip behaviour experienced by dissolved drops.
Herein, we report a simple evaporation model. This study circumvents complex parameters involved in the evaporation of a drop on a solid substrate. The model is based on a drop having a sphere geometry in space with a hemispherical plane and a base (Fig. 1b). Subsequently, the model description was used to approximate a spherical cap geometry, with the following considered in this investigation: (i) a pure liquid (H2O) and colloidal liquid of the same volume of drop (1 µL), (ii) initial contact angle on the three-phase contact line (θ < 90°), (iii) negligible gravitational force, as the drop size was relatively small (iv) constant contact surface area (static) and (v) experimental contact angle measured on the two sides are relatively the same (vi) the radial distance from the centre of liquid drop is the same. This allows the distance between the two radii to be used as the effective diameter (Fig. 1a, b). Lastly, (vii) non-coated glass and sputtered gold (Au-coated) glass surfaces have been used as solid substrates.
Experimental details
Materials and methods
The contact angle goniometry setup shown in Fig. 1 was used for the surface measurements under the following conditions: (T = 21–22°C, RH – 31–32%). The temperature and relative humidity (RH) were internally regulated using the humidity controlled solutions system in the laboratory. A stopwatch was used to monitor the kinetics of evaporation of colloidal drops of SNP (Ludox AS-40, Sigma Aldrich) and H2O. Glass substrate was sputtered with a coat of Au-particles under vacuum using a sputter coater instrument (EMITECH K550X) under the following conditions: for Au-sputtered glass surfaces: current = 25 mA; time = 2 s; vacuum pressure = 1 × 10⁻¹ mbar; grain size deposition for Au-particles ~ 15 nm. Glass surfaces were blown using a high-pressure nitrogen gas (N2) flow gun for 2 min. Deionised H2O was added (100 mL) and the surfaces were sonicated in an ultrasonicating bath (Vevor, Australia) for 30 min. The surfaces were again rinsed using deionised water (100 mL) and dried under N2 for >5 min. The volume of all liquid drops used for contact angle measurements was held constant at V = 1 µL, either as a 1 µL drop of deionised H2O, or a drop of 3 wt% SNP solution. The sessile-drop technique was used for the measurement of the contact angle, and also to follow the kinetics of evaporation for all glass surfaces.
Monitoring the evaporation rate of liquid droplets on glass surfaces
On the glass surfaces (non-coated and sputtered coat with Au), a 1 µL drop of liquid (H2O and 3 wt% concentration of SNP) was carefully dispensed on the substrate surfaces and allowed to evaporate under a covered styrofoam box. Windows 7 Photo Viewer image software was used to calibrate the stage with a thin ruler and the contact angle of both sides of the drops was captured every 20 s during evaporation. Subsequently, the data was analysed to measure the perimeter and height of the drop.
Results and discussion
A liquid drop in contact with the flat horizontal solid support eventually spreads. Describing the evaporation motion is predetermined by the surface types: (i) smooth, homogeneous (ii) smooth, heterogeneous (iii) rough, homogeneous (iv) rough, heterogeneous. While the three-phase contact rule holds for a liquid at the vapour–liquid–solid boundaries shown in Fig. 1a, several evaporation models have been reported in the literature due to the parameters used to describe the motion of liquid drops. The aim of this work was to establish an easily accessible evaluation of evaporation data by providing a high-level simplification, with probable extension to other surface types that have liquid confined to the spherical cap drop approximation in contact with the three-phase line. Compared to many other model systems reported in the literature, an evaporation model of high-level simplification has therefore been reported. Particularly, this study circumvents complex parameters involved in the evaporation of a drop on a solid substrate. The model is based on a drop having a spherical geometry in space with a hemispherical plane and a base (Fig. 1b). Subsequently, the model description was used to approximate a spherical cap geometry, with the following considered in this investigation: (i) a pure liquid (H2O) and colloidal liquid of the same volume of drop (1 µL), (ii) initial contact angle on the three-phase contact line (θ < 90°), (iii) negligible gravitational force, as the drop size was relatively small (iv) constant contact surface area (static) and (v) experimental contact angle measured on the two sides are relatively the same (vi) assumed that the radial distance from the centre of liquid drop are the same which allows the distance between the 2-radii to be used as the effective diameter (Fig. 1a, b). Lastly, (vii) non-coated glass and sputtered gold (Au-coated) glass surfaces have been used as solid substrates.
The evaporation rate of a sessile drop (water) or a nearly spherical cap (SCAP) can be described by the contact angle, contact radius and drop height.[9] Further, the kinetics of a drop upon evaporation depends on several contributing factors. These include the nature of the vapour flux over the drop surface, type of wetting – complete or partial wetting, disjoining and cojoining (Derjaguin’s approximation) at the CSL, and evaporative cooling of drop on the surface.[10] Given these considerations, the parameters used to describe the kinetics of a liquid drop on the solid substrate is predetermined by the experimental conditions. Apart from the pure liquid (water) that was evaluated, the evaporation route of a colloidal liquid drop on different glass supports was evaluated using the same model system and subsequently extended to the surface control of self-assembled silica nanoparticles materials upon drying.
It has been established that the evaporation of a small drop of liquid on a flat horizontal surface depends on either: (i) constant contact radius (CCR) or (ii) constant contact angle (CCA), and in addition, on the nature of the substrate even for the same liquid.[33,34] However, for drops containing dispersed liquids, the evaporation is rather complex, as coffee-ring effect and radial capillary flow within the centre of a drop,[36] including contact line deposits within the evaporating drop[37] can make the evaporation route differ considerably from a pure liquid drop. In addition, drops on nanostructured surface have been shown to move with slip-length and contact angle variations without constant speed during evaporation.[38]
Therefore, for the model that we have investigated, the discussion is based on the vapour diffusion of a pure liquid (H2O) across a spherical drop’s boundary at the two principal radii of curvature that occur at the contact line and the observed variation with colloidal droplet. It has been shown that during evaporation, at a critical angle ~40°, contraction of the contact radius may occur at that point.[32] In our simple model, we assumed a sphere must have a degree of symmetry about a point. Therefore, for a volume of drop on contact with a surface (θ < 90°) with negligible gravitational force and constant contact surface area, the radial distance from that point can be assumed to have the same values. The distance between the two radii can then be used as the effective diameter (Fig. 1a, b).
Notably, the following parameters were considered in this study: (i) the volume of drop (V), (ii) the radius of wetted spot (r), (iii) contact angle (θ) between the liquid and solid at the three-phase contact line, (iv) negligible gravitational effect on liquid drop on the solid substrate due to drop size and (v) drop in the nearly spherical cap (SCAP) shape. Additional considerations to this model include: (vi) the liquid droplet shape is hemispherical at the time the liquid rests on the solid surface and (vii) the contact angle is measured for both sides of the drop.
Approximation of a spherical cap drop of liquid during evaporation on a flat surface plane
It has been suggested that there are at least four macroscopic parameters that influence the motion of fluid on a glass substrate during evaporation. These parameters include: volume of drop, V, radius of wetted spot, r, contact angle, θ, between the liquid and solid at the three-phase contact line, and effects due to gravity.[32] Notably, a small drop of liquid on a flat horizontal surface depends on either the constant contact radius (CCR) or constant contact angle (CCA), and in addition, on the nature of the substrate for the same liquid.[33,39] Geometrically, the spherical cap approximation of a pure liquid droplet on a flat horizontal plane may assume a hemispherical shape when the height of the sphere is equal to the radius (Fig. 1b) during evaporation. For this to occur, the initial contact of the drop must have a strong surface attraction to establish the pinning on the surface.
Applying the spherical cap approximation (h = r),

Here, h0 and r0 describe the initial height and radius of the drop, respectively, while h0 and ht describe the height and radius, rt is the radius of the drop at 20 s intervals, respectively, during evaporation.
Due to factors including surface interaction forces, roughness, evaporating flux, and concentration of colloidal particles in solution, different surface conditions can lead to varied behaviour of particle deposits. These factors may influence the same liquid drop volume to have different evaporation routes from the dispersed liquid. Accordingly, the spherical cap approximation during evaporation is modified to:

Eqn 2a is the aspect ratio,  of the spherical cap within the hemispherical plane of the liquid drop, which, in this case, excludes the contact angle of the drop. Another evaporation model[34] reported the height of the drop as the spherical cap above the supporting solid surface, related to the two radii and the contact angle by:

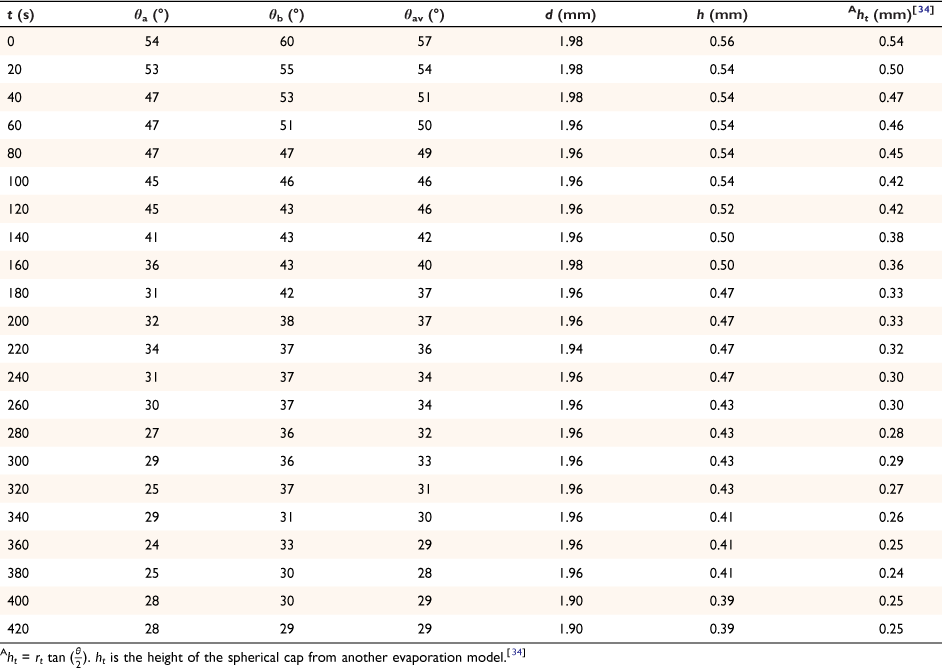
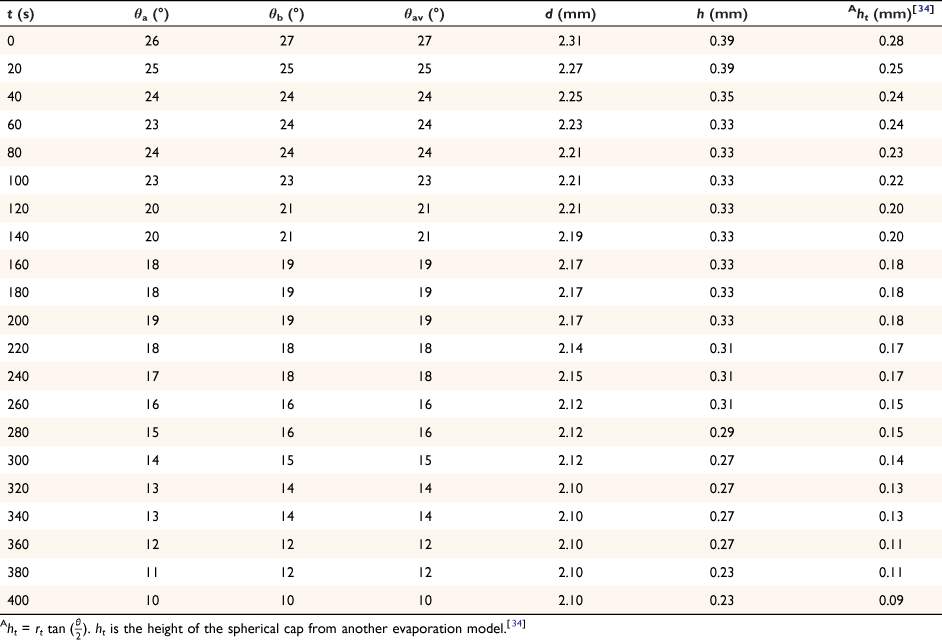
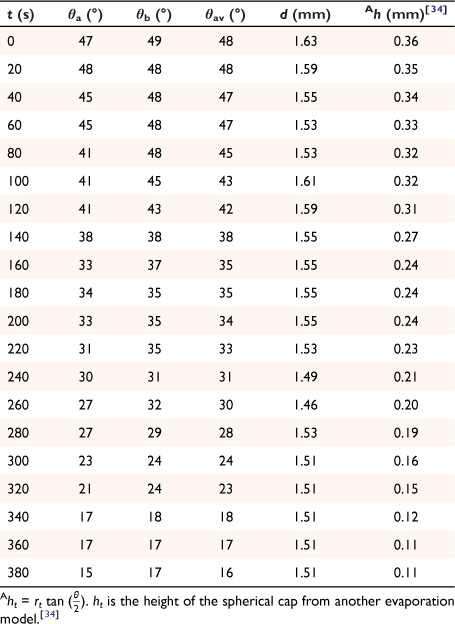
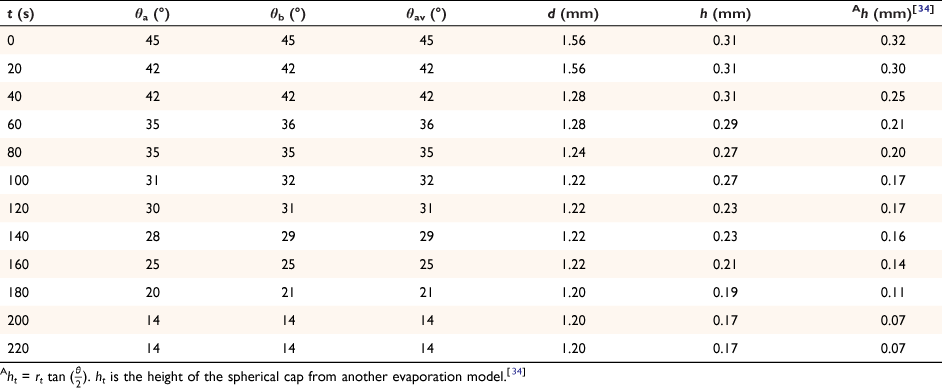
The spherical cap approximation of the two models (reported model and literature report) have been indicated in Tables 1–4. It is expected that the drop height should decrease as the contact angle decreases during evaporation at ambient temperature. The spherical cap approximation in this study is the aspect ratio of the drop’s shape i.e. the ratio of the drop’s height to its radius. Since the base radius is relatively constant (or infinitesimal), the aspect ratio of the drop dimension was used for the spherical cap approximation (Eqn 2a). Another formula for spherical drop height during evaporation has been indicated in Eqn 2b.[34]
|
|
|
|
The volume of a spherical cap drop is given by:

where the volume V of a drop of liquid left on the surface within the spherical cap approximation at time t during evaporation is given by the approximation:

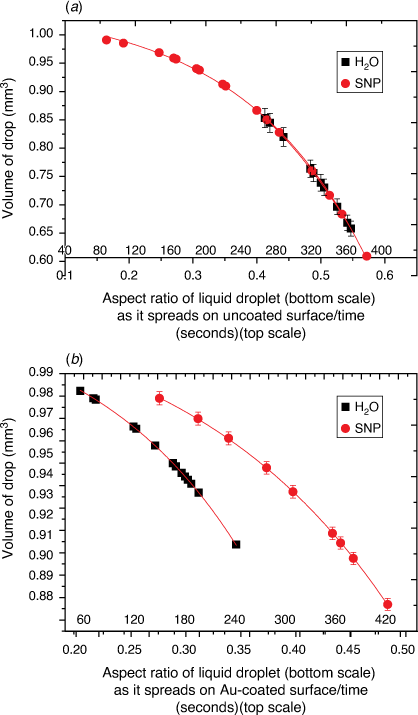
The graph profiles in Fig. 2 show the estimated volume of a liquid drop with respect to the drop’s shape (calculated as the aspect ratio of drop) that is left on the glass surface during evaporation. During evaporation, H2O molecules that leave the surface may experience frequent collision with less energetic H2O molecules on the surface so that the estimated volume is affected by the vapour pressure, atmospheric pressure and molecular weights of surrounding vapour and air. As illustrated by the models in Fig. 1a, b, the evaporation process proceeds with the slow collapse of the drop’s height during which the aspect ratio (h/r) increases as time t increases and the volume of H2O decreases.
|
The rate of volume of drop left on the surface was estimated using differential calculus as:

where  from Eqn 3 is given by:

Here, S represents the surface area of the spherical cap approximation. During the evaporation process, there was no significant change in the base diameter of H2O droplets applied to the uncoated surface (this result is supported by reference[31]), but a significant change was recorded with the droplet containing 3 wt% SNP, which demonstrated an occasional increase and decrease in base diameter with time, known as the slip-length and contact angle variations.[40,41] However, for the Au-coated surface, significant changes were observed for both the H2O and SNP drops, with a decrease in base diameter with time t. This demonstrates that the change in the base radius of the water drop  is constant on an uncoated surface but is significant on an Au-coated surface. Thus, from the integration of Eqn 5, 6;


where A, S represent the rate of change of base radius at the contact line and the surface area of the drop, respectively. RV is the rate of change of drop volume for droplets of H2O and SNP solution. The spherical cap approximation during evaporation is summarised in Table 1, with H2O retention remaining higher on the non-coated surface than the Au-coated surface during evaporation.
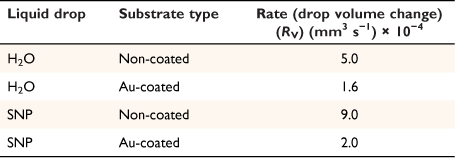
Table 5 shows the comparative study of water retention on the different surfaces. There was higher H2O retention on the non-coated surface than the Au coated surface suggesting that H2O interaction is stronger than with the Au-coated surface.
|
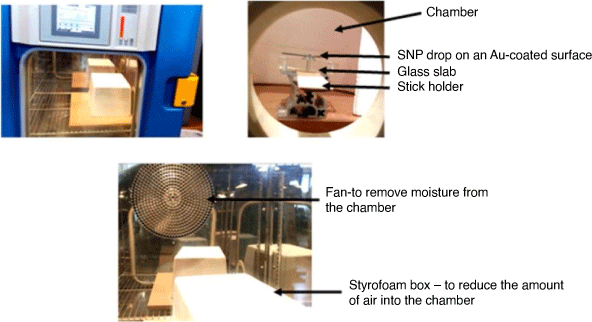
Subsequently, the simple evaporation model was then considered for drops containing SNP solutions on glass and Au-coated glass surfaces for obtaining precise control of the silica microwire. Thus, based on the rate of evaporation from the two solid substrates (Table 5), glass surface sputtered with Au particles was used to further investigate the surface control of uniform silica microwires from colloidal SNP conducted in the cold temperature range in the described methods section (Fig. 3).
|
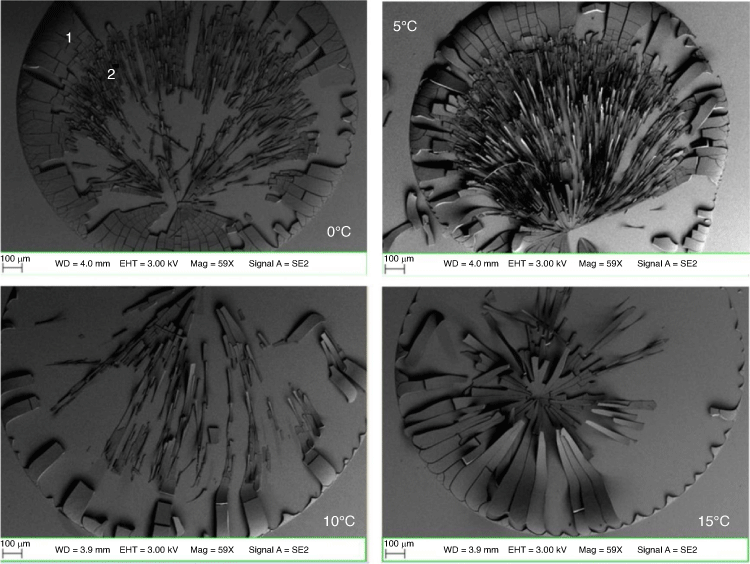
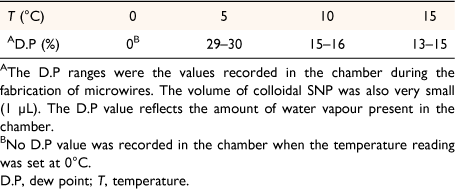
Fig. 4 shows the dependence of temperature on surface control of microwires fabricated in the humidity-controlled chamber. The microwires were fabricated according to the internally regulated humidity and temperature readings in Table 6. Hence, the microwires were fabricated at different cold temperature ranges. There was no dew point recording for microwires fabricated at 0°C because the chamber was dried for 1 h prior to SNP addition (V = 1 µL). The formation of microwires in the cold temperature conditions (Fig. 4) also suggests that nanoparticles have different cooling rates, and subsequently tends to affect the motion of fluid on the surface. Consequently, the cooling rate also affects the rate at which solvent lost at the perimeter of the drop is replaced by the liquid within the drop, known as capillary action. Additionally, the delayed response of H2O taken up at the cold temperature may also affect the way microwires are produced upon drying. The results show uniform wires at (0°, 5°C) and tapered microwires at (10°, 15°C) in Fig. 4. At 0°C and 5°C, colloidal dispersal of fluid seems to produce long and thinner microwires, but as the temperature increases, the wires become tapered at 15°C. The different wire shapes suggest internal packing configurations that give the wire uniformity using the body-centred cubic (BCC) and hexagonal closing packing (HCP) arrangements decrease from 0°C. Thus, the direction of fluid flow inside the drop during evaporation is constantly changing as the temperature increases, hence the reason for the tapered wires at higher temperatures on the Au-sputtered glass surface.
|
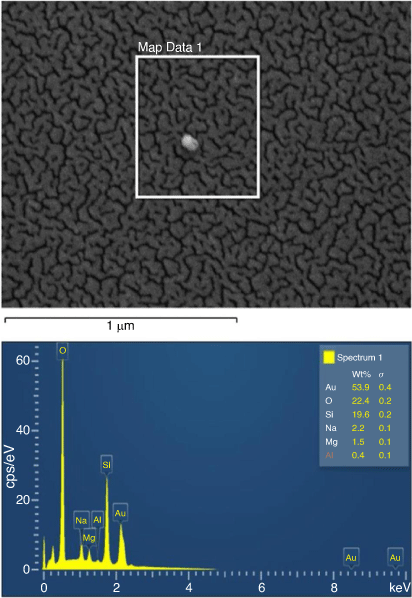
Fig. 5 shows the Zeiss ULTRA Plus scanning electron microscopy (SEM) surface of the Au-sputtered glass surface. This roughness is due to the presence of the gold particle thickness, estimated to be 7–15 nm deposition. The energy dispersive X-ray spectroscopy (EDS) spectrum of Au-coated glass surface analysed is also shown in Fig. 5. X-ray microanalysis study (EDS) was used to confirm the prominent elemental peaks in the spectrum, (53.9% Au, 22.4% O, 19.6% Si, 2.2% Na, 1.5% Mg and 0.4% Al). Comparing the internal glass composition of the uncoated substrate (composition: 72% SiO2, 14.5% Na2O, 0.30% K2O, 7.05% CaO, 3.95% MgO, 1.65% Al2O3, 0.06% Fe2O3) with the Au-sputtered glass surface make it probable that the prominent elemental peaks that appear in the spectrum represent the surface fraction by wt% responsible for influencing the behaviour of the motion of liquid droplets on Au-coated surfaces.
|
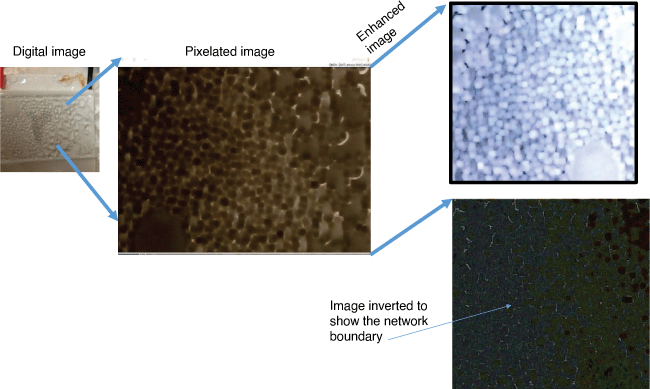
Fig. 6 shows the effect of condensation while trying to use Peltier control to fabricate microwires from colloidal SNP at 0°C. Condensation is a serious problem during fabrication of silica microwires at the cold temperature conditions. Condensation leads to the formation of liquid droplets on the cold surface. For instance, if the substrate surface, surrounding environment and humidity conditions are not controlled, the effect may lead to the image depicted in Fig. 6 – the formation of silica nanocluster liquid droplets on bare glass surface but no microwires. Nonetheless, condensation application combined with conventional pulsed laser ablation has been used to synthesise an interesting cluster of semiconducting nanocrystal materials.[42] For this particular study, condensation was reduced using glass surfaces sputtered with Au particles. The kinetics of the evaporation route was evaluated in the first part of the experimental work, suggesting that Au surface has a lower water retention during evaporation (Table 5) and is also ideal for the production of silica microwires on cold surfaces.
|
Conclusion
The spherical cap approximation of liquid droplets composed of H2O and a solution of SNP in H2O has been analysed using parameters considered to influence the evaporation process from the flat surfaces. Notably, the measurable parameters have been investigated on two types of surfaces: non-coated glass and Au-coated glass. The base diameter of droplets on a non-coated glass surface remained relatively constant. The H2O and SNP drops on Au-coated glass surfaces showed measurable base diameter changes during evaporation. Additionally, the spherical cap approximation for the drop height from our experiment was compared with the drop height formula from another evaporation model[34] indicated in Tables 1–4. The spherical cap drop height was found to be comparable with the suggested formula reported in the literature.[34] The contact angle measurements and other parameters considered for the evaporation kinetics were used to evaluate the surface control of microwires from the colloidal suspension of SNP. Hence, from this study, the data confirms that the surface conditions partly direct the molecular structure of a fluid flow system as has previously been indicated by Heslot et al.[43] Thus, the behaviour of fluid flow droplet within the spherical cap approximation on a Au-coated surface can be controlled at very cold temperature range. Further, using drop from evaporation on Au-coated glass surfaces, there may better chance to produce nanostructures with controlled shapes, including the bottom-up synthesis at extremely low conditions. Future studies should also aim to determine if the model presented herein functions similarly for other liquid/solid interfaces.
Data availability
The data that support this study are available in the article.
Conflicts of interest
All authors declare no conflict of interest.
Declaration of funding
This research did not receive any specific funding.
Acknowledgements
V. A. acknowledges the Griffith University for an Australian Research Training Scholarship, the Griffith University Postgraduate Research Scholarship and the Griffith University International Postgraduate Scholarship.
References
[1] A Cassie, Contact angles. Discuss Faraday Soc 1948, 3, 11.[2] T Pompe, S Herminghaus, Three-phase contact line energetics from nanoscale liquid surface topographies. Phys Rev Lett 2000, 85, 1930.
| Three-phase contact line energetics from nanoscale liquid surface topographies.Crossref | GoogleScholarGoogle Scholar | 10970650PubMed |
[3] T Getta, S Dietrich, Line tension between fluid phases and a substrate. Physical Review E 1998, 57, 655.
| Line tension between fluid phases and a substrate.Crossref | GoogleScholarGoogle Scholar |
[4] F Bresme, N Quirke, Computer simulation study of the wetting behavior and line tensions of nanometer size particulates at a liquid-vapor interface. Phys Rev Lett 1998, 80, 3791.
| Computer simulation study of the wetting behavior and line tensions of nanometer size particulates at a liquid-vapor interface.Crossref | GoogleScholarGoogle Scholar |
[5] J Drelich, JL Wilbur, JD Miller, GM Whitesides, Contact angles for liquid drops at a model heterogeneous surface consisting of alternating and parallel hydrophobic/hydrophilic strips. Langmuir 1996, 12, 1913.
| Contact angles for liquid drops at a model heterogeneous surface consisting of alternating and parallel hydrophobic/hydrophilic strips.Crossref | GoogleScholarGoogle Scholar |
[6] JY Wang, S Betelu, BM Law, Line tension effects near first-order wetting transitions. Phys Rev Lett 1999, 83, 3677.
| Line tension effects near first-order wetting transitions.Crossref | GoogleScholarGoogle Scholar |
[7] A Amirfazli, DY Kwok, J Gaydos, AW Neumann, Line tension measurements through drop size dependence of contact angle. J Colloid Interface Sci 1998, 205, 1.
| Line tension measurements through drop size dependence of contact angle.Crossref | GoogleScholarGoogle Scholar | 9710494PubMed |
[8] J Drelich, Static contact angles for liquids at heterogeneous rigid solid surfaces. Pol J Chem 1997, 71, 525.
[9] HY Erbil, Evaporation of pure liquid sessile and spherical suspended drops: a review. Adv Colloid Interface Sci 2012, 170, 67.
| Evaporation of pure liquid sessile and spherical suspended drops: a review.Crossref | GoogleScholarGoogle Scholar | 22277832PubMed |
[10] TA Nguyen, MA Hampton, AV Nguyen, Evaporation of nanoparticle droplets on smooth hydrophobic surfaces: the inner coffee ring deposits. J Phys Chem C 2013, 117, 4707.
| Evaporation of nanoparticle droplets on smooth hydrophobic surfaces: the inner coffee ring deposits.Crossref | GoogleScholarGoogle Scholar |
[11] RG Larson, Re‐shaping the coffee ring. Angewandte Chemie International Edition 2012, 51, 2546.
| Re‐shaping the coffee ring.Crossref | GoogleScholarGoogle Scholar | 22278914PubMed |
[12] G Berteloot, A Hoang, A Daerr, HP Kavehpour, F Lequeux, L Limat, Evaporation of a sessile droplet: Inside the coffee stain. J Colloid Interface Sci 2012, 370, 155.
| Evaporation of a sessile droplet: Inside the coffee stain.Crossref | GoogleScholarGoogle Scholar | 22284570PubMed |
[13] X Shen, C-M Ho, T-S Wong, Minimal size of coffee ring structure. J Phys Chem B 2010, 114, 5269.
| Minimal size of coffee ring structure.Crossref | GoogleScholarGoogle Scholar | 20353247PubMed |
[14] DM Kuncicky, K Bose, KD Costa, OD Velev, Sessile droplet templating of miniature porous hemispheres from colloid crystals. Chem Mater 2007, 19, 141.
| Sessile droplet templating of miniature porous hemispheres from colloid crystals.Crossref | GoogleScholarGoogle Scholar |
[15] DM Kuncicky, OD Velev, Surface-guided templating of particle assemblies inside drying sessile droplets. Langmuir 2008, 24, 1371.
| Surface-guided templating of particle assemblies inside drying sessile droplets.Crossref | GoogleScholarGoogle Scholar | 18020467PubMed |
[16] M Naqshbandi, J Canning, BC Gibson, MM Nash, MJ Crossley, Room temperature self-assembly of mixed nanoparticles into photonic structures. Nat Commun 2012, 3, 1188.
| Room temperature self-assembly of mixed nanoparticles into photonic structures.Crossref | GoogleScholarGoogle Scholar | 23149733PubMed |
[17] T Kurimura, Y Takenaka, S Kidoaki, M Ichikawa, Fabrication of gold microwires by drying gold nanorods suspensions. Adv Mater Interfaces 2017, 4, 1601125.
| Fabrication of gold microwires by drying gold nanorods suspensions.Crossref | GoogleScholarGoogle Scholar |
[18] C Han, F Lv, C Sun, H Ding, Silica microwire-based interferometric electric field sensor. Opt Lett 2015, 40, 3683.
| Silica microwire-based interferometric electric field sensor.Crossref | GoogleScholarGoogle Scholar | 26274634PubMed |
[19] J Li, L-P Sun, S Gao, Z Quan, Y-L Chang, Y Ran, L Jin, B-O Guan, Ultrasensitive refractive-index sensors based on rectangular silica microfibers. Opt Lett 2011, 36, 3593.
| Ultrasensitive refractive-index sensors based on rectangular silica microfibers.Crossref | GoogleScholarGoogle Scholar | 21931401PubMed |
[20] J Canning, H Weil, M Naqshbandi, K Cook, M Lancry, Laser tailoring surface interactions, contact angles, drop topologies and the self-assembly of optical microwires. Opt Mater Express 2013, 3, 284.
| Laser tailoring surface interactions, contact angles, drop topologies and the self-assembly of optical microwires.Crossref | GoogleScholarGoogle Scholar |
[21] NJ Carroll, SB Rathod, E Derbins, S Mendez, DA Weitz, DN Petsev, Droplet-based microfluidics for emulsion and solvent evaporation synthesis of monodisperse mesoporous silica microspheres. Langmuir 2008, 24, 658.
| Droplet-based microfluidics for emulsion and solvent evaporation synthesis of monodisperse mesoporous silica microspheres.Crossref | GoogleScholarGoogle Scholar | 18171093PubMed |
[22] I Lee, Y Yoo, Z Cheng, HK Jeong, Generation of monodisperse mesoporous silica microspheres with controllable size and surface morphology in a microfluidic device. Adv Funct Mater 2008, 18, 4014.
| Generation of monodisperse mesoporous silica microspheres with controllable size and surface morphology in a microfluidic device.Crossref | GoogleScholarGoogle Scholar |
[23] J Jing, J Reed, J Huang, X Hu, V Clarke, J Edington, D Housman, TS Anantharaman, EJ Huff, B Mishra, Automated high resolution optical mapping using arrayed, fluid-fixed DNA molecules. Proc Natl Acad Sci 1998, 95, 8046.
| Automated high resolution optical mapping using arrayed, fluid-fixed DNA molecules.Crossref | GoogleScholarGoogle Scholar | 9653137PubMed |
[24] K Jo, DM Dhingra, T Odijk, JJ de Pablo, MD Graham, R Runnheim, D Forrest, DC Schwartz, A single-molecule barcoding system using nanoslits for DNA analysis. Proc Natl Acad Sci 2007, 104, 2673.
| A single-molecule barcoding system using nanoslits for DNA analysis.Crossref | GoogleScholarGoogle Scholar | 17296933PubMed |
[25] R Hernandez-Perez, ZH Fan, JL Garcia-Cordero, Evaporation-Driven Bioassays in Suspended Droplets. Anal Chem 2016, 88, 7312.
| Evaporation-Driven Bioassays in Suspended Droplets.Crossref | GoogleScholarGoogle Scholar | 27331825PubMed |
[26] V Akpe, S Murhekar, TH Kim, CL Brown, IE Cock, Profiling the neoplasm microenvironment of silica nanomaterial-derived scaffolds of single, 2-, and 3-composite systems. Assay Drug Dev Technol 2021, 19, 191.
| Profiling the neoplasm microenvironment of silica nanomaterial-derived scaffolds of single, 2-, and 3-composite systems.Crossref | GoogleScholarGoogle Scholar | 33471566PubMed |
[27] V Akpe, S Murhekar, TH Kim, CL Brown, IE Cock, Batch effect adjustment to lower the drug attrition rate of MCF-7 breast cancer cells exposed to silica nanomaterial-derived scaffolds. Assay Drug Dev Technol 2021, 19, 46.
| Batch effect adjustment to lower the drug attrition rate of MCF-7 breast cancer cells exposed to silica nanomaterial-derived scaffolds.Crossref | GoogleScholarGoogle Scholar | 33443468PubMed |
[28] P-G De Gennes, Wetting: statics and dynamics. Rev Mod Phys 1985, 57, 827.
| Wetting: statics and dynamics.Crossref | GoogleScholarGoogle Scholar |
[29] A Marmur, Equilibrium and spreading of liquids on solid surfaces. Adv Colloid Interface Sci 1983, 19, 75.
| Equilibrium and spreading of liquids on solid surfaces.Crossref | GoogleScholarGoogle Scholar |
[30] M Bussmann, S Chandra, J Mostaghimi, Modeling the splash of a droplet impacting a solid surface. Phys Fluids 2000, 12, 3121.
| Modeling the splash of a droplet impacting a solid surface.Crossref | GoogleScholarGoogle Scholar |
[31] K Birdi, D Vu, A Winter, A study of the evaporation rates of small water drops placed on a solid surface. J Phys Chem 1989, 93, 3702.
| A study of the evaporation rates of small water drops placed on a solid surface.Crossref | GoogleScholarGoogle Scholar |
[32] SM Rowan, MI Newton, G Mchale, Evaporation of microdroplets and the wetting of solid surfaces. J Phys Chem 1995, 99, 13268.
| Evaporation of microdroplets and the wetting of solid surfaces.Crossref | GoogleScholarGoogle Scholar |
[33] D Zang, S Tarafdar, YY Tarasevich, MD Choudhury, T Dutta, Evaporation of a droplet: from physics to applications. Phys Rep 2019, 804, 1.
| Evaporation of a droplet: from physics to applications.Crossref | GoogleScholarGoogle Scholar |
[34] HY Erbil, Control of stain geometry by drop evaporation of surfactant containing dispersions. Adv Colloid Interface Sci 2015, 222, 275.
| Control of stain geometry by drop evaporation of surfactant containing dispersions.Crossref | GoogleScholarGoogle Scholar | 25217332PubMed |
[35] S Semenov, A Trybala, RG Rubio, N Kovalchuk, V Starov, MG Velarde, Simultaneous spreading and evaporation: recent developments. Adv Colloid Interface Sci 2014, 206, 382.
| Simultaneous spreading and evaporation: recent developments.Crossref | GoogleScholarGoogle Scholar | 24075076PubMed |
[36] RD Deegan, O Bakajin, TF Dupont, G Huber, Capillary flow as the cause of ring stains from dried liquid drops. Nature 1997, 389, 827.
[37] RD Deegan, O Bakajin, TF Dupont, G Huber, SR Nagel, TA Witten, Contact line deposits in an evaporating drop. Phys Rev E 2000, 62, 756.
| Contact line deposits in an evaporating drop.Crossref | GoogleScholarGoogle Scholar |
[38] A Amini, GM Homsy, Evaporation of liquid droplets on solid substrates. II. Periodic substrates with moving contact lines. Physical Review Fluids 2017, 2, 043604.
| Evaporation of liquid droplets on solid substrates. II. Periodic substrates with moving contact lines.Crossref | GoogleScholarGoogle Scholar |
[39] HY Erbil, G Mchale, MI Newton, Drop evaporation on solid surfaces: constant contact angle mode. Langmuir 2002, 18, 2636.
| Drop evaporation on solid surfaces: constant contact angle mode.Crossref | GoogleScholarGoogle Scholar |
[40] Nikolayev VS. Evaporation effect on the contact angle and contact line dynamics. In: Morengo M, De Coninck J, editors. The surface wettability effect on phase change. Springer International Publishing; 2022. pp. 133–187.
[41] RK Singh, PD Hodgson, N Sen, S Das, Effect of surface roughness on hydrodynamic characteristics of an impinging droplet. Langmuir 2021, 37, 3038.
| Effect of surface roughness on hydrodynamic characteristics of an impinging droplet.Crossref | GoogleScholarGoogle Scholar | 33651946PubMed |
[42] K Lin, R Chen, L Zhang, W Shen, D Zang, Enhancing water evaporation by interfacial silica nanoparticles. Adv Mater Interfaces 2019, 6, 1900369.
| Enhancing water evaporation by interfacial silica nanoparticles.Crossref | GoogleScholarGoogle Scholar |
[43] F Heslot, AM Cazabat, P Levinson, N Fraysse, Experiments on wetting on the scale of nanometers: influence of the surface energy. Phys Rev Lett 1990, 65, 599.
| Experiments on wetting on the scale of nanometers: influence of the surface energy.Crossref | GoogleScholarGoogle Scholar | 10042964PubMed |


