Synthesis, Characterisation, Interaction with DNA, Cytotoxicity, and Apoptotic Studies of Ruthenium(ii) Polypyridyl Complexes
C. Shobha Devi A , Penumaka Nagababu B , V. Venkat Reddy A , V. Sateesh A , A. Srishailam A and S. Satyanarayana A CA Department of Chemistry, Osmania University, Hyderabad, 500007, India.
B Institute of Chemistry, Academia Sinica, Nankang, Taipei 115, Taiwan.
C Corresponding author. Email: ssnsirasani@gmail.com
Australian Journal of Chemistry 67(2) 225-233 https://doi.org/10.1071/CH13321
Submitted: 9 April 2013 Accepted: 11 September 2013 Published: 2 October 2013
Abstract
We report the synthesis and characterisation of two new ruthenium(ii) polypyridyl complexes containing monodentate ancillary ligands [Ru(L)4(4HEPIP)], where L = 4-aminopyridine (1) or pyridine (2) and 4HEPIP = 2-(4-hydroxy-3-ethoxyphenyl)-1H-imidazo[4,5-f][1,10](phenanthroline). These complexes were characterised by elemental analysis and ultraviolet-visible, infrared, and 1H NMR spectroscopy. The binding properties of the two complexes towards calf thymus (CT)-DNA were investigated with different spectrophotometric methods, viscosity measurements, and salt dependent studies. Experimental results indicated that the complexes interact with CT-DNA base pairs by intercalation. Upon irradiation at 365 nm, these complexes efficiently cleave pBR322 DNA from super coiled form I to nicked form II. Their cytotoxicity on different cancer cell lines such as A549, Du145, and HeLa was investigated. The IC50 values are 39.5, 28.3, and 27.3 μM for complex 1, and 55, 67.9, and 47.9 μM for complex 2 respectively. Cellular uptake and apoptosis induced by these complexes was also studied.
Introduction
Ruthenium(ii) polypyridyl complexes have vast applications due to their photochemical, photophysical, and DNA binding properties in anticancer drugs, photocleavage agents, DNA structure probes,[1–3] molecular light switches,[4] and photodynamic therapy (PDT).[5] Complexes which have different binding capabilities with DNA can show changes in absorption and emission spectra.
Many important applications of these complexes require an intercalative mode of binding with DNA. Many octahedral ruthenium(ii) complexes have been proved to bind with DNA through an intercalative mode.[6–8] Octahedral complexes containing an intercalating ligand binds to DNA in three dimensions; however, its ancillary ligand can also be modified or functionalised to tune the DNA binding. Recently, the effects of some bidentate ancillary ligands such as bipyridine (bpy), 1,10-phenanthroline (phen), dimethyl bipyridine (dmb), and diphenyl bipyridine (dip) have been investigated by many research groups, including ours.[9–11] Studies on the biological activity of these complexes have been paid great attention.[12–14] However, there are only a few reports on ruthenium(ii) complexes with monodentate ancillary ligands.[15–18]
Chen et al. reported that many RuII polypyridyl complexes are less soluble in water due to their big hydrophobic ligands.[19] This limits their applications as good probes of biological systems or anticancer drugs. Varying the ancillary ligands such as monodentate ligands can change physicochemical properties, in particular in the DNA-binding behaviours as well as spectral properties of the resulting ruthenium complexes.
Previously, we have shown that RuII polypyridyl complexes with monodentate ancillary ligands can also bind to DNA by intercalation.[17,18] In order to investigate the DNA binding and biological activities of the complexes, herein we report the synthesis and characterisation of two new ruthenium polypyridyl complexes containing monodentate ancillary ligands: [Ru(L)4(4HEPIP)]2+ where L is 4-aminopyridine or pyridine and 4HEPIP is 2-(4-hydroxy-3-ethoxyphenyl)-1H-imidazo[4,5-f][1,10](phenanthroline). Their interactions with DNA were investigated by electronic absorption, emission-quenching studies, viscosity measurements, and salt dependent studies. Effects of light switching on and off were also studied. These complexes can intercalate into DNA base pairs and cleave pBR322 DNA upon irradiation. We have also tested their anticancer activity, cellular uptake, and apoptosis inducing activities.
Experimental Section
Materials and General Methods
All reagents and solvents were of analytical grade and were used as received unless otherwise noted. Ruthenium(iii) chloride trihydrate (RuCl3·3H2O), 1,10-phenanthroline monohydrate, pyridine, and 4-aminopyridine were purchased from Merck. CT-DNA (calf thymus DNA) was purchased from Aldrich, supercoiled pBR322 plasmid DNA (stored at –20°C) and agarose were obtained from Genei. 3-(4,5-Dimethylthiazole)-2,5-diphenyltetraazolium bromide (MTT), 4´,6-diamidino-2-phenylindole dihydro chloride (DAPI, nuclear stain), and cisplatin (Sigma–Aldrich) were used as received. Ultra-pure Milli-Q water (18.2 mΩ) was used in all experiments. Double distilled water was used for preparing various buffers. DMSO was obtained from Sigma Ltd. Various cell lines used for in vitro cytotoxicity were procured from American Type Culture Collection (Manassas, VA, USA). RPMI-1640 or DMEM cell culture media, supplemented with 10 % (v/v) fetal bovine serum (FBS), 2 mM glutamine, 4.5 g L–1 glucose, and 1 × non-essential amino acids and antibiotics, were obtained from Sigma–Aldrich.
Physical Measurements
UV-Visible (UV-Vis) spectra were recorded with an Elico SL159 spectrophotometer. Infrared (IR) spectra were recorded on KBr disks on a Perkin-Elmer FT-IR 1605 spectrometer. 1H NMR spectra were recorded on a Bruker spectrometer with [D6]DMSO as solvent and tetramethylsilane as an internal standard at 400 MHz at room temperature. Microanalyses (C, H, N) were carried out with a Perkin-Elmer 240 elemental analyser. Fluorescence measurements were performed on a Hitachi F-2500 spectrofluorimeter. Viscosity experiments were carried out on an Ostwald viscometer immersed in a water bath maintained at 30 ± 0.1°C. Gels were photographed in a Gel doc system (Alpha InfoTech Corporation). A Bright Line haemocytometer (Sigma Ltd), 96-well plates (Orange Scientific), and a Multi Skan EX Elisa reader (Thermo Scientific) were used for the MTT assay. A flow cytometer (Guava Easycyte 8HT, Millipore) was used to study cellular uptake and apoptotic inducing activities. Confocal imaging was done with a LeicaTCSSP5 confocal microscope (Leica Microsystems, Wetzlar, Germany) which was equipped with an Ar-Kr laser (used to excite ruthenium(ii) complexes at 488 nm excitation, 600–620 nm emission).
Synthesis and Characterisation of Ligand and Complexes
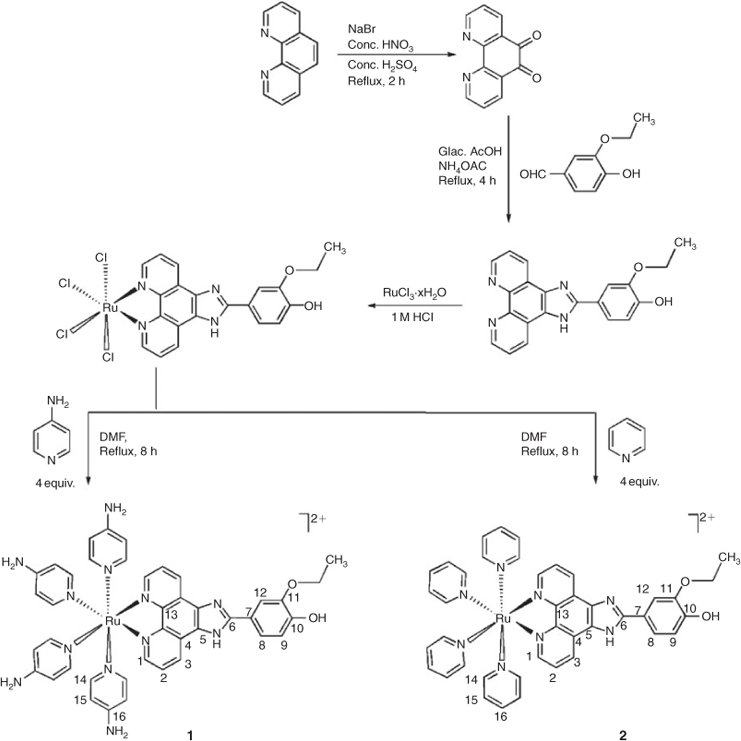
1,10-Phenanthroline-5,6-dione,[20] 4HEPIP,[21] and [Ru(L)4Cl2][22] were synthesised according to literature procedures. The synthetic route for ligand 4HEPIP and complexes 1 and 2 are given in Fig. 1.
Synthesis of [Ru(4HEPIP)Cl4]
The complex was synthesised by mixing RuCl3·3H2O (0.53 g, 2 mmol) and 4HEPIP (0.89 g, 2.5 mmol) in 1 M HCl (50 mL). The resulting mixture was stirred for ~30 min under nitrogen, and then allowed to lay under a nitrogen atmosphere for 10 days. The insoluble product [Ru(4HEPIP)Cl4] (65 % yield) was collected by vacuum filtration and washed with water, acetone, and diethyl ether and then dried under vacuum.
Synthesis of [Ru(4-aminopyridine)44HEPIP](ClO4)2·2H2O (1)
This complex was synthesised by mixing [Ru(4HEPIP)Cl4] (0.3 g, 0.5 mmol) and 4-aminopyridine (0.2 g, 2.0 mmol) in DMF (20 mL). The resulting mixture was heated at reflux under nitrogen atmosphere for 8 h. After cooling to room temperature, the solution was filtered to remove small amounts of insoluble components. The filtrate was reduced to 5 mL and then diluted with 15 mL water. Upon dropwise addition of a saturated solution of aqueous sodium perchlorate, a red precipitate formed. The red solid was collected and washed with 2 mL of ice cooled ethanol before being dried under vacuum and purified by column chromatography on alumina using acetonitrile/toluene (3/1) as eluent (72 % yield). (Found: C 45.90, H 4.24, N 15.65. Anal. Calc. for C41H44Cl2N12O12Ru: C 45.98, H 4.29, N 15.70 %). νmax(KBr)/cm–1 3445 br (ν, N–H), 1654 (ν, C=N), 1540 (ν, C=C), 550 (Ru–N). δH ([D6]DMSO) 1.41 (t, J = 7.5, 3H, CH3), 4.23 (q, J = 7.9, 2H, -OCH2), 6.61 (s, 1H, OH), 6.75 (t, J = 6.8, 2H, H2), 7.1 (t, J = 7.6, 8H, H15), 7.31 (s, 1H, H12), 7.42 (d, J = 6.5, 1H, H8), 7.5 (d, J = 7.5, 1H, H9), 7.75 (d, J = 7.5, 2H, H3), 7.8 (d, J = 7.7, 8H, H14), 7.97 (d, J = 7.8, 2H, H1), 8.95 (s, 8H, NH2).
Synthesis of [Ru(pyridine)44HEPIP](ClO4)2·2H2O (2)
This complex was synthesised by mixing [Ru(4HEPIP)Cl4] (0.30 g, 0.5 mmol) and pyridine (0.02 mL, 2.0 mmol) in DMF (20 mL). The resulting mixture was heated at reflux under nitrogen atmosphere for 8 h. After cooling to room temperature, the solution was filtered to remove small amounts of insoluble components. The filtrate was reduced to 5 mL and then diluted with 15 mL water. Upon drop wise addition of a saturated aqueous solution of sodium perchlorate, a red precipitate formed. The red solid was collected and washed with 2 mL of ice cooled ethanol before being dried under vacuum and purified by column chromatography on alumina using acetonitrile/toluene (3/1) as eluent (70 % yield). (Found: C 49.10, H 3.52, N 11.05. Anal. Calc. for C41H40Cl2N8O12Ru: C 49.00, H 3.50, N 11.15 %). νmax(KBr)/cm–1 3328 br (ν, O–H, N–H), 1615 (ν, C=N), 1511, 1536 (ν, C=C), 532 (Ru–N). δH ([D6]DMSO) 1.45 (t, J = 7.4, 3H, CH3), 4.2 (q, J = 7.7, 2H, -OCH2), 6.68 (s, 1H, OH), 6.71 (t, J = 6.7, 2H, H2), 6.93 (t, J = 6.9, 8H, H15), 7.21 (s, 1H, H12), 7.33 (t, J = 7.5, 4H, H16), 7.4 (d, J = 7.6, 1H, H8), 7.5 (d, J = 7.5, 1H, H9), 7.55 (d, J = 7.8, 2H, H3), 7.77 (t, J = 7.8, 2H, H1), 7.8 (d, J = 7.6, 8H, H14).
DNA Binding Assays
The DNA-binding experiments were performed at room temperature. Buffer (5 mM Tris, 50 mM NaCl, pH = 7.0; Tris = tris(hydroxymethyl)aminomethane) was used for absorption and luminescence titrations and BPE-buffer (6 mM Na2HPO4, 2 mM NaH2PO4, 1 mM Na2EDTA, pH = 7; EDTA = ethylenediaminetetraacetate) was used in viscosity measurements. The UV absorbance of the CT-DNA at 260 and 280 nm in Tris-buffer had a ratio of about ~1.9 : 1 indicating that the DNA was sufficiently free of protein.[23] Concentration of CT-DNA was determined by UV absorbance at 260 nm; extinction coefficient was 6600 M–1 cm–1.[24] Stock solutions were stored at 4°C and used within five days.
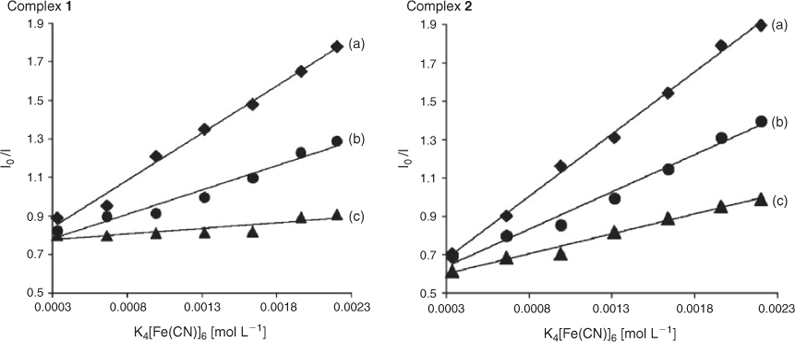
Fluorescence titrations were performed at room temperature to determine binding affinity between DNA and the complex. The titration experiments were performed at a fixed ruthenium concentration of 10 µM, to which increments of CT-DNA solution was added until no emission was detected. Steady-state emission quenching experiments using varying amounts of [Fe(CN)6]4– as the quencher were performed in absence, presence, and excess of DNA. [Fe(CN)6]4– was varied from 0–5 µM. The quenching constant was determined according to the classical Stern–Volmer equation: [25]

where I0 and I are the luminescence intensities in the absence and presence of quencher [Fe(CN)6]4– respectively, Ksv is a linear Stern–Volmer quenching constant depending on the ratio of the bound concentration of the complex to the concentration of DNA, and [Q] is the concentration of the quencher [Fe(CN)6]4–. In the plot of I0/I versus [Q], the linear Stern–Volmer quenching constant Ksv is given by the slope.
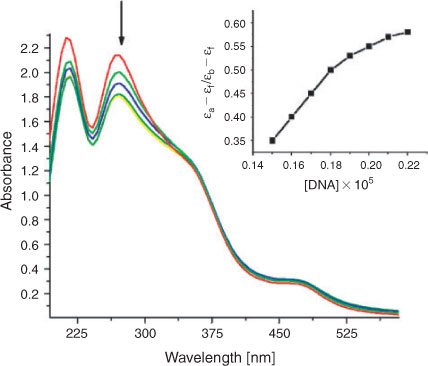
Absorption titrations were performed in Tris buffer using a fixed complex concentration (20 µM) to which increments of the DNA stock solution was added. Solutions were allowed to incubate for 5 min before the absorption spectra were recorded. The intrinsic binding constant Kb of these complexes to DNA were calculated by a non-linear least-square method using Eqn 1:[26]


where [DNA] is the concentration of DNA, ϵa is the extinction coefficient observed for the absorption band at given DNA concentration, ϵf is the extinction coefficient of the free complex without DNA, ϵb is the extinction coefficient of the complex fully bound to DNA. K is the equilibrium binding constant in M–1, Ct is the total metal concentration and s is the binding site size. In plots of (ϵa–ϵf)/(ϵb–ϵf) versus [DNA], Kb is given by the ratio of the slope to the intercept.
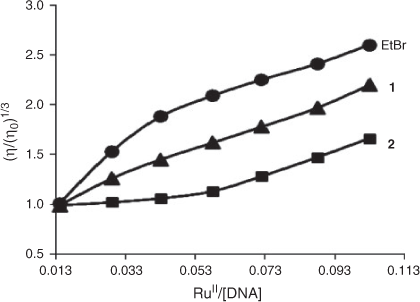
Viscosity measurements of complexes were carried out in BPE-buffer (water bath maintained at 30 ± 0.1°C). Flow time was measured with a digital stopwatch and every sample was tested three times to get an average calculated time. The data are presented as (η/η0)1/3 vs the concentration of [RuII]/[DNA], where η and η0 are the viscosities of DNA in the presence and absence of complex.
For the gel electrophoresis experiment, supercoiled pBR 322 DNA (0.1 µg) was treated with the RuII complexes in TAE-buffer (pH 8.0; 40 mM Tris, 20 mM acetic acid, 1 mM EDTA), and the solution was then irradiated at room temperature with a UV lamp (365 nm, 10 W). The samples were analysed by electrophoresis for 1.5 h at 60 V on a 0.8 % agarose gel in TAE-buffer. The gel was stained with 1 µg mL–1 ethidium bromide.
Cell Culture and Cytotoxicity Assay
Standard MTT assay procedures were used,[27] to study the effect of complexes on cell growth. A549, Du145, and HeLa cell lines growing exponentially were added to 96–well plates at a density of 3 × 10³ per well. After incubation for 24 h cells were exposed to the tested compounds of serial dilutions. The compounds were dissolved in dimethyl sulfoxide and diluted with RPMI-1640 or DMEM to the required concentrations before use. Growth inhibition assays were carried out over a 48 h continuous exposure period. MTT was added to each well to yield a working concentration of 0.4 mg mL–1 and the plates were kept in an incubator for 2 h. After this time the medium was aspirated, 200 μL of DMSO was added to each well, and the wells were agitated gently for 5 min before measuring the absorbance at 620 nm. The IC50 values were determined by plotting the percentage viability versus concentration on a logarithmic graph and reading off the concentration at which 50 % of cells remain viable relative to the control.
Cellular Uptake and Apoptosis
HeLa cells in growth medium were seeded in 35 mm tissue culture dishes (Corning) and incubated at 37°C under a 5 % CO2 atmosphere until 70 % confluency. The culture medium was removed and replaced with fresh medium containing the ruthenium(ii) complexes at 10 µM (final DMSO concentration, 1 % v/v). After incubation for 1 h, the cell layer was trypsinised and washed twice with cold phosphate buffered saline (PBS). The samples were rinsed in 500 µL of cold PBS and analysed by a flow cytometer immediately. The samples were collected in FL2 channel (excitation at 488 nm and emission at 585–620 nm). For confocal imaging, HeLa cells were cultured on coverslips (Corning, 22 × 50 mm), until they reached 70 % confluency. The cells were incubated with complexes at 50 µM concentration for 2 h, washed with PBS, and then photographed with a confocal microscope. Confocal microscopy imaging was carried out on one set without any staining and one set was stained with DAPI 0.1 mg mL–1 to identify localisation of the complexes.
Results and Discussion
Synthesis and Characterisation
The ligand 4HEPIP was prepared by the condensation of 1,10-phenanthroline-5,6-dione with 4-hydroxy-3-ethoxybenzaldehyde and ammonium acetate in glacial acetic acid in 73 % yield. The corresponding ruthenium(ii) complexes were synthesised by a direct reaction of [Ru(4HEPIP)Cl4] with the appropriate precursor ligands and the desired complexes 1 and 2 (Fig. 1.) were synthesised as their perchlorate salts in 72 % yield after purification by column chromatography. Spectral characterisation of these complexes is given in the Experimental Section.
Fluorescence Studies
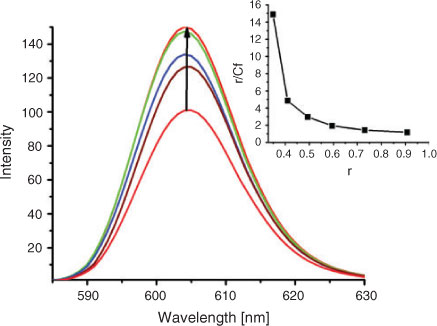
In the absence of DNA, both complexes 1 and 2 can emit luminescence in Tris buffer at ambient temperature, with maxima appearing at 604 and 605 nm, respectively. The results of the emission titrations for complex 2 in the absence and presence of increasing concentration of DNA is illustrated in Fig. 2 (given in Fig. S1 for complex 1). The enhancement of emission intensity is an indication of binding of the complexes to the hydrophobic pocket of DNA, and complexes can be protected efficiently by the hydrophobic environment inside the DNA helix. We have also calculated the binding constants of the two complexes interacting with DNA from the emission spectra using the modified Scatchard equation.[28] The binding data obtained from the emission spectra were fitted using a plot of r/Cf vs r, where r is the Cb/[DNA] and Cf is the concentration of the free complex. The intrinsic binding constants K 5.91 ± 0.3 × 10⁴ M–1 for complex 1 and 5.02 ± 0.25 × 10⁴ M–1 for complex 2 were determined. Comparing these binding constants we can see that complex 1 binds to DNA more avidly than complex 2.
|
Steady-state emission quenching experiments using K4[Fe(CN)6] as quencher may provide further information about complexes binding to DNA, but cannot determine the mode of binding. We performed these experiments at ambient temperature, using a similar method as that described by Satyanarayana et al.[29] As illustrated in Fig. 3, in the absence of CT-DNA complex was efficiently quenched by [Fe(CN)6]4–, resulting in a linear Stern–Volmer plot. However, in the presence and excess of CT-DNA, it is difficult to be quenched, which may be explained by the fact that the bound cation of RuII is protected from the anionic water-bound quencher by the array of negative charges along the DNA phosphate backbone.[30]
|
Electronic Absorption Spectra Studies
Electronic absorption spectroscopy serves as the most common means to study the interactions between metal complexes and DNA.[31,32] A complex binding to DNA through intercalation usually results in hypochromism and bathochromism, due to the intercalation mode involving a strong stacking interaction between an aromatic chromophore and the base pairs of DNA. Absorption spectra of complex 1 in presence and absence of DNA is shown in Fig. 4 (given in Fig. S2 for complex 2). The hypochromism (H%) of the metal-to-ligand charge transfer (MLCT) bands in complexes 1 and 2, defined as H% = 100 × (Afree–Abound)/Afree, where A = absorption, was determined to be about 8.7 ± 0.05 and 7.5 ± 0.05 %, respectively. In order to compare the DNA-binding affinities of the two complexes quantitatively, their intrinsic binding constants Kb were obtained by monitoring the changes to intra ligand (IL) bands at 272, 279 nm for both complexes respectively.
|
The calculated binding constants Kb are 5.81 ± 0.15 × 10⁴ and 5.01 ± 0.22 × 10⁴, for complex 1 and 2, revealing greater DNA-binding affinity of complex 1 compared with 2. Since the two complexes have the same intercalating ligand, the difference comes mostly from the ancillary ligands, where amino groups in complex 1 are favourable to form H-bonding interactions with the DNA. The two complexes in the current study were found to have smaller Kb values than the reported complexes [Ru(L)4PIP]2+ ([Ru(4-APy)4(PIP)]2+ Kb = 7.23 × 10⁴ M–1, [Ru(Py)4PIP]2+ = 6.5 × 10⁴ M–1, where 4-APy = 4-aminopyridine, Py = pyridine, and PIP = 2-phenyl,1H-imidazo[4,5-f][1,10](phenanthroline)),[18] since the intercalator for complexes 1 and 2 is (4HEPIP), which has additional groups such as hydroxyl and ethoxy which may exert some steric hindrance. These steric clashes then prevent the complexes from intercalating effectively and thus cause a decrease of the intrinsic binding constants. Hydroxyl and ethoxy are electron donor groups; this makes the intercalating ligand more electron dense, hence interaction between DNA and the complex decreases. These results are in good agreement with the reported analogous ruthenium complexes.[33] The results obtained from absorption spectra are comparable to those obtained from emission binding constants: both sets of binding constants show that complex 1 binds to DNA more avidly than complex 2.
Salt Dependent Studies
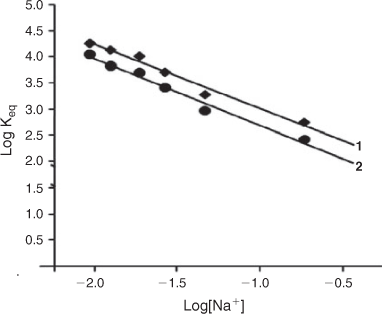
The clear dependence of the binding constants for these complexes upon Na+ binding to DNA may be analysed by Record's polyelectrolyte theory.[34] From this theory, the slope of the lines in Fig. 5 provide an estimate of Zψ, where Z is the charge on the complex and ψ is the fraction of counter ions[35] associated with each DNA phosphate (ψ = 0.88 for double-stranded B-form DNA). The data in Fig. 5 show that the slopes of the lines are greater than 1, being 1.41 and 1.36 for complexes 1 and 2 respectively. These values are less than the theoretically expected value of Zψ = 2 × 0.88 = 1.76. Lower values could arise from coupled anion release (from the ligand) or from changes in ligand or DNA hydration upon binding. By increasing the Na+ concentrations,[35] the relative binding affinities of the complexes decreased similar to that of proven intercalators like ethidium bromide.[29]
|
Viscosity Measurements
Though photophysical studies are quite useful in determining binding constants of metal complexes to DNA,[29,36] to further elucidate the binding mode of the present complexes, viscosity measurements were carried out. A classical intercalation model demands that the DNA helix lengthens as base pairs are separated to accommodate the binding ligand, hence this leads to an increase in the viscosity of DNA.[37] Ethidium bromide, a well known DNA intercalator, increases the relative viscosity strongly by lengthening the DNA double helix through intercalation. Similarly, upon increase in the amounts of complexes 1 and 2, the relative viscosity of DNA increases steadily. The increased degree of viscosity, which may depend on the binding affinity to DNA, follows the order EB >1 >2 (Fig. 6). These results also suggest that both complexes intercalate between the base pairs of DNA and parallel the results obtained by absorption, fluorescence, and quenching measurements. Based on the binding data and the viscosity experiment we conclude that these complexes bind to DNA by intercalation, but they do not intercalate as strongly as proven intercalators like ethidium bromide,[29] or analogous RuII complexes containing bidentate polycyclic heteroaromatic ligands.[9–11]
|
DNA Photocleavage
The potential of the present complexes to cleave plasmid DNA was studied by gel-electrophoresis using super coiled pBR322 DNA. No DNA cleavage was observed for control (unirradiated DNA) in which the complexes were absent (Fig. 7, lane 0). Gel electrophoresis separation of pBR322 DNA was undertaken after incubation with with complexes and irradiation at 365 nm; super coiled form (form I) was cleaved, generating the electrophoretically slower-moving open circular form (form II). With increasing concentrations of the complexes (Fig. 7, lanes a-c and e-g), the amount of Form I DNA diminished gradually, whereas form II increased. Further, a second unirradiated control solution confirmed that the complexes did cause photosensitised cleavage: in the presence of the singlet oxygen (1O2) scavenger histidine (lanes d and h), the activity of both the complexes decreases, indicating that singlet oxygen is likely to be the reactive species responsible for the cleavage reaction. Similar results were observed for other ruthenium(ii) polypyridyl complexes.[11,38]

|
Cytotoxicity Assay
The potential antiproliferative effects of complexes 1 and 2 on the viability of tumour cell lines (A549, Du145, and HeLa) were assessed by the MTT assay. Cisplatin was used as a positive control. The concentrations which showed 50 % (IC50) inhibition of the cell viability were calculated and the results showed that IC50 values are 39.5, 28.3, and 27.3 μM for 1, and 55, 67.9, and 47.9 μM for 2, respectively. It is clear that the selected tumour cells are more sensitive to complex 1 than complex 2; however these complexes exhibit relatively lower in vitro cytotoxicity than cisplatin (12.3, 6.5, and 19.2 respectively). The cytotoxicity of 1 and 2 was found to be concentration dependent, as cell viability decreased with increasing concentration of the complexes. The IC50 values obtained for both 1 and 2 are in good agreement with the reported ruthenium(ii) polypyridyl complexes.[11,14]
Cellular Uptake
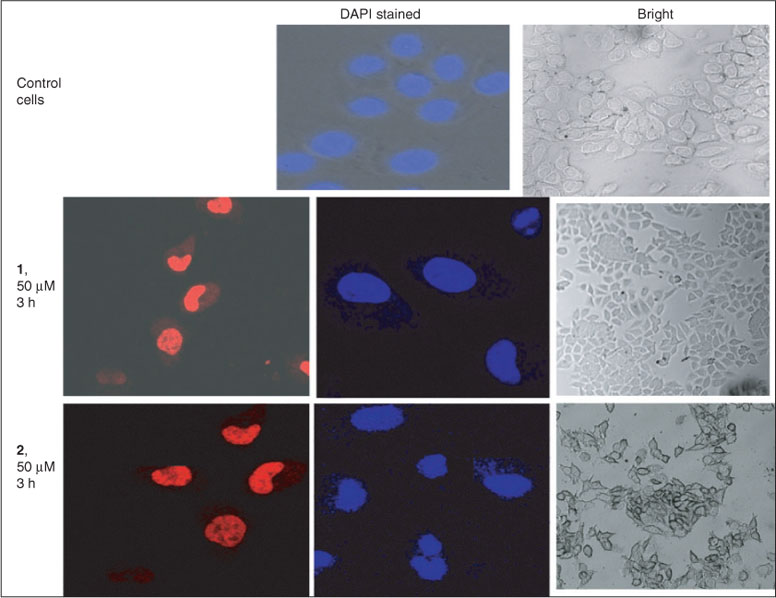
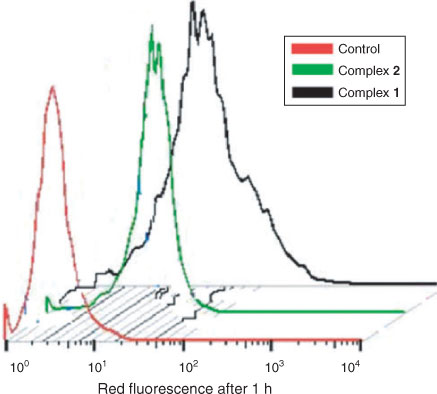
The cellular uptake potential of both complexes was studied in HeLa cells using flow cytometry and confocal microscopy.[39–41] The uptake profile of complexes 1 and 2 in HeLa cells incubated with 10 µM solutions of the complexes for 2 h is shown in Fig. 8. The Median-red fluorescence intensity (MFI) values for complexes 1, 2, and untreated cells (control) were 19.5, 10.11, and 1.1, respectively. These results clearly demonstrate that both complexes have efficient cellular uptake properties, with complex 1 having better uptake than complex 2. The cellular distribution was studied by confocal microscopy. Complexes 1 and 2 (50 μM) gradually penetrated into the interior of the nucleus and shown diffuse cytoplasm and nuclear fluorescence after 2 h of incubation with HeLa cells. Control cells exhibit homogeneous nuclear staining, and treated cells display typical changes such as fragmented nuclei or shrinkage indicating DNA cleavage. Confocal images of the control (cells treated with vehicle 1 % DMSO) and treated with complex (their fluorescent and DAPI stained) are given in Fig. 9. The results show that both the complexes can be uptaken by HeLa cells, and they enter into the cytoplasm and accumulate in the nuclei.
|
Apoptosis Study
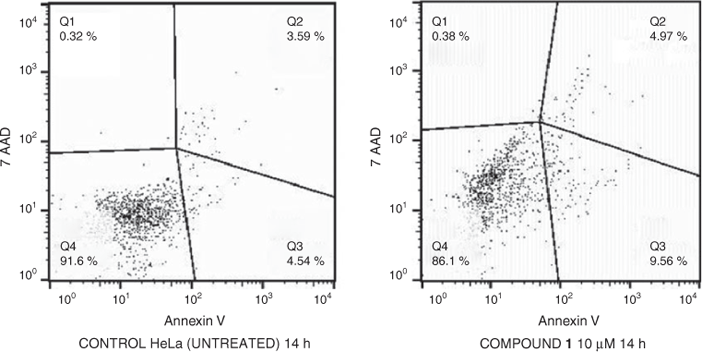
In order to gain some insight into the cell death type induced by complex 1, the apoptosis assays were performed on HeLa cells with Nexin guava reagent. In the early stages of apoptosis, the cell membrane can expose phosphatidylserine which is annexin V-positive.[42] Cells sensing an inflicted aggression by a chemical compound undergo two major forms of death, necrosis or apoptosis, and each with very distinct characteristics. Cell types such as viable cells, early apoptotic cells, and late apoptotic cells[43] can be distinguished in this apoptosis study using flow cytometry. The HeLa cells were incubated with a 10 µM solution of 1 for 14 h, followed by staining with Nexin reagent (Annexin V and 7-AAD) and data acquisition with a flow cytometer. The percentage of apoptotic cells and changes in DNA content distribution in HeLa cells treated by complex 1 were detected by analysing with Nexin 7-AAD, and Annexin V binding with the help of flow cytometry and Express Pro, FlowJo softwares. The results are depicted in Fig. 10. The results indicate that the control cells show 3.59 % of late apoptotic cells, whereas the number of apoptotic cells (Q2) increased for complex 1 to 4.93 %. The number of early apoptotic cell (Q3) also increased in cells treated with the complex. These results suggest that the complex induces apoptosis in HeLa cells, but this activity is only moderate when compared to analogous ruthenium(ii) polypyridyl complexes.[11,14,33]
Conclusions
Two new ruthenium(ii) polypyridyl complexes have been synthesised and characterised by spectroscopic techniques. The DNA binding ability of these complexes was studied in detail by emission, absorption, viscosity, and salt dependent studies. The results suggest that they can bind to DNA in an intercalative mode. Complex 1 has a good intrinsic binding constant, indicating that the binding ability of complex 1 is more than that of 2. Both complexes showed efficient photocleavage with plasmid DNA when irradiated at 365 nm. Antiproliferative and cellular uptake studies revealed that both complexes show better cytotoxicity and uptake properties. Both complexes enter the cytoplasm and accumulate in the nuclei, and both complexes can induce apoptosis of HeLa cells. This class of metal complexes are cancer therapeutic molecules that interfere with DNA replication where intercalation is the preferred binding mode.
Supplementary Material
Emission spectra of complex 1 and electronic absorption spectra of complex 2 are available on the Journal’s website.
References
[1] K. E. Erkkila, D. T. Odom, J. K. Barton, Chem. Rev. 1999, 99, 2777.| Crossref | GoogleScholarGoogle Scholar | 1:CAS:528:DyaK1MXksl2ls7w%3D&md5=18b3bd2a38c82f7aad7260a650e24f2bCAS | 11749500PubMed |
[2] C. Metcalfe, J. A. Thomas, Chem. Soc. Rev. 2003, 32, 215.
| Crossref | GoogleScholarGoogle Scholar | 1:CAS:528:DC%2BD3sXkt1emt7g%3D&md5=7687db1e6636743629cd075761d99948CAS | 12875027PubMed |
[3] Y. Xiong, L. N. Ji, Coord. Chem. Rev. 1999, 185–186, 711.
| Crossref | GoogleScholarGoogle Scholar |
[4] A. E. Friedman, J. C. Chambron, J. P. Sauvage, N. J. Turro, J. K. Barton, J. Am. Chem. Soc. 1990, 112, 4960.
| Crossref | GoogleScholarGoogle Scholar | 1:CAS:528:DyaK3cXktVarsr4%3D&md5=60c276e4cdae678d4e2b3e8b2fba2660CAS |
[5] S. Rani-Beeram, K. Meyer, A. McCrate, Y. Hong, M. Nielsen, S. Swavey, Inorg. Chem. 2008, 47, 11278.
| Crossref | GoogleScholarGoogle Scholar | 1:CAS:528:DC%2BD1cXhtlaiu73J&md5=8fb0a77db5ede39d6f60ff666bc2f6aeCAS | 18980373PubMed |
[6] V. Pierroz, T. Joshi, A. Leonidova, C. Mari, J. Schur, I. Ott, L. Spiccia, S. Ferrari, G. Gasser, J. Am. Chem. Soc. 2012, 134, 20376.
| Crossref | GoogleScholarGoogle Scholar | 1:CAS:528:DC%2BC38XhslCgsLjJ&md5=bfc27763de29477f2836ae953e901552CAS | 23181418PubMed |
[7] H. L. Huang, Z. Z. Li, Z. H. Liang, Y. J. Liu, Eur. J. Inorg. Chem. 2011, 5538.
| Crossref | GoogleScholarGoogle Scholar | 1:CAS:528:DC%2BC3MXhsVGntrnK&md5=3c3759f8e4fbf9d12065d094158a5cfdCAS |
[8] X.-W. Liu, L. Li, J.-L. Lu, Y.-D. Chen, D.-S. Zhang, J. Coord. Chem. 2011, 64, 4344.
| Crossref | GoogleScholarGoogle Scholar | 1:CAS:528:DC%2BC38XpsFKjtg%3D%3D&md5=f3ce2a26189fb22d7a8c43256fb56b8cCAS |
[9] P. Nagababu, M. Shilpa, J. N. L. Latha, I. Bhatnagar, P. N. B. S. Srinivas, Y. P. Kumar, K. L. Reddy, S. Satyanarayana, J. Fluoresc. 2011, 21, 563.
| Crossref | GoogleScholarGoogle Scholar | 1:CAS:528:DC%2BC3MXmslGlsb8%3D&md5=0d85f6ede3f72d2bdeaf58e2e98c6279CAS | 20931268PubMed |
[10] M. Shilpa, C. Shobha Devi, P. Nagababu, J. N. L. Latha, P. Ramjee, S. Aravind, S. Satyanarayana, J. Coord. Chem. 2013, 66, 1661.
| Crossref | GoogleScholarGoogle Scholar | 1:CAS:528:DC%2BC3sXksF2qs7k%3D&md5=4e9dedad17c79fdcd634c23dd5ef776aCAS |
[11] C. Shobha Devi, D. Anil Kumar, S. S. Singh, N. Nazar Gabra, Deepika, Y. P. Kumar, S. Satyanarayana, Eur. J. Med. Chem. 2013, 64, 410.
| Crossref | GoogleScholarGoogle Scholar | 1:CAS:528:DC%2BC3sXptFOitrk%3D&md5=92b79a9358f1ed383ceb172e70749aa1CAS | 23665797PubMed |
[12] L. Tan, L. Xie, X. Sun, L. Zeng, G. Yang, J. Inorg. Biochem. 2013, 120, 32.
| Crossref | GoogleScholarGoogle Scholar | 1:CAS:528:DC%2BC3sXhs1Cnt7k%3D&md5=e52820b701c961713fe8f79e245b7c93CAS | 23268790PubMed |
[13] L. Tan, J. Shen, J. Liu, L. Zeng, L. Jin, C. Weng, Dalton Trans. 2012, 41, 4575.
| Crossref | GoogleScholarGoogle Scholar | 1:CAS:528:DC%2BC38XktFert78%3D&md5=59b07b1536282dc1141f982fd999d80dCAS | 22358386PubMed |
[14] H.-J. Yu, Y. Chen, L. Yu, Z.-F. Hao, L.-H. Zhou, Eur. J. Med. Chem. 2012, 55, 146.
| Crossref | GoogleScholarGoogle Scholar | 22841281PubMed |
[15] X. Yang, Y. Liu, S. Yao, Y. Xia, Q. Li, W. Zheng, L. Chen, J. Liu, J. Coord. Chem. 2011, 64, 1491.
| Crossref | GoogleScholarGoogle Scholar | 1:CAS:528:DC%2BC3MXkvF2gsb0%3D&md5=501091ae430166a8028f98962ac6301cCAS |
[16] L. M. Chen, J. Liu, J. C. Chen, S. Shi, T. Cai-Ping, K. C. Zheng, L. N. Ji, J. Mol. Struct. 2008, 881, 156.
| Crossref | GoogleScholarGoogle Scholar | 1:CAS:528:DC%2BD1cXmtVKks78%3D&md5=f1458036658e133881abeb1d912b7ba9CAS |
[17] C. Shobha Devi, S. Satyanarayana, J. Coord. Chem. 2012, 65, 474.
| Crossref | GoogleScholarGoogle Scholar |
[18] C. Shobha Devi, P. Nagababu, M. Shilpa, Y. P. Kumar, M. R. Rajender, M. G. Nazar, S. Satyanarayana, J. Iran. Chem. Soc. 2012, 9, 671.
| Crossref | GoogleScholarGoogle Scholar | 1:CAS:528:DC%2BC38Xhs1Wju7zJ&md5=6dd61aafc11a055001d12ff3eb83d8faCAS |
[19] L. M. Chen, J. Liu, J. C. Chen, C. P. Tan, S. Shi, K. C. Zheng, L. N. Ji, J. Inorg. Biochem. 2008, 102, 330.
| Crossref | GoogleScholarGoogle Scholar | 1:CAS:528:DC%2BD1cXoslCjsg%3D%3D&md5=e4328a418883dbfdd22ff2d9299b0211CAS | 17981336PubMed |
[20] M. Yamada, Y. Tanaka, Y. Yoshimoto, S. Kuroda Shimao, J. Bull. Chem. Soc. Jpn. 1992, 65, 1006.
| Crossref | GoogleScholarGoogle Scholar | 1:CAS:528:DyaK38XktVOru7s%3D&md5=d937a72895eed9ed34b516b3d7a1372cCAS |
[21] E. A. Steck, A. R. Day, J. Am. Chem. Soc. 1943, 65, 452.
| Crossref | GoogleScholarGoogle Scholar | 1:CAS:528:DyaH3sXhsVGisg%3D%3D&md5=707260f85cc550ae19a653b6e26b4674CAS |
[22] B. P. Sullivan, D. J. Salmon, T. Meyer, Inorg. Chem. 1978, 17, 3334.
| Crossref | GoogleScholarGoogle Scholar | 1:CAS:528:DyaE1cXmtVyhtbw%3D&md5=657d4669f461b9f639416e1af476aa3dCAS |
[23] J. Marmur, J. Mol. Biol. 1961, 3, 208.
| Crossref | GoogleScholarGoogle Scholar | 1:CAS:528:DyaF3MXosl2kuw%3D%3D&md5=0b1641b6b52762892b9e98f5f4da94a0CAS |
[24] M. E. Reichmann, S. A. Rice, C. A. Thomas, P. Doty, J. Am. Chem. Soc. 1954, 76, 3047.
| Crossref | GoogleScholarGoogle Scholar | 1:CAS:528:DyaG2cXmtVKmsg%3D%3D&md5=51517624e34ac257bdf5ffea04cf1ba6CAS |
[25] J. R. Lakowicz, G. Webber, Biochemistry 1973, 12, 4161.
| Crossref | GoogleScholarGoogle Scholar | 1:CAS:528:DyaE3sXlsVeks78%3D&md5=91e7550ed385d53270be414eab425d3bCAS | 4795686PubMed |
[26] M. T. Carter, M. Rodriguez, A. Bard, J. Am. Chem. Soc. 1989, 111, 8901.
| Crossref | GoogleScholarGoogle Scholar | 1:CAS:528:DyaL1MXmt1Shtrk%3D&md5=3b02b4ea30e09440c755e71af07f7811CAS |
[27] T. Mosmann, J. Immunol. Methods 1983, 65, 55.
| Crossref | GoogleScholarGoogle Scholar | 1:STN:280:DyaL2c%2FovFSmtw%3D%3D&md5=e00a9d1451a99504ee1e2667a623d683CAS | 6606682PubMed |
[28] J. D. McGhee, P. H. Von Hippel, J. Mol. Biol. 1974, 86, 469.
| Crossref | GoogleScholarGoogle Scholar | 1:CAS:528:DyaE2cXls1GitLY%3D&md5=44b93e57583fcb0923b2d302ca0a45efCAS | 4416620PubMed |
[29] S. Satyanarayana, J. C. Dabrowiak, J. B. Chaires, Biochemistry 1993, 32, 2573.
| Crossref | GoogleScholarGoogle Scholar | 1:CAS:528:DyaK3sXht1Sgu7c%3D&md5=08e58074646a99fe923ff520f7d8d9afCAS | 8448115PubMed |
[30] G. Cohen, H. Eisenberg, Biopolymers 1969, 8, 45.
| Crossref | GoogleScholarGoogle Scholar | 1:CAS:528:DyaF1MXltV2jtbY%3D&md5=01e7fab4bb60274507aa6c3db20a59d5CAS |
[31] M. Chen, H. Li, Q. Li, Z. Xu, Spectrochim. Acta A Mol. Biomol. Spectrosc. 2010, 75, 1566.
| Crossref | GoogleScholarGoogle Scholar | 20299277PubMed |
[32] J. K. Barton, A. T. Danishefsky, G. M. Goldberg, J. Am. Chem. Soc. 1984, 106, 2172.
| Crossref | GoogleScholarGoogle Scholar | 1:CAS:528:DyaL2cXhtlCntL0%3D&md5=bac8643ff18893aa34450e33c8bc51deCAS |
[33] H. L. Huang, Z. Z. Li, Z. H. Liang, J. H. Yao, Y. Liu, Eur. J. Med. Chem. 2011, 46, 3282.
| Crossref | GoogleScholarGoogle Scholar | 1:CAS:528:DC%2BC3MXnsVertbY%3D&md5=bdd1e7de4fdc4f2f1e51e70888950ebfCAS | 21570748PubMed |
[34] M. T. Record, C. F. Anderson, T. M. Lohman, Q. Rev. Biophys. 1978, 11, 103.
| Crossref | GoogleScholarGoogle Scholar | 1:CAS:528:DyaE1cXlsVWqtr4%3D&md5=20cbc1188deb0e7036c93a5bcd2efb22CAS | 353875PubMed |
[35] D. S. Sigman, A. Mazumder, D. M. Perrin, Chem. Rev. 1993, 93, 2295.
| Crossref | GoogleScholarGoogle Scholar | 1:CAS:528:DyaK3sXlvFyisrc%3D&md5=d0fdc5f04514c3078dec2b5975052373CAS |
[36] S. Satyanarayana, C. James, Dabrowiak, J. B. Chaires, Biochemistry 1992, 31, 9319.
| Crossref | GoogleScholarGoogle Scholar | 1:CAS:528:DyaK38Xls1Kjtbc%3D&md5=4d7d30159cd253ce3aa9d73ef9035059CAS | 1390718PubMed |
[37] C. V. Kumar, J. K. Barton, N. J. Turro, J. Am. Chem. Soc. 1985, 107, 5518.
| Crossref | GoogleScholarGoogle Scholar | 1:CAS:528:DyaL2MXltF2hsLw%3D&md5=80bab271848487c30ac2e8c98c0ff286CAS |
[38] J. L. Gan, Z. Z. Li, J. H. Yao, H. L. Huang, Y. Y. Xie, Y. Liu, Aust. J. Chem. 2013, 66, 555.
[39] K. K. Lo, T. K. Lee, J. S. Lau, W. L. Poon, S. H. Cheng, Inorg. Chem. 2008, 47, 200.
| Crossref | GoogleScholarGoogle Scholar | 1:CAS:528:DC%2BD2sXhsVSqsbvK&md5=cbd50bb071cec91f587a2a3917602166CAS | 18067284PubMed |
[40] C. A. Puckett, J. K. Barton, Biochemistry 2008, 47, 11711.
| Crossref | GoogleScholarGoogle Scholar | 1:CAS:528:DC%2BD1cXht1CltbvM&md5=74e9e70ea8f80f7500067b1df076da38CAS | 18855428PubMed |
[41] C. A. Puckett, J. K. Barton, J. Am. Chem. Soc. 2007, 129, 46.
| Crossref | GoogleScholarGoogle Scholar | 1:CAS:528:DC%2BD28XhtlansbnK&md5=7c9c1b0a65e791ec45c23bc651b627a1CAS | 17199281PubMed |
[42] C. Riccardi, I. Nicoletti, Nat. Protoc. 2006, 1, 1458.
| Crossref | GoogleScholarGoogle Scholar | 1:CAS:528:DC%2BD28Xht1eitL7K&md5=6363479963894d138f4c516e194b1425CAS | 17406435PubMed |
[43] I. Vermes, C. Haanen, H. Steffens-Nakken, C. Reutelingsperger, J. Immunol. Methods 1995, 184, 39.
| Crossref | GoogleScholarGoogle Scholar | 1:CAS:528:DyaK2MXnt1Ojsbo%3D&md5=5e03c65ff884635e5d268bbaa8f1c747CAS | 7622868PubMed |


