

Determining the distributions of plant communities in subantarctic vegetation using species distribution models
Nicholas B. Fitzgerald A * , Jamie B. Kirkpatrick A , Catherine R. Dickson B , Laura K. Williams C , Alexander J. Fergus D and Jennie Whinam A
A School of Geography and Spatial Sciences, University of Tasmania, Hobart, Tas. 7005, Australia.
B Tasmanian Land Conservancy, Hobart, Tas. 7005, Australia.
C Previously with School of Environmental and Rural Science, The University of New England, Armidale, NSW 2351, Australia.
D Manaaki Whenua–Landcare Research, Lincoln, 7640, New Zealand.
Australian Journal of Botany 70(4) 311-322 https://doi.org/10.1071/BT21124
Submitted: 11 October 2021 Accepted: 30 May 2022 Published: 8 July 2022
© 2022 The Author(s) (or their employer(s)). Published by CSIRO Publishing. This is an open access article distributed under the Creative Commons Attribution-NonCommercial 4.0 International License (CC BY-NC)
Abstract
Context: Mapping of vegetation is important in understanding its dynamics in relation to climate change and disturbance. We investigated using species distribution models to predict plant species assemblages in a subantarctic environment where traditional image interpretation methods of vegetation mapping are limited by image availability and ability to discriminate vegetation types.
Aims: We test the efficacy for mapping of modelling the range and core range of common species. We also determine the relative importance of predictor variables for each of nine species.
Methods: We used random forest models to predict the total range and core range (>25% projected foliage cover) of nine potentially dominant plant species and determined the contributions of predictor variables to the models for each species.
Key results: Widespread species with extensively overlapping ranges were spatially more partitioned with modelling based on core range than with presence or absence modelling. The core range input produced a vegetation map that better approximated observed vegetation patterns than that from presence or absence data. The most important predictor variable varied between species, with elevation, distance from coast, latitude and an across island gradient (similar to longitude) being most influential.
Conclusions: Species distribution models using three categories (absent, <25% cover, ≥25% cover) and topographic variables derived from a digital elevation model can be used to model the distribution of vegetation assemblages in situations where presence or absence species models cannot discriminate assemblages.
Implications: Readily collected point location species data could be used to investigate change over time in the spatial extent of both species and vegetation types.
Keywords: feldmark, grassland, herbaceous plants, herbfield, megaherb, plant communities, random forest model, tundra, vegetation boundaries.
Introduction
The subantarctic islands have a distinct environment, reflecting their extreme isolation and hyper-oceanic climate. They are characterised by tundra vegetation (short woody vegetation being absent in most cases) with low vascular plant species diversity and a complete lack of native mammalian herbivores (Smith and Lewis Smith 1987; Bergstrom and Chown 1999; Van der Putten et al. 2012). Invasive species have had severe impacts in many cases, for example, rabbits caused massive changes to the vegetation of Macquarie Island prior to their eradication in 2011 (Whinam et al. 2014). Aside from localised long-term monitoring sites (Scott and Kirkpatrick 2013; Whinam et al. 2014), there are limited means of examining how the vegetation of the entire island has responded to herbivore removal.
The vegetation map for Macquarie Island (see Selkirk and Adamson 1998 and subsequently Department of Primary Industries Parks Water and Environment 2013; Supplementary Fig. S1) was produced by manual classification of vegetation height and groundcover, largely from a 1994 satellite image. This method did not consider floristics and therefore the structural classes often include a variety of floristic assemblages (Selkirk and Adamson 1998). Modelling the distribution of individual key plant species could help understand the co-occurrence patterns of species and consequently provide a method for high resolution repeat monitoring of vegetation change at the island scale.
Species niche or distribution models (SDMs) have been widely used in diverse contexts to estimate the potential niches of species (Elith and Leathwick 2009; Franklin 2009). Numerous methodological approaches have been employed to develop species models depending on the purpose of the modelling, the available data and the background of the researcher (Austin 2007; Elith and Leathwick 2009). Species distribution modelling typically determines climatic limits for a species or probabilities of occurrence but does not indicate the optimum habitat or consider interspecific competition (Heikkinen et al. 2007; Anderson 2017). Typical SDMs, therefore, provide limited inferences about plant species assemblages and vegetation types. More complex modelling approaches are required to capture ecological interactions and dynamics (Kissling et al. 2012; Chardon et al. 2020), such as including species interactions as variables in SDMs (le Roux et al. 2013). SDM approaches have also been applied to the mapping of plant species communities or vegetation types (Ferrier and Guisan 2006; Norberg et al. 2019).
SDM projects mostly use presence only or presence or absence data. Following a previous study, which applied a three-class classification of Azorella macquariensis cover in feldmark vegetation on Macquarie Island (Bricher et al. 2013), we applied this approach to modelling a range of key species on the island. This repeatable method has prospective application for monitoring temporal and spatial vegetation change in a more nuanced way than simple presence or absence of species in an environment where vegetation type (e.g. short herbfield, tussock grassland) reflects the local dominance of widespread plant species.
We use a dominance category that is easily determined during field data collection or from existing floristic plot data to represent the core range of a species. We define the core range as the environmental envelope in which a plant species is a dominant species, with a minimum of 25% projected foliage cover. Biomass or leaf area index are more accurate means of determining dominance, but projected foliage cover is easier to measure and is closely correlated to these other metrics in herbaceous tundra vegetation (Chen et al. 2009).
This study aims to compare inferences about vegetation communities from SDMs, by determining the extent of assemblages of co-occurring species, using both the entire range of a species and its core range. We expect that the widespread dominant vascular species will each have similar environmental envelopes, with distributions limited by extremes of climatic and edaphic conditions (total range) but will be more differentiated in their core ranges. We also determine the relative importance of predictor variables for each of the nine species.
Materials and methods
Site description
Macquarie Island (54.50°S, 158.94°E) emerged from the Southern Ocean less than 1 × 10⁶ years ago and is the only exposed portion of the extensive submarine Macquarie Ridge (Adamson et al. 1996). The 128-km2 island is largely composed of igneous rocks such as basalts. Escarpment slopes rise steeply from the ocean on the east coast and from a flat coastal terrace in the west, forming an undulating plateau mostly over 200 m above sea level (ASL), which comprises most of the landmass, with peaks reaching 420 m ASL (Fig. 1).

|
Macquarie Island is subject to constant geostrophic winds and frequent cold fronts, in a region with the highest annually averaged sea level wind speeds on Earth (Hande et al. 2012). The hyper-oceanic climate is characterised by very low diurnal and annual temperature ranges (January mean monthly temperature range, 5.3–8.8°C; July, 1.6–4.9°C), high relative humidity (mean 86%) and almost daily precipitation. Annual mean rainfall (1033 mm for 1980–2010) has increased by ∼20% since 1948 (Jovanovic et al. 2012). Low cloud (fog) is frequent at higher elevations (Fitzgerald and Kirkpatrick 2020).
The vegetation is dominated by bryophytes, ferns, forbs and graminoids. Megaherbs and tussock grasses are the largest lifeforms. Vegetation types recognised on the island include tussock grassland, short grassland, herbfield, fernbrake, mire and feldmark (Selkirk et al. 1990). Feral rabbits (Oryctolagus cuniculus) have had a profound effect on the vegetation of Macquarie Island by intense grazing of select plant species, promoting vegetation dominated by less palatable or more resilient plants (Scott and Kirkpatrick 2013; Whinam et al. 2014). There are signs of vegetation changes following eradication of rabbits in 2011 (Shaw et al. 2011; Williams et al. 2016; Fitzgerald et al. 2021).
Data collection
Cover data for 9 vascular plant taxa were compiled from 770 plots (Fig. 1) spanning the period 2009–2017 (Bricher et al. 2013; Department of Primary Industries, Parks, Water and Environment, unpubl. data, 2017; Jenny Scott, unpubl. data 2014; Fitzgerald, unpubl. data 2015–2017).
The 9 taxa comprise 10 species (with 2 Acaena species combined into 1 class because they are ecologically similar and sometimes difficult to distinguish) representing most of the dominant vascular plants of Macquarie Island vegetation (Selkirk et al. 1990): Acaena spp., Agrostis magellanica, Azorella macquariensis, Deschampsia cespitosa, Festuca contracta, Luzula crinita, Pleurophyllum hookeri, Poa foliosa, Stilbocarpa polaris (syn. Azorella polaris). Lack of data precluded the inclusion of species largely confined to localised habitats such as mires, coastline and fernbrakes.
A taxon was considered dominant if projected foliage cover exceeded 25%. This threshold was chosen to capture the most extensive species in each plot, including instances where total vegetation cover is as low as 25% or where more than one species has similar coverage (co-dominance). Plots varied in size from 1 × 1 m (in which case several nearby plots were averaged as a single point) to 2.5 × 3.5 m, to a circle of 2.5-m radius. The 410 observations from Bricher et al. (2013) were sampled using a geostratified design to capture environmental gradients on Macquarie Island. Frequency of occurrence of taxa in the plots is shown in Table S1.
We used 11 terrain and topoclimatic predictor layers derived from a 5-m resolution digital elevation model for Macquarie Island (Table 1). Correlations between pairs of predictors did not exceed 0.7 (Pearson correlation coefficient) so we consider each predictor to potentially contribute to the models. The most frequent and strongest winds on Macquarie Island are from the northwesterly and westerly sectors, whereas southwesterly winds appear to be the most limiting to plant growth (Fitzgerald and Kirkpatrick 2017). We therefore modelled local wind speed across Macquarie Island based on the 95th percentile wind speed (from Bureau of Meteorology data) for each of three wind directions (225, 270, 315°) using WindNinja software (Forthofer 2007). The resulting wind exposure layers were highly correlated so we used only the westerly (270°) model for the species modelling. These wind speed models do not incorporate turbulence so may have reduced accuracy at high wind speeds in complex or steep terrain, as is typical on Macquarie Island.

|
To investigate whether species models could be improved by the addition of spectral reflectance data we also performed the modelling with a set of eight spectral layers. Spectral layers were obtained from a cloud-free 2016 Sentinel-2 image of Macquarie Island. We trialled each of the three visible wavelength bands and the near infra-red band as individual layers plus four spectral vegetation indices derived from these bands using ENVI software (ver. 5.4, Harris Geospatial, Broomfield, CO, USA, see http://www.harrisgeospatial.com/docs/VegetationIndices.html). Test models using spectral variables with topographic variables were not significantly better than topographic variables alone, using the AUC metric (area under the curve of the receiver operating characteristic, a measure of the classification accuracy of the model). Further, modelling with spectral layers was limited to a subset of the species data that was from the same year as the satellite imagery and the spectral layers were highly correlated (>0.7 Pearson correlation coefficient), which can be problematic for modelling purposes (Dormann et al. 2013). Spectral variables were therefore not used in the final models.
Random forest modelling
Modelling was performed using the biomod2 package for R (ver. 3.5.1, see https://biomodhub.github.io/biomod2/index.html; Thuiller et al. 2009). Exploratory analyses with four types of models (GLM, GAM, Artificial Neural Networks, Random Forest) showed consistently good results from random forest models (RFMs) with our data. Random forest is a machine-learning algorithm for classification or regression (Breiman 2001; Liaw and Wiener 2002). We employed random sampling of the dataset to select 65% of records for training and set aside 35% for evaluation for each decision tree in each RFM. Trial runs of RFMs with a subset of species showed that the default parameters of ntree = 500 (trees per RFM) and mtry = 4 (number of variables randomly selected for each decision tree split) were effective at minimising out-of-bag (OOB) error rates. Unlike some other SDMs, random forest models are not adversely affected by spatial autocorrelation of species observations (Marmion et al. 2009) so we did not investigate spatial autocorrelation in our data. Modelling involved running 100 RFMs and selecting the best model based on the highest AUC score. The species dataset was split into two datasets: presence or absence (PA); and dominant or not-dominant (DN), which comprises all presence records but not absences (i.e. not-dominant is defined as present with <25% cover). For each species two RFM models were produced: PA, which models the total range (presence) of the species; and DN, which models the dominant or core range as a subset of the total range. The resulting RFM regression layers for each species were converted to binary layers using a threshold that maximises the true skill statistic (Hanssen and Kuipers discriminant) (Allouche et al. 2006). These two layers were overlaid to produce a final layer with three classes: absent, non-core range, core range.
To determine which predictor variables were related to the distribution of each species we calculated the mean and standard deviation of the variable importance value from the 100 RFMs and plotted response plots for all variables for each species. Variable importance is calculated in the biomod2 package by randomising the values for a single variable and comparing the model results to the reference model to determine the influence of that variable on the model.
To predict the vegetation from the species projections we employed a ruleset (Table S2) based on observations of plant community assemblages on Macquarie Island and largely following the classification of Selkirk et al. (1990) (Table S3). Essentially the tallest plants with largest leaf area were expected to dominate smaller plants. An assemblage comprising megaherbs and tussock grass could have a single dominant or two co-dominant species. The short grass species and the perennial herb Acaena can occur as three or more co-dominant species. Sites with no modelled dominant species (i.e. all species <25% cover) were classified as feldmark if within the modelled range of A. macquariensis. We applied this ruleset to both modelled core range and total range (i.e. core plus non-core range) models to see how they differ.
Results
Model performance was acceptable with AUC values exceeding 0.78 for the best models in all cases (Fig. 2, Table S4). The mean AUC value for the core range and total range models was not significantly different (two-sample t-test, P = 0.89).

|
The short graminoid species Agrostis magellanica, Festuca contracta and Luzula crinita have ranges covering almost the entire island but their core ranges are limited to low to mid elevations, particularly in the east (Fig. 3). Poa foliosa is mostly confined to the coastal terraces and slopes, whereas S. polaris and P. hookeri have ranges covering a wide range of elevation but mostly in the northern half of the island. The core range of Azorella macquariensis covers the entire high elevation plateau habitat. Deschampsia cespitosa has the smallest and most fragmented range of the species considered here (Fig. 3).

|
The most useful variables for modelling distributions depended on the taxon. Elevation and distance from the coast are important for several species including A. magellanica, A. macquariensis, F. contracta, L. crinita, P. foliosa and S. polaris (Fig. 4, Table S5). Several species show a geographic bias on longitudinal or latitudinal axes. For example, Pleurophyllum hookeri has a distribution biased to the north, whereas A. macquariensis displays the opposite pattern. The short grasses D. cespitosa and F. contracta are biased toward the east (lee) side of the island. Proximity to the coast and topographic position had some influence on the core range of S. polaris. Aspect (eastness and northness) featured strongly in the models for D. cespitosa but had low importance for other species. Wind exposure had low importance for all models (Fig. 4, Table S5).

|
Core range as a proportion of total range varied greatly, from 12.5% for S. polaris to 74% for A. macquariensis (Table 2). Most of the 10 dominant species considered here potentially co-occur across large parts of Macquarie Island (Fig. S2a). However, the extent of overlapping core ranges is much lower, ranging from eight of the nine taxa in some coastal situations and declining with elevation (Fig. S2b). The core ranges of some species coincide strongly, for example S. polaris is almost always associated with P. foliosa (Table S6).

|
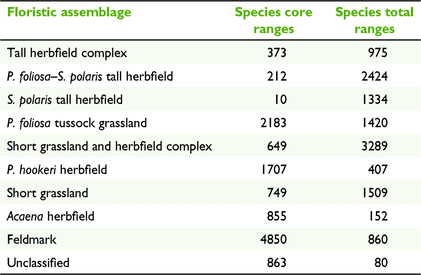
Combining range maps into a species assemblage classification produced an original map with nine classes plus 3.4% of the island in an unclassified category (Fig. 5a, Table 3). Applying the assemblage ruleset to total range maps instead of core ranges resulted in a very different spatial pattern with the taller vegetation (three assemblages) and short grassland–herbfield complex covering most of the island, with dramatic reductions in feldmark, P. hookeri herbfield and Acaena herbfield (Fig. 5b, Table 3).

|
|
Discussion
Mapping species assemblages
By using modelled core range distributions our research provides the ability to map the current species assemblages across most of Macquarie Island. Generalist species on Macquarie Island had much narrower core ranges than full ranges, consistent with the model of Austin and Smith (1989). Core ranges may be further narrowed by interspecific competition or past grazing impacts. The low number of co-occurring core ranges across most of the island suggests that these effects may be strong. The assemblage ruleset gives precedence to the taller growing species. When applied to the core range models, where these species have more than 25% cover they were assumed to dominate over co-occurring short plants which also have more than 25% cover.
The vegetation distribution modelled on core ranges indicates tussock grassland dominating at lower elevations, with P. hookeri herbfield and feldmark at higher elevations. This pattern approximates descriptions from the 19th century when tall vegetation dominated by tussocks and megaherbs extended to the lower altitudinal limit of the feldmark (Kirkpatrick 2009).
A more complex pattern with extensive areas of short grassland and grassland–herbfield and very limited extent of feldmark results from assemblages derived from the total range models. Applying the assemblage ruleset to the total range of all species assumes that the tallest species will potentially be dominant across their entire range. This outcome could happen where a species has an abrupt range boundary due to interspecific competition or a sharp environmental discontinuity.
Although both vegetation maps indicate the dominance of the large megaherb and tussock species at lower elevations, the assemblages differ in composition with varying combinations of P. foliosa, P. hookeri and S. polaris. The very limited core range of S. polaris likely reflects the relative scarcity of this species at the time of sampling due to rabbit impacts (Whinam et al. 2014). The large fern Polystichum vestitum was not modelled because of lack of data, yet historically this species formed a distinct fernbrake community in places and was sometimes co-dominant with the mergaherb and tussock species (Selkirk et al. 1990). Therefore, we expect that the mapped lowland megaherb and tussock vegetation may be complex and changeable in composition. This could be examined by further sampling of these environments.
Shorter vegetation, largely confined to middle to high elevations, indicates either abiotic limits on the dominance of larger plants or the influence of disturbance favouring particular species such as small graminoids and herbs. Acaena herbfield is possibly a grazing-induced disclimax. On Grande Terre in the Kerguelen Islands, extensive Acaena magellanica herbfields are attributed to rabbits (Lebouvier and Frenot 2007). Without grazing this community may be replaced by taller vegetation, as is indicated by our total range map (Fig. 5b), or by a more diverse assemblage of short grasses and herbs.
Similarly, short grassland and short grassland and herbfield complex probably represent a grazing-induced disclimax in many places. However, the gradient theory of Austin and Smith (1989) suggests they may also have a natural niche in the transition between highly productive and highly stressed environments. Two such ecotones might occur on Macquarie Island: permanently wet soils between the well-drained tussock grass–tall herbfield and waterlogged mires, and the transition from lowland closed vegetation to feldmark.
In the latter example, this topographic partitioning of vegetation types is consistent with the stress gradient hypothesis, where interaction between plant species is increasingly positive (facilitative) as abiotic stress increases, as demonstrated in a similar environment by vegetation patterns along an altitudinal gradient on subantarctic Marion Island (le Roux and McGeoch 2008). Azorella grows slowly and does not tolerate shade and therefore is excluded by competition except where harsh conditions preclude taller growing plants (Bergstrom et al. 1997).
Some areas were undefined by the assemblage ruleset, suggesting that these areas either do not fit into the community classification or the species models are underestimating the core ranges. The main gap in our analysis is the exclusion of mire species such as Montia fontana, Juncus scheuchzerioides and Isolepis aucklandica because of insufficient data. Mires occur on the coastal terrace and inland valleys where the watertable is constantly high. Pleurophyllum can occur in mires (Rich 1996), so the core map is not entirely inaccurate in mapping these mires as herbfield. Nevertheless, extensive areas of coastal terrace mires were wrongly classified as being dominated by S. polaris and P. foliosa in the present study. Bricher (2012) noted the same problem with a similar spatial modelling approach which neglected mire species. An additional problem is the microtopographic scale at which herbfield and mire are differentiated on the coastal terraces (Rich 1996).
Ecological responses of species
Well-constructed SDMs with good predictive accuracy can discriminate variable importance in most cases and provide inferences about the relative significance of environmental factors to explore in experimental studies. This is despite complications due to small sample sizes, variable collinearity and variation in species niche width (Smith and Santos 2020). A key consideration is the interpretation of causation (as opposed to correlation), particularly when using indirect gradients (e.g. elevation) as surrogate measures for direct drivers of species distributions (Elith and Leathwick 2009; Mod et al. 2016).
Elevation is an important predictor variable for several species in this study, yet given the correlation between elevation and several direct gradients that pertains in this and other studies, it is difficult to interpret which direct environmental factors or combination of factors are involved in species responses to the elevation gradient. For example, relative humidity and windspeed increase with elevation on Macquarie Island, whereas soil temperature and air temperature decrease (Tweedie 2000; Fitzgerald and Kirkpatrick 2020). Soil freeze–thaw cycles influence plant growth at higher elevations (Boelhouwers et al. 2003; Selkirk-Bell and Selkirk 2013) and frequency of fog increases with elevation (Fitzgerald and Kirkpatrick 2020).
Wind exposure is an important climatic influence on vegetation in the subantarctic, particularly in determining the distribution of feldmark (Fitzgerald and Kirkpatrick 2017; Momberg et al. 2021a), yet wind exposure was not important for core or total range models in our analysis. This contrasts with plant species modelling for subantarctic Marion Island, where wind stress was an important factor in species distribution and cover (Momberg et al. 2021b), perhaps reflecting different approaches to modelling of wind stress.
Indirect gradients can involve biotic interactions, such as the latitudinal variation in Azorella on Macquarie Island, which is likely to be driven by lower frequency of freezing days in the north and consequent increase in pathogen-induced mortality compared to the south (Dickson et al. 2021). Shifts between interspecific competition and facilitation on gradients of environmental stress (le Roux and McGeoch 2008; Chardon et al. 2020) may also influence species distribution patterns.
Environmental factors not included in the RFMs include geology and soils. Geology does not appear to influence plant species dominance on Macquarie Island (Adamson et al. 1993). Although spatial data for soils arenot available, the topographic variables used in our models may provide some surrogacy for soil characteristics (e.g. topographic position and wetness). Satellite derived variables, particularly texture metrics (Murray et al. 2010; Bricher et al. 2013), may be useful for detecting some vegetation types, although obtaining suitable satellite imagery covering Macquarie Island has proven problematic.
Conclusion
We demonstrate a simple variation of the typical binary presence or absence SDMs by adding a third class representing the core range of a species. This approach is useful on Macquarie Island where most of the dominant plant species co-occur across a wide range of environments, yet the vegetation varies considerably in individual species abundance and, consequently, in community structure. Mapping of structural vegetation types can be derived from core range models, whereas absolute ranges are not useful for this purpose.
The simple field data collection and GIS-derived topographic variables make this method repeatable and data-driven. Although models could be improved with more data points from more extensive fieldwork, for most species the model performance is sufficient for repeat modelling to monitor changes in the extent of communities. Topographic variables are readily available and produce effective models.
The distribution of plant species assemblages on Macquarie Island reflects environmental gradients and may be locally modified by other factors such as grazing history. We expect that plant species distributions on Macquarie Island are still shifting as species approach their climatic limits following release from grazing pressure. Data points capturing recent expansion in species distributions would allow the models to be updated to monitor this change.
Supplementary material
Supplementary material is available online.
Data availability
Datasets are archived with the Australian Antarctic Data Centre (http://dx.doi.org/doi:10.26179/m528-md85).
Conflicts of interest
The authors declare that they have no conflicts of interest.
Declaration of funding
This research was supported by an Australian Government Australian Postgraduate Award Scholarship to N. B. Fitzgerald. This research did not receive any additional specific funding.
Acknowledgements
We thank Jenny Scott, Phillippa Bricher and the Department of Primary Industries, Parks, Water and Environment (DPIPWE, Micah Visoiu) for kindly providing data from previous studies. Andrea Turbett and Chris Howard provided further species observation data. We are grateful to Arko Lucieer for his invaluable advice on data preparation and analysis, particularly the remote sensing data. The Antarctic Division and Tasmanian Parks and Wildlife Service provided invaluable logistical support to enable fieldwork on Macquarie Island. We acknowledge three anonymous reviewers for providing valuable suggestions, which have much improved the manuscript.
References
Adamson DA, Selkirk JM, Seppelt RD (1993) Serpentinite, harzburgite, and vegetation on Subantarctic Macquarie Island. Arctic and Alpine Research 25, 216–219.| Serpentinite, harzburgite, and vegetation on Subantarctic Macquarie Island.Crossref | GoogleScholarGoogle Scholar |
Adamson DA, Selkirk PM, Price DM, Ward N, Selkirk JM (1996) Pleistocene uplift and palaeoenvironments of Macquarie Island: evidence from palaeobeaches and sedimentary deposits. Papers and Proceedings of the Royal Society of Tasmania 130, 25–32.
| Pleistocene uplift and palaeoenvironments of Macquarie Island: evidence from palaeobeaches and sedimentary deposits.Crossref | GoogleScholarGoogle Scholar |
Allouche O, Tsoar A, Kadmon R (2006) Assessing the accuracy of species distribution models: prevalence, kappa and the true skill statistic (TSS). Journal of Applied Ecology 43, 1223–1232.
| Assessing the accuracy of species distribution models: prevalence, kappa and the true skill statistic (TSS).Crossref | GoogleScholarGoogle Scholar |
Anderson RP (2017) When and how should biotic interactions be considered in models of species niches and distributions? Journal of Biogeography 44, 8–17.
| When and how should biotic interactions be considered in models of species niches and distributions?Crossref | GoogleScholarGoogle Scholar |
Austin M (2007) Species distribution models and ecological theory: a critical assessment and some possible new approaches. Ecological Modelling 200, 1–19.
| Species distribution models and ecological theory: a critical assessment and some possible new approaches.Crossref | GoogleScholarGoogle Scholar |
Austin MP, Smith TM (1989) A new model for the continuum concept. Vegetatio 83, 35–47.
| A new model for the continuum concept.Crossref | GoogleScholarGoogle Scholar |
Bergstrom DM, Chown SL (1999) Life at the front: history, ecology and change on southern ocean islands. Trends in Ecology & Evolution 14, 472–477.
| Life at the front: history, ecology and change on southern ocean islands.Crossref | GoogleScholarGoogle Scholar |
Bergstrom DMM, Selkirk PM, Keenan HM, Wilson ME (1997) Reproductive behaviour of ten flowering plant species on subantarctic Macquarie Island. Opera Botanica 132, 109–120.
Boelhouwers J, Holness S, Sumner P (2003) The maritime subantarctic: a distinct periglacial environment. Geomorphology 52, 39–55.
| The maritime subantarctic: a distinct periglacial environment.Crossref | GoogleScholarGoogle Scholar |
Breiman L (2001) Random forests. Machine Learning 45, 5–32.
| Random forests.Crossref | GoogleScholarGoogle Scholar |
Bricher PK (2012) Methods for mapping the tundra vegetation of sub-antarctic Macquarie Island. PhD thesis, University of Tasmania, Hobart, Tas., Australia.
Bricher PK, Lucieer A, Shaw J, Terauds A, Bergstrom DM (2013) Mapping sub-antarctic cushion plants using random forests to combine very high resolution satellite imagery and terrain modelling. PLoS ONE 8, e72093
| Mapping sub-antarctic cushion plants using random forests to combine very high resolution satellite imagery and terrain modelling.Crossref | GoogleScholarGoogle Scholar | 23940805PubMed |
Chardon NI, Pironon S, Peterson ML, Doak DF (2020) Incorporating intraspecific variation into species distribution models improves distribution predictions, but cannot predict species traits for a wide-spread plant species. Ecography 43, 60–74.
| Incorporating intraspecific variation into species distribution models improves distribution predictions, but cannot predict species traits for a wide-spread plant species.Crossref | GoogleScholarGoogle Scholar |
Chen W, Li J, Zhang Y, Zhou F, Koehler K, Chen W, Li J, Zhang YU, Zhou F, Koehler K, Leblanc S, Fraser R, Olthof IAN, Zhang Y, Wang J (2009) Relating biomass and leaf area index to non-destructive measurements in order to monitor changes in Arctic vegetation. ARCTIC 62, 281–294.
| Relating biomass and leaf area index to non-destructive measurements in order to monitor changes in Arctic vegetation.Crossref | GoogleScholarGoogle Scholar |
Department of Primary Industries, Parks, Water and Environment (2013) ‘TASVEG 3.0 Macquarie Island.’ (Tasmanian Vegetation Monitoring and Mapping Program, Resource Management and Conservation Division, DPIPWE: Hobart, Tas., Australia)
Dickson CR, Baker DJ, Bergstrom DM, Brookes RH, Whinam J, McGeoch MA (2021) Widespread dieback in a foundation species on a Sub-Antarctic World Heritage Island: fine-scale patterns and likely drivers. Austral Ecology 46, 52–64.
| Widespread dieback in a foundation species on a Sub-Antarctic World Heritage Island: fine-scale patterns and likely drivers.Crossref | GoogleScholarGoogle Scholar |
Dormann CF, Elith J, Bacher S, Buchmann C, Carl G, Carré G, Marquéz JRG, Gruber B, Lafourcade B, Leitão PJ, Münkemüller T, McClean C, Osborne PE, Reineking B, Schröder B, Skidmore AK, Zurell D, Lautenbach S (2013) Collinearity: a review of methods to deal with it and a simulation study evaluating their performance. Ecography 36, 27–46.
| Collinearity: a review of methods to deal with it and a simulation study evaluating their performance.Crossref | GoogleScholarGoogle Scholar |
Elith J, Leathwick JR (2009) Species distribution models: ecological explanation and prediction across space and time. Annual Review of Ecology, Evolution, and Systematics 40, 677–697.
| Species distribution models: ecological explanation and prediction across space and time.Crossref | GoogleScholarGoogle Scholar |
Ferrier S, Guisan A (2006) Spatial modelling of biodiversity at the community level. Journal of Applied Ecology 43, 393–404.
| Spatial modelling of biodiversity at the community level.Crossref | GoogleScholarGoogle Scholar |
Fitzgerald NB, Kirkpatrick JB (2017) Wind distortion in alpine and subantarctic plants is constant among life forms but does not necessarily reflect prevailing wind direction. Arctic, Antarctic, and Alpine Research 49, 521–535.
| Wind distortion in alpine and subantarctic plants is constant among life forms but does not necessarily reflect prevailing wind direction.Crossref | GoogleScholarGoogle Scholar |
Fitzgerald NB, Kirkpatrick JB (2020) Air temperature lapse rates and cloud cover in a hyper-oceanic climate. Antarctic Science 32, 440–453.
| Air temperature lapse rates and cloud cover in a hyper-oceanic climate.Crossref | GoogleScholarGoogle Scholar |
Fitzgerald NB, Kirkpatrick JB, Scott JJ (2021) Rephotography, permanent plots and remote sensing data provide varying insights on vegetation change on subantarctic Macquarie Island, 1980–2015. Austral Ecology 46, 762–775.
| Rephotography, permanent plots and remote sensing data provide varying insights on vegetation change on subantarctic Macquarie Island, 1980–2015.Crossref | GoogleScholarGoogle Scholar |
Forthofer JM (2007) Modeling wind in complex terrain for use in fire spread prediction. PhD thesis, Colorado State University, Fort Collins, CO, USA.
Franklin J (2009) ‘Mapping species distributions: spatial inference and prediction.’ (Cambridge University Press: Cambridge, UK)
Hande LB, Siems ST, Manton MJ (2012) Observed trends in wind speed over the southern ocean. Geophysical Research Letters 39, L11802
| Observed trends in wind speed over the southern ocean.Crossref | GoogleScholarGoogle Scholar |
Heikkinen RK, Luoto M, Virkkala R, Pearson RG, Körber J-H (2007) Biotic interactions improve prediction of boreal bird distributions at macro-scales. Global Ecology and Biogeography 16, 754–763.
| Biotic interactions improve prediction of boreal bird distributions at macro-scales.Crossref | GoogleScholarGoogle Scholar |
Jovanovic B, Braganza K, Collins D, Jones D (2012) Climate variations and change evident in high-quality climate data for Australia’s Antarctic and remote island weather stations. Australian Meteorological and Oceanographic Journal 62, 247–261.
| Climate variations and change evident in high-quality climate data for Australia’s Antarctic and remote island weather stations.Crossref | GoogleScholarGoogle Scholar |
Kirkpatrick JB (2009) The importance of integrating science and management: lessons from terrestial vegetation change on Macquarie and Heard islands. Papers and Proceedings of the Royal Society of Tasmania 143, 25–32.
| The importance of integrating science and management: lessons from terrestial vegetation change on Macquarie and Heard islands.Crossref | GoogleScholarGoogle Scholar |
Kissling WD, Dormann CF, Groeneveld J, Hickler T, Kühn I, McInerny GJ, Montoya JM, Römermann C, Schiffers K, Schurr FM, Singer A, Svenning J-C, Zimmermann NE, O’Hara RB (2012) Towards novel approaches to modelling biotic interactions in multispecies assemblages at large spatial extents. Journal of Biogeography 39, 2163–2178.
| Towards novel approaches to modelling biotic interactions in multispecies assemblages at large spatial extents.Crossref | GoogleScholarGoogle Scholar |
le Roux PC, Lenoir J, Pellissier L, Wisz MS, Luoto M (2013) Horizontal, but not vertical, biotic interactions affect fine-scale plant distribution patterns in a low-energy system. Ecology 94, 671–682.
| Horizontal, but not vertical, biotic interactions affect fine-scale plant distribution patterns in a low-energy system.Crossref | GoogleScholarGoogle Scholar | 23687893PubMed |
le Roux PC, McGeoch MA (2008) Spatial variation in plant interactions across a severity gradient in the sub-Antarctic. Oecologia 155, 831–844.
| Spatial variation in plant interactions across a severity gradient in the sub-Antarctic.Crossref | GoogleScholarGoogle Scholar | 18253754PubMed |
Lebouvier M, Frenot Y (2007) Conservation and management in the French sub-Antarctic islands and surrounding seas. Papers and Proceedings of the Royal Society of Tasmania 141, 23–28.
| Conservation and management in the French sub-Antarctic islands and surrounding seas.Crossref | GoogleScholarGoogle Scholar |
Liaw A, Wiener M (2002) Classification and regression by randomForest. R News 2, 18–22.
Marmion M, Luoto M, Heikkinen RK, Thuiller W (2009) The performance of state-of-the-art modelling techniques depends on geographical distribution of species. Ecological Modelling 220, 3512–3520.
| The performance of state-of-the-art modelling techniques depends on geographical distribution of species.Crossref | GoogleScholarGoogle Scholar |
Mod HK, Scherrer D, Luoto M, Guisan A (2016) What we use is not what we know: environmental predictors in plant distribution models. Journal of Vegetation Science 27, 1308–1322.
| What we use is not what we know: environmental predictors in plant distribution models.Crossref | GoogleScholarGoogle Scholar |
Momberg M, Hedding DW, Luoto M, le Roux PC (2021a) Exposing wind stress as a driver of fine-scale variation in plant communities. Journal of Ecology 109, 2121–2136.
| Exposing wind stress as a driver of fine-scale variation in plant communities.Crossref | GoogleScholarGoogle Scholar |
Momberg M, Hedding DW, Luoto M, le Roux PC (2021b) Species differ in their responses to wind: the underexplored link between species fine-scale occurrences and variation in wind stress. Journal of Vegetation Science 32, e13093
| Species differ in their responses to wind: the underexplored link between species fine-scale occurrences and variation in wind stress.Crossref | GoogleScholarGoogle Scholar |
Murray H, Lucieer A, Williams R (2010) Texture-based classification of sub-Antarctic vegetation communities on Heard Island. International Journal of Applied Earth Observation and Geoinformation 12, 138–149.
| Texture-based classification of sub-Antarctic vegetation communities on Heard Island.Crossref | GoogleScholarGoogle Scholar |
Norberg A, Abrego N, Blanchet FG, Adler FR, Anderson BJ, Anttila J, Araújo MB, Dallas T, Dunson D, Elith J, Foster SD, Fox R, Franklin J, Godsoe W, Guisan A, O’Hara B, Hill NA, Holt RD, Hui FKC, Husby M, Kålås JA, Lehikoinen A, Luoto M, Mod HK, Newell G, Renner I, Roslin T, Soininen J, Thuiller W, Vanhatalo J, Warton D, White M, Zimmermann NE, Gravel D, Ovaskainen O (2019) A comprehensive evaluation of predictive performance of 33 species distribution models at species and community levels. Ecological Monographs 89, e01370
| A comprehensive evaluation of predictive performance of 33 species distribution models at species and community levels.Crossref | GoogleScholarGoogle Scholar |
Rich J (1996) Patterned quaking mire at Handspike Point, Macquarie Island. Papers and Proceedings of the Royal Society of Tasmania 130, 49–66.
| Patterned quaking mire at Handspike Point, Macquarie Island.Crossref | GoogleScholarGoogle Scholar |
Scott JJ, Kirkpatrick JB (2013) Changes in the cover of plant species associated with climate change and grazing pressure on the Macquarie Island coastal slopes, 1980–2009. Polar Biology 36, 127–136.
| Changes in the cover of plant species associated with climate change and grazing pressure on the Macquarie Island coastal slopes, 1980–2009.Crossref | GoogleScholarGoogle Scholar |
Selkirk P, Adamson D (1998) ‘Map of structural vegetation types and drainage on Subantarctic Macquarie Island.’ (Australian Antarctic Division: Hobart, Tas., Australia)
Selkirk PM, Seppelt RD, Selkirk DR (1990) ‘Subantarctic Macquarie Island: environment and biology.’ (Cambridge University Press: Cambridge, UK)
Selkirk-Bell JM, Selkirk PM (2013) Vegetation-banked terraces on Subantarctic Macquarie Island: a reappraisal. Arctic, Antarctic, and Alpine Research 45, 261–274.
| Vegetation-banked terraces on Subantarctic Macquarie Island: a reappraisal.Crossref | GoogleScholarGoogle Scholar |
Shaw J, Terauds A, Bergstrom D (2011) Rapid commencement of ecosystem recovery following aerial baiting on sub-Antarctic Macquarie Island. Ecological Management & Restoration 12, 241–244.
| Rapid commencement of ecosystem recovery following aerial baiting on sub-Antarctic Macquarie Island.Crossref | GoogleScholarGoogle Scholar |
Smith VR, Lewis Smith RI (1987) The biota and conservation status of sub-Antarctic Islands. Environment International 13, 95–104.
| The biota and conservation status of sub-Antarctic Islands.Crossref | GoogleScholarGoogle Scholar |
Smith AB, Santos MJ (2020) Testing the ability of species distribution models to infer variable importance. Ecography 43, 1801–1813.
| Testing the ability of species distribution models to infer variable importance.Crossref | GoogleScholarGoogle Scholar |
Thuiller W, Lafourcade B, Engler R, Araújo MB (2009) BIOMOD – a platform for ensemble forecasting of species distributions. Ecography 32, 369–373.
| BIOMOD – a platform for ensemble forecasting of species distributions.Crossref | GoogleScholarGoogle Scholar |
Tweedie CE (2000) Climate change and the autecology of six plant species along an altitudinal gradient on Subantarctic Macquarie Island. PhD thesis, University of Queensland, Brisbane, Qld, Australia.
Van der Putten N, Mauquoy D, Verbruggen C, Björck S (2012) Subantarctic peatlands and their potential as palaeoenvironmental and palaeoclimatic archives. Quaternary International 268, 65–76.
| Subantarctic peatlands and their potential as palaeoenvironmental and palaeoclimatic archives.Crossref | GoogleScholarGoogle Scholar |
Whinam J, Fitzgerald N, Visoiu M, Copson G (2014) Thirty years of vegetation dynamics in response to a fluctuating rabbit population on sub-Antarctic Macquarie Island. Ecological Management & Restoration 15, 41–51.
| Thirty years of vegetation dynamics in response to a fluctuating rabbit population on sub-Antarctic Macquarie Island.Crossref | GoogleScholarGoogle Scholar |
Williams L, Howard C, Scott J (2016) Change in the distribution of the indigenous grass Poa litorosa on Sub-Antarctic Macquarie Island following the eradication of rabbits. Papers and Proceedings of the Royal Society of Tasmania 150, 1–8.
| Change in the distribution of the indigenous grass Poa litorosa on Sub-Antarctic Macquarie Island following the eradication of rabbits.Crossref | GoogleScholarGoogle Scholar |