The dominant source of phase errors in interferometric radio observations at frequencies above 5 GHz are fluctuations in the tropospheric water vapour content along the line of sight of the individual interferometer elements. The effect of the fluctuations scales linearly with frequency, making observations at frequencies of tens of GHz (at wavelengths less than about 1 cm) particularly sensitive to atmospheric phase changes. For a radio interferometer operating at frequencies of up to 115 GHz such as the Australia Telescope Compact Array (ATCA) it is therefore desirable to identify the periods within a year that are suitable for observations at these high frequencies. A well-tested means of characterizing the phase stability above a radio observatory are two-element interferometers observing unmodulated beacons of geostationary satellites (e.g. Radford et al. 1996; Hiriart et al. 2002).
Atmospheric Seeing in the Radio Regime
A excellent introduction to radio seeing can be found in Thompson et al. 2001. It is generally assumed that the water vapour distribution in the troposphere can be described as follows. Water vapour does not mix well with air because the air temperature is close to the condensation point of water. Its distribution can be approximated as nested parcels of air with a variety of water vapour densities. Kinetic energy is transferred from larger parcels to smaller and smaller parcels until it is dissipated by viscous friction, a situation known as Kolmogorov turbulence. A sketch of the situation can be found in Figure II in Masson (1994). The rms phase fluctuations σφ, measured over a long period, are expected to exhibit a power law relationship with baseline length b:

Generally the turbulence is considered to be confined to a specific layer. When the layer is much thinner than the interferometer spacing, two-dimensional turbulence theory is applicable, which suggests a power law exponent of β/2 = 1/3 for the rms phase. When the layer is deep compared with the interferometer spacing, three-dimensional theory is appropriate, and a power law exponent of β/2 = 5/6 is expected.
Furthermore, it is assumed that the mixture of air and water vapour is ‘frozen’ in the atmosphere and is transported relative to the ground at a particular speed, vs. This wind speed aloft couples the temporal and spatial behaviour of the phase screen, and vs therefore is called the phase screen speed.
Design of the Seeing Monitor
Here we report on the development of a seeing monitor at the ATCA, and present an analysis of some data.
The ATCA seeing monitor is an interferometer on a 230 m east–west baseline and tracks the 30.48 GHz beacon on the geostationary communications satellite, OPTUS-B3, at an elevation of 60°. Each element of the interferometer consists of a 1.8 m prime-focus paraboloid equipped with an uncooled low-noise amplifier (LNA). The FWHM of the reflectors’ main lobes is 0.4°. This is large compared to the satellite’s diurnal motion on the sky (0.1°), and hence the reflectors are stationary and do not need to track.
The power arriving at the feed horns is approximately 3×10–13 W, or –125 dBW. The signals are received and amplified in the primary foci, then transported to a screened temperature-controlled enclosure next to the antenna, where the signals are down-converted in two steps to a frequency of 240 MHz. They are then sent to the ATCA’s screened room via optical fibres, where they are mixed down to a frequency of 50 kHz, and analyzed.
The design of the system was challenged by the poor signal-to-noise ratio, and the drifting beacon frequency due to the satellite’s radial diurnal motion: This motion makes the beacon frequency drift through approximately 5 kHz (peak-to-peak) each day.
The problem of the changing frequency was addressed by coupling the local oscillator frequency to the satellite beacon frequency. This is accomplished with a Stanford Research Systems SR510 lock-in amplifier with a very narrow-band (2 Hz) notch filter, which tracks the satellite beacon frequency automatically.
The signal-to-noise ratio was improved by generating a clean signal coupled to the notch-filtered frequency and using this signal as a reference to which the other antenna’s signal is to be compared. This is realized with a Stanford Research Systems SR830 lock-in amplifier. The phase measurement is then carried out with a second SR510.
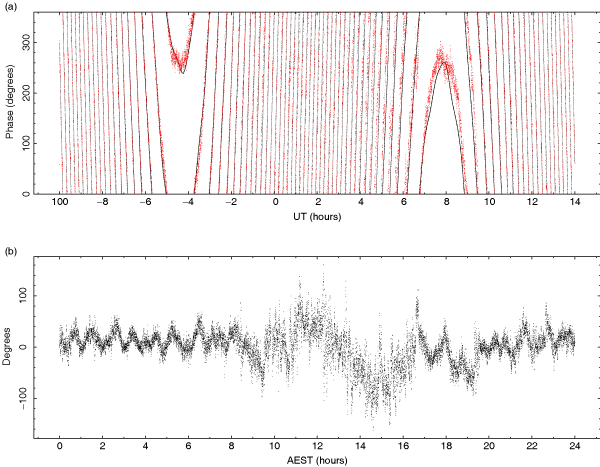
In addition to the atmosphere, the interferometer phase is affected by two other phenomena—both the small motion of the satellite and thermal drifts in the receiving system introduce extra phase responses. Figure 1 shows a comparison between the measured phase and that predicted purely from the satellite’s motion. After subtraction of this component, the residuals clearly show both the atmospheric and thermal components.
Figure 1 Comparison of the predicted and measured satellite phase on 2004 September 23. (a) The predicted (solid line) and measured (dots) satellite phase. The x-axis shows time in UT hours and the y-axis the phase in degrees. (b) The difference between the prediction and the measurements. The x-axis shows time in AEST hours and the y-axis the residual phase in degrees. The periodic structure in the residuals is due to the cycling of the air conditioning in the receiver enclosure. The relatively quiet sections before 9 h AEST and after 17 h AEST emphasize the increase in path length fluctuations during the day (cf. Figure 4).
|
Observations and Data Analysis
Operation of the Seeing Monitor
The integration times of the seeing monitor’s lock-in amplifiers are set to 100 ms. However, the phase is read and archived by the observatory monitor system only every 5 s. The standard processing of the data are as follows: The difference between two successive phase measurements is found, the standard deviation of this difference is computed and the measurement is converted into a path length using Eqn (4) before archiving. By taking the standard deviation (as distinct from rms) of differences, any response to a linear drift within the averaging period is eliminated. Thus the effect of the satellite motion and thermal phase drifts are removed. This standard deviation is computed over 10 min of data. As 10 min is long compared to the wind-crossing time over the seeing monitor baseline (the crossing time is usually no more than one minute), this is a statistically adequate period for estimating the rms phase.
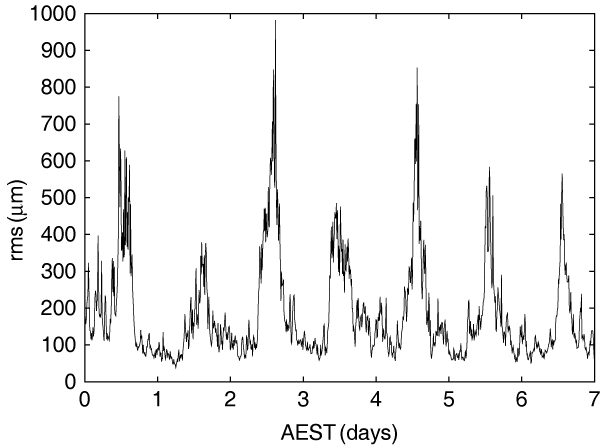
The real-time measurements and plots from the archive are accessible to staff and observers. As an example, the path length fluctuation from a seven-day period are reproduced in Figure 2.
Figure 2 Example of seven days of seeing monitor data taken between 2005 May 14 and 21. The labelled major tick marks correspond to 00:00 h AEST. The diurnal variations can be clearly seen, with relatively quiet nights and pronounced peaks around noon and in the early afternoon. Note that these values represent the seeing at 60° elevation on a 230 m baseline.
|
Our Analysis
The analysis presented in this paper is more detailed than the analysis carried out routinely at the observatory and yields more insights into the properties of the atmosphere.
We have converted the raw seeing monitor phases into path length measurements in micrometres and divided them into sections of 30 min. A second-order polynomial was subtracted from the measurements to eliminate changes due to satellite motion and thermal drifts in this interval. We have calculated the rms of the residuals, which is a measure of the radio seeing in this interval.
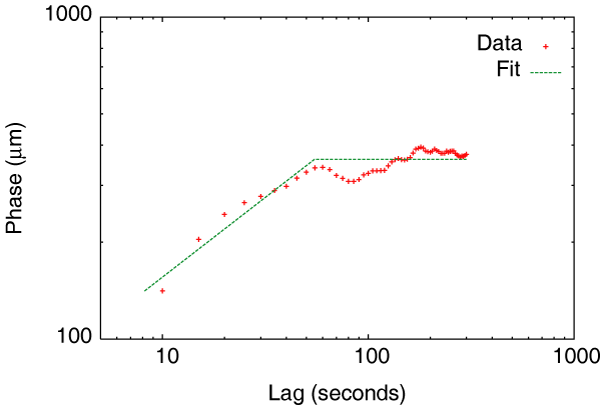
Furthermore, using these 30 min intervals of data, we have followed an approach using lag structure functions (see Holdaway et al. 1995) to determine the phase screen speed and Kolmogorov exponent. In a logarithmic diagram, the structure function of the path length fluctuations increases linearly with lag, until it flattens out after a characteristic time. The slope of the linear increase is a measure of the Kolmogorov exponent, β/2, the time after which saturation occurs is characteristic of the speed of the phase screen, and the level at which saturation occurs is expected to be √2 times the rms path length fluctuations. We have measured these quantities in each 30 min interval by fitting linear functions to the two parts of the structure functions (see Figure 3).
Figure 3 Typical lag phase structure function and a fit to these data. The data were taken on 2006 June 16. Rms phase 256 μm, phase screen speed 4.2 ms–1, β/2 = 0.49.
|
The simple rms of the data, and the fit to the saturation level of the lag structure function provide two methods with which to estimate σφ. The average of the ratio of these two estimates, after correcting for the factor of √2, is 0.995 ± 0.098, implying a near-perfect agreement of the estimation methods.
It is common to normalize the rms of the path length fluctuations to an interferometer baseline of 1 km, pointing towards the zenith. We therefore have multiplied all rms measurements by √3/2 to convert the measurements to zenith values, and by (1000/230)β/2, to scale the measurements from the seeing monitor’s 230 m baseline to 1 km, where β/2 is the Kolmogorov exponent derived from the structure function in each interval.
The data presented here were observed in the period of 2004 September 16 to 2006 May 25. There were only two noticeable periods where the seeing monitor was either not observing or the measurements were below 20 μm, indicating a malfunction. These periods were 2004 October 7 to 2004 October 19 (12.2 days); and 2005 January 12 to 2005 April 14 (92.3 days). There were nine shorter periods (one to five days) and many even shorter periods (typically a few hours) without data. The shortest outages tended to happen preferentially in summer and were associated with storms (the seeing monitor failed when the sky becames opaque to the 30 GHz beacon, and under some situations when mains power had been lost). We have performed some analysis to convince ourselves that these short gaps in the data do not significantly affect or bias our conclusions.
The effect of the longer gaps is more difficult to estimate. The missing data essentially mean that some times of the year were sampled only once, and so results are more sensitive to rare weather situations that may bias the characteristics of that period.
Impact on the Scheduling of Millimetre Observations
Path Length Fluctuations as a Function of Time of Day and Time of Year
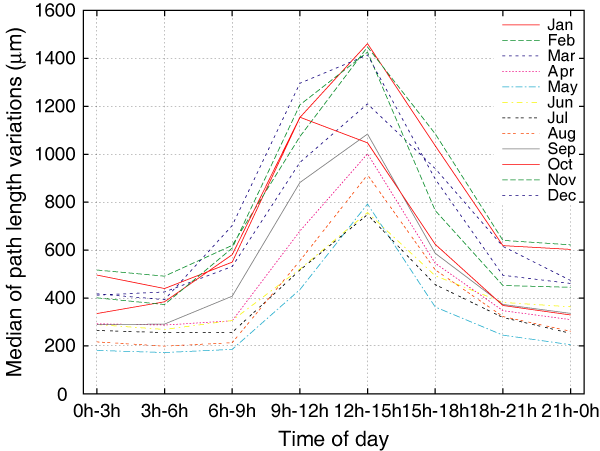
We have sorted the data by month and time of day (local time, AEST). The data observed within each month were divided into eight groups, each of which represents 3 h of a day in that particular month (00:00 to 03:00 h, then 03:00 to 06:00 h, and so on). The number of measurements in each of these groups is of the order of 220 (covering the range of 114 to 336 measurements). Measurements of less than 20 μm have been deemed instrumental errors and have been ignored. The medians of the rms phase of these groups are plotted in Figure 4. It shows that throughout the year, the highest rms values occur in the period between 12:00 and 15:00 h AEST. The only exception is in October, when the maximum occurs in the period 09:00–12:00 h. The plot also reveals that in any one month at night (between 21:00 and 06:00 h AEST), the rms is lower than 650 μm, which is lower than the maximum rms in any month. This is interesting because it suggests that from the perspective of atmospheric seeing, summer nights are as good as, or better than, winter days. Hence it may be feasible to extend the period in which millimetre projects are scheduled. However, from Figure 4 it is not easy to tell by how much summer nights are better. We quantify this in the following section.
Figure 4 Rms of the path length variations as a function of time of day.
|
Quantitative Analysis of Path Length Fluctuations
At the ATCA, the ‘millimetre season’, i.e., the time of year during which observations at millimetre wavelengths (currently frequencies of 86 GHz and higher) are scheduled, is early May to August. Observing time in this period is in high demand, and to ensure the best possible usage of observing time it is desirable to know to what extent the millimetre season can be expanded into the shoulder seasons. The seeing monitor measurements from the millimetre season should therefore be compared to measurements taken throughout the rest of the year.
Furthermore, we deem typical daytime conditions to occur between 09:00 and 12:00 h, and between 15:00 and 18:00 h. The rms is remarkably worse between 12:00 and 15:00 h in all months, and not representative of typical daytime conditions. Night time conditions appear to occur between 21:00 and 06:00 h, where the path length fluctuations are relatively constant. Hence, we compare measurements taken in the millimetre season months (May to August) between 09:00 and 12:00 h and between 15:00 and 18:00 h to measurements taken in all other months between 21:00 and 06:00 h.
A measure of what fraction of time in these periods is useful can be obtained by estimating the amount of decorrelation arising from atmospheric seeing. While the amount of decorrelation observers are prepared to accept may vary, 10% appears to be a reasonable amount which would still allow many experiments to be carried out. The corresponding rms of the path length fluctuations at a wavelength of 3.49 mm (a frequency of 86 GHz) can be calculated from Eqn (6) and is 255 μm. This value needs to be scaled to a 1 km baseline to be comparable to our measurements, requiring a typical baseline length used in millimetre observations d and an estimate for the Kolmogorov exponent. We assume d = 150 m, and use β/2 = 0.57, the median Kolmogorov exponent of all measurements taken in the months of May to August (the millimetre season). The rms of the path length fluctuations, L, then scales to

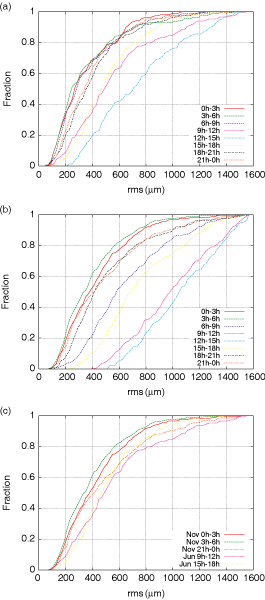
For each month, we constructed cumulative histograms of the data in each 3 h period of the day to yield the fraction of measurements below a given rms value. Samples are reproduced in Figure 5. For example, in the top panel, representing all measurements in June, the ‘9 h–12 h’ line intersects with the horizontal ‘0.6’ line at an rms of 560 μm, meaning that, statistically, between 09:00 and 12:00 h in June, the path length fluctuations are less than 560 μm for 60% of the time.
Figure 5 (a) Cumulative histogram for each 3 h bin of the day in June. (b) Cumulative histogram for each bin of the day in November. Comparing the two uppermost panels illustrates the generally better seeing conditions in winter. (c) Comparison of typical daytime conditions in June and typical nighttime conditions in November. Summer nights appear to be slightly better than winter days in this diagram.
|
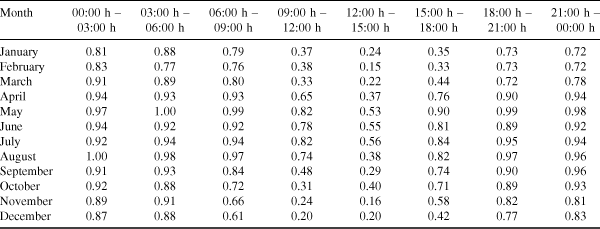
From the cumulative histograms we have obtained the fraction of measurements that lie below 750 μm. These rms values are listed in Table 1. From May to August, between 09:00 and 12:00 h and between 15:00 and 18:00 h, the mean of the fraction of measurements which are smaller than 750 μm is 0.82 ± 0.05. This means that in typical conditions on winter days, the path length fluctuations are smaller than 750 μm for 82% of the time and the decorrelation at 86 GHz on baselines of 150 m or shorter is 10% or less. In the rest of the year at night, i.e., between 21:00 and 06:00 h, the mean is 0.87 ± 0.07. Thus the likelihood of having seeing conditions suitable for millimetre observing is a little higher outside the millimetre season at night than it is in the millimetre season during the day. The effect is particularly pronounced in September, October, and April, whereas the nights of the midsummer months December and January are slightly worse than the average millimetre season days.
Table 1. Fraction of time where the rms of the path length fluctuations is smaller than 750 μm
|
We note that if the measurements taken between 12:00 and 15:00 h in the millimetre season months were taken into account, then the fraction of time during which the path length fluctuations in this period are better than 750 μm decreased to 0.71 ± 0.16. Then, nighttime observations outside the millimetre season appeared even more reasonable.
Other Considerations Affecting the Scheduling
The scheduling of observations is not only constrained by weather, but is a complex process which is influenced by many factors:
-
Array configurations required for centimetre and millimetre observations tend to be different. Millimetre observations generally require compact configurations with spacings no more than a few hundred metres whereas centimetre observations generally require extended arrays. Because the compact configurations are not of interest to centimetre observers, it is generally more efficient to schedule the compact configurations at a time when both the days and nights can be used for millimetre observations.
-
The seeing is not the only limiting factor for millimetre observations. Atmospheric opacity, a strong function of the atmosphere’s total content of water vapour, is generally higher outside the winter, and reduces the sensitivity of millimetre observations.
-
The elapsed time between 21:00 h and 06:00 h is only 9 h. This is not sufficient for a full synthesis observation unless the array is in one of the hybrid configurations, which are not frequently scheduled outside the millimetre season. Hence these times would not be suitable for imaging observations of complex structures, but might be for detection experiments or monitoring of flux densities.
Furthermore, the amount of data is still small, which makes our analysis susceptible to unusual weather conditions. For example, 2005 May was unusually dry, and 2005 June to August experienced a once-in-a-decade wet period, which may make the winter appear worse than it is on average.
Statistics of the Speed of the Phase Screen
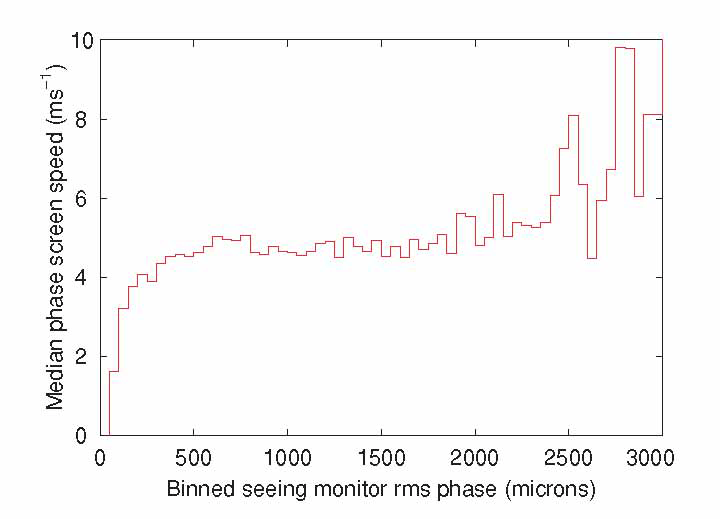
Our analysis also yields a measure for the speed of the phase screen, vs. In Figure 6, we have plotted the median value of vs as a function of the path length fluctuations, which were binned into sections 50 μm wide. One can see that while the lowest screen speeds occur at the lowest rms values, vs is remarkably constant between 500 μm and 2400 μm, above which the vs increases. The interpretation of this diagram is that the very best rms values occur when the air above the observatory is extremely still. The lowest rms phase occurs on still winter nights, when an inversion layer has formed in the atmosphere; this is reflected in the low screen speeds. On the other hand, the highest rms phase occurs during storms and this seems to be reflected in high screen speeds.
Figure 6 The speed of the phase screen as a function of seeing monitor rms phase. While the lowest and highest screen speeds are associated with very low and high rms values, respectively, the screen speed is otherwise largely independent of rms.
|
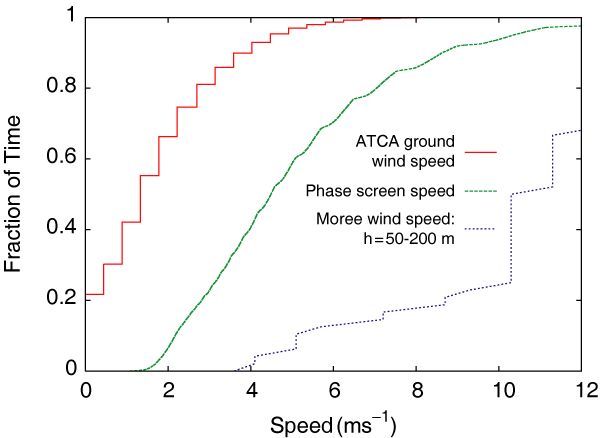
It is interesting to compare the phase screen speed with the physical wind speed both at the ground and at different heights. We have compared the phase screen speed with the median ground wind speed simultaneously measured at the ATCA weather station. However, we find no clear relationship between the two. We have also compared them in a statistical manner. Figure 7 shows cumulative histograms of the ATCA ground wind speed and the phase screen wind speed inferred from the seeing monitor. On average, the phase screen speed is greater than the ground wind speed.
Figure 7 A comparison of the cumulative histograms of the ATCA ground wind speed, the ATCA phase screen speed and the speed of the winds at Moree at a height of 50 to 200 metres above the ground. The steps in some of the curves reflect quantisation in the measurements. The jaggedness of the Moree data is accentuated because of the comparatively modest number of measurements in this height band.
|
We are not able to compare directly the phase screen speed with wind levels at different heights above the ATCA. Instead we have obtained wind readings with altitude measured by the Bureau of Meteorology’s radiosonde program at the township of Moree. Moree is approximately 100 km to the north of the ATCA, and is in a topographically similar setting. Like the ATCA, Moree lies on the western plains of NSW, with the prevailing weather normally coming from the south-west or north-west. Radiosonde measurements from 1987 to 2005 were used in the comparison. Analysis of the radiosonde data shows that the wind speed is normally comparatively low at the ground, increases significantly as soon as the radiosonde balloons leave the ground, but then remains fairly uniform with altitude up to about 2000 m above the ground. Comparison of the ground wind speed at Moree and at the ATCA shows that Moree is a somewhat windier place. However, the Moree ground wind speeds are still lower than the ATCA phase screen speeds.
Figure 7 also shows the cumulative histogram of the wind speed measured by Moree radiosondes at heights between 50 and 200 m above the ground. The speeds are significantly higher than the ground wind speed or the phase screen speeds. As the phase screen speed behaviour is more similar to the ground wind speed, it suggests that the phase screen is close to the ground.
This conclusion is consistent with an excess amount of water vapour seen in the Moree radiosonde measurements: whereas models of water vapour content usually suggest that water vapour concentration falls off exponentially with a scale height of ∼2 km, the Moree radiosonde data show an extra component close to the ground.
Statistics of the Kolmogorov Exponent
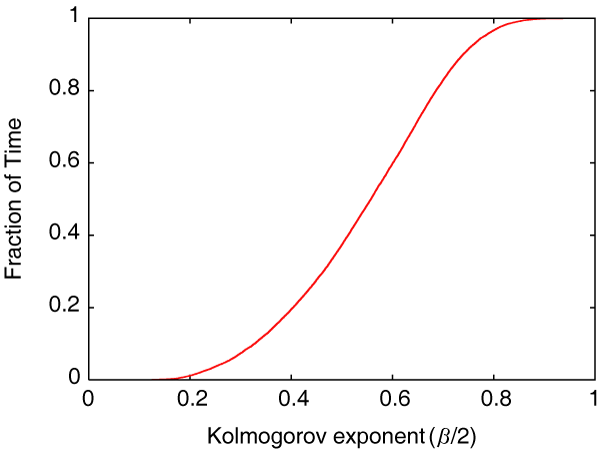
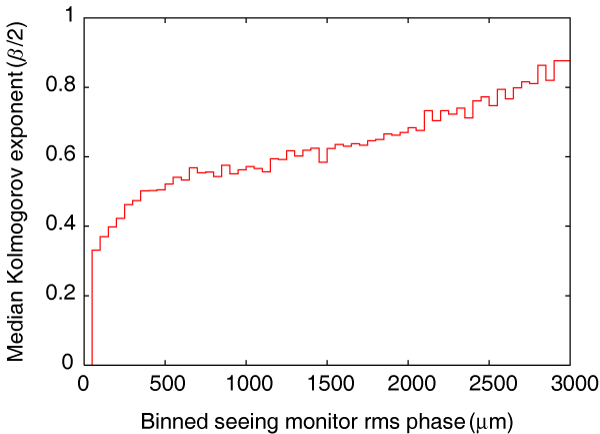
Figures 8 and 9 show the Kolmogorov exponent, β/2 as a cumulative histogram and versus rms phase, respectively. The latter figure gives the median value binned in the same fashion as described in the previous section. The figures show that in the best seeing conditions β/2 is 0.4 or even a bit lower, and so is near the value of 1/3 expected for two-dimensional turbulence. The exponent then rises gently with increasing rms phase, and reaches a value of a bit over 0.8 in the worst seeing conditions. A Kolmogorov exponent of 5/6 = 0.83 is expected in the case of three-dimensional turbulence. The median Kolmogorov exponent in our data is 0.56. This suggests that conditions are in a transition domain between three- and two-dimensional turbulence, and implies that the phase screen depth is comparable to the baseline length of 230 m.
Figure 8 A cumulative histogram of the Kolmogorov exponent, β/2.
|
Figure 9 The Kolmogorov exponent, β/2 as a function of seeing monitor rms phase.
|
We have presented a description of the ATCA’s seeing monitor along with an analysis of 21 months of data. The main conclusions of this analysis are that:
-
the seeing conditions on summer nights are not substantially different from those on winter days;
-
the turbulence seems to be concentrated quite near the ground; and
-
the turbulence appears to be in transition between being described by two- and three-dimensional models. This suggests that the turbulent layer is comparable to the seeing monitor baseline length.
The last two points build a consistent picture of the turbulence being substantially confined to a layer in the lower ∼50–100 m of the atmosphere where the interaction with the ground is likely to be strongest.
References
Hiriart,
D., Valdez,
J., Zaca,
P., & Medina,
J. L. 2002, PASP, 114, 1150
An error has occurred in (ref id="R1").
Variable LPAGE is undefined. [empty string]
| array
|
|---|
| 1 |
| struct |
|---|
| COLUMN |
0
|
| ID |
??
|
| LINE |
241
|
| RAW_TRACE |
at cfincludeJournalRef_B2ecfm1510229986._factor10(G:\www\publishha\app\views\journal\includeJournalRef_B.cfm:241)
|
| TEMPLATE |
G:\www\publishha\app\views\journal\includeJournalRef_B.cfm
|
| TYPE |
CFML
|
|
| 2 |
| struct |
|---|
| COLUMN |
0
|
| ID |
CF_INCLUDEJOURNALREF_B
|
| LINE |
180
|
| RAW_TRACE |
at cfincludeJournalRef_B2ecfm1510229986._factor12(G:\www\publishha\app\views\journal\includeJournalRef_B.cfm:180)
|
| TEMPLATE |
G:\www\publishha\app\views\journal\includeJournalRef_B.cfm
|
| TYPE |
CFML
|
|
| 3 |
| struct |
|---|
| COLUMN |
0
|
| ID |
CF_INCLUDEJOURNALREF_B
|
| LINE |
177
|
| RAW_TRACE |
at cfincludeJournalRef_B2ecfm1510229986._factor13(G:\www\publishha\app\views\journal\includeJournalRef_B.cfm:177)
|
| TEMPLATE |
G:\www\publishha\app\views\journal\includeJournalRef_B.cfm
|
| TYPE |
CFML
|
|
| 4 |
| struct |
|---|
| COLUMN |
0
|
| ID |
CF_INCLUDEJOURNALREF_B
|
| LINE |
176
|
| RAW_TRACE |
at cfincludeJournalRef_B2ecfm1510229986._factor14(G:\www\publishha\app\views\journal\includeJournalRef_B.cfm:176)
|
| TEMPLATE |
G:\www\publishha\app\views\journal\includeJournalRef_B.cfm
|
| TYPE |
CFML
|
|
| 5 |
| struct |
|---|
| COLUMN |
0
|
| ID |
CF_INCLUDEJOURNALREF_B
|
| LINE |
170
|
| RAW_TRACE |
at cfincludeJournalRef_B2ecfm1510229986._factor40(G:\www\publishha\app\views\journal\includeJournalRef_B.cfm:170)
|
| TEMPLATE |
G:\www\publishha\app\views\journal\includeJournalRef_B.cfm
|
| TYPE |
CFML
|
|
| 6 |
| struct |
|---|
| COLUMN |
0
|
| ID |
CF_INCLUDEJOURNALREF_B
|
| LINE |
15
|
| RAW_TRACE |
at cfincludeJournalRef_B2ecfm1510229986._factor41(G:\www\publishha\app\views\journal\includeJournalRef_B.cfm:15)
|
| TEMPLATE |
G:\www\publishha\app\views\journal\includeJournalRef_B.cfm
|
| TYPE |
CFML
|
|
| 7 |
| struct |
|---|
| COLUMN |
0
|
| ID |
CF_INCLUDEJOURNALREF_B
|
| LINE |
12
|
| RAW_TRACE |
at cfincludeJournalRef_B2ecfm1510229986._factor42(G:\www\publishha\app\views\journal\includeJournalRef_B.cfm:12)
|
| TEMPLATE |
G:\www\publishha\app\views\journal\includeJournalRef_B.cfm
|
| TYPE |
CFML
|
|
| 8 |
| struct |
|---|
| COLUMN |
0
|
| ID |
CF_INCLUDEJOURNALREF_B
|
| LINE |
11
|
| RAW_TRACE |
at cfincludeJournalRef_B2ecfm1510229986._factor43(G:\www\publishha\app\views\journal\includeJournalRef_B.cfm:11)
|
| TEMPLATE |
G:\www\publishha\app\views\journal\includeJournalRef_B.cfm
|
| TYPE |
CFML
|
|
| 9 |
| struct |
|---|
| COLUMN |
0
|
| ID |
CF_INCLUDEJOURNALREF_B
|
| LINE |
1
|
| RAW_TRACE |
at cfincludeJournalRef_B2ecfm1510229986.runPage(G:\www\publishha\app\views\journal\includeJournalRef_B.cfm:1)
|
| TEMPLATE |
G:\www\publishha\app\views\journal\includeJournalRef_B.cfm
|
| TYPE |
CFML
|
|
| 10 |
| struct |
|---|
| COLUMN |
0
|
| ID |
CFINCLUDE
|
| LINE |
3230
|
| RAW_TRACE |
at cfArticle2ecfc1291681887$funcREFERENCESDTD1._factor150(G:\www\publishha\app\modules\journal\Article.cfc:3230)
|
| TEMPLATE |
G:\www\publishha\app\modules\journal\Article.cfc
|
| TYPE |
CFML
|
|
| 11 |
| struct |
|---|
| COLUMN |
0
|
| ID |
CF_ARTICLE
|
| LINE |
3217
|
| RAW_TRACE |
at cfArticle2ecfc1291681887$funcREFERENCESDTD1._factor151(G:\www\publishha\app\modules\journal\Article.cfc:3217)
|
| TEMPLATE |
G:\www\publishha\app\modules\journal\Article.cfc
|
| TYPE |
CFML
|
|
| 12 |
| struct |
|---|
| COLUMN |
0
|
| ID |
CF_ARTICLE
|
| LINE |
3216
|
| RAW_TRACE |
at cfArticle2ecfc1291681887$funcREFERENCESDTD1.runFunction(G:\www\publishha\app\modules\journal\Article.cfc:3216)
|
| TEMPLATE |
G:\www\publishha\app\modules\journal\Article.cfc
|
| TYPE |
CFML
|
|
| 13 |
| struct |
|---|
| COLUMN |
0
|
| ID |
CF_TEMPLATEPROXY
|
| LINE |
2938
|
| RAW_TRACE |
at cfArticle2ecfc1291681887$funcBACKSECTIONSDTD1.runFunction(G:\www\publishha\app\modules\journal\Article.cfc:2938)
|
| TEMPLATE |
G:\www\publishha\app\modules\journal\Article.cfc
|
| TYPE |
CFML
|
|
| 14 |
| struct |
|---|
| COLUMN |
0
|
| ID |
CF_TEMPLATEPROXY
|
| LINE |
146
|
| RAW_TRACE |
at cfgenArticleContent2ecfm782833447._factor5(G:\www\publishha\app\views\journal\generator\genArticleContent.cfm:146)
|
| TEMPLATE |
G:\www\publishha\app\views\journal\generator\genArticleContent.cfm
|
| TYPE |
CFML
|
|
| 15 |
| struct |
|---|
| COLUMN |
0
|
| ID |
CF_GENARTICLECONTENT
|
| LINE |
1
|
| RAW_TRACE |
at cfgenArticleContent2ecfm782833447._factor6(G:\www\publishha\app\views\journal\generator\genArticleContent.cfm:1)
|
| TEMPLATE |
G:\www\publishha\app\views\journal\generator\genArticleContent.cfm
|
| TYPE |
CFML
|
|
| 16 |
| struct |
|---|
| COLUMN |
0
|
| ID |
CF_GENARTICLECONTENT
|
| LINE |
1
|
| RAW_TRACE |
at cfgenArticleContent2ecfm782833447.runPage(G:\www\publishha\app\views\journal\generator\genArticleContent.cfm:1)
|
| TEMPLATE |
G:\www\publishha\app\views\journal\generator\genArticleContent.cfm
|
| TYPE |
CFML
|
|
| 17 |
| struct |
|---|
| COLUMN |
0
|
| ID |
CFINCLUDE
|
| LINE |
10
|
| RAW_TRACE |
at cfStaticPageLayout2ecfm1426351739.runPage(G:\www\publishha\app\views\layout\StaticPageLayout.cfm:10)
|
| TEMPLATE |
G:\www\publishha\app\views\layout\StaticPageLayout.cfm
|
| TYPE |
CFML
|
|
| 18 |
| struct |
|---|
| COLUMN |
0
|
| ID |
CFINCLUDE
|
| LINE |
30
|
| RAW_TRACE |
at cfCacheController2ecfc639388092$funcRENDERLAYOUT.runFunction(G:\www\publishha\app\controller\CacheController.cfc:30)
|
| TEMPLATE |
G:\www\publishha\app\controller\CacheController.cfc
|
| TYPE |
CFML
|
|
| 19 |
| struct |
|---|
| COLUMN |
0
|
| ID |
CF_UDFMETHOD
|
| LINE |
241
|
| RAW_TRACE |
at cfCacheController2ecfc639388092$funcGENARTICLECONTENT.runFunction(G:\www\publishha\app\controller\CacheController.cfc:241)
|
| TEMPLATE |
G:\www\publishha\app\controller\CacheController.cfc
|
| TYPE |
CFML
|
|
| 20 |
| struct |
|---|
| COLUMN |
0
|
| ID |
CF_UDFMETHOD
|
| LINE |
327
|
| RAW_TRACE |
at cfCacheController2ecfc639388092$funcGENARTICLE.runFunction(G:\www\publishha\app\controller\CacheController.cfc:327)
|
| TEMPLATE |
G:\www\publishha\app\controller\CacheController.cfc
|
| TYPE |
CFML
|
|
| 21 |
| struct |
|---|
| COLUMN |
0
|
| ID |
CF_UDFMETHOD
|
| LINE |
39
|
| RAW_TRACE |
at cfCacheController2ecfc639388092$funcGENCACHE.runFunction(G:\www\publishha\app\controller\CacheController.cfc:39)
|
| TEMPLATE |
G:\www\publishha\app\controller\CacheController.cfc
|
| TYPE |
CFML
|
|
| 22 |
| struct |
|---|
| COLUMN |
0
|
| ID |
CF_CFPAGE
|
| LINE |
634
|
| RAW_TRACE |
at cfPublishingApp2ecfc536529069$funcPROCESSREQUEST.runFunction(G:\www\publishha\app\PublishingApp.cfc:634)
|
| TEMPLATE |
G:\www\publishha\app\PublishingApp.cfc
|
| TYPE |
CFML
|
|
| 23 |
| struct |
|---|
| COLUMN |
0
|
| ID |
CF_TEMPLATEPROXY
|
| LINE |
16
|
| RAW_TRACE |
at cfBootstrap2ecfc660975501$funcHANDLEREQUEST.runFunction(G:\www\publishha\app\Bootstrap.cfc:16)
|
| TEMPLATE |
G:\www\publishha\app\Bootstrap.cfc
|
| TYPE |
CFML
|
|
| 24 |
| struct |
|---|
| COLUMN |
0
|
| ID |
CF_TEMPLATEPROXY
|
| LINE |
18
|
| RAW_TRACE |
at cfApplication2ecfc757760907$funcONREQUESTSTART.runFunction(G:\www\publishha\webroot\Application.cfc:18)
|
| TEMPLATE |
G:\www\publishha\webroot\Application.cfc
|
| TYPE |
CFML
|
|
Holdaway,
M. A., Radford,
S. J. E., Owen,
F. N., & Foster,
S. M. 1995, MMA memo series, 129
An error has occurred in (ref id="R2").
Variable LPAGE is undefined. [empty string]
| array
|
|---|
| 1 |
| struct |
|---|
| COLUMN |
0
|
| ID |
??
|
| LINE |
243
|
| RAW_TRACE |
at cfincludeJournalRef_B2ecfm1510229986._factor10(G:\www\publishha\app\views\journal\includeJournalRef_B.cfm:243)
|
| TEMPLATE |
G:\www\publishha\app\views\journal\includeJournalRef_B.cfm
|
| TYPE |
CFML
|
|
| 2 |
| struct |
|---|
| COLUMN |
0
|
| ID |
CF_INCLUDEJOURNALREF_B
|
| LINE |
180
|
| RAW_TRACE |
at cfincludeJournalRef_B2ecfm1510229986._factor12(G:\www\publishha\app\views\journal\includeJournalRef_B.cfm:180)
|
| TEMPLATE |
G:\www\publishha\app\views\journal\includeJournalRef_B.cfm
|
| TYPE |
CFML
|
|
| 3 |
| struct |
|---|
| COLUMN |
0
|
| ID |
CF_INCLUDEJOURNALREF_B
|
| LINE |
177
|
| RAW_TRACE |
at cfincludeJournalRef_B2ecfm1510229986._factor13(G:\www\publishha\app\views\journal\includeJournalRef_B.cfm:177)
|
| TEMPLATE |
G:\www\publishha\app\views\journal\includeJournalRef_B.cfm
|
| TYPE |
CFML
|
|
| 4 |
| struct |
|---|
| COLUMN |
0
|
| ID |
CF_INCLUDEJOURNALREF_B
|
| LINE |
176
|
| RAW_TRACE |
at cfincludeJournalRef_B2ecfm1510229986._factor14(G:\www\publishha\app\views\journal\includeJournalRef_B.cfm:176)
|
| TEMPLATE |
G:\www\publishha\app\views\journal\includeJournalRef_B.cfm
|
| TYPE |
CFML
|
|
| 5 |
| struct |
|---|
| COLUMN |
0
|
| ID |
CF_INCLUDEJOURNALREF_B
|
| LINE |
170
|
| RAW_TRACE |
at cfincludeJournalRef_B2ecfm1510229986._factor40(G:\www\publishha\app\views\journal\includeJournalRef_B.cfm:170)
|
| TEMPLATE |
G:\www\publishha\app\views\journal\includeJournalRef_B.cfm
|
| TYPE |
CFML
|
|
| 6 |
| struct |
|---|
| COLUMN |
0
|
| ID |
CF_INCLUDEJOURNALREF_B
|
| LINE |
15
|
| RAW_TRACE |
at cfincludeJournalRef_B2ecfm1510229986._factor41(G:\www\publishha\app\views\journal\includeJournalRef_B.cfm:15)
|
| TEMPLATE |
G:\www\publishha\app\views\journal\includeJournalRef_B.cfm
|
| TYPE |
CFML
|
|
| 7 |
| struct |
|---|
| COLUMN |
0
|
| ID |
CF_INCLUDEJOURNALREF_B
|
| LINE |
12
|
| RAW_TRACE |
at cfincludeJournalRef_B2ecfm1510229986._factor42(G:\www\publishha\app\views\journal\includeJournalRef_B.cfm:12)
|
| TEMPLATE |
G:\www\publishha\app\views\journal\includeJournalRef_B.cfm
|
| TYPE |
CFML
|
|
| 8 |
| struct |
|---|
| COLUMN |
0
|
| ID |
CF_INCLUDEJOURNALREF_B
|
| LINE |
11
|
| RAW_TRACE |
at cfincludeJournalRef_B2ecfm1510229986._factor43(G:\www\publishha\app\views\journal\includeJournalRef_B.cfm:11)
|
| TEMPLATE |
G:\www\publishha\app\views\journal\includeJournalRef_B.cfm
|
| TYPE |
CFML
|
|
| 9 |
| struct |
|---|
| COLUMN |
0
|
| ID |
CF_INCLUDEJOURNALREF_B
|
| LINE |
1
|
| RAW_TRACE |
at cfincludeJournalRef_B2ecfm1510229986.runPage(G:\www\publishha\app\views\journal\includeJournalRef_B.cfm:1)
|
| TEMPLATE |
G:\www\publishha\app\views\journal\includeJournalRef_B.cfm
|
| TYPE |
CFML
|
|
| 10 |
| struct |
|---|
| COLUMN |
0
|
| ID |
CFINCLUDE
|
| LINE |
3230
|
| RAW_TRACE |
at cfArticle2ecfc1291681887$funcREFERENCESDTD1._factor150(G:\www\publishha\app\modules\journal\Article.cfc:3230)
|
| TEMPLATE |
G:\www\publishha\app\modules\journal\Article.cfc
|
| TYPE |
CFML
|
|
| 11 |
| struct |
|---|
| COLUMN |
0
|
| ID |
CF_ARTICLE
|
| LINE |
3217
|
| RAW_TRACE |
at cfArticle2ecfc1291681887$funcREFERENCESDTD1._factor151(G:\www\publishha\app\modules\journal\Article.cfc:3217)
|
| TEMPLATE |
G:\www\publishha\app\modules\journal\Article.cfc
|
| TYPE |
CFML
|
|
| 12 |
| struct |
|---|
| COLUMN |
0
|
| ID |
CF_ARTICLE
|
| LINE |
3216
|
| RAW_TRACE |
at cfArticle2ecfc1291681887$funcREFERENCESDTD1.runFunction(G:\www\publishha\app\modules\journal\Article.cfc:3216)
|
| TEMPLATE |
G:\www\publishha\app\modules\journal\Article.cfc
|
| TYPE |
CFML
|
|
| 13 |
| struct |
|---|
| COLUMN |
0
|
| ID |
CF_TEMPLATEPROXY
|
| LINE |
2938
|
| RAW_TRACE |
at cfArticle2ecfc1291681887$funcBACKSECTIONSDTD1.runFunction(G:\www\publishha\app\modules\journal\Article.cfc:2938)
|
| TEMPLATE |
G:\www\publishha\app\modules\journal\Article.cfc
|
| TYPE |
CFML
|
|
| 14 |
| struct |
|---|
| COLUMN |
0
|
| ID |
CF_TEMPLATEPROXY
|
| LINE |
146
|
| RAW_TRACE |
at cfgenArticleContent2ecfm782833447._factor5(G:\www\publishha\app\views\journal\generator\genArticleContent.cfm:146)
|
| TEMPLATE |
G:\www\publishha\app\views\journal\generator\genArticleContent.cfm
|
| TYPE |
CFML
|
|
| 15 |
| struct |
|---|
| COLUMN |
0
|
| ID |
CF_GENARTICLECONTENT
|
| LINE |
1
|
| RAW_TRACE |
at cfgenArticleContent2ecfm782833447._factor6(G:\www\publishha\app\views\journal\generator\genArticleContent.cfm:1)
|
| TEMPLATE |
G:\www\publishha\app\views\journal\generator\genArticleContent.cfm
|
| TYPE |
CFML
|
|
| 16 |
| struct |
|---|
| COLUMN |
0
|
| ID |
CF_GENARTICLECONTENT
|
| LINE |
1
|
| RAW_TRACE |
at cfgenArticleContent2ecfm782833447.runPage(G:\www\publishha\app\views\journal\generator\genArticleContent.cfm:1)
|
| TEMPLATE |
G:\www\publishha\app\views\journal\generator\genArticleContent.cfm
|
| TYPE |
CFML
|
|
| 17 |
| struct |
|---|
| COLUMN |
0
|
| ID |
CFINCLUDE
|
| LINE |
10
|
| RAW_TRACE |
at cfStaticPageLayout2ecfm1426351739.runPage(G:\www\publishha\app\views\layout\StaticPageLayout.cfm:10)
|
| TEMPLATE |
G:\www\publishha\app\views\layout\StaticPageLayout.cfm
|
| TYPE |
CFML
|
|
| 18 |
| struct |
|---|
| COLUMN |
0
|
| ID |
CFINCLUDE
|
| LINE |
30
|
| RAW_TRACE |
at cfCacheController2ecfc639388092$funcRENDERLAYOUT.runFunction(G:\www\publishha\app\controller\CacheController.cfc:30)
|
| TEMPLATE |
G:\www\publishha\app\controller\CacheController.cfc
|
| TYPE |
CFML
|
|
| 19 |
| struct |
|---|
| COLUMN |
0
|
| ID |
CF_UDFMETHOD
|
| LINE |
241
|
| RAW_TRACE |
at cfCacheController2ecfc639388092$funcGENARTICLECONTENT.runFunction(G:\www\publishha\app\controller\CacheController.cfc:241)
|
| TEMPLATE |
G:\www\publishha\app\controller\CacheController.cfc
|
| TYPE |
CFML
|
|
| 20 |
| struct |
|---|
| COLUMN |
0
|
| ID |
CF_UDFMETHOD
|
| LINE |
327
|
| RAW_TRACE |
at cfCacheController2ecfc639388092$funcGENARTICLE.runFunction(G:\www\publishha\app\controller\CacheController.cfc:327)
|
| TEMPLATE |
G:\www\publishha\app\controller\CacheController.cfc
|
| TYPE |
CFML
|
|
| 21 |
| struct |
|---|
| COLUMN |
0
|
| ID |
CF_UDFMETHOD
|
| LINE |
39
|
| RAW_TRACE |
at cfCacheController2ecfc639388092$funcGENCACHE.runFunction(G:\www\publishha\app\controller\CacheController.cfc:39)
|
| TEMPLATE |
G:\www\publishha\app\controller\CacheController.cfc
|
| TYPE |
CFML
|
|
| 22 |
| struct |
|---|
| COLUMN |
0
|
| ID |
CF_CFPAGE
|
| LINE |
634
|
| RAW_TRACE |
at cfPublishingApp2ecfc536529069$funcPROCESSREQUEST.runFunction(G:\www\publishha\app\PublishingApp.cfc:634)
|
| TEMPLATE |
G:\www\publishha\app\PublishingApp.cfc
|
| TYPE |
CFML
|
|
| 23 |
| struct |
|---|
| COLUMN |
0
|
| ID |
CF_TEMPLATEPROXY
|
| LINE |
16
|
| RAW_TRACE |
at cfBootstrap2ecfc660975501$funcHANDLEREQUEST.runFunction(G:\www\publishha\app\Bootstrap.cfc:16)
|
| TEMPLATE |
G:\www\publishha\app\Bootstrap.cfc
|
| TYPE |
CFML
|
|
| 24 |
| struct |
|---|
| COLUMN |
0
|
| ID |
CF_TEMPLATEPROXY
|
| LINE |
18
|
| RAW_TRACE |
at cfApplication2ecfc757760907$funcONREQUESTSTART.runFunction(G:\www\publishha\webroot\Application.cfc:18)
|
| TEMPLATE |
G:\www\publishha\webroot\Application.cfc
|
| TYPE |
CFML
|
|
Masson, C. R. 1994, In ASP Conf. Ser. 59: IAU Colloq. 140: Astronomy with Millimeter and Submillimeter Wave Interferometry, ed. M. Ishiguro & J. Welch, 87
Radford,
S. J. E., Reiland,
G., & Shillue,
B. 1996, PASP, 108, 441
An error has occurred in (ref id="R4").
Variable LPAGE is undefined. [empty string]
| array
|
|---|
| 1 |
| struct |
|---|
| COLUMN |
0
|
| ID |
??
|
| LINE |
241
|
| RAW_TRACE |
at cfincludeJournalRef_B2ecfm1510229986._factor10(G:\www\publishha\app\views\journal\includeJournalRef_B.cfm:241)
|
| TEMPLATE |
G:\www\publishha\app\views\journal\includeJournalRef_B.cfm
|
| TYPE |
CFML
|
|
| 2 |
| struct |
|---|
| COLUMN |
0
|
| ID |
CF_INCLUDEJOURNALREF_B
|
| LINE |
180
|
| RAW_TRACE |
at cfincludeJournalRef_B2ecfm1510229986._factor12(G:\www\publishha\app\views\journal\includeJournalRef_B.cfm:180)
|
| TEMPLATE |
G:\www\publishha\app\views\journal\includeJournalRef_B.cfm
|
| TYPE |
CFML
|
|
| 3 |
| struct |
|---|
| COLUMN |
0
|
| ID |
CF_INCLUDEJOURNALREF_B
|
| LINE |
177
|
| RAW_TRACE |
at cfincludeJournalRef_B2ecfm1510229986._factor13(G:\www\publishha\app\views\journal\includeJournalRef_B.cfm:177)
|
| TEMPLATE |
G:\www\publishha\app\views\journal\includeJournalRef_B.cfm
|
| TYPE |
CFML
|
|
| 4 |
| struct |
|---|
| COLUMN |
0
|
| ID |
CF_INCLUDEJOURNALREF_B
|
| LINE |
176
|
| RAW_TRACE |
at cfincludeJournalRef_B2ecfm1510229986._factor14(G:\www\publishha\app\views\journal\includeJournalRef_B.cfm:176)
|
| TEMPLATE |
G:\www\publishha\app\views\journal\includeJournalRef_B.cfm
|
| TYPE |
CFML
|
|
| 5 |
| struct |
|---|
| COLUMN |
0
|
| ID |
CF_INCLUDEJOURNALREF_B
|
| LINE |
170
|
| RAW_TRACE |
at cfincludeJournalRef_B2ecfm1510229986._factor40(G:\www\publishha\app\views\journal\includeJournalRef_B.cfm:170)
|
| TEMPLATE |
G:\www\publishha\app\views\journal\includeJournalRef_B.cfm
|
| TYPE |
CFML
|
|
| 6 |
| struct |
|---|
| COLUMN |
0
|
| ID |
CF_INCLUDEJOURNALREF_B
|
| LINE |
15
|
| RAW_TRACE |
at cfincludeJournalRef_B2ecfm1510229986._factor41(G:\www\publishha\app\views\journal\includeJournalRef_B.cfm:15)
|
| TEMPLATE |
G:\www\publishha\app\views\journal\includeJournalRef_B.cfm
|
| TYPE |
CFML
|
|
| 7 |
| struct |
|---|
| COLUMN |
0
|
| ID |
CF_INCLUDEJOURNALREF_B
|
| LINE |
12
|
| RAW_TRACE |
at cfincludeJournalRef_B2ecfm1510229986._factor42(G:\www\publishha\app\views\journal\includeJournalRef_B.cfm:12)
|
| TEMPLATE |
G:\www\publishha\app\views\journal\includeJournalRef_B.cfm
|
| TYPE |
CFML
|
|
| 8 |
| struct |
|---|
| COLUMN |
0
|
| ID |
CF_INCLUDEJOURNALREF_B
|
| LINE |
11
|
| RAW_TRACE |
at cfincludeJournalRef_B2ecfm1510229986._factor43(G:\www\publishha\app\views\journal\includeJournalRef_B.cfm:11)
|
| TEMPLATE |
G:\www\publishha\app\views\journal\includeJournalRef_B.cfm
|
| TYPE |
CFML
|
|
| 9 |
| struct |
|---|
| COLUMN |
0
|
| ID |
CF_INCLUDEJOURNALREF_B
|
| LINE |
1
|
| RAW_TRACE |
at cfincludeJournalRef_B2ecfm1510229986.runPage(G:\www\publishha\app\views\journal\includeJournalRef_B.cfm:1)
|
| TEMPLATE |
G:\www\publishha\app\views\journal\includeJournalRef_B.cfm
|
| TYPE |
CFML
|
|
| 10 |
| struct |
|---|
| COLUMN |
0
|
| ID |
CFINCLUDE
|
| LINE |
3230
|
| RAW_TRACE |
at cfArticle2ecfc1291681887$funcREFERENCESDTD1._factor150(G:\www\publishha\app\modules\journal\Article.cfc:3230)
|
| TEMPLATE |
G:\www\publishha\app\modules\journal\Article.cfc
|
| TYPE |
CFML
|
|
| 11 |
| struct |
|---|
| COLUMN |
0
|
| ID |
CF_ARTICLE
|
| LINE |
3217
|
| RAW_TRACE |
at cfArticle2ecfc1291681887$funcREFERENCESDTD1._factor151(G:\www\publishha\app\modules\journal\Article.cfc:3217)
|
| TEMPLATE |
G:\www\publishha\app\modules\journal\Article.cfc
|
| TYPE |
CFML
|
|
| 12 |
| struct |
|---|
| COLUMN |
0
|
| ID |
CF_ARTICLE
|
| LINE |
3216
|
| RAW_TRACE |
at cfArticle2ecfc1291681887$funcREFERENCESDTD1.runFunction(G:\www\publishha\app\modules\journal\Article.cfc:3216)
|
| TEMPLATE |
G:\www\publishha\app\modules\journal\Article.cfc
|
| TYPE |
CFML
|
|
| 13 |
| struct |
|---|
| COLUMN |
0
|
| ID |
CF_TEMPLATEPROXY
|
| LINE |
2938
|
| RAW_TRACE |
at cfArticle2ecfc1291681887$funcBACKSECTIONSDTD1.runFunction(G:\www\publishha\app\modules\journal\Article.cfc:2938)
|
| TEMPLATE |
G:\www\publishha\app\modules\journal\Article.cfc
|
| TYPE |
CFML
|
|
| 14 |
| struct |
|---|
| COLUMN |
0
|
| ID |
CF_TEMPLATEPROXY
|
| LINE |
146
|
| RAW_TRACE |
at cfgenArticleContent2ecfm782833447._factor5(G:\www\publishha\app\views\journal\generator\genArticleContent.cfm:146)
|
| TEMPLATE |
G:\www\publishha\app\views\journal\generator\genArticleContent.cfm
|
| TYPE |
CFML
|
|
| 15 |
| struct |
|---|
| COLUMN |
0
|
| ID |
CF_GENARTICLECONTENT
|
| LINE |
1
|
| RAW_TRACE |
at cfgenArticleContent2ecfm782833447._factor6(G:\www\publishha\app\views\journal\generator\genArticleContent.cfm:1)
|
| TEMPLATE |
G:\www\publishha\app\views\journal\generator\genArticleContent.cfm
|
| TYPE |
CFML
|
|
| 16 |
| struct |
|---|
| COLUMN |
0
|
| ID |
CF_GENARTICLECONTENT
|
| LINE |
1
|
| RAW_TRACE |
at cfgenArticleContent2ecfm782833447.runPage(G:\www\publishha\app\views\journal\generator\genArticleContent.cfm:1)
|
| TEMPLATE |
G:\www\publishha\app\views\journal\generator\genArticleContent.cfm
|
| TYPE |
CFML
|
|
| 17 |
| struct |
|---|
| COLUMN |
0
|
| ID |
CFINCLUDE
|
| LINE |
10
|
| RAW_TRACE |
at cfStaticPageLayout2ecfm1426351739.runPage(G:\www\publishha\app\views\layout\StaticPageLayout.cfm:10)
|
| TEMPLATE |
G:\www\publishha\app\views\layout\StaticPageLayout.cfm
|
| TYPE |
CFML
|
|
| 18 |
| struct |
|---|
| COLUMN |
0
|
| ID |
CFINCLUDE
|
| LINE |
30
|
| RAW_TRACE |
at cfCacheController2ecfc639388092$funcRENDERLAYOUT.runFunction(G:\www\publishha\app\controller\CacheController.cfc:30)
|
| TEMPLATE |
G:\www\publishha\app\controller\CacheController.cfc
|
| TYPE |
CFML
|
|
| 19 |
| struct |
|---|
| COLUMN |
0
|
| ID |
CF_UDFMETHOD
|
| LINE |
241
|
| RAW_TRACE |
at cfCacheController2ecfc639388092$funcGENARTICLECONTENT.runFunction(G:\www\publishha\app\controller\CacheController.cfc:241)
|
| TEMPLATE |
G:\www\publishha\app\controller\CacheController.cfc
|
| TYPE |
CFML
|
|
| 20 |
| struct |
|---|
| COLUMN |
0
|
| ID |
CF_UDFMETHOD
|
| LINE |
327
|
| RAW_TRACE |
at cfCacheController2ecfc639388092$funcGENARTICLE.runFunction(G:\www\publishha\app\controller\CacheController.cfc:327)
|
| TEMPLATE |
G:\www\publishha\app\controller\CacheController.cfc
|
| TYPE |
CFML
|
|
| 21 |
| struct |
|---|
| COLUMN |
0
|
| ID |
CF_UDFMETHOD
|
| LINE |
39
|
| RAW_TRACE |
at cfCacheController2ecfc639388092$funcGENCACHE.runFunction(G:\www\publishha\app\controller\CacheController.cfc:39)
|
| TEMPLATE |
G:\www\publishha\app\controller\CacheController.cfc
|
| TYPE |
CFML
|
|
| 22 |
| struct |
|---|
| COLUMN |
0
|
| ID |
CF_CFPAGE
|
| LINE |
634
|
| RAW_TRACE |
at cfPublishingApp2ecfc536529069$funcPROCESSREQUEST.runFunction(G:\www\publishha\app\PublishingApp.cfc:634)
|
| TEMPLATE |
G:\www\publishha\app\PublishingApp.cfc
|
| TYPE |
CFML
|
|
| 23 |
| struct |
|---|
| COLUMN |
0
|
| ID |
CF_TEMPLATEPROXY
|
| LINE |
16
|
| RAW_TRACE |
at cfBootstrap2ecfc660975501$funcHANDLEREQUEST.runFunction(G:\www\publishha\app\Bootstrap.cfc:16)
|
| TEMPLATE |
G:\www\publishha\app\Bootstrap.cfc
|
| TYPE |
CFML
|
|
| 24 |
| struct |
|---|
| COLUMN |
0
|
| ID |
CF_TEMPLATEPROXY
|
| LINE |
18
|
| RAW_TRACE |
at cfApplication2ecfc757760907$funcONREQUESTSTART.runFunction(G:\www\publishha\webroot\Application.cfc:18)
|
| TEMPLATE |
G:\www\publishha\webroot\Application.cfc
|
| TYPE |
CFML
|
|
Thompson, A. R., Moran, J. M., & Swenson, G. W. 2001, Interferometry and synthesis in radio astronomy 2nd ed., New York, Wiley-Interscience
Appendix A: Decorrelation of Interferometer Measurements due to Atmospheric Seeing
The expectation value for visibility measurements of a two-element interferometer,  Vm
Vm , is related to the true visibilities, V, by
(Thompson et al. 2001, eqn 13.81), where σφ denotes Gaussian-distributed random phase fluctuations. Random phase errors of 30° therefore lead to a degradation in observed visibility amplitude to 87% of the true value. Phase errors arising from water vapour scale linearly with frequency, and hence to convert seeing monitor readings into a phase rms one can write
where λ is the wavelength observed, and L is the rms of the path length fluctuations. Decorrelation is also a function of the projected baseline length, d, and the structure of the atmospheric turbulence. For short baselines, the tropospheric water vapour fluctuations can be described as three-dimensional Kolomogorov turbulence, where the amplitude of the turbulence scales with the size of the turbulence cells as β/2 = 5/6, such that
where the 230 m is the baseline length of the seeing monitor. Letting V = 1 and solving for L as a function of  Vm
Vm , gives


![]() Vm
Vm![]() , is related to the true visibilities, V, by
, is related to the true visibilities, V, by


![]() Vm
Vm![]() , gives
, gives


