

GPS-derived foraging behaviour of red deer and liveweight gain of red deer and wapiti crossbred sire lines on contrasting winter forage types
B. R. Thompson A * , D. R. Stevens A , C. Bennett A , K. T. O’Neill A , P. Miller B , P. Green B and J. F. Ward A
A AgResearch Invermay, Invermay Agricultural Centre, 176 Puddle Alley, Private Bag 50034, Mosgiel 9053, New Zealand.
B AgResearch Grasslands, Grasslands Research Centre, Tennent Drive, Private Bag 11008, Palmerston North 4442, New Zealand.
Animal Production Science 63(16) 1679-1686 https://doi.org/10.1071/AN22420
Submitted: 10 November 2022 Accepted: 27 May 2023 Published: 15 June 2023
Abstract
It is common practice to manage red deer on highly digestible easily harvested forage during winter on New Zealand deer farms, particularly in areas that experience low or no pasture growth during this period. However, not all individuals within these production systems perform equally.
To investigate foraging behaviour of young red deer and liveweight gain of young red deer and wapiti crossbred sire lines when offered two contrasting winter forage diets.
One hundred and sixty-three rising 1-year-old female red deer and red deer wapiti crossbreds representing five red deer and two wapiti sires, were split into two management groups balanced by sire and liveweight and managed on either an easily harvested highly digestible diet (forage kale) or a harder-to-harvest more poorly digestible diet (pasture) for a 6-week period during winter. Foraging behaviour was monitored on 95 red deer yearlings by using GPS collars over a 2-week period. Liveweights were recorded at the start and end of the 6-week period.
Progeny managed on the kale treatment exhibited an extended activity period during the dawn period and a suppressed activity period during the middle of the day. Progeny managed on the pasture treatment exhibited frequent shorter activity periods from dawn to dusk. Time spent foraging and the number of foraging bouts greater than 5 min in duration were different among progeny of different sires. These differences in behaviour did not affect liveweight gain. Liveweight gain over the 6-week trial period was significantly higher for progeny from one wapiti sire than for all red deer sire progeny while being managed on the kale diet (P < 0.001), but there were no differences among progeny on the pasture diet.
Foraging behaviour varied considerably between sire lines and appeared to vary between forage type, but there were no correlations between behaviour and liveweight gain in this trial.
Forage type offered to young red deer may alter their foraging behaviour. Offering an easier to harvest high digestible forage diet may increase liveweight gain of progeny that have a higher genetic potential to grow during the winter period.
Keywords: diurnal activity, foraging behaviour, GPS, liveweight gain, New Zealand, red deer, wapiti, winter forage.
Introduction
Southern New Zealand experiences extended periods of low or no pastoral growth during winter (Radcliffe 1974; Round-Turner et al. 1976; McNamara 1992; Dalley and Geddes 2012), which presents as a challenge for all pasture wintering systems. Consequently, many farm systems, including deer systems, utilise brassica crops that are sown in summer, to provide appropriate quantity and quality feed during the winter period. Brassica crops are generally grown as a monoculture, with animals being supplemented with conserved forage. However, not all animals perform equally on brassica crop systems, with large variations in average daily intakes experienced within and across years (Reid et al. 1994; Leanne Dillard et al. 2018). Among-year variation can occur due to differences in dry matter, plant secondary compound concentrations and climatic conditions affecting utilisation. Determining the reasons for within-year and herd variation is more difficult.
In a pasture foraging situation, ruminants are faced with a diet resource that is diverse in structure and composition (Thorhallsdottir 1990) in both horizontal and vertical planes (Casey et al. 1993; Edwards et al. 1996), due to a mixed variety of species and morphological components. This diversity allows for individuals to select a range of plant components that differ in their harvestability and nutritive value and allows for variation in preferences to be expressed. Having a forage resource that is diverse can increase feed intake (Lagrange and Villalba 2019) and has been attributed to improved animal welfare (Beck and Gregorini 2020). In a monoculture system such as a brassica crop, there is a limited ability to select a diverse diet and therefore this could potentially have detrimental impacts on some individuals. The addition of supplementary feed provides some diversity in diet choice; however, the placement and concentration of this feed resource can create a competitive foraging situation where dominant individuals may restrict access of others (Schmidt and Hoi 1999; Ceacero et al. 2012).
Behaviour and diet choice are important drivers of liveweight gain and are controlled by the complex interaction of genetics and environmental factors. Bailey et al. (2010) demonstrated that both genetics and early learning affect the expression of foraging behaviour equally. Several genetic markers have been found that explained up to 24% of the phenotypic variation in terrain use by cattle (Bailey et al. 2015) and foraging behaviour has consistently been shown to differ among breeds within a species (Bailey et al. 2001; Russell et al. 2010; Aharoni et al. 2013; Dolev et al. 2014; Nyamuryekung’e et al. 2021) and among individuals within a population of the same breed (Michelena et al. 2009; Sibbald et al. 2009; di Virgilio and Morales 2016). The variation in foraging behaviour in red deer has not been investigated in any detail; however, Wall et al. (2019) demonstrated that different individuals utilised different vegetation zones within a large herd of farmed red deer, indicating that variation in resource utilisation does occur.
The objective of this research was to determine whether behaviour of farmed red deer and liveweight gain of red deer and wapiti crossbred sire lines differed during winter when offered two contrasting feed resources in an intensive farming situation. It is hypothesised that variation in foraging behaviour and liveweight gain will occur between sire lines and among individuals within the herd and that foraging behaviour will have an impact on liveweight gain.
Materials and methods
Experimental overview
An experiment to investigate variation in foraging behaviour and liveweight gain of rising 1-year-old female deer fed on two contrasting winter feed options was undertaken at Invermay Agricultural Research Centre, (Mosgiel, New Zealand 45°58′S, 170°04′E) during July and August 2020.
All experimental procedures had prior approval from the AgResearch Invermay Animal Ethics committee (PRJ0121969), as required in New Zealand by the Animal Welfare Act 1999.
Animals and nutritional management
A cohort of 163 female red deer and wapiti crossbreds was selected from a larger group that had been bred using artificial insemination utilising semen from five red deer sires and two wapiti sires. Progeny were randomly assigned while balancing for the seven sire lines from weaning at 3 months of age, and managed on pasture in two groups (81 and 82 individuals). During the winter period, the groups were randomly designated to one of two winter feeding regimes, an autumn conserved perennial ryegrass (Lolium perenne)-dominant pasture or a monoculture crop of kale (Brassica oleracea cv ‘Kestrel’). Both feeding regimes were supplemented with ad libitum pasture baleage that was replenished on eating. The kale regime group was transitioned onto the diet over a 2-week period following industry standard practice prior to trial commencement. Once transitioned onto their diets the groups were managed for the following 6 weeks on a paddock basis (1–3 ha) with no strip grazing. This allowed natural foraging behaviour to be expressed and enough feed to meet growth requirements of at least 140 g/day, which is a higher growth rate than is commonly achieved by female rising 1-year-old red and wapiti crossbred deer during winter.
Animal liveweight was recorded at the start and finish of the 6-week trial period (excluding the 2-week transition period) to the nearest 0.5 kg by using Tru-test load cells (Datamars, Auckland, New Zealand) attached to a Prattley (Prattley Industries, Temuka, New Zealand) auto drafter and controlled with a Gallagher Tsi2 head unit (Gallagher, Hamilton, New Zealand).
Feed quality was assessed at the start of the 6-week trial period from both treatments pre-grazing. Representative samples were collected, harvesting both pasture and kale to ground level, and drying in a fan-forced oven at 65°C until a constant weight was reached. Samples were sent to Hills Laboratories, Hamilton, New Zealand, for analysis for crude protein, neutral detergent fibre, acid detergent fibre, lipid, soluble sugars and starch, and metabolisable energy by near-infrared spectrometry.
GPS technology and setup
Foraging behaviour was captured using GPS units over a 2-week period at the start of the 6-week trial period on all progeny from four red deer sire lines, except for twin progeny. The selected progeny were from two pairs of sires that had similar 12-month liveweight estimated breeding values. Due to a limited number of GPS units, they were not attached to progeny from wapiti crossbred sires and one red deer sire (unmatched for 12-month liveweight estimated breeding values). The units were developed by DataCarter Ltd (Palmerston North, New Zealand) and comprised a printed circuit board with a microcontroller, a u-blox NEO-M8Q GPS receiver and a SD card holder and were powered by a 3.6 V 19 Ah lithium thionyl chloride battery giving a recording duration of between 14 and 17 days. Units were housed in an injection moulded hard plastic casing (12 cm × 6.5 cm × 5 cm) weighing approximately 265 g and attached to adjustable nylon webbing that is fitted to the animal’s neck by using side-release clip buckles. Each collar was adjusted to optimally fit the individual animal by ensuring four fingers could fit comfortably behind the strap. The GPS units were programmed to record a location when the animal had moved more than 5 m from the previous location, or if the animal was stationary the location was recorded every 30 s. Locations were not recorded if the animal was moving at a greater speed than 20 m/s, because these were considered to be spurious GPS locations.
Behavioural-data classification
Deer foraging behaviour was estimated using two methodologies. The first method used GPS data location to calculate daily distance travelled and to inform diurnal activity patterns. The second method used a classifier algorithm that used data from a previous currently unpublished validation study (subsequently referred to as the validation study) for classifier training. The validation study recorded both GPS and accelerometer data at one observation per second. To create training data comparable to the current study, the GPS data in the validation study were downsampled to match the sampling scheme for the collars in this study (Winter GPS data). A multivariate, non-parametric changepoint algorithm (James and Matteson 2014; James et al. 2019) was applied to the downsampled validation study GPS data, so as to break the data into intervals on the basis of timestep, distance, speed, and turning angle. Within each interval, a confidence ellipse was fitted to the GPS locations, and the radii of the major and minor axes were recorded. These were used to calculate features for each interval, including a measure of (inverse) tortuosity (ratio of minor axis to major axis), a measure of area covered (area of the ellipse), and a measure of rate of area covered (area divided by duration of the interval). Average speed over the interval was also used as a feature.
Observational data from the validation study were used alongside this validation study feature data to train a decision tree (Ripley 2021), allowing each interval to be classified as ‘Foraging’, ‘Walking’, or ‘Resting’.
The same changepoint algorithm and feature engineering steps were applied to the Winter GPS data, and the trained decision tree was applied to obtain predicted behaviours.
Counting of bouts is sensitive to the choice of minimum bout length, without which there is a risk that classification errors or transient behaviours will inflate the count. In this study, we counted ‘sustained bouts’, by applying a smoothing filter to our classification output. The filter replaces the classification of bouts, which are shorter than the minimum length with the most recent sustained behaviour. The filter was run with both a 5-min and a 15-min threshold, to get a sense of the sensitivity of the analysis to the chosen threshold for a sustained bout.
Behaviour and performance analysis
Linear mixed models (Bates et al. 2015) were fit with the response variables, including daily distance, number of foraging bouts, foraging bout duration, foraging bout speed, and foraging bout distance. For the foraging bout responses, models were fitted using values calculated with both the 5-min and 15-min bout cut-off. All of these models used treatment, sire, and their interaction as fixed effects, as well as a fixed contrast for the two pasture paddocks used. Random effects for animal, for day, and for treatment nested within day were included. For one model (number of foraging bouts with 5 min cut-off) the random effect for day was removed to achieve numerical convergence.
Liveweight data were used to calculate growth rates for the 6-week mid-winter period (23 June – 7 August) after the 2-week transition period. Growth rates were analysed with a linear model for each winter forage, with sire line and starting winter liveweight as covariates. Starting and ending winter liveweights were also compared among sire lines with linear models.
Growth rates were compared to behaviours. Per-animal means were calculated for daily distance travelled, and foraging bout number, duration, speed, and distance (with both the 5-min and 15-min cut-off) for a total of nine behaviour variables. For each behaviour variable, a linear model was fit, with growth rate as response and behaviour, winter forage, sire, and all interactions as covariates. None of these nine regressions was significant, with P-values from F-test ranging from 0.14 to 0.74, so they have not been presented in the results section.
All analyses was performed in R 4.2.1 (R Core Team 2022). ANOVA was performed using the car package (Fox and Weisberg 2019), marginal means and their standard errors were calculated using the emmeans package (Lenth 2022), and post hoc comparisons among groups used the multcomp package (Hothorn et al. 2008).
Results
In total, 95 deer, 46 and 49 in the kale and pasture treatment groups respectively, from four red deer sire lines were fitted with GPS collars to capture foraging behaviour. Successful deployment with retrievable datasets occurred for 37 and 49 animals respectively for the kale and pasture treatment groups, representing 80% and 100% success rates. Due to paddock shifting of the pasture group and an unplanned disturbance of the kale group, data worth of 4 days were excluded from analysis, resulting in a 9-day data set for analysis.
GPS location data
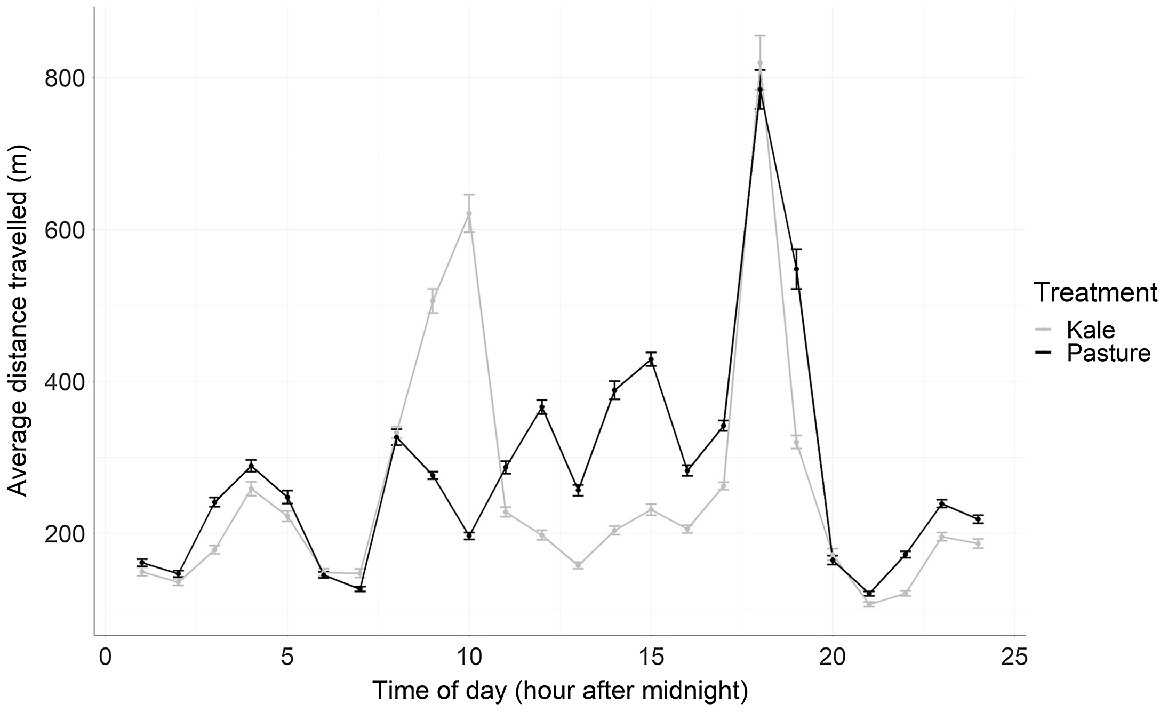
The average daily distance travelled as estimated using the GPS location on the kale treatment was 6119 m/day (±283.2 m), and 6699 m/day (±278.4 m) for the pasture treatment (Table 1). The diurnal pattern of the kale treatment group indicated two activity peaks during daylight hours at 10 h and 18 h after midnight (Fig. 1). The morning activity peak was extended over a 3-h period, with a peak of over 600 m travelled in a single hour on average per day. The evening peak was shorter but had a higher peak of travel at over 800 m per hour on average. The pasture treatment group had four activity peaks during daylight hours at 8, 12, 14, and 18 h after midnight (Fig. 1). The activity periods lasted approximately an hour on average each day, except for the midday peak, which had a 2-h average duration. The average hourly distances per day travelled during these activity periods were under 500 m, each except for the evening activity period which peaked at close to 800 m.
| Treatment | Sire | Daily distance travelled (m) | Foraging bout number | Foraging bout duration (min) | Foraging bout speed (km/h) | Foraging bout distance (m) | |||||
|---|---|---|---|---|---|---|---|---|---|---|---|
| 5 | 15 | 5 | 15 | 5 | 15 | 5 | 15 | ||||
| Kale | Red 1 | 6443a | 11.63ab | 5.98c | 45.99a | 91.29ab | 1.79a | 2.03a | 320.8a | 681.6a | |
| Kale | Red 2 | 6093a | 10.72ab | 5.89c | 55.86a | 103.6a | 1.60a | 1.95a | 362.6a | 730.3a | |
| Kale | Red 4 | 5986a | 11.01ab | 6.02bc | 50.36a | 91.08ab | 1.59a | 2.02a | 331.1a | 652.9a | |
| Kale | Red 5 | 5954a | 11.10ab | 6.08abc | 51.59a | 94.45ab | 1.64a | 1.94a | 331.0a | 651.8a | |
| Kale | Average | 6119 | 11.12 | 5.99 | 50.95 | 95.09 | 1.65 | 1.98 | 336.4 | 679.1 | |
| Pasture | Red 1 | 6818a | 11.48ab | 6.80a | 50.49a | 82.50b | 1.80a | 2.04a | 350.4a | 598.4a | |
| Pasture | Red 2 | 6662a | 11.40ab | 6.53abc | 53.84a | 92.64ab | 1.69a | 1.99a | 353.4a | 650.4a | |
| Pasture | Red 4 | 6532a | 11.35b | 6.66abc | 51.38a | 86.56ab | 1.48a | 1.96a | 336.7a | 614.3a | |
| Pasture | Red 5 | 6785a | 12.31a | 6.76ab | 46.3a | 84.02ab | 1.65a | 1.95a | 319.9a | 618.6a | |
| Pasture | Average | 6699 | 11.63 | 6.69 | 50.5 | 86.43 | 1.65 | 1.99 | 340.1 | 620.4 | |
Means within columns followed by the same letter are not significantly different (at P = 0.05).
Behaviour classifier
The kale and pasture treatment groups were predicted to have 5.99 (±0.148) and 6.69 (±0.141) 15-min or longer foraging bouts respectively, per 24-h period (Table 1). These bouts had an average length of 95 (±3.6) and 86 (±3.4) min each for the kale and pasture group respectively, equating to total foraging time of 570.5 and 620.7 min per 24-h period. The distances travelled during these 15-min or longer bouts were 679 (±54.0) and 620 (±53.0) m respectively, for the kale and pasture groups per foraging bout with an average foraging speed of 1.9 km/h. Average daily foraging distances calculated using the classifier data were 3741 and 3955 m for 5-min sustained bouts and 4068 and 4150 m for 15-min sustained bouts for the kale and pasture groups respectively.
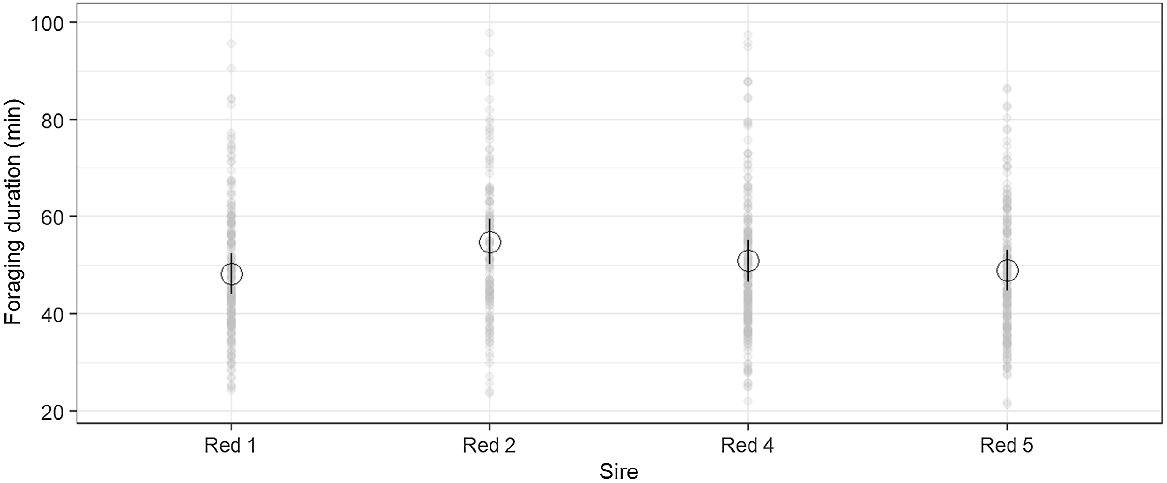
Foraging bout duration was different among sires for bouts greater than 5 min (P = 0.025, Fig. 2) and 15 min (P = 0.024), with the Red 1 progeny having the shortest duration (48.2 and 86.9 min respectively) and Red 2 progeny the longest duration (54.8 and 98.1 min respectively). The number of foraging bouts were also different among sires for foraging bouts greater than 5 min (P = 0.016) in duration but there were no differences for foraging bouts greater than 15 min. There were no other sire effects detected in predicted foraging behaviours.
Liveweight and liveweight gain
A total of 161 deer had complete liveweight records that could be used for liveweight analysis. Starting liveweights averaged 79.7 (±1.1) and 80.7 (±1.1) kg respectively, for the kale and pasture groups. End-of-trial weights averaged 83.0 (±1.2) and 82.6 (±1.2) kg respectively, for kale and pasture groups, equating to an average group daily growth rates of 72.4 (±6.5) and 41.7 (±6.5) g/day respectively.
Starting liveweight was different among the sire lines (P < 0.001), with Wapiti 1 progeny being (P < 0.05) heavier than any other sire progeny, with an average weight of 94.2 kg (Table 2). Red 2 progeny were the lightest, with an average of 73.9 kg, but were not significantly different from other red deer sire progeny.
| Sire | Wapiti 1 | Wapiti 2 | Red 1 | Red 2 | Red 3 | Red 4 | Red 5 | |
|---|---|---|---|---|---|---|---|---|
| Start weight (kg) | 94.2a | 81.8b | 75.8bc | 73.9c | 79.9bc | 76.7bc | 78.3bc | |
| Finish weight (kg) | 99.0a | 86.2b | 76.8c | 75.6c | 82.8bc | 78.5c | 80.4bc | |
| Kale growth rate (g/day) | 171.5a | 130.4ab | 23.9c | 50.4c | 67.0bc | 35.9c | 49.8c | |
| Pasture growth rate (g/day) | 71.5a | 55.7a | 15.3a | 13.6a | 63.5a | 38.8a | 40.0a |
Means within rows followed by the same letter are not significantly different (at P = 0.05).
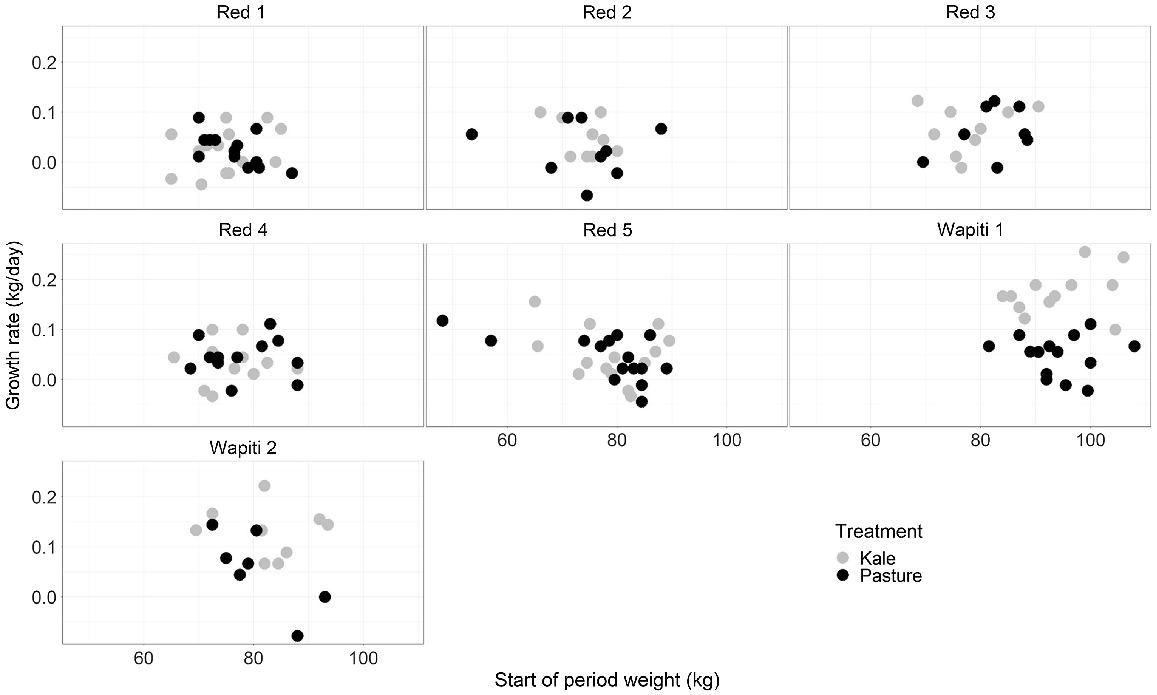
Liveweight gain over the 6-week trial period was higher for the Wapiti 1 (171.5 g/day) progeny than for the red deer sire progeny (≤67 g/day) on the kale treatment (P < 0.001) but not on the pasture treatment (P = 0.074; Table 2, Fig. 3). Starting and finishing liveweights were higher for the Wapiti 1 sire progeny (94.2 and 99.0 kg respectively) than for all red deer sire progenies (average 76.92 and 78.82 kg, respectively), but did not differ from those for Wapiti 2 sire progeny (81.8 and 86.2 kg respectively).
Mid-winter (23 June – 7 August) growth rate (g/day) of progeny from seven sire lines grazing either kale crop or pasture compared against start of period (23 June) liveweight.
Feed quality of the kale crop averaged 13.3 MJME pre-grazing, compared with an average of 10.5 MJME of the pasture pre-grazing.
Discussion
This research investigated the variation in foraging behaviour and performance of red deer and wapiti crossbred progeny bred from seven sire lines and managed on two feeding treatments to determine whether foraging behaviour was related to liveweight gain. The two groups were managed over a 6-week period in winter. It was hypothesised that different sire lines would display variation in their foraging behaviour and performance on each of the feed resources offered and that behaviour would influence liveweight gain. This research proved the central hypothesis of consistent variation in foraging behaviour among sire lines but did not prove the hypothesis that behaviour influences liveweight gain.
All animals on both treatments experienced dawn and dusk peaks in activity, as previously demonstrated in red deer (Hester et al. 1996; Pépin et al. 2006; Ensing et al. 2014; Wall et al. 2019). However, the diurnal pattern of activity appears to be different for the two groups, with the kale group having an extended morning activity period, followed by a distinct lack of activity until the evening period. This contrasts markedly with the pasture group who had regular activity periods throughout the day. Due to the lack of replication in feeding treatments, it is impossible to say whether the difference between the two groups is an effect of the feed type utilised or environmental factors. It is important to note that both areas were of similar elevation (180 vs 380 m amsl) and close in proximity but were on opposing aspects (kale on north-westerly and pasture south-easterly), although both had similar sheltering from prevailing weather. There were no significant weather events during the 2-week behaviour monitoring period. Given these similarities and the proximity of locations, we have ventured into some possible reasons on the differences in daily activity patterns between the two groups. The extended morning foraging bout of the individuals on the kale treatment most likely influenced their activity during the middle of the day by providing nutritional satiety reducing the need to return to an active foraging state until later in the day. Previous research investigating the intake of kale by dairy cows indicated that 92% of their daily intake was consumed in 3 h in a daily allocation system (Thompson and Stevens 2012), demonstrating the ability of ruminants to alter their feeding frequency when fed on high-quality and abundant feed. This effect would explain the activity patterns demonstrated in this trial but in the absence of feed intake-rate data, it cannot be confirmed.
No differences were detected between treatments in the overall average time spent foraging; however, time spent foraging did differ among sires, particularly when managed on the kale treatment, with progeny from Red 2 sire foraging on average for 64 min longer each 24-h period than progeny from the Red 1 sire. The difference on the pasture treatment between progeny from the same sires was 31 min. Foraging time in ruminants is influenced by many factors involving animal, plant, and landscape characteristics with the end goal of the individual being to attain a positive nutrient balance (Gordon and Lascano 1993). Progenies from both sires were of similar liveweight at the start of the trial period and should have been under the same physiological demands for nutrients and face the same environmental conditions. The difference that was measured is likely to be an effect of a different foraging strategies that were employed by progenies of different sires, demonstrating a consistent variation in foraging behaviour among sire lines. The total time spent foraging per day in this trial was similar to that of elk (Clark et al. 2017) but lower than the 13 h measured by Pépin et al. (2006) on confined red deer. It is important to note that the individuals measured in this trial were rising 1-year-old red deer and not adults and, consequently, will have a different nutritional driver that may alter foraging strategies.
GPS recording frequency can affect the accuracy of predicted daily distances travelled, with lower recording frequencies resulting in an underestimation of distance travelled (McGranahan et al. 2018), and higher recording frequencies resulting in overestimation of distances travelled due to GPS measurement errors (Ranacher et al. 2016; Noonan et al. 2019). The high frequencies (every 30 s) used in this trial may have resulted in an overestimation of the distance travelled; however, the relative differences among sires and between treatments can be considered valid, because all units will have experienced the same drift and GPS-accuracy issues. The distances travelled during foraging events as calculated using the behaviour classifier will also suffer from the same GPS-accuracy issues as well as underestimation and overestimation through the loss of data during the smoothing process to generate 5-min and 15-min sustained activity bouts as mentioned in the methods section. Relativities among sires should be valid.
The animal growth rates achieved in this trial on the pasture treatment were similar to the records from the same sire lines in previous research on pasture at Invermay (Thompson et al. 2020). The increased growth rates by the wapiti sires on the kale treatments are most likely related to the increased energy content of the kale and the increased quantity of feed on offer. The winter pasture used in this trial did not appear to support the genetic potential to grow of the wapiti progeny, but did appear to meet the requirements for the red sire progeny. Behavioural differences between wapiti and red deer progeny were not monitored because GPS collars were fitted only to progeny from four red deer sires; so it is not known whether this growth rate difference was an effect of foraging behaviour.
As noted in the methodology section, there were no significant correlations between foraging behaviours that were measured and liveweight gain in this study.
This research has demonstrated that there is variation in foraging behaviour of rising 1-year-old female red deer when managed on both pasture and kale during the winter period. It has demonstrated that there is consistent variation among genetic lines of animals, which creates an opportunity to select for favourable foraging behaviour. In this research, liveweight gain was not affected by differences in foraging behaviour over the 6-week period of monitoring. This research also demonstrated that the progeny of the wapiti crossbred sires used in this research grew faster than did the red deer sire progeny when offered the kale treatment that gave them the opportunity to express their genetic potential to grow during this period. Further research will investigate foraging behaviours further, to determine whether the variation in behaviours demonstrated in this research are consistent across both spatial and temporal contexts.
Acknowledgements
The authors thank the AgResearch Invermay farm staff and farm systems science team for assisting with field work and reviewers for their comments and recommendations to improve this paper.
References
Aharoni Y, Dolev A, Henkin Z, Yehuda Y, Ezra A, Ungar ED, Shabtay A, Brosh A (2013) Foraging behavior of two cattle breeds, a whole-year study: I. Heat production, activity, and energy costs. Journal of Animal Science 91(3), 1381-1390.
| Crossref | Google Scholar |
Bailey DW, Kress DD, Anderson DC, Boss DL, Davis KC (2001) Evaluation of F1 crosses from Angus, Charolais, Salers, Piedmontese, Tarentaise and Hereford sires. V: Grazing distribution patterns. Proceedings of the Western Section American Society of Animal Science 52, 110-113.
| Google Scholar |
Bailey DW, Marta S, Jensen D, Boss DL, Thomas MG (2010) Genetic and environmental influences on distribution patterns of beef cattle grazing foothill rangeland. Journal of Dairy Science 93(Suppl. 1), 8.
| Google Scholar |
Bailey DW, Lunt S, Lipka A, Thomas MG, Medrano JF, Canovas A, Rincon G, Stephenson MB, Jensen D (2015) Genetic influences on cattle grazing distribution: association of genetic markers with terrain use in cattle. Rangeland Ecology & Management 68(2), 142-149.
| Crossref | Google Scholar |
Bates D, Machler M, Bolker B, Walker S (2015) Fitting linear mixed-effects models using lme4. Journal of Statistical Software 67(1), 1-48.
| Crossref | Google Scholar |
Beck MR, Gregorini P (2020) How dietary diversity enhances hedonic and eudaimonic well-being in grazing ruminants. Frontiers in Veterinary Science 7, 191.
| Crossref | Google Scholar |
Ceacero F, Garcia AJ, Landete-Castillejos T, Bartosova J, Bartos L, Gallego L (2012) Benefits for dominant red deer hinds under a competitive feeding system: food access behavior, diet and nutrient selection. PLoS ONE 7(3), e32780.
| Crossref | Google Scholar |
Clark PE, Johnson DE, Ganskopp DC, Varva M, Cook JG, Cook RC, Pierson FB, Hardegree SP (2017) Contrasting daily and seasonal activity and movement of sympatric elk and cattle. Rangeland Ecology & Management 70(2), 183-191.
| Crossref | Google Scholar |
Dalley DE, Geddes T (2012) Pasture growth and quality on Southland and Otago dairy farms. Proceedings of the New Zealand Grassland Association 74, 237-241.
| Google Scholar |
di Virgilio A, Morales JM (2016) Towards evenly distributed grazing patterns: including social context in sheep management strategies. PeerJ 4, e2152.
| Crossref | Google Scholar |
Dolev A, Henkin Z, Brosh A, Yehuda Y, Ungar ED, Shabtay A, Aharoni Y (2014) Foraging behavior of two cattle breeds, a whole-year study: II. Spatial distribution by breed and season. Journal of Animal Science 92(2), 758-766.
| Crossref | Google Scholar |
Edwards GR, Newman JA, Parsons AJ, Krebs JR (1996) Effects of the total, vertical and horizontal availability of the food resource on diet selection and intake of sheep. The Journal of Agricultural Science 127(4), 555-562.
| Crossref | Google Scholar |
Ensing EP, Ciuti S, de Wijs FALM, Lentferink DH, ten Hoedt A, Boyce MS, Hut RA (2014) GPS based daily activity patterns in European Red Deer and North American Elk (Cervus elaphus): indication for a weak circadian clock in ungulates. PLoS ONE 9(9), e106997.
| Crossref | Google Scholar |
Hester AJ, Mitchell FJG, Gordon IJ, Baillie GJ (1996) Activity patterns and resource use by sheep and red deer grazing across a grass/heather boundary. Journal of Zoology 240(4), 609-620.
| Crossref | Google Scholar |
Hothorn T, Bretz F, Westfall P (2008) Simultaneous inference in general parametric models. Biometrical Journal 50(3), 346-363.
| Crossref | Google Scholar |
James NA, Matteson DS (2014) ecp: an R package for nonparametric multiple change point analysis of multivariate data. Journal of Statistical Software 62(7), 1-25.
| Crossref | Google Scholar |
James NA, Zhang W, Matteson DS (2019) ecp: an R package for nonparametric multiple change point analysis of multivariate data. R package, version 3.1.2. Available at https://cran.r-project.org/web/packages/ecp/index.html [Accessed on 22 August 2019]
Lagrange S, Villalba JJ (2019) Tannin-containing legumes and forage diversity influence foraging behavior, diet digestibility, and nitrogen excretion by lambs. Journal of Animal Science 97(9), 3994-4009.
| Crossref | Google Scholar |
Leanne Dillard S, Hancock DW, Harmon DD, Kimberly Mullenix M, Beck PA, Soder KJ (2018) Animal performance and environmental efficiency of cool-and warm-season annual grazing systems. Journal of Animal Science 96(8), 3491-3502.
| Crossref | Google Scholar |
Lenth RV (2022) emmeans: estimated marginal means, aka least-squared means. R package, Version 1.7.3. Available at https://github.com/rvlenth/emmeans
McGranahan DA, Geaumont B, Spiess JW (2018) Assessment of a livestock GPS collar based on an open-source datalogger informs best practices for logging intensity. Ecology and Evolution 8(11), 5649-5660.
| Crossref | Google Scholar |
McNamara RM (1992) Seasonal distribution of pasture production in New Zealand XX. North and East Otago downlands. New Zealand Journal of Agricultural Research 35(2), 163-169.
| Crossref | Google Scholar |
Michelena P, Sibbald AM, Erhard HW, McLeod JE (2009) Effects of group size and personality on social foraging: the distribution of sheep across patches. Behavioral Ecology 20(1), 145-152.
| Crossref | Google Scholar |
Noonan MJ, Fleming CH, Akre TS, Drescher-Lehman J, Gurarie E, Harrison A-L, Kays R, Calabrese JM (2019) Scale-insensitive estimation of speed and distance traveled from animal tracking data. Movement Ecology 7(1), 35.
| Crossref | Google Scholar |
Nyamuryekung’e S, Cibils AF, Estell RE, McIntosh M, VanLeeuwen D, Steele C, González AL, Spiegal S, Continanza FG (2021) Foraging behavior of heritage versus desert-adapted commercial rangeland beef cows in relation to dam-offspring contact patterns. Rangeland Ecology and Management 74, 43-49.
| Crossref | Google Scholar |
Pépin D, Renaud P-C, Dumont B, Decuq F (2006) Time budget and 24-h temporal rest–activity patterns of captive red deer hinds. Applied Animal Behaviour Science 101(3–4), 339-354.
| Crossref | Google Scholar |
Radcliffe JE (1974) Seasonal distribution of pasture production in New Zealand. New Zealand Journal of Experimental Agriculture 2(4), 341-348.
| Crossref | Google Scholar |
Ranacher P, Brunauer R, Trutschnig W, Van der Spek S, Reich S (2016) Why GPS makes distances bigger than they are. International Journal of Geographical Information Science 30(2), 316-333.
| Crossref | Google Scholar |
Reid RL, Puoli JR, Jung GA, Cox-Ganser JM, McCoy A (1994) Evaluation of Brassicas in grazing systems for sheep: I. Quality of forage and animal performance2. Journal of Animal Science 72(7), 1823-1831.
| Crossref | Google Scholar |
Ripley B (2021) tree: classification and regression trees. R package, Version 1.0-41. Available at https://cran.r-project.org/package=tree
Round-Turner NL, Scott RS, Radcliffe JE (1976) XI. Otago Downland and Taieri Plain (Invermay). New Zealand Journal of Experimental Agriculture 4(3), 321-328.
| Crossref | Google Scholar |
Russell ML, Bailey DW, Thomas MG, Witmore BK, Bailey CC (2010) Grazing patterns of Angus, Brangus and Brahman cows in the Chihuahuan Desert. Journal of Dairy Science 93(Suppl. 1), 7.
| Google Scholar |
Schmidt KT, Hoi H (1999) Feeding tactics of low-ranking red deer stags at supplementary feeding sites. Ethology 105(4), 349-360.
| Crossref | Google Scholar |
Sibbald AM, Erhard HW, McLeod JE, Hooper RJ (2009) Individual personality and the spatial distribution of groups of grazing animals: an example with sheep. Behavioural Processes 82(3), 319-326.
| Crossref | Google Scholar |
Thompson BR, Stevens DR (2012) A comparison of the intake of cows grazing swedes and kale and consequent condition score change. Proceedings of the New Zealand Grassland Association 74, 63-68.
| Crossref | Google Scholar |
Thorhallsdottir TE (1990) The dynamics of a grassland community: a simultaneous investigation of spatial and temporal heterogeneity at various scales. Journal of Ecology 78(4), 884-908.
| Crossref | Google Scholar |
Wall AJ, Asher GW, Netzer MS, Johnson MGH, O’Neill KT, Littlejohn RP, Cox N (2019) Farmed red deer home range, habitat use and daily movement patterns in a Southland, New Zealand, tussock grassland over calving and lactation. Animal Production Science 59(3), 549-563.
| Crossref | Google Scholar |