

Exploring the impact of replacement rates on carbon footprint in south-east Australian dairy herds
Saranika Talukder A * , Long Cheng B , Richard Eckard B , Sineka Munidasa B , Lachlan Barnes C , John Morton D and Brendan R. Cullen B
A
B
C
D
Abstract
Greater replacement rates in dairy herds lead to increased costs for rearing and/or purchasing replacement heifers and greater herd greenhouse gas (GHG) emissions.
This study aimed to estimate current GHG emissions and potential improvements in net farm emissions (NFE) and emission intensity (EI) by reducing replacement rates (percentage of calvings in the herd in the year that were by first calving heifers) using a series of eight case study farms.
The research was conducted by modelling eight Australian case study farms (five from northern Victoria/southern New South Wales and three from the Gippsland region) using farm-specific data. Data included herd structure, milk production, feed quality and quantity, and energy, fuel, and fertiliser usage. GHG emissions were estimated using the Dairy GHG Accounting Framework tool (ver. 14.5), calculating NFE and EI in megagram of carbon dioxide equivalents (Mg CO2e) and kilograms of carbon dioxide equivalent per kilogram of milk solids (kg CO2e/kg MS). The study modelled reducing the replacement rate by 5, 10, and 15 percentage points.
The average (±s.d.) EI per kilogram of MS for the eight case study farms was 15.8 ± 3.5 kg CO2e/kg MS. A 15-percentage point reduction in replacement rate was estimated as leading to reductions in EI per kilogram of MS ranging from 0.9 to 1.7 kg CO2e/kg MS across the case-study farms. However, NFEs were estimated as increasing with reductions in replacement rate for five of the eight case study farms.
Reducing the replacement rate can reduce EI (measured in kg CO2e/kg MS) but increase NFEs.
The findings underscore the importance of considering both environmental factors, such as GHG emissions, and economic aspects, such as net farm income, when evaluating and implementing strategies for sustainable dairy farming.
Keywords: carbon accounting, dairy cow, emission intensity, greenhouse gasses, hybrid feeding system, modelling, net farm emission, pasture.
Introduction
The longevity of dairy cattle has declined across many high milk-production countries over time (Dallago et al. 2021). Extending the lifespan of dairy cows may, under some circumstances, yield advantages, including greater economic returns and reduced replacement costs (Australian Dairy Herd Improvement Scheme (ADHIS) 2017). In the United States, over 40% of cows across three herds were at parity 1, underscoring a significant loss of older cows (Lean et al. 2023). The annual culling rate for dairy cows in Canada during the period 2017–2022 was 29.4% (CDIC 2023), whereas in the north-eastern United States in 2014, it reached 31.4%, accompanied by a 6.2% annual mortality rate (United States Department of Agriculture (USDA) 2018). An Australian study, based on culling records from 1995 to 2016, reported that the probability of a cow being culled was high in early parities (Workie et al. 2021). It is widely recognised that milk yield increases in the first few lactations, before it reaches a plateau between Lactations 5 and 8, after which it starts to decrease (Lubritz et al. 1989; Horn et al. 2012; Grandl et al. 2016). Thus, culling in earlier parities leads to a systemic loss of a large part of the highly productive lifetime. Additionally, culling at an early age has become a significant concern among consumers (Berry 2015), particularly because cow longevity serves as a global indicator of animal welfare. A longer lifespan indicates that the biological functions and health of the animal are not compromising its life expectancy (Bruijnis et al. 2013; Berghof et al. 2019).
If the number of cows calving in a herd each year is to be held constant, with greater culling rates, numbers of replacement heifers entering the lactating herd must be increased. Thus, an increased culling rate has significant negative financial and environmental costs associated with rearing and purchasing replacements (Compton et al. 2017; Ooi et al. 2021). Cows naturally produce direct (e.g. methane, CH4) and indirect (e.g. ammonia, nitrous oxide, N2O) greenhouse (GHG) emissions as by-products of ruminal microbial fermentation of nutrients, which are major pollutants from agriculture (Bhatta et al. 2015; Persson et al. 2015). The loss of dietary energy in the form of GHG represents significant inefficiencies and sources of pollution (Food and Agriculture Organization of the United Nations (FAO) 2010). It has been estimated that the livestock sector is responsible for producing approximately 15% of global GHG emissions (Persson et al. 2015; Philippe and Nicks 2015). Therefore, it has become a priority for governments and researchers to develop effective strategies to reduce GHG emissions from livestock (Pacheco et al. 2014; Philippe and Nicks 2015). In dairy herds, an increase in the number of replacement stock results in increased GHG emissions. For instance, in the United Kingdom dairy herds, replacement stock account for 21–26% of whole-herd enteric CH4 emissions (Wall et al. 2012). Moreover, every 10% point increase in the culling rate is estimated to lead to a 6% increase in whole-herd enteric CH4 emissions (Knapp et al. 2014).
GHG emissions are closely related to the feeding systems and feed type practiced on the farm (Munidasa et al. 2024). Across the Australian dairy industry, feeding systems are quite diverse, ranging from fully pasture-based to total mixed ration systems (Wales and Kolver 2017). In an average year with normal seasonal conditions on a typical dairy farm in Australia, approximately 60–65% of cattle feed requirements are met through grazing pasture (Dairy Australia 2020). However, most dairy regions in Australia have experienced an increase in the utilisation of concentrates as dairy farmers move to more intensive production systems in response to long-term declining terms of trade. These changes are particularly noticeable in the Murray–Darling Irrigation Basin in northern Victoria (Williams et al. 2020). In comparison to other dairy regions within Victoria, recently this area has received relatively low rainfall, with an average of 442 mm per year over the period from 2010 to 2020, as opposed to 874 mm in Gippsland (Dairy Farm Monitor Project 2020; Bureau of Meteorology 2021). The scarcity of rainfall in this region has resulted to an increased reliance on purchased forage and concentrates. Therefore, we included feeding system details along with other biological traits, for example, dry-matter intake (DMI), liveweight, and milk production when modelling herd GHG emissions (expressed as carbon dioxide equivalents, CO2-eq.). The first objective of this study was to estimate GHG emissions for a small number of individual farms across two prominent dairy regions of south-east Australia, namely northern Victoria/southern New South Wales, and Gippsland. Those dairying regions account for approximately 19% and 23% respectively, of Australia’s total milk production (Agriculture Victoria 2023). The second objective was to estimate the potential improvements in GHG emissions and milk production through reductions in replacement rates. This objective was addressed to inform the relationships between reducing the number of replacement animals on dairy farms and consequent impacts on both environmental sustainability (measured by GHG emissions) and milk solids production.
Materials and methods
Case study farms
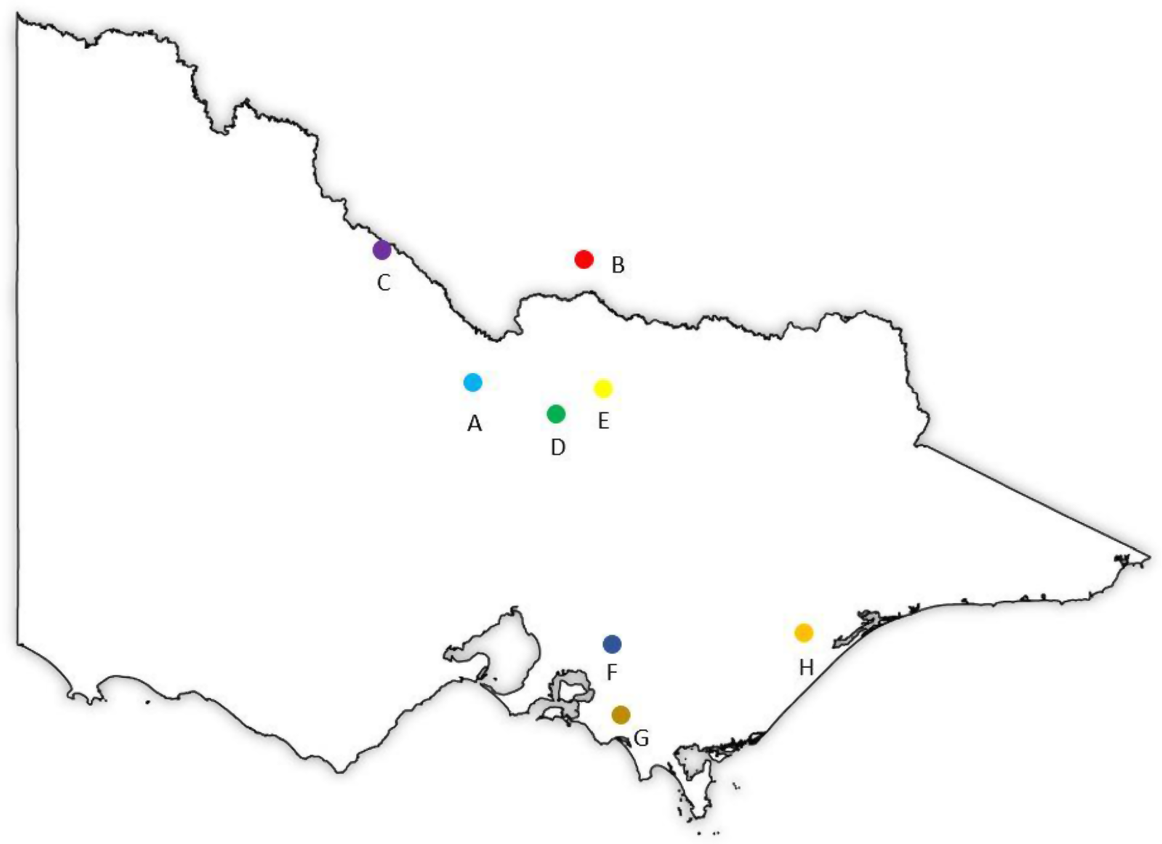
Five case study farms from northern Victoria/southern New South Wales, and three study farms from Gippsland region were selected for this study (Fig. 1). The farms’ demographic information can be found in the Table 1. The farms included in this study were selected through industry contacts (Murray Dairy and Gipps Dairy). The selection process involved purposive sampling to ensure representation of diverse feeding systems, specifically System 2 and System 4 (Wales and Kolver 2017), as well as all three calving systems (seasonal, split and year-round calving), farmers cooperativeness and quality of the records. In addition to the variation in feeding and calving systems, farms were selected to ensure differences in other key factors. These factors included the extent of supplementary feeding, level of milk production, reliance on irrigation water for pasture and crop production, and use of nitrogen fertiliser on pastures.
Locations of the case study farms of northern Victoria/southern New South Wales (Farms A–E) and Gippsland (Farms F–H).
| Characteristics | Farm A | Farm B | Farm C | Farm D | Farm E | Farm F | Farm G | Farm H | |
|---|---|---|---|---|---|---|---|---|---|
| Total farm area (ha) | 472 | 901 | 217 | 1350 | 92 | 352 | 153 | 154 | |
| Milking area (ha) | 372 | 250 | 153 | 550 | 64 | 187 | 150 | 100 | |
| Feeding system | System 4 A (Hybrid) | System 4 (Hybrid) | System 2 A | System 2 | System 2 | System 2 | System 2 | System 1 A | |
| Concentrate allocation (Mg DM/cow.year) | ~2.5 | >1.1 | ~2.1 | ~1.8 | ~3.0 | ~1.7 | ~1.2 | 0 | |
| Breed | HF, Jersey, and Crossbred | HF, Jersey, and Crossbred | HF, Jersey and Aussie Red | HF, Jersey and Crossbred | HF | Crossbred, HF | HF | HF, Jersey,Crossbred | |
| Milking herd size | 823 | 893 | 274 | 1625 | 138 | 703 | 479 | 251 | |
| Calving system | Split S: 50% A: 50% | Year-round | Split S: 55% A: 45% | Split S: 67% A: 33% | Split S: 67% A: 33% | Seasonal (spring) | Seasonal (spring) | Seasonal(spring) | |
| Average liveweight of milking cows (kg) | 625 | 575 | 550 | 550 | 650 | 480 | 550 | 550 | |
| Average milk production (L/cow.day) | 28 | 26 | 24 | 23 | 25 | 15 | 10 | 16 | |
| Milk protein (%) | 3.50 | 3.53 | 3.37 | 3.42 | 3.34 | 3.60 | 3.74 | 3.5 | |
| Milk fat (%) | 4.30 | 4.36 | 3.74 | 4.41 | 4.13 | 4.58 | 4.35 | 4.5 | |
| Replacement rate (%) | 25 | 33 | 30 | 22 | 27 | 17 | 26 | 23 | |
| Average lactation length (days) | 320 | 321 | 315 | 315 | 315 | 300 | 300 | 300 | |
| Average age at first breeding (months) | 15 | 15 | 15 | 15 | 15 | 14 | 14 | 15 | |
| Average age at first calving (months) | 24 | 24 | 24 | 24 | 24 | 23 | 23 | 24 | |
| Average number of lactations | 4 | 3.4 | 4 | 4 | 4 | 3.4 | 4 | 4 |
HF, Holstein Friesian; S, summer; A, autumn.
Feeding systems
The case-study farms were categorised by feeding system according to the Australian five category classification scheme described by Wales and Kolver (2017). In all the farming systems studied, pasture, silage, and hay were all fed. Concentrate feeds were used in all farms except for Farm H. Concentrate feeds (used in the case-study farms) included grains such as barley and wheat, as well as canola meal. Across the farms, both annual and perennial ryegrass were commonly used, often in combination with other species such as white clover (Trifolium repens), sub-clover (Trifolium subterraneum), wheat (Triticum aestivum L.), oats (Avena sativa), and fescue (Festuca arundinacea). However, Farm F exclusively utilised perennial ryegrass in its grazing system. Moreover, the specific types of silage and hay used varied among the farms, depending on the pasture species, their availability and cost. A comprehensive overview of the different silage and hay types used by each farm in the study has been provided in Table 2. Concentrate feed was sourced from local suppliers. Hay and silage production varied across the farms. Some farms relied on homegrown hay/silage, whereas others used a combination of homegrown and locally purchased hay/silage. However, details on farm gate production matrices for specific homegrown feed were not included in this study because of the variability in scale and magnitude of the homegrown feed.
| Feed type | Farm A | Farm B | Farm C | Farm D | Farm E | Farm F | Farm G | Farm H | |
|---|---|---|---|---|---|---|---|---|---|
| Pasture | Annual ryegrass and shaftal clover | Annual ryegrass, cereal wheat and oats | Annual ryegrass and shaftal clover | Perennial ryegrass, tall fescue | Perennial ryegrass, oats | Perennial ryegrass | Perennial ryegrass and sub-clover mix | Perennial ryegrass and white clover mix | |
| Silage | Vetch, sorghum, cereal, maize, grass | Maize, cereal, pasture | Cereal | Lucerne | Mixed silage | Ryegrass | Ryegrass and clover | Grass | |
| Hay | Oats, sorghum, vetch, lucerne | Lucerne | Vetch, oats, ryegrass, grass | Lucerne | Ryegrass and shaftal clover | Ryegrass | Pasture, oats | Grass | |
| Concentrate | Grain (barley, wheat), canola meal | Grain, canola meal | Pellet | Grain, canola meal | Pellet | Barley | Wheat | – |
Data collection
Farm data were collected from July 2020 to June 2021 via email and phone calls. No sensitive data were collected, and no farmer interviews were conducted, so human ethics approval was not required for this study. Herd-level average data were collected for the study year 2020/2021. Farm records for the financial year 2020/2021 were also utilised as a source of information. In cases where certain data, such as feed-quality data, were missing, estimates from literature were used to supplement the information. Additionally, communication with the farmers was maintained through telephone and email exchanges to clarify any uncertainties, and to gather additional details. Milking herd composition by cow age, numbers of cattle (heifers, milking cows and bulls), typical cow liveweight (kg), typical liveweight gain of replacement heifers (kg/head.month), typical age at first breeding and calving and herd average milk production (L/day) by season were collected. Except for Farm D, all farms used a weighing platform in the milking area to weigh the animals. For Farm D, bodyweight adjustments were made on the basis of literature and farmers’ assumptions. Details of feed types, allocation per feed type (Mg/month), DM percentage (DM %), metabolisable energy (ME) content (MJ/kg DM), crude protein percentage (CP %), and the quantity of purchased feed. Furthermore, the data collection process extended to include calving system, area of farmland used for pasture or crops, energy, fuel, fertiliser application, and chemical usage. A comprehensive summary of the different fertilisers used and grain/hay purchased by each farm in the study has been provided in Table 3. Replacement rate was calculated for each herd as number of cows calving for the first time in the study year, divided by total number of calvings in that year.
| Variable | Farm A | Farm B | Farm C | Farm D | Farm E | Farm F | Farm G | Farm H | |
|---|---|---|---|---|---|---|---|---|---|
| N fertiliser for pastures (kg N/ha) | 0 | 95 | 115 | 90 | 50 | 184 | 368 | 0 | |
| N fertiliser for crops (kg N/ha) | 0 | 0 | 0 | 154 | 0 | 0 | 0 | 0 | |
| Urea (Mg/farm) | 103 | 243 | 19.3 | 210 | 9 | 150 | 90 | 0 | |
| Single superphosphate (Mg/farm) | 51 | 0 | 0 | 90 | 0 | 0 | 0 | 0 | |
| Limestone (Mg/farm) | 110 | 0 | 0 | 400 | 0 | 0 | 0 | 0 | |
| Grain purchased (Mg) | 2325 | 3500 | 706 | 4016 | 534 | 1077 | 570 | 0 | |
| Hay purchased (Mg) | 884 | 764 | 677 | 2000 | 30 | 207 | 68 | 0 | |
| Glyphosate (L) | 1500 | 900 | 250 | 800 | 100 | 30 | 40 | 0 | |
| Herbicides/pesticides (L) | 600 | 1000 | 225 | 1050 | 100 | 250 | 0 | 60 | |
| Annual electricity use (KWh) | 226,000 | 350,000 | 97,854 | 265,340 | 42,527 | 102,000 | 59,160 | 72,841 | |
| Annual diesel consumption (L) | 49,800 | 41,992 | 10,675 | 25,000 | 4287 | 17,250 | 21,600 | 1850 | |
| Annual petrol consumption (L) | 5000 | 8023 | 2470 | 25,000 | 24 | 3100 | 1440 | 890 |
Modelling of steady-state base farm
For each farm, a steady-state herd structure has been modelled, allowing for a systematic assessment of changes in system parameters at the farm level. This modelling approach enabled the representation of different feeding systems across various regions within the chain. The calving data from the herds were integrated into the model, with an average cow being modelled on the basis of the farm average data. The number of milking herd replacements was calculated as the required number of animals to maintain the steady-state herd size (i.e. a constant number of heifers and cows calving each year). It was assumed that replacement animals give birth first at the age of 2 years and recalve every 15 months until dying or being culled. Male calves were assumed to be immediately removed from the farm after birth. This modelling framework provided a structured and quantitative approach to evaluate the impact of various factors on the steady-state herd, considering calving system and the management of replacement animals within the dairy system.
Modelling effects of decreases in replacement rate
‘Baseline’ GHG emissions were calculated separately for each farm by using the farm actual data, including their replacement rate. To analyse the impact of reducing the replacement rate on GHG emissions, emissions were also modelled for replacement rates decreased by each of 5%, 10% and 15% (all percentage points), while keeping herd size (number of calvings annually) at the herd’s actual baseline value. For example, for Farm A where replacement rate was 25% in the study year, a decrease of 15% would result in a replacement rate of 10%. The 5%, 10% and 15% reductions in replacement rates were not applied to all farms, as some farms (Farms D, F and H) already had lower replacement rates. Within each farm, it was assumed that average daily milk production per cow for first-calving and second-calving cows were 20% and 10% respectively, lower than the herd’s average daily milk production per cow in each season (Dairy Australia InCalf 2017). Relative milk production of mature cows (i.e. third-calving and greater-parity cows) at baseline was calculated for each farm. This was adjusted upwards to ensure that the herd’s average milk production matched the base farm level. The adjustment was made using an iterative method, considering different ratio values until the calculated herd average closely aligned with the specified level for the farm.
These relative milk production values were assumed to not change with decreases in replacement rate. Thus, with decreases in replacement rate, herd average daily milk production was assumed to increase because the necessary additional feed was available or supplied to support this increased herd milk production. Dairy GHG Accounting Framework (D-GAF, ver. 14.5; Ekonomou and Eckard 2022) tool calculated the additional ME required to support this increased herd milk production (details in GHG estimation section).
For each of 5%, 10% and 15% reduction in replacement rate, all input parameter values were kept the same as the farm baseline values, except for numbers of replacement heifers and milk production (resulting from changes in the herd’s replacement rate and consequent distribution of calvings by cow parity), and herd ME requirements. The further assumption was that the number of heifer calves reared does not decrease when the replacement rate is reduced. Instead, more heifers are sold during their first winter, as well as during the following summer, autumn, and winter. These calculated values were used in the overall calculation of farm GHG emissions by using the built-in equation provided by the D-GAF tool. Effects of changes in replacement rate on herd genetics were not modelled in this study.
GHG estimation
These calculated values were used in the overall calculation of farm GHG emissions by using the built-in equation provided by D-GAF (ver. 14.5; Ekonomou and Eckard 2022) tool. Once their baseline data were refined by farm record, literature and cross-check, GHG emissions from each farm were estimated using the D-GAF, a modelling tool specifically designed for this purpose. D-GAF utilises various data inputs, including the number of animals, liveweight of animals, dietary composition (CP and DM digestibility), area of farmland used for pasture and crops, and use of fertilisers, chemicals, energy, and fuel. This tool follows the approaches outlined by the Australian government to estimate emissions from Scope 1 (on-farm CH4, N2O and CO2 from diesel consumption and animals), Scope 2 (electricity usage), and Scope 3 (purchased farm inputs such as feed, fertilisers, herbicides/pesticides, lime, and fuel) emissions from the farms. D-GAF calculates the net farm emission (NFE; expressed in Mg of carbon dioxide equivalents, Mg CO2e) as a sum of the emissions of those three scopes. Also, D-GAF tool considers co-product (Gollnow et al. 2014) allocation to account for additional products generated by dairy farms, such as surplus calves, culled dairy cows, and other cattle removed from the farm. The distribution of carbon footprint allocation among these co-products was based on the physiological feed requirement of the animal to produce milk and meat (Gollnow et al. 2014). In this study, an average allocation percentage of 85% was utilised (i.e. 85% for dairy and 15% for the additional products generated from dairy farm). The calculation for NFE with co-product allocation involved considering 85% of the actual NFE. Carbon sequestration in soils and trees was not considered in this study. Emission intensity (EI) was calculated by dividing NFE by the amount of product, measured as two separate indicators, (1) kilograms of carbon dioxide equivalent per kilogram of milk (kg CO2e/kg of milk) and (2) kilograms of carbon dioxide equivalent per kilogram of milk solids (kg CO2e/kg of MS).
Results
GHG emissions of case-study farms
GHG emissions for the eight farms are presented in Table 4. The average EI per kilogram of MS for the eight study farms was 15.8 ± 3.5 kg CO2e/kg MS. With coproduct allocation, the average EI was calculated to be 13.4 ± 3.0 kg CO2e/kg MS (Table 4). Among the study farms, the greatest EI per kilogram of MS was found in Farm G (24.33 kg CO2e/kg MS), whereas the least was observed in Farm D (13.79 kg CO2e/kg MS). The EI/kg milk ranged between 0.98 and 1.72 kg CO2e/kg milk. With co-product allocation, the EI/kg milk ranged between 0.83 and 1.47 kg CO2 e/kg milk. The greatest EI per kilogram of milk was observed in Farm G, whereas the least was found in Farm D. Additionally, per cow emissions were greatest in Farm A and least in Farm H. As a result of variations in farming system sizes, the net annual GHG emissions per farm exhibited large variability across the study farms. Specifically, the NFE ranged from 1244 to 13,219 Mg CO2e per farm (Table 4).
| GHG emission | Farm A | Farm B | Farm C | Farm D | Farm E | Farm F | Farm G | Farm H | |
|---|---|---|---|---|---|---|---|---|---|
| Scope 1 (on-farm) emission (Mg CO2e) | 7059 | 6957 | 1982 | 10,806 | 1008 | 3472 | 2507 | 1390 | |
| Scope 2 (off-farm) emission (Mg CO2e) | 230.5 | 357.0 | 74.9 | 270.6 | 43.4 | 73.8 | 60.3 | 74.3 | |
| Scope 3 (pre-farm) emission (Mg CO2e) | 1186 | 1753 | 421 | 2142 | 193 | 656 | 359 | 9 | |
| NFE (Mg CO2e) A | 8476 | 9067 | 2477 | 13,219 | 1244 | 4201 | 2927 | 1473.3 | |
| Farm emission (Mg CO2e/ha of land) | 17.96 | 10.06 | 11.41 | 9.75 | 13.52 | 11.93 | 19.13 | 9.57 | |
| Per cow emission (Mg CO2e) A | 10.30 | 10.15 | 9.04 | 8.10 | 9.01 | 5.98 | 6.11 | 5.87 | |
| EI (kg CO2e/kg MS) A | 14.36 | 15.02 | 14.46 | 13.79 | 14.03 | 16.12 | 24.33 | 14.39 | |
| EI (kg CO2e/kg milk) A | 1.02 | 1.06 | 1.00 | 0.98 | 0.99 | 1.14 | 1.72 | 1.02 | |
| GHG (Mg CO2e/farm) | |||||||||
| CO2 | 1445 | 2137 | 442 | 2417 | 212 | 791 | 496 | 90 | |
| CH4 | 5535 | 5927 | 1762 | 9303 | 876 | 289 | 2174 | 1216 | |
| N2O | 1496 | 1003 | 268 | 1447 | 157 | 532 | 257 | 167 | |
Within the on-farm emissions, enteric fermentation was found to be the largest contributor, accounting for approximately 55–70% of the total emissions in the case study farms. Pre-farm Scope 3 emissions, which include emissions from purchased farm inputs such as feed, electricity, fertilisers, herbicides/pesticides, lime, and fuel, were the second-largest source of emissions. This was particularly evident in the northern Victorian farms that practiced hybrid and System 2 feeding, as they relied on high amount of purchased feed, resulting in increased emissions in this category.
Replacement rate, GHG emissions and MS production
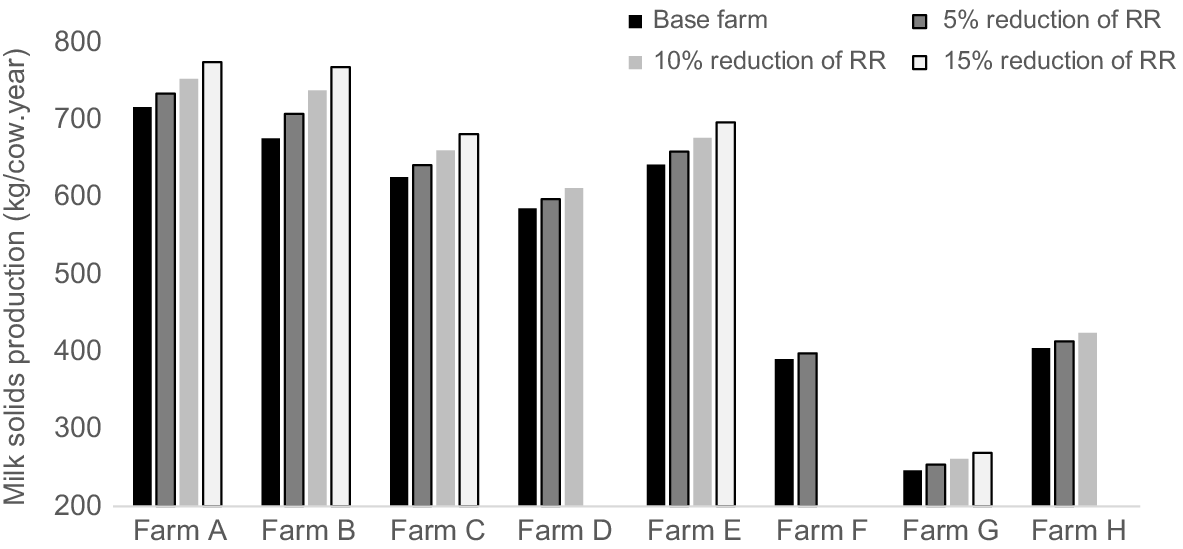
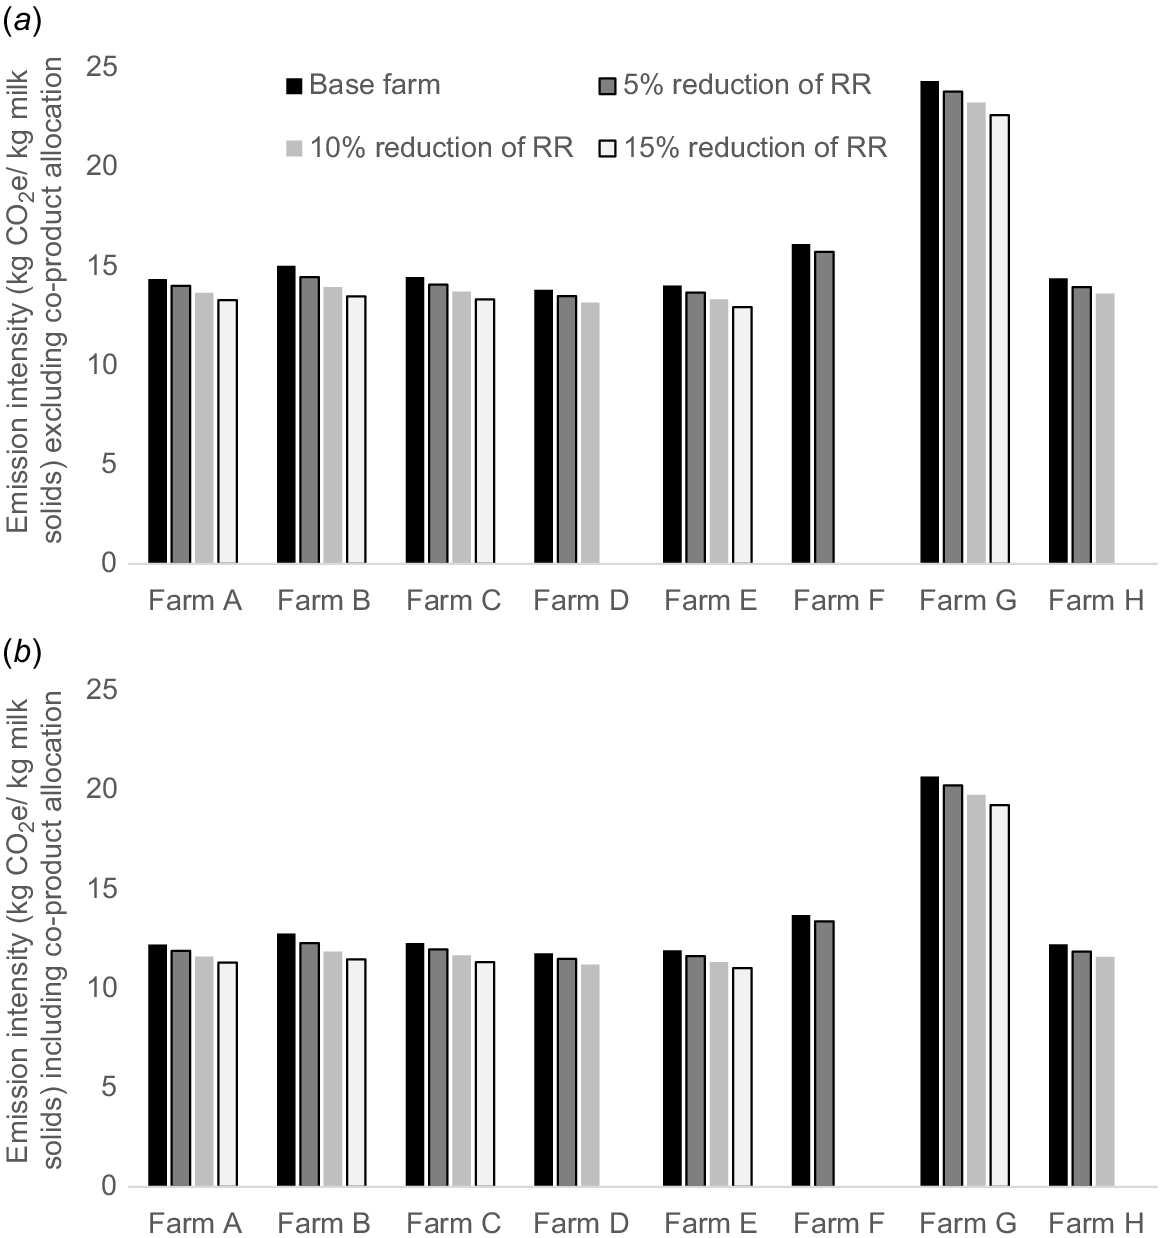
Reducing the replacement rate resulted in an average cow undergoing more lactations and dry-off periods than in the base farm situation. Consequently, this not only increased the number of surplus female calves but also affected the herd age structure (and parity) of the cow herd. This change led to an increase in average milk production per cow per day. The reduction of the replacement rate led to linear increase of milk production and greater NFE for some farms but lower EI per kilogram of MS (Figs 2 and 3). Farm G exhibited the greatest reductions in EI under each replacement rate scenarios, whereas Farm D demonstrated the least reduction in EI for the 5%, 10%, and 15% replacement rates respectively (Fig. 3). In contrast, NFE showed a small increase with the changes in the replacement rate in Farms B, C, E, F and G compared with the base farm scenario. A slight decrease in NFE was observed in Farms A, D and H with the reduction of the replacement rate (Fig. 4).
Milk solids production (kg/cow.year) of case study farms in northern Victoria/southern New South Wales (Farms A–E) and Gippsland (Farms F–H) regions, with a reduction in replacement rate (RR) compared with the base farm. Farms D, F and H had lower replacement rates, and thus not all percentage reductions in replacement rate were tested for these three farms.
Emission intensity (EI) of case study farms in northern Victoria/southern New South Wales (Farms A–E) and Gippsland (Farms F–H) regions, with a reduction in replacement rate (RR) compared with the base farm, (a) excluding and (b) including the co-product allocation to the red meat industry. Farms D, F and H practised lower replacement rate, and thus not all percentage reductions in replacement rate have been tested for these three farms.
Net farm emission (NFM) of case study farms in northern Victoria/southern New South Wales (Farms A–E) and Gippsland (Farms F–H) regions, with a reduction in replacement rate (RR) compared with the base farm, (a) excluding and (b) including the co-product allocation to the red meat industry. Farms D, F and H practised lower replacement rate, and thus not all percentage reductions in replacement rate have been tested for these three farms.

Discussion
GHG emissions of case study farms
In this study, the GHG EI was found between 15.8 ± 3.5 kg CO2e/kg MS, which aligns with industry reports of 13.5 kg CO2e/kg MS (Dairy Australia 2016). A recent study by Lahart et al. (2021) in Ireland, which examined different feeding systems ranging from high pasture allowance to high concentrate feeding, reported an EI of 11.4–13.6 kg CO2e/kg MS.
To compare the findings of this study with other national and international studies, we calculated the EI per kilogram of milk. The EI per kilogram of milk ranged between 0.87 and 1.72 kg CO2e/kg milk. One of the limitations of this study was that milk quality data were not available for all the farms, so total milk production was used instead of fat- and protein-corrected milk in reporting EI. International studies reported emission intensities by using the unit kg of CO2 equivalent/kg of fat protein-corrected milk as follows: 0.75–0.81 (New Zealand; Ledgard et al. 2020), 0.44–1.73 (Canada; Jayasundara et al. 2019), 1.53 (Germany; Kiefer et al. 2015) and 0.98–1.67 (Ireland; O’Brien et al. 2016). In a study comparing 60 dairy farms in Tasmania, Australia, Christie et al. (2011) reported an EI of milk production ranging from 0.83 to 1.39 kg CO2e/kg milk. These comparisons affirm that the findings of this study are consistent with previous national and international studies. Those international studies (Kiefer et al. 2015; O’Brien et al. 2016; Jayasundara et al. 2019; Ledgard et al. 2020) allocated between 85% and 90% of total farm GHG emissions to milk production, with the remaining portion being allocated to meat production from cull cows, surplus heifers, and bull calves. This allocation is similar to the present study. Conversely, the study by Christie et al. (2011) allocated all farm GHG emissions to the primary product, milk. Therefore, it is important to note these differences in the allocation of farm GHG emissions to milk and meat when comparing results across studies.
The estimated per cow GHG emissions ranged between 5.87 and 10.30 Mg CO2e, which aligns with a national study reporting per cow emissions of 6.9 ± 1.96 Mg CO2e (Christie et al. 2012). Production traits were positively related to per cow GHG emissions, owing to the positive relationships of milk production and liveweight with feed intake, which is the main driver of GHG emissions (Charmley et al. 2016). The greatest and second-greatest per cow emissions in Farms A and B respectively, might be related to hybrid feeding, meaning the animals were fed a relatively high level of grain compared with other feeding systems. The increased grain feeding in these farms corresponded to an increase in per cow milk production (28 and 26 L/day in Farms A and B respectively), resulting in increased DMI. Because the algorithms and equations used in the D-GAF tool are adjusted for greater DMI on the basis of milk production, increased milk production and DMI directly contribute to greater enteric CH4 production and per cow GHG emissions, as observed in Farms A and B. The increased milk output in the hybrid feeding system might not be sufficient to dilute the increased emissions associated with the grain feeding. Refining pasture-based management systems to increase grass utilisation and reduce concentrate supplementation can reduce both GHG emissions and GHG EI (O’Brien et al. 2015; Lahart et al. 2021).
Additionally, the D-GAF tool considers the liveweight and liveweight gain when calculating DMI (Ekonomou and Eckard 2022). As a result, animals with greater liveweight and weight gain tend to have high DMI as maintenance requirements, contributing to greater CH4 emission. The average liveweight of milking cows varied significantly across the study farms, with weights ranging from 550 to 625 kg in northern Victoria and from 450 to 550 kg in Gippsland. The lower liveweight of milking cows observed in some farms may contribute to lower per cow emissions. In considering industry targets for emissions reduction, it is essential to acknowledge potential implications on herd management and animal selection. Targets based solely on EI may inadvertently promote the breeding of larger cows, which could lead to increased total emissions. Conversely, targets based on absolute emissions may encourage the adoption of smaller, more efficient breed type reminiscent of those commonly found in New Zealand.
Net farm emission across the farms in northern Victoria and Gippsland varied considerably. According to industry report (Dairy Australia 2016), average farm emissions for a pasture-based, 400–500-cow dairy farm are ~2500 Mg CO2e per annum, which was consistent with the observations in the pasture-based Gippsland region farms included in our study. Despite Farm G NFE being average for a pasture-based farm, the EI was found to be the greatest. One possible explanation for this discrepancy could be the low milk production of 10 L/cow.day, which might be a result of practicing once-a-day milking. Among the case-study farms, Farm D had the greatest NFE owing to its larger herd size of 1625 milking cows and the use of purchased grain during pasture deficit months. However, the per cow emissions and EI per kilogram of MS were low on that farm. It is important to note that when comparing the results, it is crucial to consider the analytical methods, system boundaries, and metrics used to measure emissions profile. Additionally, the results of this study are based on data from the 2020/2021 period and may not represent a long-term average.
Replacement rate, GHG emissions, and milk production
In this study, the EI showed a downward trend with the reduction in replacement rate. The increased milk production resulting from a change in the parity of the milking herd improved the EI through a dilution effect. However, the reduction in replacement rate resulted in greater NFE in Farms B, C, E, F and G. This can be attributed to the increased DMI by cows for greater liveweight and milk production than for heifers. The discrepancies in NFE results across the case study farms may be due to the balance between the reduced DMI from reduced replacement heifers and the average increase in milk production for different parity groups.
Among the three scopes accountable for NFE, only Scope 1 (on-farm emissions), particularly enteric fermentation, changed with different proportions of replacement rate across the farms. Although only the milkers produce milk, replacement heifers (at different scales) are part of the dairy farm and contribute to Scope 1 emissions. Additionally, the case-study farms varied across their input. High-input systems with greater cow numbers and larger animals tend to have greater NFE. Conversely, low-input systems have lower NFE but, owing to reduced yields (both in meat and milk), factors such as animal maintenance per megagram of DM consumed often result in greater EI.
It is worth noting that the percentage reduction in GHG emissions in this study was minimal. Weiske et al. (2006) noted a reduction of 13% when reducing replacement rates from 40% to 30% in modelled dairy systems. Beukes et al. (2010) highlighted that reductions of 27–34% in GHG emissions can be achieved by combining strategies such as reducing replacement rates, improving cow genetics, and enhancing pasture management. To minimise GHG emissions, increasing the farm productivity while maintaining constant livestock DMI remains crucial. It is possible that the current replacement rates in the case study farms were not high enough to observe a significant reduction in GHG emissions. Beukes et al. (2010) reported that potential reductions in GHG emissions of 27–34% were found by combining strategies such as reducing animal replacement rates, improving cow genetics, and enhancing pasture management. Increasing the farm production while keeping the livestock DMI constant is crucial to minimise GHG emissions.
The current replacement rate of the case study farms ranged from 17% to 33%. Most farms raised heifers and used them as replacement stock for breeding, ranging from 76% in Farm F to 90% in Farm E, except for Farm C. Farm C had a greater replacement rate of 33% owing to a high incidence of twin calves and surplus heifers available for sale. Only 52% of the heifers reared on this farm were used as replacement stock, which may contribute to a greater emission profile for that farm. Farm B, which practiced year-round calving, had the greatest replacement rate. This farm is also looking to expand its size and production, which could potentially contribute to greater emissions. A previous study on modelled farms (Zehetmeier et al. 2012) reported that GHG emissions during the rearing phase of replacement heifers accounted for up to 20% of total GHG emissions from the modelled dairy farms. Therefore, the replacement rate plays a significant role in the total GHG emissions of dairy systems. However, these emissions can be offset by lower GHG emissions associated with rearing fewer replacements (Browne et al. 2014).
One drawback of reducing the replacement rate is its potential to decelerate the pace of genetic gain within a herd by selectively culling poorly performing cows (Browne et al. 2014). For farms with a greater replacement rate, further research could focus on reducing the replacement rate by improving overall herd efficiencies and increasing the length of productive life. This can be achieved through strategies such as enhancing body condition scores, improving pregnancy rates through better calving and mating management, and implementing effective reproductive practices. These approaches can contribute to optimising the herd structure and reducing the need for a high number of replacements, ultimately leading to more sustainable and efficient dairy systems.
There are few limitations to consider in this study. First, in some of the case study farms, data regarding DM digestibility, liveweight, and liveweight gain were not available. In such cases, feed-quality data were sourced from local government websites, and farmers’ assumptions and literature were used to estimate the average of the animals’ liveweights. As a result, the data input used in this study to calculate GHG emissions may not provide an assessment of the actual on-farm GHG emissions, but rather an estimation. The accuracy of data collection could be improved by obtaining precise farm-based records. Second, estimating carbon sequestration from trees and soil was beyond the scope of this project, and including these factors could provide a more accurate estimation of GHG emissions. In addition, there may have been some effects of COVID-19 on overall farm management, but these effects were not considered in this study.
Further research should consider extending the analysis to include full or partial life-cycle assessments, particularly from cradle to farm-gate. This comprehensive approach provides a holistic view of the GHG profile of a farming system, enabling the implementation of targeted mitigation strategies to address emissions effectively. Additionally, investigating the quantification of GHG emissions per unit of product, considering the productive life of cows and associated profitability would be valuable. This research could focus on reducing the proportion of cows that leave the herd before completing their first lactation, because it can have a significant impact on both GHG emissions and profitability.
Conclusions
This study has provided valuable insights into the GHG emission profiles of two prominent dairy regions in south-east Australia, as well as the impact of reducing the replacement rate on emissions and milk production. The NFE and EI varied substantially across the farms, presumably influenced by factors such as herd size, feeding systems, and the chosen metrics to quantify emission profiles. The adoption of increased grain feeding in hybrid feeding farms corresponded with greater per cow milk production. This led to an increased DMI, directly contributing to greater enteric CH4 production and per cow GHG emissions. When comparing results across studies, it is important to acknowledge the differences in GHG emission allocation between milk and meat production. It was observed that farms can benefit from reducing the replacement rate, resulting in greater MS production and lower EI (measured in kg CO2e/kg MS). Furthermore, it is crucial to explore the costs and benefits associated with reducing the replacement rate of the herd, considering the potential advantages of mitigating GHG emissions, balanced against the potential setback in the rate of genetic gain.
Conflicts of interest
The authors declare that they have no known competing financial interests or personal relationships that could have appeared to influence the work reported in this paper.
Declaration of funding
The authors greatly acknowledge funding support from the University of Melbourne Collaborative Seed Grant in partnership with Murray Dairy.
Author contributions
Saranika Talukder: writing – review and editing, writing – original draft, project administration, methodology, investigation, formal analysis, data curation, visualisation, conceptualisation. Long Cheng: writing – review and editing, methodology, investigation, conceptualisation. Richard Eckard: writing – review and editing, methodology, conceptualisation. Sineka Munidasa: writing – review and editing, formal analysis, data curation, methodology. Lachlan Barnes: writing – review and editing, methodology, conceptualisation, resources. John Morton: writing – review and editing, methodology, data curation, conceptualisation. Brendan Cullen: writing – review and editing, project administration, methodology, conceptualisation.
Acknowledgements
We express our gratitude to the farmers for generously providing the farm data used in this research. Their contribution has been invaluable. We also acknowledge the administrative support of MurrayDairy and GippsDairy in facilitating communication with the farmers.
References
Agriculture Victoria (2023) Victorian dairy industry fast facts June 2021. Available at https://agriculture.vic.gov.au/__data/assets/pdf_file/0005/921164/DAIRY_FAST-FACTS_JANUARY-2023.pdf [retrieved 15 August 2023]
Australian Dairy Herd Improvement Scheme (ADHIS) (2017) Australian dairy herd improvement scheme report 2017. Available at https://datagene.com.au/sites/default/files/DirectoryPage/Herd%20Improvement%20Report/2017%20Australian%20Dairy%20Herd%20Improvement%20Report.pdf
Berghof TVL, Poppe M, Mulder HA (2019) Opportunities to improve resilience in animal breeding programs. Frontiers in Genetics 9, 692.
| Crossref | Google Scholar | PubMed |
Berry DP (2015) Breeding the dairy cow of the future: what do we need? Animal Production Science 55(7), 823-837.
| Crossref | Google Scholar |
Beukes PC, Gregorini P, Romera AJ, Levy G, Waghorn GC (2010) Improving production efficiency as a strategy to mitigate greenhouse gas emissions on pastoral dairy farms in New Zealand. Agriculture, Ecosystems & Environment 136(3–4), 358-365.
| Crossref | Google Scholar |
Bhatta R, Saravanan M, Baruah L, Prasad CS (2015) Effects of graded levels of tannin-containing tropical tree leaves on in vitro rumen fermentation, total protozoa and methane production. Journal of Applied Microbiology 118(3), 557-564.
| Crossref | Google Scholar | PubMed |
Browne NA, Behrendt R, Kingwell RS, Eckard RJ (2014) Does producing more product over a lifetime reduce greenhouse gas emissions and increase profitability in dairy and wool enterprises? Animal Production Science 55(1), 49-55.
| Crossref | Google Scholar |
Bruijnis MRN, Meijboom FLB, Stassen EN (2013) Longevity as an animal welfare issue applied to the case of foot disorders in dairy cattle. Journal of Agricultural and Environmental Ethics 26, 191-205.
| Crossref | Google Scholar |
Canadian Dairy Information Centre (CDIC) (2023) Culling and replacement rates in dairy herds in Canada. Government of Canada. Available at https://agriculture.canada.ca/sites/default/files/documents/2023-04/genetics-cull_e.pdf
Charmley E, Williams SRO, Moate PJ, Hegarty RS, Herd RM, Oddy VH, Reyenga P, Staunton KM, Anderson A, Hannah MC (2016) A universal equation to predict methane production of forage-fed cattle in Australia. Animal Production Science 56(3), 169-180.
| Crossref | Google Scholar |
Christie KM, Rawnsley RP, Eckard RJ (2011) A whole farm systems analysis of greenhouse gas emissions of 60 Tasmanian dairy farms. Animal Feed Science and Technology 166-167, 653-662.
| Crossref | Google Scholar |
Christie KM, Gourley CJP, Rawnsley RP, Eckard RJ, Awty IM (2012) Whole-farm systems analysis of Australian dairy farm greenhouse gas emissions. Animal Production Science 52(11), 998-1011.
| Crossref | Google Scholar |
Compton CWR, Heuer C, Thomsen PT, Carpenter TE, Phyn CVC, McDougall S (2017) Invited review: A systematic literature review and meta-analysis of mortality and culling in dairy cattle. Journal of Dairy Science 100(1), 1-16.
| Crossref | Google Scholar | PubMed |
Dairy Australia (2016) Greenhouse gas accounting Australian Dairy Carbon Calculator. Available at https://cdn-prod.dairyaustralia.com.au/-/media/project/dairy-australia-sites/national-home/resources/2020/07/08/dairy-carbon-calculator-factsheet/dairy-carbon-calculator-factsheet.pdf?rev=c7be9a886f7c4a8896e493bfa639a2b0&hash=59224992A715F696512C65609F3A18A2 (Retrieved on 30 May 2023)
Dairy Australia (2020) In focus 2020 The Australian dairy industry. Available at https://cdn-prod.dairyaustralia.com.au/-/media/project/dairy-australia-sites/national-home/resources/2020/11/19/the-australian-dairy-industry-in-focus/infocus-report-2020.pdf [retrieved 30 May 2023]
Dallago GM, Wade KM, Cue RI, McClure JT, Lacroix R, Pellerin D, Vasseur E (2021) Keeping dairy cows for longer: a critical literature review on dairy cow longevity in high milk-producing countries. Animals 11(3), 808.
| Crossref | Google Scholar | PubMed |
Ekonomou A, Eckard R (2022) A greenhouse accounting framework for dairy properties based on the Australian National Greenhouse Gas Inventory methodology. Available at http://piccc.org.au/tools [updated June 2022]
Gollnow S, Lundie S, Moore AD, McLaren J, Van Buuren N, Stahle P, Christie K, Thylmann D, Rehl T (2014) Carbon footprint of milk production from dairy cows in Australia. International Dairy Journal 37(1), 31-38.
| Crossref | Google Scholar |
Grandl F, Amelchanka LS, Furger M, Clauss M, Zeitz JO, Kreuzer M, Schwarm A (2016) Biological implications of longevity in dairy cows: 2. changes in methane emissions and efficiency with age. Journal of Dairy Science 99(5), 3472-3485.
| Crossref | Google Scholar | PubMed |
Horn M, Knaus W, Kirner L, Steinwidder A (2012) Economic evaluation of longevity in organic dairy cows. Organic Agriculture 2, 127-143.
| Crossref | Google Scholar |
Jayasundara S, Worden D, Weersink A, Wright T, VanderZaag A, Gordon R, Wagner-Riddle C (2019) Improving farm profitability also reduces the carbon footprint of milk production in intensive dairy production systems. Journal of Cleaner Production 229, 1018-1028.
| Crossref | Google Scholar |
Kiefer LR, Menzel F, Bahrs E (2015) Integration of ecosystem services into the carbon footprint of milk of South German dairy farms. Journal of Environmental Management 152, 11-18.
| Crossref | Google Scholar |
Knapp JR, Laur GL, Vadas PA, Weiss WP, Tricarico JM (2014) Invited review: enteric methane in dairy cattle production: quantifying the opportunities and impact of reducing emissions. Journal of Dairy Science 97(6), 3231-3261.
| Crossref | Google Scholar | PubMed |
Lahart B, Shalloo L, Herron J, O’Brien D, Fitzgerald R, Boland TM, Buckley F (2021) Greenhouse gas emissions and nitrogen efficiency of dairy cows of divergent economic breeding index under seasonal pasture-based management. Journal of Dairy Science 104(7), 8039-8049.
| Crossref | Google Scholar | PubMed |
Lean IJ, Golder HM, LeBlanc SJ, Duffield T, Santos JEP (2023) Increased parity is negatively associated with survival and reproduction in different production systems. Journal of Dairy Science 106(1), 476-499.
| Crossref | Google Scholar | PubMed |
Ledgard SF, Falconer SJ, Abercrombie R, Philip G, Hill JP (2020) Temporal, spatial, and management variability in the carbon footprint of New Zealand milk. Journal of Dairy Science 103(1), 1031-1046.
| Crossref | Google Scholar |
Lubritz DL, Forrest K, Robison OW (1989) Age of cow and age of dam effects on milk production of Hereford cows. Journal of Animal Science 67(10), 2544-2549.
| Crossref | Google Scholar |
Munidasa S, Cullen B, Eckard R, Talukder S, Barnes L, Cheng L, Eastwood C (2024) Comparative enteric-methane emissions of dairy farms in northern Victoria, Australia. Animal Production Science 64(1), AN22330.
| Crossref | Google Scholar |
Ooi EC, Stevenson M, Beggs DS, Mansell PD, Pryce JE, Murray A, Pyman MF (2021) The impact of declining dairy fertility on calving patterns and farm systems: a case study from northern Victoria, Australia. Agricultural Systems 193, 103228.
| Crossref | Google Scholar |
O’Brien D, Hennessy T, Moran B, Shalloo L (2015) Relating the carbon footprint of milk from Irish dairy farms to economic performance. Journal of Dairy Science 98(10), 7394-7407.
| Crossref | Google Scholar |
O’Brien D, Geoghegan A, McNamara K, Shalloo L (2016) How can grass-based dairy farmers reduce the carbon footprint of milk? Animal Production Science 56(3), 495-500.
| Crossref | Google Scholar |
Pacheco D, Waghorn G, Janssen PH (2014) Decreasing methane emissions from ruminants grazing forages: a fit with productive and financial realities? Animal Production Science 54(9), 1141-1154.
| Crossref | Google Scholar |
Persson UM, Johansson DJA, Cederberg C, Hedenus F, Bryngelsson D (2015) Climate metrics and the carbon footprint of livestock products: where’s the beef? Environmental Research Letters 10(3), 034005.
| Crossref | Google Scholar |
Philippe F-X, Nicks B (2015) Review on greenhouse gas emissions from pig houses: production of carbon dioxide, methane and nitrous oxide by animals and manure. Agriculture, Ecosystems & Environment 199, 10-25.
| Crossref | Google Scholar |
Wales WJ, Kolver ES (2017) Challenges of feeding dairy cows in Australia and New Zealand. Animal Production Science 57(7), 1366-1383.
| Crossref | Google Scholar |
Wall E, Coffey MP, Pollott GE (2012) The effect of lactation length on greenhouse gas emissions from the national dairy herd. Animal 6(11), 1857-1867.
| Crossref | Google Scholar | PubMed |
Weiske A, Vabitsch A, Olesen JE, Schelde K, Michel J, Friedrich R, Kaltschmitt M (2006) Mitigation of greenhouse gas emissions in European conventional and organic dairy farming. Agriculture, Ecosystems & Environment 112(2–3), 221-232.
| Crossref | Google Scholar |
Williams YJ, McDonald S, Chaplin SJ (2020) The changing nature of dairy production in Victoria, Australia: are we ready to handle the planning and development of large, intensive dairy operations? Animal Production Science 60, 473.
| Crossref | Google Scholar |
Workie ZW, Gibson JP, van der Werf JH (2021) Analysis of culling reasons and age at culling in Australian dairy cattle. Animal Production Science 61(7), 680-689.
| Crossref | Google Scholar |
Zehetmeier M, Baudracco J, Hoffmann H, Heißenhuber A (2012) Does increasing milk yield per cow reduce greenhouse gas emissions? A system approach. Animal 6(1), 154-166.
| Crossref | Google Scholar | PubMed |