

Evaluation of methane prediction equations for Australian feedlot cattle fed barley and wheat-based diets
A. K. Almeida A * , J. P. McMeniman B , M. R. Van der Saag B and F. C. Cowley A
A
B
Abstract
Accurately predicting baseline methane (CH4) emissions from beef cattle is of utmost importance for the beef industry and governments alike. It serves as a vital component for accounting as part of national GHG inventories and enables the development and implementation of greenhouse gas (GHG) mitigation strategies.
The aim of this study was to evaluate equations in the literature for predicting CH4 emissions of beef cattle when fed barley and wheat-based diets typical of the Australian feedlot industry. Then, propose the best prediction equation to accurately reflect CH4 emissions of feedlot cattle under Australian conditions.
As part of the project, a large database of methane measurements performed in respiratory calorimeters taken from beef cattle fed a range of feedlot diets was assembled. The dataset included a wide range of factors that are known to impact CH4 production, such as dry matter intake (DMI), ether extract (EE), crude protein (CP), and cell wall components, amongst others. The database contained 713 individual measurements, from 175 animals and 12 studies.
The equation currently utilised by the Australian National Inventory Report had poor accuracy, with mean bias overprediction of 115 g/day (P < 0.01), along with significant linear bias (P < 0.01) and poor precision (r2 = 0.05). The mean bias was 144% of average observed CH4 production. All evaluated equations lacked accuracy and precision in predicting CH4 emissions for the diets fed in this study. Roughage concentrations (DM basis) ranged from 5.54 to 43.0% with a mean of 20.5 ± 11.1%. Given these findings, two specific equations were developed, (1) a CH4 yield equation based on DMI: CH4 (g/day) = 9.89 ± 1.54 × DMI (n = 384; P < 0.01; root mean square error (RMSE) = 32.6 g/day; r2 = 0.85); and (2) an equation based on DMI, neutral detergent fibre (NDF) and EE: CH4 (g/day) = 5.11 ± 1.58 × DMI − 4.00 ± 0.821 × EE + 2.26 ± 0.125 × NDF (n = 384; P < 0.05; RMSE = 22.2 g/day; r2 = 0.91). When validated, the second equation yielded a mean bias of 6.10 g overprediction, with no linear bias, and better fit than any of the literature equations.
Based on a thorough model evaluation, our findings support the need to revise current methods to predict CH4 for barley and wheat-based diets.
This study contributes to developing accurate estimations of enteric CH4 emissions for cattle fed barley and wheat-based diets.
Keywords: barley, enteric methane, greenhouse gas, inventory, model evaluation, prediction equations.
Introduction
The United Nations Framework Convention on Climate Change (UNFCCC) mandates that industrialised nations report their greenhouse gas (GHG) emissions estimations and uncertainties using the Intergovernmental Panel on Climate Change (IPCC 2006; IPCC 2019) guidelines. To fulfil Australia’s domestic and international greenhouse gas emissions reporting obligations under the UNFCCC, Kyoto Protocol and the Paris Agreement, the Australian government reports on emissions, progress towards targets, projections, and mitigation actions. The Australian National GHG Inventory Report, published annually, categorises emissions by economic sector, namely, energy, industrial processes and product use, land use, waste, and agriculture, within each state. In 2019, agriculture contributed 14.1% of Australia’s GHG emissions, with enteric methane (CH4) production accounting for 72% of that total (Commonwealth of Australia 2019). This aligns with the global trend of enteric CH4 being a major agricultural contributor to GHG emissions in industrialised countries.
The Australian government currently employs a Tier 2 method (Commonwealth of Australia 2023), as per IPCC guidelines, to calculate the CH4 emissions stemming from Australian feedlot cattle. The Moe and Tyrrell (1979) equation is used in the Australian National Inventory (Commonwealth of Australia 2023) to predict CH4 emissions from beef cattle in feedlots, considering variables related to cell wall carbohydrates (hemicellulose [HC] and cellulose [CEL]) and soluble residue (SR; non-fibrous carbohydrates and starch). However, the Moe and Tyrrell (1979) equation was originally developed using data from US dairy cattle fed the typical dairy diets in the late 1970s, and it may not be suitable for estimation of the CH4 emissions from modern grain-fed beef cattle. Therefore, this research tested the adequacy of the current Australian National Inventory equation for feedlot cattle, using cattle and diets typical of the modern Australian feedlot industry (i.e. based on white grains, such as barley).
We hypothesise that although dairy and beef cattle are both same species, the interactions of their distinct diets and digestive physiologies, arising from selection, should be considered. Factors such as the digestive tract volume, mean retention time of digesta, the digestibility of the feed offered, and digestion and fermentation characteristics may affect the accuracy of the Moe and Tyrrell (1979) equation in predicting CH4 emissions from feedlot cattle (Johnson and Johnson 1995; Hammond et al. 2014). Furthermore, recent research from the Netherlands (van Gastelen et al. 2019) has suggested that developments in management and breeding of ruminant animals in the past few decades may have altered their digestive physiology (i.e. greater intake capacity, increased passage rate and decreased digestibility). Therefore, studies from the 1980s or earlier may not be applicable in describing the physiology of today’s animals.
Recently, Escobar-Bahamondes et al. (2017a) evaluated IPCC Tier 2 methodology to predict CH4 production from beef cattle fed high and low forage diets from numerous countries. In high-forage diets, the equation had moderate precision (r2 = 0.53), and an 8.1 g/day overprediction of CH4 production. In low forage diets, however, precision was poor (r2 = 0.09), and significant linear biases were present, with 35.9 g/day underprediction and 108 g/day overprediction at minimum and maximum predicted values, respectively.
The present study was designed to evaluate existing equations that predict CH4 in the literature and identify their adequacy for predicting CH4 production from feedlot cattle, specifically under conditions similar to those used in the Australian feedlot industry. The present study will contribute towards adequate predictions of CH4 production for cattle fed barley and wheat-based diets.
Materials and methods
Description of the evaluation and new equation parametrisation database
The database used for evaluation of extant equations and development of a new equation in this study was pooled from four open circuit respiration chamber studies (published and unpublished; Tables S1, S2) conducted at the Large Animal Facility at the Centre for Animal Research and Teaching (CART) of the University of New England (Armidale, NSW Australia), 2018 to 2022. All experiments followed animal care and handling procedures in accordance with approvals granted by the Animal Ethics Committee of the University of New England (authorities numbers: AEC-18-028, ARA21-106, AEC-20-061, and ARA22-013).
An initial database of 384 individual records from 53 feedlot cattle was assembled for validation of extant literature equations and new model parametrisation (Database 1, Table 1, Table S1). In these studies, feedlot cattle were fed transition and finisher diets based on tempered rolled barley. Diets differed in roughage, grain, and canola oil content, resulting in variation in the neutral detergent fibre (NDF), ether extract (EE) and starch concentration within the database (Table 1). The diets in all studies contained 25 mg/kg DM of monensin. Study cattle were managed as closely as possible to commercial feedlot conditions (please refer to the Supplementary material for further information on diets). No study cattle were treated with hormonal growth promotants (HGP) or fed other additives to stimulate growth, feed efficiency or CH4 production.
| Item | Database 1 | n | Database 2 | ||||||||
|---|---|---|---|---|---|---|---|---|---|---|---|
| n | Mean | s.d. | Minimum | Maximum | Mean | s.d. | Minimum | Maximum | |||
| Dry matter intake (kg/d) | 384 | 9.07 | 2.08 | 3.50 | 14.1 | 329 | 7.67 | 1.81 | 2.82 | 13.0 | |
| Body weight (kg) | 384 | 412 | 71.0 | 163 | 737 | 329 | 383 | 79.5 | 254 | 654 | |
| Diet composition (% of DM) | |||||||||||
| Forage content | 384 | 20.5 | 11.1 | 5.54 | 43.0 | 329 | 14.2 | 6.65 | 5.12 | 67.1 | |
| Concentrate | 384 | 79.5 | 11.1 | 57.0 | 94.5 | 329 | 85.4 | 6.65 | 32.9 | 94.9 | |
| Crude protein | 384 | 11.6 | 0.896 | 10.5 | 14.6 | 329 | 12.6 | 1.82 | 10.6 | 17.8 | |
| Ether extract | 384 | 4.9 | 1.28 | 2.97 | 7.30 | 329 | 4.22 | 1.08 | 2.60 | 7.10 | |
| Neutral detergent fibre | 384 | 27.1 | 5.70 | 18.9 | 44.2 | 329 | 31.0 | 34.2 | 23.3 | 40.8 | |
| Acid detergent fibre | 384 | 11.9 | 3.44 | 7.32 | 19.9 | 329 | 15.2 | 2.39 | 8.40 | 22.3 | |
| GE (MJ/kg DM) | 384 | 18.1 | 0.327 | 17.4 | 19.5 | – | – | – | – | – | |
| Hemicellulose | 384 | 15.2 | 3.00 | 11.4 | 29.3 | – | – | – | – | – | |
| Cellulose | 384 | 10.2 | 3.06 | 5.37 | 16.8 | – | – | – | – | – | |
| Starch | 384 | 34.9 | 9.63 | 20.0 | 51.0 | – | – | – | – | – | |
| CH4 emissions | |||||||||||
| CH4 production (g/day) | 384 | 79.9 | 27.5 | 20.9 | 179 | 329 | 86.9 | 31.2 | 15.1 | 187.6 | |
| CH4 yield (g/kg DMI) | 384 | 9.32 | 3.74 | 1.97 | 21.1 | – | 11.7 | 4.5 | 1.81 | 26.4 | |
| Ym (% of GE intake) | 384 | 2.86 | 1.16 | 0.595 | 6.61 | – | – | – | – | – | |
DM, dry matter; GE, gross energy; DMI, DM intake; Ym, emission factor; n, number of observations.
Study ARA22-013 (A. Almeida, unpubl. data) was the largest proportion of the database (82.03%). A steering committee consisting of consulting feedlot nutritionists designed diet specifications to reflect a range of diets representative of the Australian lot feeding industry. A total of 16 different diets containing four levels of NDF (19.4%, 24.7%, 29.8%, and 34.4% of DM) and four levels of EE (3.1%, 4.3%, 5.3%, and 6.7% of DM) were evaluated over a 112-day feeding period. Two blocks of 20 Angus steers with initial body weight (BW) of 336 ± 21 kg (five animals per EE level; 40 total), were stepped down from 34.4% to 19.4% NDF, using four 28-day periods on each NDF level. The CH4 production was individually measured eight times, on days 20, 27, 48, 55, 76, 83, 104, and 111, resulting in a total of 320 observations. One steer was injured on day 56 and was excluded from measurement periods on days 62, 69, 76, 83, 90, 97, 104 and 111. In addition, one other individual chamber observation on day 7 was removed, due to low DMI of one steer during CH4 measurement. The final number of observations used in the analyses were 315.
Study AEC-20-061 (previously published as Almeida et al. 2023) involved four Angus steers with CH4 measured over a 112-day feeding period. Steers were transitioned to a final finisher diet by day 21, utilising three transition diets (7 days each). Mean analysed NDF (40.5%, 33.7%, 31.3% and 29.0%) and EE (4.35%, 4.70%, 5.57% and 6.66%) were recorded for starter, transition 1, transition 2 and finisher diets, respectively. The CH4 production was individually measured eight times, on days 7, 14, 21, 28, 49, 70, 91, and 112, resulting in a total of 32 observations. Two individual chamber observations were removed from the dataset on day 28 because of low DMI of two steers during CH4 measurement. The final number of observations used in the analyses were 30 (7.81% of database).
Study ARA-21-106 (previously published as Cowley et al. (2024a) involved five Angus heifers (initial BW 346 ± 6 kg) fed for an 81-day period. Heifers were transitioned to a final finisher diet by day 23, by feeding three transition diets. Starter was fed for 8 days, transition 1 for 8 days, and transition 2 for 7 days. Mean analysed NDF (42.0%, 33.8%, 28.5% and 28.0%) and EE (4.6%, 4.6%, 4.7%, and 5.2%) were recorded for starter, transition 1, transition 2 and finisher diets, respectively. The CH4 was individually measured seven times, on days 6, 14, 21, 34, 48, 62 and 76. One heifer contracted ruminal acidosis on day 52 and was excluded from measurement periods on days 62 and 76. In addition, one other individual chamber observation at day 21 was removed due to low DMI of one heifer during CH4 measurement. The final number of observations used in the analysis were 32 (8.33% of database).
Study AEC-18-028 (A. Nortup, unpubl. data) involved four Lowline Angus cattle (198 ± 39 kg initial BW) fed for 28 days. Steers were fed 2.0% BW (DM basis), and were progressively adapted through starter, transition 1, and transition 2 and finisher diets with 1 week on each diet (45%, 56%, 67% and 79% tempered barley respectively, DM basis). The CH4 was individually measured on days 6 and 7 of the finisher period only. One individual chamber observation on day 7 was removed due to low DMI of one steer during CH4 measurement. The final number of observations used in the analyses were seven (1.82% of database).
Description of the new model validation database
For validation of the new equation, a second database of 329 individual records from 122 feedlot cattle was assembled (Database 2; Table 1, Tables S1 and S3), pooled from eight open circuit respiration chamber studies conducted at the Large Animal Facility at CART at the University of New England from 2022 to 2024. All experiments followed animal care and handling procedures in accordance with approvals granted by the Animal Ethics Committee of the University of New England (Authorities numbers: ARA22-094, ARA 23-018, ARA22-038, ARA24-020, ARA22-101, ARA23-069, ARA23-069.1, and ARA24-030). In these studies, HGP-free feedlot cattle of Angus, Shorthorn, Santa Gertrudis, Wagyu and Brahman × Bos taurus composite breeds were fed transition and finisher diets based on tempered rolled barley or steam-flaked barley or wheat, or combinations of steam-flaked wheat and barley.
Study ARA22-094 (previously published as Chowdhury et al. 2024) involved four Brahman × Bos taurus composite steers (initial BW: 361 ± 35.5 kg) fed for 77 days. The steers were transitioned to a 50% steam-flaked barley- and 50% steam-flaked wheat-based finisher diet by day 22, using three intermediate transition diets, each fed for 7 days. Mean analysed NDF (35.9%, 30.1%, 29.6%, and 26.2% DM) and EE (2.6%, 4.9%, 3.7%, and 6.2% DM) were recorded for the starter, transition 1, transition 2, and finisher diets, respectively. Methane emissions were measured individually seven times, on days 7, 14, 21, 35, 49, 63, and 77, resulting 28 observations in total. Due to a chamber malfunction on day 7, one reading was excluded, leaving 27 observations (7.7% of the database) for the final analysis.
Study ARA22-038 (previously published as Cowley et al. (2024b)) involved eight Brahman × Bos taurus composite steers (initial BW: 374 ± 16.3 kg) and four Angus steers (initial BW: 346 ± 15.2 kg) fed for a 55-day period. Steers were transitioned to three different finisher diets, based on either steam-flaked barley, steam-flaked wheat or a mix of equal parts steam-flaked barley and steam-flaked wheat by day 22, utilising three transition diets fed for 7 days each. Mean NDF (40.1%, 38.2%, 34.2%, and 29.0% DM) and EE (3.4%, 2.9%, 2.3%, and 6.2% DM) were recorded for the starter, transition 1, transition 2, and finisher diets, respectively. A total of 48 CH4 emission observations were collected, with individual measurements conducted four times, on days 13, 20, 27, and 34. Observations included in the final analysis represented 13.6% of the database.
Study ARA24-020 (F. Cowley, unpubl. data) involved 10 Shorthorn steers (initial BW: 267 ± 19.5 kg) fed a tempered barley-based transition 1 diet over a 21-day period. Steers underwent a 7-day adaptation to housing and a total mixed ration (TMR), followed by a 14-day experimental phase. The diet contained 27.3% NDF and 3.8% EE on a DM basis. Enteric CH4 emissions were measured five times, on days 7, 8, 13, and 14, resulting in a total of 40 observations. For the final analysis, baseline measurements from all 10 steers, (n = 20) and control group (n = 4) observations were included, representing 6.8% of the database.
Study ARA22-101 (F. Cowley, unpubl. data) involved 20 Angus steers (initial BW: 425 ± 35.5 kg) fed over a 63-day period. Steers were transitioned to a tempered barley-based finisher diet by day 22, using the starter, transition 1 and transition 2 diets, each fed for 7 days. Mean NDF (31.4%, 28.9%, 29.6%, and 30.1% DM) and EE (3.9%, 4.3%, 3.9%, and 4.6% DM) concentrations were recorded for the starter, transition 1, transition 2, and finisher diets, respectively. Methane emissions were recorded five times, on days 22, 28, 35, 49, and 63. The final analysis included baseline methane data (n = 20) from day 22 and control group measurements (n = 20) from subsequent sampling days, contributing 40 observations (11.4% of the database).
Study ARA23-018 (F. Cowley, unpubl. data) involved five pureblood Wagyu steers (initial BW: 530 ± 31.2 kg) fed tempered barley and corn-silage based grower and then finisher diets for 42 days each, following a 4-day period of adaptation to housing. Mean NDF (26.2 and 25.5%) and EE (4.1 and 4.0%) concentrations were recorded for the grower and finisher diets, respectively. Methane emissions were recorded four times per diet, on days 34 and 41 (grower diet), and days 76 and 83 (finisher diet). The final observations used in the analysis were 24, representing 7% of the database.
Study ARA23-069 (F. Cowley, unpubl. data) involved 40 Santa Gertrudis steers (initial BW: 342 ± 35.8 kg) fed a tempered barley-based finisher diet over an 83-day period, with a 5-day adaptation to housing and the finisher ration followed by a 78-day experimental phase. The diet had an NDF and EE concentration of 34.1% and 3.5% on DM basis, respectively. Methane was individually measured on days 7, 8, 19, 20, 50, 51, 82, and 83. Due to a chamber malfunction on day 20, one reading was excluded. In the final analysis, only baseline measurements (n = 79) and control group data (n = 30) were included, accounting for 30% of the database.
Study ARA23-069.1 (F. Cowley, unpubl. data) involved 20 Angus cross steers (initial BW: 311 ± 46.6 kg) fed a tempered barley-based finisher diet over a 56-day period. After a 5-day adaptation to housing and the finisher diet, the experimental phase spanned 51 days and included a 23-day washout period between two 14-day sampling periods. The diet had an NDF concentration of 32.6% and an EE concentration of 4.0% on a DM basis. Enteric CH4 emissions were measured individually on days 7, 8, 19, 20, 55, and 56. Only baseline observations (n = 40) measured at day 7 and 8 were included in the final analysis, which contributed 11.4% of the database.
Study ARA24-030 (F. Cowley, unpubl. data) was conducted using 20 Shorthorn × Hereford steers (initial BW: 306 ± 19.1 kg) fed for a period of 96 days. After a 14-day adaptation to housing and a tempered barley-based transition 1 diet, the steers underwent an 82-day experimental phase, which included a 3-day baseline measurement and three 13-day sampling periods, separated by a 20-day washout period. Steers were transitioned to the finisher diet by day 22, using three successive transition diets each fed for 7 days. The transition 1 diet had an NDF and EE concentration of 33.0% and 3.7% on DM basis. Individual CH4 measurements were recorded on days 0, 1, 13, 14, 46, 47, 79, and 80. For the final analysis, only baseline observations (n = 40) collected on day 0 and 1 with the transition 1 diet were included, comprising 11.4% of the database.
Feeding and feed chemical composition
For the evaluation of extant equations and new model parametrisation, a total of 25 unique tempered rolled barley-based diets were used across all studies. For the validation of the new models, a total of 12 unique tempered rolled barley- and steam-flaked barley and/or wheat-based diets were used across all studies. The average chemical composition of the diets observed in the databases is reported in Table 1 (see Tables S2, S3 for further details). All studies adopted similar mixing procedures and feed chemical analyses. Dry matter (DM) of feed offered and refusals were measured (AOAC 1990, method 924.05) and feed offered was analysed for chemical analysis and fractions. Approximately three grab samples (~500 g) were collected at mixing of each batch of the diet. The samples were sealed and frozen at −20°C before analysis in duplicate. Gross energy was determined by using an adiabatic calorimetric bomb (Parr Instrument Co., Moline, IL, USA). Fat content (EE; AOAC 1990, method 930.15), starch (AOAC Method 996.11) and crude protein (CP) content by N analysis with Dumas combustion, by using Leco FP-528LC (Etheridge et al. 1998), were also analysed. The NDF content was determined with amylase and without sodium sulfate (Van Soest et al. 1991), and acid detergent fibre (ADF) and detergent lignin (ADL) were determined (Goering and Van Soest 1970) in an ANKOM 2000 Fiber Analyzer (ANKOM Technology, Macedon NY, USA). All ANKON F57 bags were then analysed for ash (AOAC 1990; method number 924.05) and fibre fractions were corrected for ash content. Hemicellulose was calculated by difference (NDF – ADF), cellulose was calculated as the difference between ADF and ADL, and soluble residue (SR) was calculated by subtracting CP and EE from the neutral detergent solubles (Database 1 only).
Measurements of CH4 production
For measurement of CH4 production, the cattle were confined over 23 h in open circuit respiration chambers (~20 m3) after at least 7 days adaptation to each diet. Briefly, chambers were sealed in the morning when cattle were fed. When in chambers, the cattle had ad libitum access to feed and water. Air temperature was controlled centrally and kept at ~21 °C for all chambers. Air temperature and relative humidity were measured in each chamber using sensors (BME280, Bosch Sensortec, Gerlingen, Germany). Air flow through each chamber (mean = 1.6 m3/min) was controlled using a flow meter (Model ST75V, Fluid Components International, San Marcos, CA, USA). For AEC-18-028, ARA21-106, AEC-20-061, ARA22-013, ARA22-094, and ARA22-038, the concentration of CH4 (parts per million per volume) was measured in the chamber incoming (ambient) and exhaust air streams using a Servomex Multigas Analyzer (Servomex 4100 Gas Purity Analyzer) calibrated for CH4, CO2 and O2, before each measurement day. Moisture was removed by a drying column before a multiplexer was used to direct the dried sample air from each chamber and the ambient air into the analyser in turn. CH4, CO2 and O2 concentrations were measured over 10 s after a 40 s purge time, by the Servomex analyser. Air flow and gas concentration data from the sampled air were loaded directly into a daily workbook with separate Excel spreadsheets for each chamber every 9 min, and used to calculate g of CH4/L air. For ARA24-020, ARA22-101, ARA23-069, ARA23-069.1, and ARA24-030, the concentration of CH4 (parts per million per volume) was measured in the chamber incoming (ambient) and exhaust air streams using a low-pressure sampling Optical Feedback Cavity Enhanced Absorption Spectroscopy Analyser, (Proceas®, AP2E, Aix-en-Provence, France), auto-calibrated for CH4, CO2, O2, H2, NH3, and N2O. A multiplexer was used to direct the dried sample air from each chamber and the ambient air into the analyser in turn. CH4, CO2, O2, H2, NH3, and N2O concentrations were measured over 90 s after a 30 s purge time, by the Proceas® analyser. For all data, air flow was corrected to standard temperature and pressure, accounting for altitude, and hourly variation in temperature and barometric air pressure. CH4 production was averaged hourly and daily CH4 production estimated by the area under the curve by the approximate integral using the trapezoidal rule. In all cases, recovery of CH4 through the chambers was assessed pre-measurement and post-measurement by introducing pure CH4 at a known rate via a mass flow controller (Smart Trak 2 Series 100, Sierra Instruments, Monterey, CA, USA) and the gas analyser was used to quantify CH4 concentration. All daily CH4 emission data was corrected for 100% of CH4 recovery. Mean CH4 recovery was 96.8 ± 4.48% (AEC-18-028), 92.8 ± 1.36% (AEC-20-061), 97.5 ± 2.05% (ARA-21-106) 101 ± 3.28% (AEC-22-013), 97.4 ± 1.46% (ARA22-038), 92.9 ± 2.93% (ARA22-094), ARA24-020, 91.9 ± 2.95% (ARA22-101), 94.1 ± 3.11% (ARA23-018) and 98.0 ± 3.07% (ARA23-069.1). CH4 yield (g CH4/kg DMI) was calculated by dividing the CH4 production by DMI recorded at the CH4 measurement day. Please refer to Hegarty et al. (2012) for further details on the use of the open circuit respiration chambers and CH4 measurement protocols.
Selection of CH4 prediction equations
The prediction equations evaluated for CH4 emissions from feedlot cattle fed grain-based diets were from Moe and Tyrrell (1979), IPCC (2006, 2019), Escobar-Bahamondes et al. (2017a), and Galyean and Hales (2022) (Table 2). We reviewed several candidate equations and selected the ones that were likely derived from datasets similar to the one we used in the present study, required input variables that were available in our database and included predictor variables that can be easily determined by commercial feed analysis laboratories. The Moe and Tyrrell (1979) equation, which is currently used to predict CH4 emissions of feedlot cattle in the Australian National Inventory Report (Commonwealth of Australia 2023), takes into account the intake of cell wall carbohydrates (HC and CEL) and cell contents (SR = 100 – NDF – EE – CP) (Eqn 1, Table 2). The IPCC (2006) tier 2 equation uses an emission conversion factor (Ym) based on daily gross energy intake (GEI, MJ/day) (Eqn 2, Table 2). For diets containing 90% or more concentrate (typical of feedlot finisher diets), the IPCC specifies Ym is 3.0 ± 1.0% of GEI. For all other diets and cattle categories, the IPCC specifies Ym is 6.5 ± 1.0%. The IPCC (2019) tier 2 approach uses CH4 yield (MY) of 21.0 g CH4/kg dry matter intake (DMI, equivalent to Ym = 6.3%; total mixed rations with 15–75% of high-quality forage), MY = 13.6 g CH4/kg DMI (equivalent to Ym = 4.0%; non-steam-flaked corn-based diets, forage from 0 to 15%) (Eqn 3a – used MY and Eqn 3b used Ym, Table 2). The equations proposed by Escobar-Bahamondes et al. (2017a) included as inputs BW, crude protein intake, CP:NDF and dietary starch:NDF ratios, and polynomial effects of fat2, DMI2 and (NDF – ADF)3 (Eqns 4a, 4b, Table 2, see supplementary material in Escobar-Bahamondes et al. (2017a) for further details on the database used to derive Eqns 4a, 4b). Finally, Galyean and Hales (2022) proposed modified Ellis et al. (2009) equations that can predict CH4 production (g/day) from DMI, dietary starch:NDF ratio with or without dietary ether extract (EE) concentration, assuming an energy value of 55.65 MJ/kg CH4 (Eqns 5a, 5b, Table 2, please refer to supplementary data in Galyean and Hales (2022) for further details on the database used to derive Eqns 5a, 5b).
| Equations | Source | Description A | |
|---|---|---|---|
| (1) | Moe and Tyrrell (1979) B | ||
| (2) | IPCC (2006) C | ||
| (3a) | IPCC (2019) D | ||
| (3b) | IPCC (2019) E | ||
| (4a) | Escobar-Bahamondes et al. (2017a) F | ||
| (4b) | Escobar-Bahamondes et al. (2017a) F | ||
| (5a) | Galyean and Hales (2022) G | ||
| (5b) | Galyean and Hales (2022) G |
Evaluation of equation adequacy
Each equation was assessed by regressing residual (observed – predicted) values on the predicted values, centred on their mean values (St-Pierre 2003). This procedure makes the intercept and slope estimates independent. We performed the analysis using the PROC MIXED of SAS 9.4 (SAS Systems Inc., Cary, NC; St-Pierre 2001). The slopes and intercepts of each equation were estimated using the ESTIMATE statement of the MIXED procedure in SAS, along with the root mean square error (RMSE) of this regression. The intercepts of the regression equations were the mean biases, whereas the slopes of such regression equations were the linear biases. When linear bias was significant (P ≤ 0.05) the bias and minimum and maximum predicted values were calculated. Additionally, observed CH4 was regressed on predicted CH4 for each equation. The coefficient of determination (r2) was obtained as a measure of the strength of the relationship between observed and predicted CH4. To evaluate model precision, several commonly used measures of adequacy were employed, including mean absolute error (MAE), mean square prediction error (MSPE), as described in Table S4. The MSPE was decomposed into mean bias, systematic bias, and random variation to assess sources of variation (Table S4, McMeniman et al. 2009). Additionally, the concordance correlation coefficient (CCC; Lin 1989) was estimated for each equation. The closer the CCC of a model to 1, the better the equation (accuracy and precision).
Sensitivity analysis
Pearson’s correlation coefficients were calculated using the CORR procedure to determine the strength of the linear relationship between the input variables and CH4 emissions in feedlot cattle, as well as between the input variables themselves. Then sensitivity analysis was performed to evaluate the variability of existing empirical equations to predict feedlot cattle CH4 emission predictions using Monte Carlo simulations. This involved varying the input of independent variables within each equation using the minimum and maximum values of each input variable in the database to simulate the local sensitivity of CH4 predictions, while the other input variables within a given equation was kept at its mean value. The resulting range of CH4 predictions for each equation was then illustrated using tornado plots.
New equation parametrization and validation
Based on the correlation analysis and graphical exploration on the input variables in the database, we identified variables that exhibited a strong association with CH4 production, had low correlation among themselves, and could be easily measured. To assess the potential for adjusting coefficients in predicting daily CH4 production in g/day, we conducted stepwise regression analyses using SAS software (STEPWISE procedure; SAS Systems Inc., Cary, NC). Variables tested included: DMI, CP, EE, starch, and NDF content. Significance was declared at P < 0.05. Statistical analysis in all models was performed using the MIXED procedure of SAS software. Linear mixed model regressions were fitted assuming the effect of study as a random effect. The slopes and intercepts of each equation were estimated using the ESTIMATE statement of the MIXED procedure in SAS.
The general statistical model used was as follows:
CH4ijk = is the dependent variable for the jth animal of the ith study, Xij is the independent variable for the jth animal of the ith study, aj and bj are the parameters to be estimated, sj is the random effect of the ith study ~ , eijk is residual error ~ .
Multiple mixed model equations were also fitted considering study as random effect. The slopes and intercepts of each equation were estimated using the ESTIMATE statement of the MIXED procedure in SAS.
CH4ijk = is the dependent variable for the jth animal of the ith study, X1ij and X2ij are significant independent variables for the jth animal of the ith study, aj, b1i and b2i are the parameters to be estimated, sj is the random effect of the ith study ~ , eijk is residual error ~ .
Results
Equation assessment using Database 1
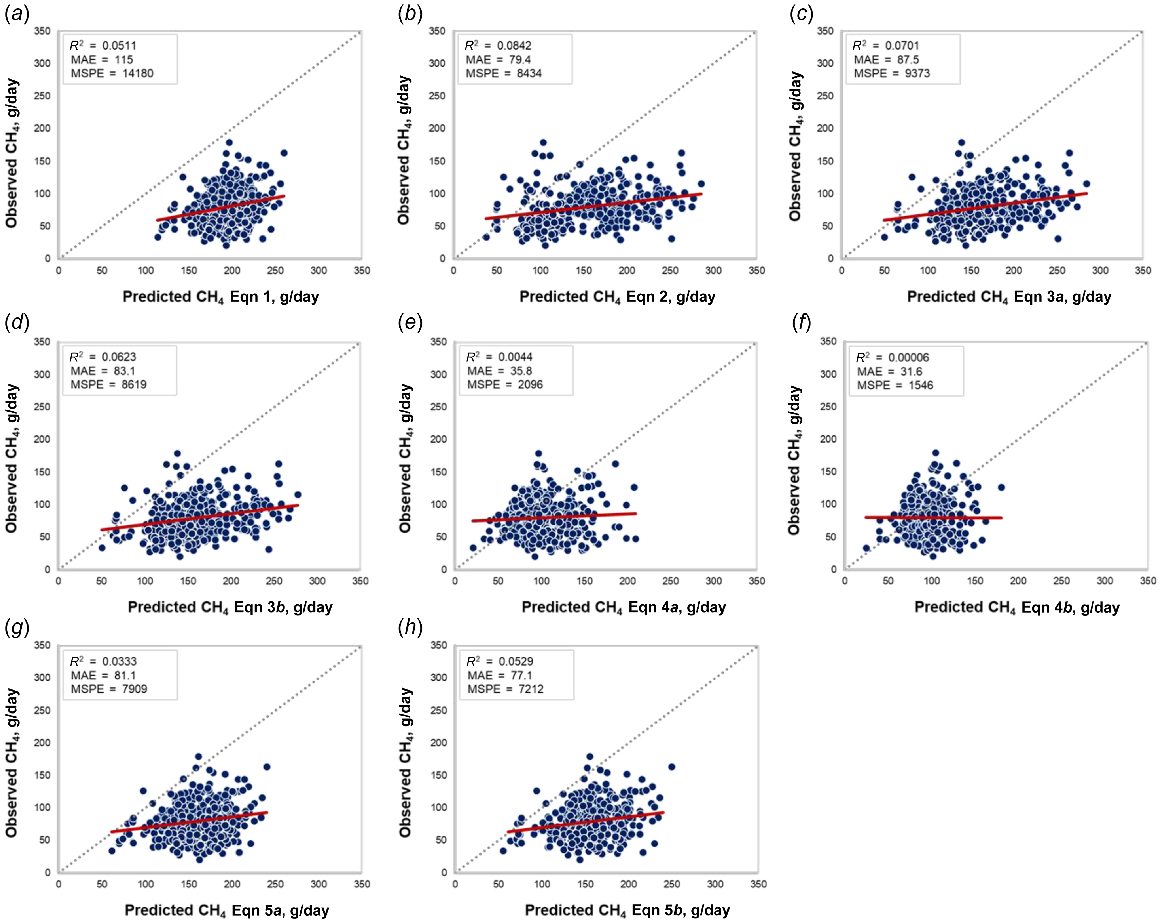
Upon evaluating the equations for predicting CH4 from the published literature (Table 2), we observed that without exceptions, all equations exhibited both mean bias and systematic bias (Fig. 1). Based on the data presented in (Table 3; Fig. 1a), it can be observed that the equation proposed by Moe and Tyrrell (1979; Eqn 1) overestimated enteric CH4 emissions by 115 ± 1.37 g/day (P < 0.01). Similarly, Eqn 2 (IPCC 2006) overestimated CH4 by 75.9 ± 1.34 g/day. The prediction Eqns 3a, 3b from the IPCC (2019), overestimated CH4 by 86.4 ± 1.36 g/day and 81.8 ± 1.36 g/day, respectively. The equation proposed Escobar-Bahamondes et al. (2017a; Eqn 4b), that required as inputs BW, CP:NDF, STARCH:NDF ratios, and polynomial effects of DMI and fat was the best fit of the extant equations, yet still over-predicted CH4 by 17.8 ± 1.41 g/day, with significant systematic bias. This overestimate increased to 24.0 ± 1.40 g/day when BW, CP, and polynomial effects of hemicellulose and fat were used as inputs (Eqn 4a). The equations proposed by Galyean and Hales (2022) that considered DMI and ratio of dietary starch to NDF concentrations alone or in combination with EE concentration overestimated CH4 predictions by 80.9 ± 1.38 g/day and 76.7 ± 1.37 g/day, respectively (Eqns 5a, 5b, Table 3).
Plot of observed CH4 (g/day) vs predicted CH4 (g/day) from literature equations. r2 = coefficient of determination, MAE = mean absolute error, MSPE = mean square prediction error.
| Equation A | Mean bias B | Linear bias C | Bias at minimum predicted CH4 (g/day) | Bias at maximum predicted CH4 (g/day) | RMSE D | CCC E | |||
|---|---|---|---|---|---|---|---|---|---|
| Estimate ± s.e. | P-value | Estimate ± s.e. | P-value | ||||||
| (1) Moe and Tyrrell (1979) | −115 ± 1.37 | < 0.01 | −0.744 ± 0.063 | < 0.01 | −55.0 | −163 | 26.8 | 0.0665 | |
| (2) IPCC (2006) | −75.9 ± 1.34 | < 0.01 | −0.848 ± 0.0257 | < 0.01 | 24.3 | −186 | 26.4 | 0.0935 | |
| (3a) IPCC (2019) MY | −86.4 ± 1.36 | < 0.01 | −0.827 ± 0.0322 | < 0.01 | 10.47 | −184 | 26.6 | 0.0133 | |
| (3b) IPCC (2019)Ym | −81.8 ± 1.36 | < 0.01 | −0.836 ± 0.0326 | < 0.01 | 11.4 | −178 | 26.7 | 0.003 | |
| (4a) Escobar-Bahamondes et al. (2017a) | −24.0 ± 1.40 | < 0.01 | −0.938 ± 0.0474 | < 0.01 | 54.1 | −123 | 28.0 | 0.0490 | |
| (4b) Escobar-Bahamondes et al. (2017a) | −17.8 ± 1.41 | < 0.01 | −1.00 ± 0.0653 | < 0.01 | 56.0 | −101 | 27.5 | 0.0059 | |
| (5a) Galyean and Hales (2022) | −80.9 ± 1.38 | < 0.01 | −0.834 ± 0.0456 | < 0.01 | 2.21 | −147 | 27.1 | 0.0371 | |
| (5b) Galyean and Hales (2022) | −76.7 ± 1.37 | < 0.01 | −0.797 ± 0.0439 | < 0.01 | 4.14 | −151 | 26.8 | 0.0518 | |
As shown in Table 3, all equations displayed significant linear bias, indicating the presence of a systematic bias in CH4 predictions (Table 3 and Fig. 1). This result indicates that the error in CH4 prediction varies with the predicted CH4 value. In all instances, there are negative slopes in Table 3, indicating that increasing the CH4 predictions results in greater overestimation of CH4. All variables in Table 1 were tested as covariates in an attempt to eliminate the linear bias, but this was unsuccessful (P ≥ 0.12).
The decomposition of MSPE revealed that the greatest proportion was due to mean bias (93.3%), only 1.66% was due to systematic bias and 5.08% was random bias in the equation proposed by Moe and Tyrrell (1979; Eqn 1; Fig. 1a). Both IPCC (2019) equations showed unbalanced bias decomposition. Eqn 3a had 79.6%, 12.9% and 7.53% of the MSPE as mean, systematic and random bias, respectively (Fig. 1c). Similarly, Eqn 3b had 77.6%, 14.1% and 8.26% of the MSPE as mean, systematic and random bias, respectively (Fig. 1d). Both equations proposed by Escobar-Bahamondes et al. (2017a; Eqns 4a, 4b; Fig. 1e, f) showed balanced distribution of the errors. In this sense, mean bias represented 27.4% and 20.6% of the MSPE, systematic bias was 36.6% and 30.3% of the MSPE and random bias was 36.0% and 49.1% of the MSPE in Eqns 4a, 4b, respectively. The majority of the errors in equations proposed by Galyean and Hales (2022; Eqns 5a, 5b; Fig. 1g–h) were due to mean bias (82.1% and 81.5% respectively). Systematic bias corresponded to 8.03% and 8.49% respectively (Eqns 5a and 5b). Random bias was 9.28% and 9.97% respectively (Eqns 5a and 5b).
Correlation and sensitivity analysis
When investigating the impact of input values (independent variables) on the uncertainty of CH4 output (dependent variable) in the evaluated equations, we utilised tornado diagrams. Our findings revealed that the quantity of soluble residues had the greatest influence on the Moe and Tyrrell (1979) equation. It is worth noting that there is a high correlation between SR and HC (0.43), as well as CEL and HC (0.43), as depicted in Fig. 2. This high correlation raises concerns regarding potential collinearity issues.
Linear relationship (Pearson correlation = r) of input variables required to predict methane in evaluated literature equations. CH4 = methane, DMI = dry matter intake, BW = body weight, Ym = emission factor, CP = crude protein, EE = ether extract, NDF = neutral detergent fibre, HC = hemicellulose, ADF = acid detergent fibre, CEL= cellulose, SR = soluble residue, STA = starch.
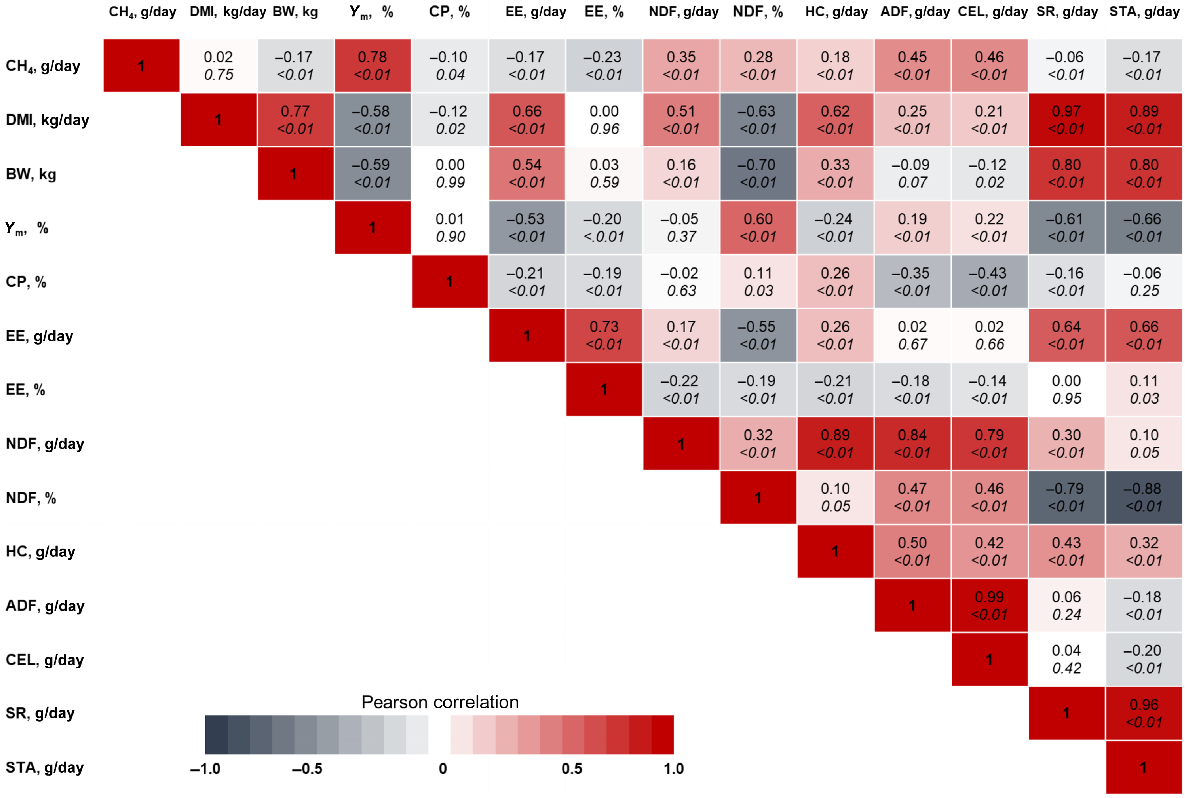
Body weight was ranked the most influential input in predicting CH4 in Eqns 4a, 4b (Fig. 3e–f), both proposed by Escobar-Bahamondes et al. (2017a). It is important to note that there is a high correlation between BW and DMI with a coefficient of 0.77 (Fig. 2), which indicates a strong relationship between these two variables. Additionally, a similar observation can be made for HC and DMI, which is the second most influential input in Eqn 4a (Fig. 3e).
Tornado plot depicting low (blue zone) and high (red zone) input variables of existing equations to predict daily CH4 emission (g) in feedlot cattle. White values inside the blue and red bars represent the predicted CH4 emission (g/day) at the minimum (blue) and maximum (red) values of each input variable. GEI = gross energy intake, SR = soluble residue, CEL = cellulose, HC = hemicellulose, DMI = dry matter intake, BW = body weight, NDF = neutral detergent fibre, ADF = acid detergent fibre, CP = crude protein, STA = starch.
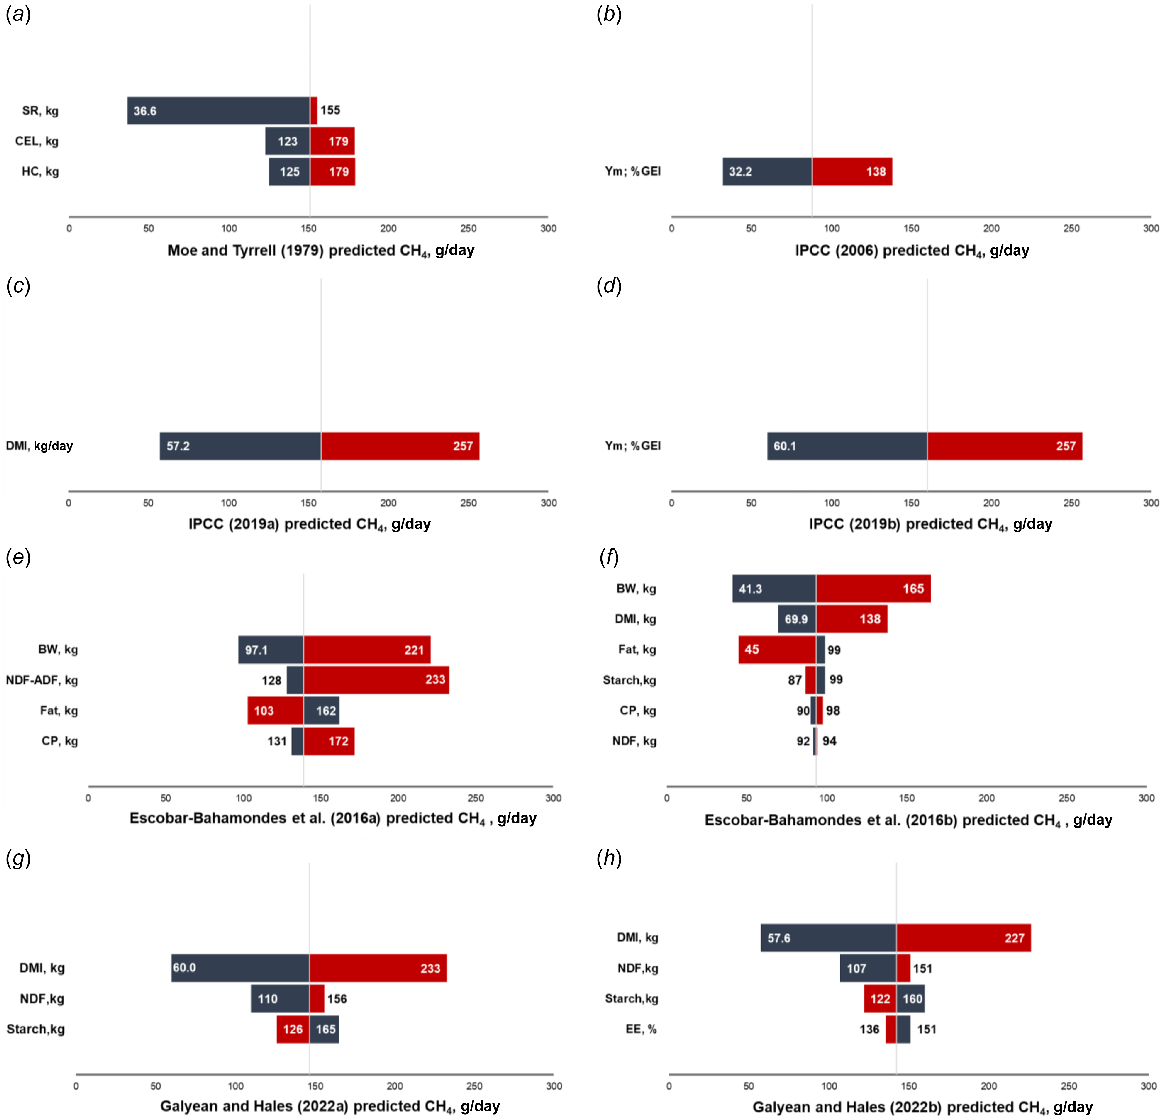
In the analysis of the equations proposed by Galyean and Hales (2022), the tornado plot revealed that the input variables DMI, NDF, and starch were ranked as the first, second, and third most influential variables, respectively (Fig. 3g, h). However, it is important to note that these input variables exhibited a high correlation among themselves (Fig. 2), which raises the potential issue of collinearity as mentioned earlier.
The mean predicted values estimated by Eqns 1, 2, 3a, 3b, 4a, 4b, 5a, 5b were 151, 87.9, 158, 160, 139, 93.6, 147, and 142 g/day; respectively. Thus, Eqn 2 displayed mean predicted value closer to the average CH4 production observed in the dataset (i.e. 79.9 g/day; Table 2). Additionally, it is worth noting that in all the evaluated equations, the relationships between the input variables observed in the sensitivity analysis were consistent with the existing correlations reported in Fig. 2. This means that the size and direction of the relationships observed in the tornado plots align with the correlations between the variables within the database used in the present study.
New equation parametrization
In accordance with the specified criteria to identify input variables that could improve the accuracy of predicting CH4 production by feedlot cattle, we conducted a stepwise procedure to test the variables DMI, NDF, EE, starch, and CP to produce a regression that minimised the RMSE and maximised the adjusted-r2 (Liu et al. 2017). The stepwise regression analysis revealed that DMI, EE, and dietary NDF met the P-value threshold (≤ 0.05) for entry into the equation. NDF was the first variable selected in the stepwise analysis (r2 = 0.892), followed by DMI (r2 = 0.909) then EE (r2 = 0.912). Thus, a multiple regression with intercept = 0 was fitted to predict CH4 production from feedlot cattle (Eqn 6; n = 384; P < 0.05; RMSE = 22.2; g/d; = 8.02; r2 = 0.91):
where CH4 is methane emissions in grams per day; DMI is dry matter intake in kg/day; EE is ether extract in % DM; NDF is neutral detergent fibre in % of DM, each parameter estimate is followed by its standard error after the ‘±’.
These findings suggest that a 1% increase in dietary EE results in a 4.0 g reduction in CH4 emissions, while each percentage point increase in dietary NDF contributes to a 2.3 g increase in CH4 production.
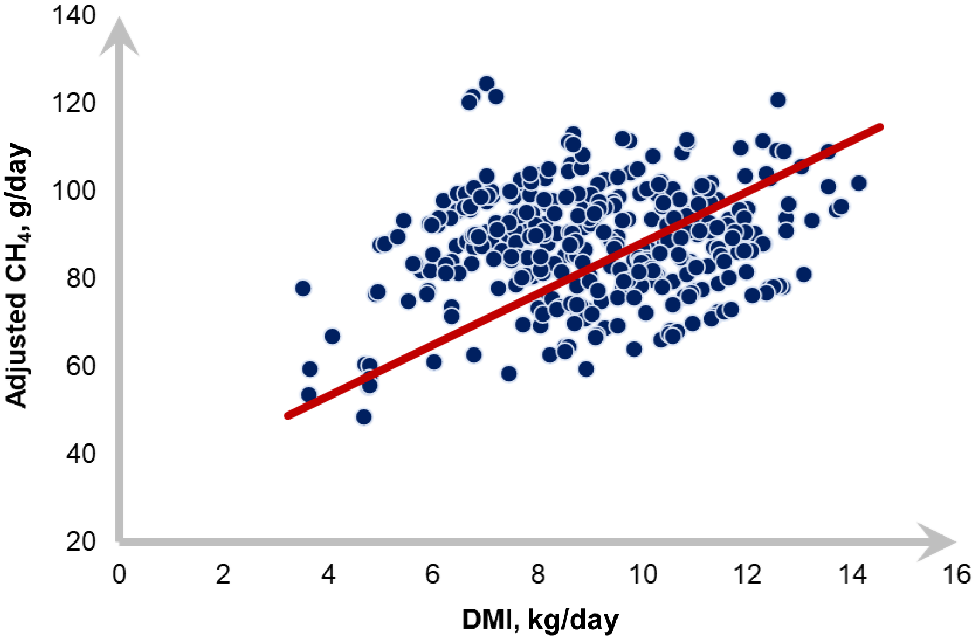
Alternatively, a simple linear equation (Eqn 7) with intercept = 0 was fitted between CH4 production (g/day) and DMI (kg), in which the slope represented the CH4 yield in g/kg DMI (Fig. 4; n = 384; P < 0.01; RMSE = 32.6 g/day; r2 = 0.85):
where CH4 is methane emissions in grams per day; DMI is dry matter intake in kg/day ± s.e.
Linear relationship between daily CH4 (methane, g) and DMI (dry matter intake, kg) in feedlot cattle fed tempered barley-based diets: CH4(g/day) = 9.89 ± 1.54 × DMI(kg/day) (Eqn 7; n = 384; P < 0.01; RMSE = 32.6 g/day; r2 = 0.85).
New equations validation
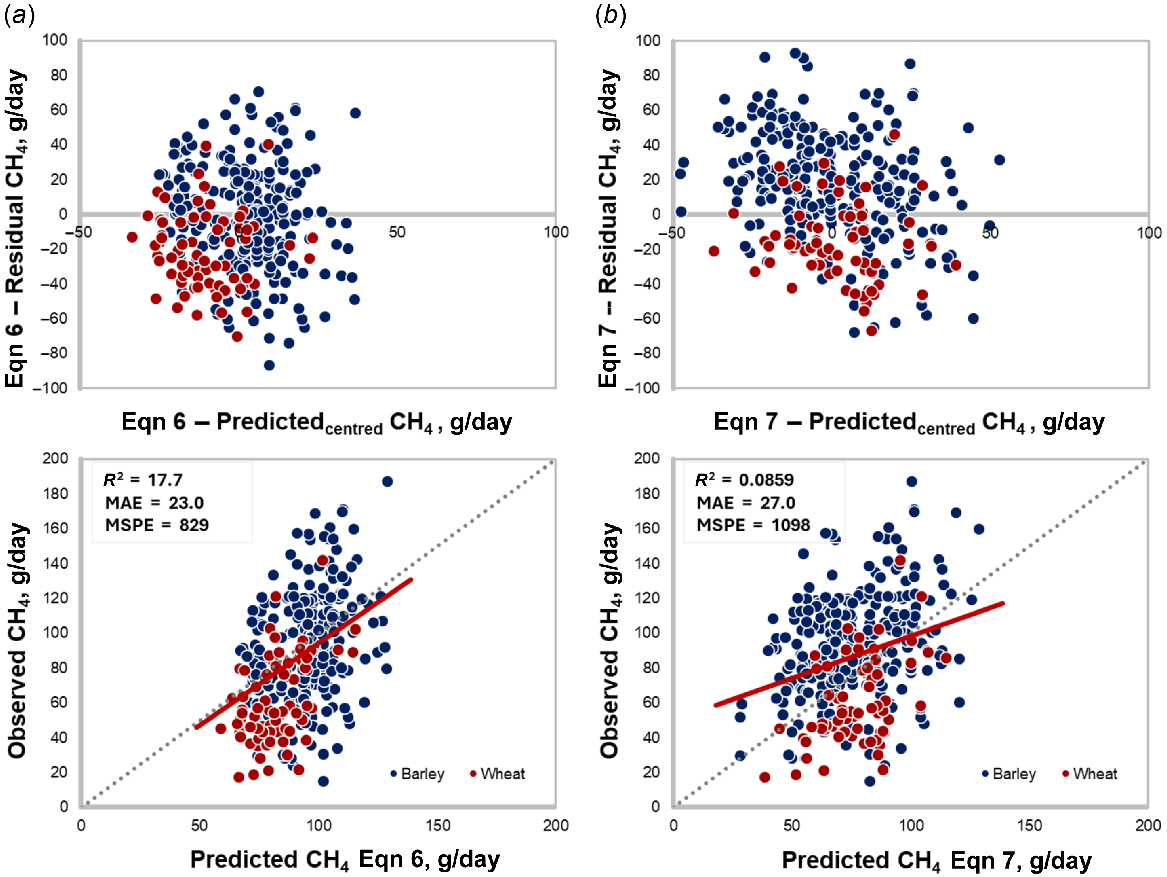
This newly developed equations (Eqns 6, 7) were tested with an independent evaluation dataset (n = 352; Fig. 5). Eqn 6 showed a mean bias of −5.42 ± 1.51 (Fig. 5a; P < 0.01; overestimation, but the smallest among all tested equations), with no evidence of linear bias (−0.0136 ± 0.113; P = 0.90;). Furthermore, Eqn 6 showed a smaller MSPE (829) and a higher CCC (0.296), indicating the best fit among the evaluated models (Fig. 5a). Eqn 7 overestimated CH4 production by 10.9 ± 1.598 g/day (Fig. 5b; P < 0.01) and exhibited a linear bias (−0.509 ± 0.0893; P < 0.01). Additionally, it demonstrated a poorer goodness of fit compared to Eqn 6, with an MSPE of 1098 and a CCC of 0.222.
Discussion
Accurately predicting baseline CH4 emissions from beef cattle is of utmost importance for the beef industry and governments alike. It serves as a vital component for accounting as part of national GHG inventories and enables the development and implementation of GHG mitigation strategies. Importantly, the ecosystem is not static, and over time, the approach to accounting for GHGs from various sectors will have to be reviewed and revisited regularly as new technologies for measurement and mitigation of GHG in ruminants emerge and are applied more broadly. By accurately assessing and minimising the contribution of cattle to climate change, we can work towards sustainable practices that mitigate the environmental impact of the beef industry. In the present study, a dataset was gathered for evaluating a number of equations in the peer reviewed literature that were developed to predict CH4 production in similar types of cattle. The database that forms the basis of this evaluation includes data from CH4 measurements conducted in respiration chambers, which are recognised as the ‘gold standard’ of enteric CH4 measurements. Importantly, industry representative management conditions and diets were provided to cattle during respiration chambers studies. Additionally, the database included a wide range of input variables that are known to impact CH4 production such as DMI, EE, CP, cell wall components, among others (Tables 1, 3). Breed variability was limited in the development dataset, which focused predominantly on Angus cattle in order to isolate dietary effects, as Angus represents the majority of feedlot cattle in Australia (MLA 2024). The independent validation dataset, however, encompassed a broader range of genotypes, including Shorthorn, Santa Gertrudis, and Brahman crossbreds, to evaluate the equations’ robustness across diverse animal typologies.
The current methodology used in Australian GHG reporting frameworks for estimating CH4 emissions from feedlot cattle relies on the Moe and Tyrrell (1979) equation (Eqn 1). This equation predicts daily CH4 emissions based on the daily intake of HC, CEL, and SR. Analysis of the database as part of this study has demonstrated that the Moe and Tyrrell (1979) equation overpredicts CH4 of Australian lot fed cattle by 115 ± 1.37 g/day (mean predicted CH4 195 g/day; mean observed CH4 79.9 g/day; mean bias is 144% of observed CH4 production). In the Australian context, the chemical analyses required to determine acid insoluble lignin fractions, and subsequently cellulose input into the Moe and Tyrrell (1979) equation, are not routinely performed, which makes usage of the equation difficult from a practical perspective.
It is important to note that this equation was derived from a meta-analysis of trials primarily conducted on Holstein dairy cattle, neglecting potential variations across different cattle breeds and diets. The evaluation of the Moe and Tyrrell (1979) equation in predicting CH4 revealed that although both dairy and beef cattle belong to the Bos taurus species, caution should be exercised when extrapolating results from one type of ruminant to another (Table 3; Fig. 1a). This caution stems from their distinct digestive physiologies, which encompasses factors such as mean retention time of digesta, digestibility of the feed provided, as well as digestion and fermentation characteristics (Bannink et al. 2016). For instance, dairy cows, depending on physiological state, have a higher nutritional demand and can consume a large amount of feed to support milk production, typically ranging from 3.0 to 4.0% BW (National Research Council 2001), whereas beef cattle consume less feed on a DM basis as a percentage of their BW (2.0–2.5%, National Academies of Sciences, Engineering, and Medicine 2016). Furthermore, the Ym of Moe and Tyrrell (1979) is 6.31%, similar to the value for forage based diets (6.3%), whereas the mean Ym of Database 1 was 2.38%. An additional point that has been raised is the impact of advancements in the management and breeding of ruminant animals over the past few decades on their digestive physiology. It is suggested that studies conducted in the 1980s or earlier may not be entirely applicable in present times due to greater intake capacity, increased passage rate and decreased digestibility, necessitating a cautious approach when extrapolating findings from older studies to contemporary conditions (van Gastelen et al. 2019).
In contrast, the IPCC (2006) methodology for predicting CH4 emissions has been shown to be effective for high-forage diets (as observed in Escobar-Bahamondes et al. 2017b). However, it falls short in delivering accurate CH4 predictions for Australian feedlot cattle when diet emissions factors are used as specified, as illustrated in Fig. 1b and Table 3. Such broad range of dietary characteristics allowed for a robust evaluation of multiple regression equations such as those proposed by Escobar-Bahamondes et al. (2017a) and Galyean and Hales (2022). However, more input variables did not result in better predictions in CH4, as shown in Table 3 and Fig. 1e–h. The potential reasons for the observed discrepancies in the predictions could be attributed to parametrisation issues or differences associated with both input and output variables. It is noteworthy that the emissions database in our study fell at the lower end of the range when compared to the databases employed by both Galyean and Hales (2022) and Escobar-Bahamondes et al. (2017a). This divergence in data may elucidate the observed lack of adequacy in our assessment of the equations.
In order to develop an equation to accurately reflect CH4 emissions of feedlot cattle, a multiple regression analysis was undertaken, facilitated by the inclusion of a diverse range of NDF and EE levels in the diets of animals evaluated as part of this study. This dataset effectively captured variations found in both growing and finishing dietary programs for feedlot cattle in Australia, as well as diets fed to a broad range of cattle types in feedlots in Australia, as demonstrated by the validation using a variety common barley and wheat-diets and other feedlot genotypes (Fig. 5).
For several decades, the dietary EE suppression on CH4 production in ruminants has been recognised (Blaxter and Czerkawski 1966). The proposed mechanism suggests that EE can reduce the populations of H2 producers, such as protozoa (Mao et al. 2010; Guyader et al. 2015), as well as methanogens (Mao et al. 2010; Martin et al. 2010). Additionally, Ungerfeld (2015) described a modest effect of EE as an acceptor of H+ through biohydrogenation. Dietary EE has been shown to be a potentially important predictor of CH4 (van Lingen et al. 2019). Nevertheless, the inclusion of EE as a predictor in the equations of Galyean and Hales (2022) did not result in improved predictions of CH4 production in our database (Table 3). However, EE percentage was a relevant input variable in the new proposed equation. Our multiple linear regression equation (Eqn 6) revealed that each percentage unit increase in EE in the diet resulted in a 4 g reduction in CH4 production. This value is consistent with previous studies. For example, Beauchemin et al. (2008) reported in a previous meta-analysis that for each percentage unit of EE oil added to the diet, CH4 yield was reduced by 5.56%. This highlights that the observed CH4 suppression in feedlot cattle fed high-fat diets is not solely attributed to a reduction in DM intake but is also a consequence of the addition of lipids.
Our results also showed that the net effect of EE on CH4 production will also depend on the other components in the basal diet, such as dietary NDF. For each one-percentage point increase in dietary NDF, there was a corresponding 2.3 g increase in CH4 production. This is a logical association as dietary fibre (e.g. NDF) represents a primary source linked to the production of volatile fatty acids, which, in turn, serves as the principal supplier of hydrogen ions (H+) for the methanogenesis in the rumen (Ungerfeld 2015). Additionally, high-NDF diets tend to increase the retention time of feed in the rumen, leading to more extensive fermentation and CH4 production (Hummel et al. 2006). Contrary to previous reports (Beauchemin and McGinn 2005), the basal grain type used in feedlot diets (i.e. corn vs barley) may not be the main driver of CH4 production, as our results (9.3 g CH4/kg DMI, Ym = 2.9%) showed CH4 emissions comparable to that expected for beef cattle fed high corn diets (steam-flaked) with added ionophores (10.0 g CH4/kg DMI, Ym = 3.0%; IPCC 2019). The present study highlights the partial applicability of existing corn-based equations under certain conditions but emphasises their limitations in fully capturing the unique characteristics of Australian feedlot systems, as evidenced by the presence of linear bias in both IPCC (2019) Eqns 3a, 3b and 7, which utilise a similar approach to the IPCC (2019) steam-flaked corn equation.
The complex nature of CH4 formation, influenced by various factors including diet, microbial populations, and animal-specific characteristics, can contribute to a high degree of variability in CH4 emissions. It is noteworthy that these complex equations may result in collinearity, which can pose problems in regression analysis because it can make it difficult to determine the individual effects of the correlated variables on the dependent variable (Fig. 2). It can also lead to unstable and unreliable estimates of the regression coefficients (Liu et al. 2017).
Dry matter intake is a crucial factor influencing CH4 production in ruminants (Congio et al. 2022), and it is also closely associated with production traits. In the evaluation of CH4 prediction equations, all the assessed equations had DMI explicitly or implicitly included as an input variable. This finding supports the validity of the Parsimony Law, which suggests that when multiple explanations exist for a phenomenon, the simplest explanation is often the correct one. This principle encourages the selection of simpler models that strike a balance between capturing essential patterns and minimising unnecessary complexity. Bearing this in mind, similar to the IPCC (2019) Tier 2 emission factor, for barley-based diets, we developed a CH4 yield factor, along with a multiple linear regression equation based on commonly available parameters to feedlot nutritionists including DMI, NDF and EE.
A validation database containing a diversity of breed types and grain sources enabled evaluation of the new equations under a greater range of scenarios than the development database, which were more reflective of the diversity of cattle and diets in the Australian feedlot sector. Despite the more varied evaluation database, the new equations demonstrated a better fit. However, the equation that considered both DMI and diet characteristics (i.e. fat and fibre content; Eqn 6) demonstrated a better goodness of fit than Eqn 7, which considered DMI only, to explain CH4 production. The trade-off lies in balancing accuracy and practicality: Eqn 6 offers improved accuracy by incorporating dietary characteristics like fat and fibre, making it better suited for explaining CH4 production in diverse diets. Conversely, Eqn 7 is simpler and relies solely on DMI, following a similar approach adopted by IPCC (2019), which makes it easier to apply in situations with limited data, but comes at the cost of reduced accuracy, particularly for diets with varied grain sources such as wheat and barley, as evidenced by the significant linear bias in the model evaluation.
Diets containing wheat (red dots; Fig. 5), exhibited lower predicted and observed values for daily CH4 production. This aligns with wheat’s higher net energy for BW gain values (National Academies of Sciences, Engineering, and Medicine 2016), and its lower estimated emissions observed during in vitro incubation studies (Plascencia et al. 2018). Together, these findings suggest that the new equation may slightly overestimate daily CH4 production for wheat-based diets compared to barley-based diets (blue dots, Fig. 5). Although this research employed the most accurate methods currently available for methane measurement, methane production inherently exhibits significant variability (as evidenced by the standard deviation of measured methane at 27.5 g/day and 31.2 g/day; Table 1). This variability is influenced by several factors, including host animal characteristics, microbial competition, dietary interactions, and environmental conditions, which cannot be precisely predicted by any single model developed to date. Consequently, an overestimation of 5.42 g/day is negligible when viewed within the broader context of these uncertainties (Ellis et al. 2009; Patra 2012). Furthermore, it is well recognised that CH4 prediction equations often exhibit regional specificity, reflecting differences in dietary composition, management practices, and environmental factors (Appuhamy et al. 2016; IPCC 2019). Although not commonly fed in the Australian feedlot industry, future research could also expand into corn and sorghum diets.
Adopting a more accurate equation for CH4 emissions from feedlot cattle has significant implications for national greenhouse gas inventories based on white grains, such as barley and wheat. Accurate equations tailored to local conditions will enable policymakers to implement more effective mitigation strategies and ensure compliance with international reporting standards. Additionally, refining emission estimates provides a foundation for evaluating the impact of emerging technologies and practices aimed at reducing CH4 emissions.
Conclusion
Based on a thorough model evaluation, our findings support the need to revise current methods to predict CH4 for barley and wheat-based diets. Our results propose a CH4 yield equation based on dry matter intake and an equation based on DMI, neutral detergent fibre (NDF) and ether extract (EE) for future implementation by the feedlot industry when using white grain diets.
Data availability
The data that support this study cannot be publicly shared due to ethical or privacy reasons and may be shared upon reasonable request to the corresponding author if appropriate.
Conflicts of interest
We affirm that we do not possess any financial or personal connections with individuals or organizations that could exert inappropriate influence on our work. Our commitment to impartiality and integrity remains unwavering, ensuring the objectivity and credibility of the information presented herein.
Declaration of funding
The authors thank Meat Livestock Australia (MLA, project code: B.FLT.5013) for providing financial support to conduct this research.
Acknowledgements
We sincerely appreciate the entire team’s collaboration and contributions to this project, in particular to Ms. Sigrid Mackenzie for her invaluable technical assistance and support throughout the study, the Australian feedlot industry consulting nutritionists who reviewed the project’s methodology, and Dr Md. Rashed Chowdhury, for his efforts assembling the validation database.
References
Almeida AK, Cowley F, McMeniman JP, Karagiannis A, Walker N, Tamassia LF, McGrath JJ, Hegarty RS (2023) Effect of 3-nitrooxypropanol on enteric methane emissions of feedlot cattle fed with a tempered barley-based diet with canola oil. Journal of Animal Science 101, skad237.
| Crossref | Google Scholar |
Appuhamy JA, France J, Kebreab E (2016) Models for predicting enteric methane emissions from dairy cows in North America, Europe, and Australia and New Zealand. Global Change Biology 22, 3039-3056.
| Crossref | Google Scholar | PubMed |
Bannink A, van Lingen HJ, Ellis JL, France J, Dijkstra J (2016) The contribution of mathematical modeling to understanding dynamic aspects of rumen metabolism. Frontiers in Microbiology 7, 1820.
| Crossref | Google Scholar | PubMed |
Beauchemin KA, McGinn SM (2005) Methane emissions from feedlot cattle fed barley or corn diets. Journal of Animal Science 83, 653-661.
| Crossref | Google Scholar | PubMed |
Beauchemin KA, Kreuzer M, O’mara FP, McAllister TA (2008) Nutritional management for enteric methane abatement: a review. Australian Journal of Experimental Agriculture 48, 21-27.
| Crossref | Google Scholar |
Blaxter KL, Czerkawski J (1966) Modification of the methane production of the sheep by supplementation of ITS diet. Journal of the Science of Food and Agriculture 17, 417-421.
| Crossref | Google Scholar | PubMed |
Chowdhury MR, Mackenzie S, Cowley F (2024) Increasing the inclusion rate of 3-nitrooxypropanol and dietary grain content reduces methane yield in feedlot cattle fed steam-flaked wheat and barley-based diet. In ‘Proceedings of the 35th Biennial Conference of the Australian Association of Animal Sciences and the 20th Asian-Australasian Association of Animal Production Societies’, 9th−12th July 2024, Melbourne, Australia. vol. 35, p. 131. (Australian Association of Animal Sciences).
Commonwealth of Australia (2019) National greenhouse gas inventory – Paris Agreement inventory. (Australian Greenhouse Emissions Information System) Available at https://www.dcceew.gov.au/climate-change/publications/national-greenhouse-accounts-2019/national-inventory-by-economic-sector-2019-emissions
Commonwealth of Australia (2023) National Inventory Report 2021. Vol. 1. Available at https://www.dcceew.gov.au/climate-change/publications/national-inventory-report-2021
Congio GF, Bannink A, Mayorga OL, Rodrigues JP, Bougouin A, Kebreab E, Silva RR, Maurício RM, da Silva SC, Oliveira PPA, Muñoz C, Pereira LGR, Gómez C, Ariza-Nieto C, Ribeiro-Filho HMN, Castelán-Ortega OA, Rosero-Noguera JR, Tieri MP, Rodrigues PHM, Marcondes MI, Astigarraga L, Abarca S, Hristov AN (2022) Prediction of enteric methane production and yield in dairy cattle using a Latin America and Caribbean database. Science of The Total Environment 825, 153982.
| Crossref | Google Scholar | PubMed |
Cowley FC, Kinley RD, Mackenzie SL, Fortes MRS, Palmieri C, Simanungkalit G, Almeida AK, Roque BM (2024a) Bioactive metabolites of Asparagopsis stabilized in canola oil completely suppress methane emissions in beef cattle fed a feedlot diet. Journal of Animal Science 102, skae109.
| Crossref | Google Scholar |
Cowley FC, Khan UH, de Almeida AK (2024b) Feedlot finisher diet composition affects inhibition of methane by 3-nitrooxypropanol. In ‘Proceedings of the 35th Biennial Conference of the Australian Association of Animal Sciences and the 20th Asian-Australasian Association of Animal Production Societies’, 9th−12th July 2024, Melbourne, Australia, vol. 35, p. 132. (Australian Association of Animal Sciences)
Ellis JL, Kebreab E, Odongo NE, Beauchemin K, McGinn S, Nkrumah JD, Moore SS, Christopherson R, Murdoch GK, McBride BM, Okine EK, France J (2009) Modeling methane production from beef cattle using linear and nonlinear approaches. Journal of Animal Science 87, 1334-1345.
| Crossref | Google Scholar | PubMed |
Escobar-Bahamondes P, Oba M, Beauchemin K (2017a) Universally applicable methane prediction equations for beef cattle fed high- or low-forage diets. Canadian Journal of Animal Science 97, 83-94.
| Crossref | Google Scholar |
Escobar-Bahamondes P, Oba M, Beauchemin KA (2017b) An evaluation of the accuracy and precision of methane prediction equations for beef cattle fed high-forage and high-grain diets. Animal 11, 68-77.
| Crossref | Google Scholar | PubMed |
Etheridge RD, Pesti GM, Foster EH (1998) A comparison of nitrogen values obtained utilizing the Kjeldahl nitrogen and Dumas combustion methodologies (Leco CNS 2000) on samples typical of an animal nutrition analytical laboratory. Animal Feed Science and Technology 73, 21-28.
| Crossref | Google Scholar |
Galyean ML, Hales KE (2022) Prediction of methane per unit of dry matter intake in growing and finishing cattle from the ratio of dietary concentrations of starch to neutral detergent fiber alone or in combination with dietary concentration of ether extract. Journal of Animal Science 100, skac243.
| Crossref | Google Scholar |
Guyader J, Eugène M, Meunier B, Doreau M, Morgavi D, Silberberg M, Rochette Y, Gerard C, Loncke C, Martin C (2015) Additive methane-mitigating effect between linseed oil and nitrate fed to cattle. Journal of Animal Science 93(7), 3564-3577.
| Crossref | Google Scholar |
Hammond KJ, Pacheco D, Burke JL, Koolaard JP, Muetzel S, Waghorn GC (2014) The effects of fresh forages and feed intake level on digesta kinetics and enteric methane emissions from sheep. Animal Feed Science and Technology 193, 32-43.
| Crossref | Google Scholar |
Hummel J, Südekum KH, Streich WJ, Clauss M (2006) Forage fermentation patterns and their implications for herbivore ingesta retention times. Functional Ecology 20, 989-1002.
| Crossref | Google Scholar |
IPCC (2006) 2006 IPCC guidelines for national greenhouse gas inventories. Volume 4 Agriculture, Forestry and Other Land Use. (Prepared by the National Greenhouse Gas Inventories Programme). (Eds HS Eggleston, L Buendia, K Miwa, T Ngara, K Tanabe). Institute for Global Environmental Strategies (IGES), Japan.
IPCC (2019) Refinement to the 2006 IPCC Guidelines for National Greenhouse Gas Inventories. (Eds E Calvo Buendia, K Tanabe, A Kranjc, J Baasansuren, M Fukuda, S Ngarize, A Osako, Y Pyrozhenko, P Shermanau, S Federici). (IPCC: Switzerland). Volume 5, Chapter 6. Available at https://www.ipcc.ch/report/2019-refinement-to-the-2006-ipcc-guidelines-for-national-greenhouse-gas-inventories/
Johnson KA, Johnson DE (1995) Methane emissions from cattle. Journal of Animal Science 73(8), 2483-2492.
| Crossref | Google Scholar | PubMed |
Lin LI (1989) A concordance correlation coefficient to evaluate reproducibility. Biometrics 45, 255-268.
| Crossref | Google Scholar | PubMed |
Liu Q, Shepherd BE, Li C, Harrell FE, Jr (2017) Modeling continuous response variables using ordinal regression. Statistics in Medicine 36(27), 4316-4335.
| Crossref | Google Scholar |
Mao H-L, Wang J-K, Zhou Y-Y, Liu J-X (2010) Effects of addition of tea saponins and soybean oil on methane production, fermentation and microbial population in the rumen of growing lambs. Livestock Science 129, 56-62.
| Crossref | Google Scholar |
Martin C, Morgavi DP, Doreau M (2010) Methane mitigation in ruminants: from microbe to the farm scale. Animal 4, 351-365.
| Crossref | Google Scholar | PubMed |
McMeniman JP, Defoor PJ, Galyean ML (2009) Evaluation of the National Research Council (1996) dry matter intake prediction equations and relationships between intake and performance by feedlot cattle. Journal of Animal Science 87, 1138.
| Crossref | Google Scholar | PubMed |
MLA (2024) Lot feeding brief: Results for the June quarter 2024 feedlot survey. Meat and Livestock Australia, North Sydney, NSW, Australia. Available at https://www.mla.com.au/globalassets/mla-corporate/prices--markets/documents/trends--analysis/lot-feeding-brief/mla_lot-feeding-brief_august-2024_220824.pdf
Moe PW, Tyrrell HF (1979) Methane production in dairy cows. Journal of Dairy Science 62, 1583-1586.
| Crossref | Google Scholar |
Patra AK (2012) Estimation of methane production from enteric fermentation in ruminants. Environmental Science & Policy 27, 98-107.
| Google Scholar |
Plascencia A, González-Vizcarra VM, Zinn RA (2018) Comparative effects of grain source on digestion characteristics of finishing diets for feedlot cattle: steam-flaked corn, barley, wheat, and oats. Canadian Journal of Animal Science 98(4), 794-800.
| Crossref | Google Scholar |
St-Pierre NR (2001) Invited review: Integrating quantitative findings from multiple studies using mixed model methodology. Journal of Dairy Science 84, 741-755.
| Crossref | Google Scholar | PubMed |
St-Pierre NR (2003) Reassessment of biases in predicted nitrogen flows to the duodenum by NRC 2001. Journal of Dairy Science 86, 344-350.
| Crossref | Google Scholar | PubMed |
Ungerfeld EM (2015) Shifts in metabolic hydrogen sinks in the methanogenesis-inhibited ruminal fermentation: a meta-analysis. Frontiers in Microbiology 6, 37.
| Crossref | Google Scholar | PubMed |
van Gastelen S, Dijkstra J, Bannink A (2019) Are dietary strategies to mitigate enteric methane emission equally effective across dairy cattle, beef cattle, and sheep? Journal of Dairy Science 102, 6109-6130.
| Crossref | Google Scholar | PubMed |
van Lingen HJ, Niu M, Kebreab E, Valadares Filho SC, Rooke JA, Duthie C-A, Schwarm A, Kreuzer M, Hynd PI, Caetano M (2019) Prediction of enteric methane production, yield and intensity of beef cattle using an intercontinental database. Agriculture, Ecosystems & Environment 283, 106575.
| Crossref | Google Scholar |
Van Soest P, Robertson JB, Lewis BA (1991) Methods for dietary fiber, neutral detergent fiber, and nonstarch polysaccharides in relation to animal nutrition. Journal of Dairy Science 74, 3583-3597.
| Crossref | Google Scholar | PubMed |