Calculation of new enteric methane emission factors for small ruminants in western Kenya highlights the heterogeneity of smallholder production systems
J. P. Goopy A B C G , P. W. Ndung’u A C , A. Onyango A D , P. Kirui A E and K. Butterbach-Bahl A F
A Mazingira Centre, International Livestock Research Institute, Old Naivasha Road, Uthiru, Nairobi, Kenya.
B School of Agriculture and Food, University of Melbourne, Parkville, Vic. 3010, Australia.
C University of Pretoria, Department of Animal and Wildlife Sciences, Private Bag X20, Hatfield, Pretoria, South Africa.
D University of Hohenheim, Institute of Agricultural Sciences in the Tropics (Hans-Ruthenberg-Institute), Stuttgart, Germany.
E Department of Animal Production, University of Nairobi, P.O. Box 29053-00625, Kangemi, Nairobi, Kenya.
F Karlsruhe Institute of Technology, Institute of Meteorology and Climate Research, Atmospheric Environmental Research, Garmisch-Partenkirchen, Germany.
G Corresponding author. Email: manofcows@yahoo.com
Animal Production Science 61(6) 602-612 https://doi.org/10.1071/AN19631
Submitted: 1 November 2019 Accepted: 5 December 2020 Published: 25 February 2021
Journal Compilation © CSIRO 2021 Open Access CC BY-NC-ND
Abstract
Context: African livestock play a critical role in food security and the wider economy, while accounting for >70% of African agricultural greenhouse gas emissions. Accurate estimates of greenhouse gas emissions from livestock are required for inventory purposes and to assess the efficacy of mitigation measures. While there is an increasing number of studies assessing methane (CH4) emissions of cattle, little attention has been paid to small ruminants (SR).
Aims: Enteric CH4 emissions were assessed from 1345 SR in three counties of western Kenya to develop more accurate emission factors (EF) for enteric CH4 from sheep and goats.
Methods: Using on-farm animal activity data, feed samples were also analysed to produce estimates of feed digestibility by season and region. The combined data were also used to estimate daily CH4 production by season, location and class of animal to produce new EF for annual enteric CH4 production of SR.
Key results: Mean dry-matter digestibility of the feed basket was in the range of 58–64%, depending on region and season (~10% greater than Tier I estimates). EF were similar for sheep (4.4 vs 5 kg CH4/year), but lower for goats (3.7 vs 5 kg CH4/year) than those given for SR in developing countries in Intergovernmental Panel on Climate Change (Tier I) estimates.
Conclusions: Published estimates of EF for SR range widely across Africa. In smallholder systems in western Kenya, SR appear to be managed differently from cattle, and EF appear to be driven by different management considerations.
Implications: The findings highlighted the heterogenous nature of SR enteric emissions in East Africa, but also suggested that emissions from SR are quantitatively less important than other estimates suggest compared with cattle.
Keywords: agricultural systems, climate, goats, methane, sheep.
Introduction
Livestock, whether in pastoralist or mixed cropping–livestock systems, are a cornerstone of agriculture in Sub-Saharan Africa and ruminant livestock, in particular, underpin the livelihoods of African subsistence and emerging farmers (McPeak and Little 2006; Herrero et al. 2010). However, paradoxically, ruminants both contribute to and are affected by the increasing impact of climate change as a consequence of anthropogenic greenhouse gas (GHG) emissions. Given the importance of livestock, and specifically of ruminants, as a source of global GHG emissions, several authors have emphasised the need for more accurate estimates of GHG from livestock in developing countries, so as to improve the understanding of sinks and sources of global GHG emissions and to develop strategies to mitigate emissions from the agricultural sector. Whereas emissions from the livestock sector are rather well described in the West, little is known for Sub-Saharan Africa (SSA), although recently there has been an upsurge of interest in improving inventories for SSA.
Most attention has been paid to cattle, whose greater numbers and larger body size make them the most economically important species of domestic ruminant in SSA (Jahnke et al. 1988), constituting 70–85% of total ruminant biomass (Herrero et al. 2008). Notwithstanding, it has been estimated that livestock contribute 70% or more of African agricultural GHG emissions (dominated by methane (CH4) from enteric fermentation; Tubiello et al. 2014) and small ruminants (SR) will undoubtedly be responsible for a significant part of this (Herrero et al. 2008).
A substantial impediment to improving our understanding of the contribution of SR to GHGs in SSA is the continued use of Intergovernmental Panel on Climate Change (IPCC) (Tier I) default emission factors (EF) to estimate enteric CH4 emissions. The Tier I EF, which employs a universal factor for all animals of one species (in Africa), fails to properly account for differences in production systems across various climatic zones, as demonstrated by the modelling approach of Herrero et al. (2008). To place the importance of spatially explicit data in context, of the two known African studies that have produced revised EF for SR, the South African study (Du Toit et al. 2013) found that Tier I estimates were 20–40% lower than the calculated EF for SR, while Ndao et al. (2019) found that Tier I overestimated the EF of West African sheep and goats by 50–65%. Clearly, there is a need to develop, at least, region-specific estimates for SR EF. A further consideration is that both seasonal fluxes in the availability and quality of feed in combination with husbandry practices are likely to profoundly affect the animals’ ability to meet their nutritional requirements and this, in turn, affects enteric CH4 production, and hence EF, in a way not properly accounted for by IPCC methodology (Goopy et al. 2018, 2020; Ndung’u et al. 2019).
In the present study, field assessments were conducted in three counties in western Kenya and detailed animal measurements were used to produce estimates of energy expenditure and feed intake and, thereby, estimates of individual CH4 production rate (daily methane production: DMP: CH4 g/d), and ultimately EF, were developed.
Materials and methods
Study areas
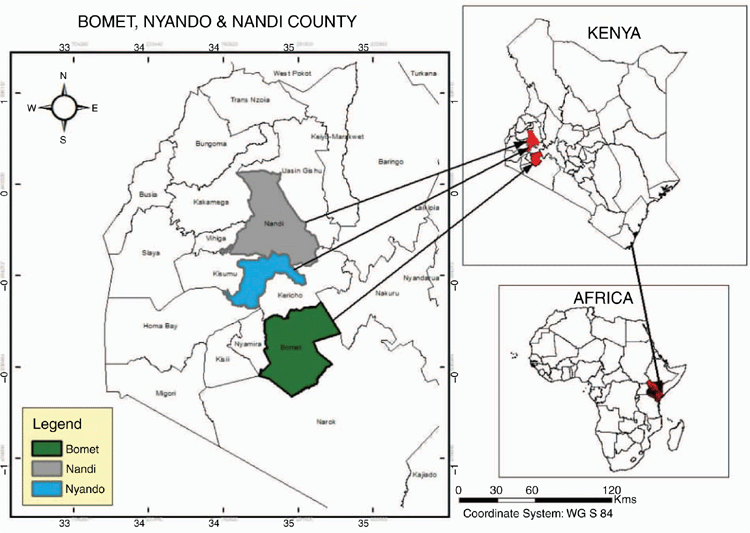
Detailed farm surveys were conducted in three areas of western Kenya (see Fig. 1), two of which (Nyando and Nandi) have been published elsewhere, and were concerned with enteric emissions from cattle. These are briefly outlined below.
Study site I was a 10 × 10 km2 block in the Nyando Basin of western Kenya (0°13′30″S–0°24′0″S, 34°54′0″E–35°4′30″E), with the study area being further divided into three distinct agro-ecological zones (AEZ), plains, mid-slopes and uplands. Details of both the site and the sampling protocol have been published in Goopy et al. (2018). Study site II was located in Nandi County in the western part of the Rift Valley of Kenya (0°10′0.00″N, 35°08′60.00″E) and was further divided into the following three AEZ: lower highland 1 (LH1), lower highland 2 (LH2) and upper midlands (UM). Details of both sites as well as the sampling protocol have been published in Ndung’u et al. (2019). Study site III was located in Bomet county in the southern Rift region of Kenya (0°48′0.00″N, 35°13′59.88″E) and was divided into the following four main AEZ: lower highland 1–3 and upper midlands 1–4. The sample size as well as the sampling protocol in Bomet county closely followed those in the study of Ndung’u et al. (2019).
Study sites were in fairly close proximity to one another (Fig. 1), with similar agro-ecological characteristics as described below, and following the characterisation by Jaetzold et al. (1983) and a bimodal rainfall pattern, with wet seasons occurring in April–June and October–December (Zhou et al. 2007).
Lower highland (LH) has a mean temperature of 15–18°C, altitude range of 1800–2400 m above sea level (asl). Nandi and Bomet covered LH1, which is moderate and humid, with an annual average rainfall of >80% of the potential evaporation, LH2, which is moderate cool and subhumid, with an annual average rainfall of 65–85% of the potential evaporation. Bomet covered LH3, which is moderate cool and semihumid and has an annual average rainfall of 50–65% of the potential evaporation.
Upper midlands (UM) has a mean temperature of 18–21°C and an altitude range of 1300–1900 m asl. Nandi and Bomet covered UM and UM1–4 respectively, while Nyando covered UM2 and UM5. UM1 is temperate and humid, with an annual average rainfall of >85% of the potential evaporation; UM2 is temperate and subhumid, with annual average rainfall of 65–68% of the potential evaporation; UM3 is temperate and semihumid and has an annual average rainfall of 50–65% of the potential evaporation; UM4 is temperate and transitional, with an annual average rainfall of 40–50% of the potential evaporation; and UM5 is temperate and semiarid, with annual average rainfall of 25–40% of the potential evaporation.
Lower midland (LM) has a mean temperature of 21–24°C and an altitude range of 800 to 1500 m asl. Nyando covered LM2, which is warm and subhumid with an annual average rainfall of 65–85% of the potential evaporation.
Goat and sheep feeding and management
Goats and sheep were generally tethered around the homestead during the day, without access to feed supplements, watered by hand and housed in structures made of locally available materials.
(IPCC) Tier II enteric CH4 estimation: general approach
Total metabolic energy requirements (MERTotal) of individual sheep and goats were calculated on a seasonal basis by summing the estimated MER for maintenance (MERMait), liveweight (LW) gain or loss (MERG/L), lactation (MERL) and locomotion (MERT). Dry-matter (DM) intake (DMI) was inferred as a function of MERTotal and the weighted mean DM digestibility (DMD) of the seasonal feed baskets in each AEZ. DMI was used as the basis for calculation of (DMP: CH4 g/day).
Animal performance and production data
Data collection closely followed the protocol described in Goopy et al. (2018) for cattle, with some modifications for SR. Briefly, animal performance and production data were obtained from measurements of 435, 100 and 199 sheep (734 in total) and 58, 202 and 351 goats (611 in total) in Nandi, Bomet and Nyando respectively. Measurements were undertaken five times (to correspond with the start and finish of each season), over 1 year in each county across all defined AEZ, and formed the dataset for the present study. All sheep and goats present in every household that was part of the study in each county were included. Animals were identified using ear tags (Allflex Europe SA, Vitre, France) with unique numbers, while age was determined by dentition (Cashburn 2016), or by farmer recall for young stock. A portable animal-weighing scale (Model EKW Endeavour Instruments Africa, Nairobi, Kenya) was used to determine LW. Parity and physiological status (pregnant or lactating) was obtained from farmer recall. Measurements were made every 3 months after the initial animal-tagging and data-collection visit, and dates were recorded. Each season was assumed to be of equal duration (i.e. 92 days).
Pasture and fodder yield estimation and analysis
Estimation of fodder and crop residues for Nyando and Nandi study sites have been reported in detail (Goopy et al. 2018; Ndung’u et al. 2019), and this protocol was repeated for the Bomet study. Briefly, pasture yields and crop residues were estimated using exclusion cages and harvest indexes respectively. Samples of forages and fodder were collected, fresh weights were recorded before samples were oven-dried (50°C, 3–5 days), ground with a hammer-mill, passed through a 1 mm sieve and stored at room temperature in sealed plastic containers until analyses. Nutrient analysis of feed was performed by wet chemistry for DM (AOAC International 2005 (Method 930.15), total N (AOAC Method 990.03), organic matter, neutral detergent fibre and acid detergent fibre (ADF; AOAC Method 973.18) and DMD was estimated from the equation of Oddy et al. (1983), as follows:

MER estimation
Energy expenditure was calculated using equations from Goopy et al. (2018), which were transformations of equations published in ‘Nutrient Requirements of Domestic Ruminants’ (Freer and Nolan 2007) for MER of ruminants. Animal data were analysed by group, based on age and sex; females (>1 year), males (>1 year), juveniles (6–12 months) and kids/lambs (<6 months). Individual MERM was estimated as follows:

where K = 1 (the constant given for sheep and goats), S = 1 for females and 1.15 for males, M = 1, MLW = mean LW for each season, calculated as follows:

where A = age in years and M/D = metabolisable energy content per unit DM (ME MJ/DM kg). M/D was calculated as follows:

where DMD = % DMD of feed.
Energy expended for weight gain/loss (MERG/L) was calculated as follows:


where ADWG or ADWL (kg/ day) = average daily weight gain or loss, being the difference between LW at initial season and LW at the end of the season, divided by the number of days in the period; EC (MJ/kg) = energy content of the tissue, taken as a mid-range value of 18 MJ/kg.
Milk production
Farmers typically do not milk their SR, but milk consumption by lambs/kids represents a significant energy impost on their dams. Daily milk consumption of pre-ruminant kids and lambs (DMC, L) was estimated using average LW plus their average daily LW gain (LWG) between 0 and 3.5 months, by extrapolation from Radostits and Bell (1970) as follows:

The MERL was calculated by estimating the daily milk yield (MY), as follows:

MERL was calculated as:

where ECM = energy content of milk for sheep and was estimated from the following equation of Brett et al. (1972):

where F = fat content and is assumed to be 80 g/kg, and D = day of lactation, which is assumed to be Day 45, giving a fixed value of 4.94 MJ/ L.
For goats, ECM estimates were based on the work of Morand-Fehr and Sauvant (1980), using the following equation:

with an assumed fat content of 35 g/kg, giving a value of 3.03 MJ/L.
Locomotion energy
In contrast to management of cattle, SR were generally maintained around the homestead, often tethered. As such, it was decided to adopt the IPCC default practice of increasing MERMait by 10% to account for the extra energy expenditure of locomotion.
The daily total energy expenditure (MERTotal) for each animal category in each county and season was then calculated as


Daily CH4 production (DMP) and EF calculation
Dry-matter intake was calculated as follows:

where GE = gross energy of the diet, assumed to be 18.1MJ/kg DM, and 0.81 is used as the factor to convert metabolisable energy to digestible energy. The estimated DMI was used to calculate DMP by using the equation developed by Charmley et al. (2016), as follows:

Mean DMP for each class of animal in each season was calculated. In the following, this was used to calculate an annual enteric CH4 EF (kg CH4/head.year). DMP for pre-ruminant animals (0–3 months) were excluded from EF calculations for lambs and kids on the assumption that animals at this age produce negligible emissions (Reed et al. 1990).

Statistical analyses
Descriptive statistics (mean, standard error of the mean (s.e.m.)) were calculated for LW, LW flux, total MER, DMI and DMP for each category, season and AEZ. ANOVA was used to evaluate differences between seasons and location for DMD. Finally, a partial sensitivity analysis was undertaken for some of the key inputs; LW, EC, Ym (CH4 produced (MJ)/DMI (MJ)) and DMD were increased by 10%, which was assumed as maximum error margin, and the effect on EF was assessed.
Results
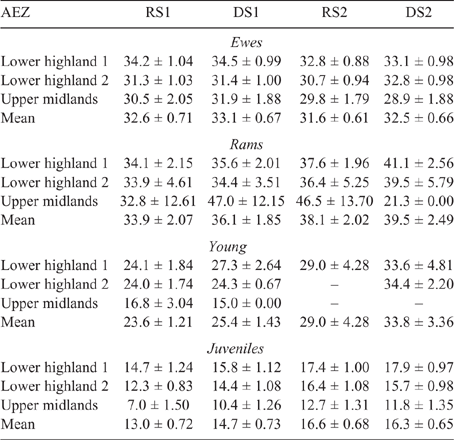
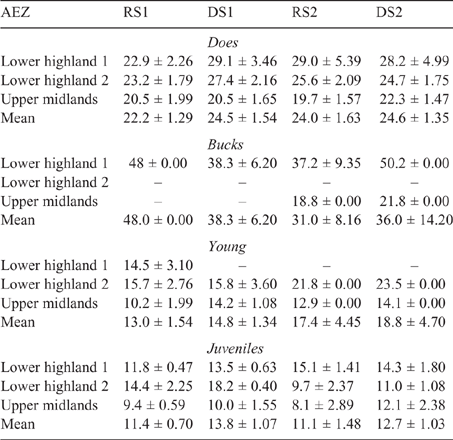
The SR in the study were grouped by species, age and sex as shown in Table 1 (sheep) and Table 2 (goats). Population demographics varied between and within counties with the largest number of sheep found in Nandi, while goats predominated in Nyando, with mature females always the most numerous class for both species in all areas. This pattern was independent of season, nonetheless numbers declined across seasons due to sales and domestic consumption. Over 50% of mature females gave birth throughout the year (with a low level of twinning – not reported), while reported mortality was low (<1%) for all classes of both sheep and goats.
The mean LW for each animal class fluctuated across AEZ, counties and seasons for both sheep and goats (refer Tables S1–S4, available as Supplementary Material to this paper) for data disaggregated by AEZ) and is shown for Nandi county in Table 3 (sheep) and Table 4 (goats).
|
|
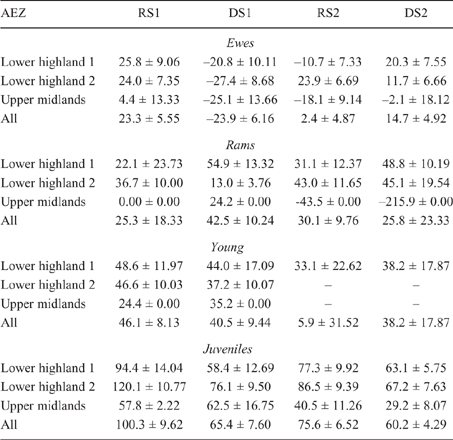
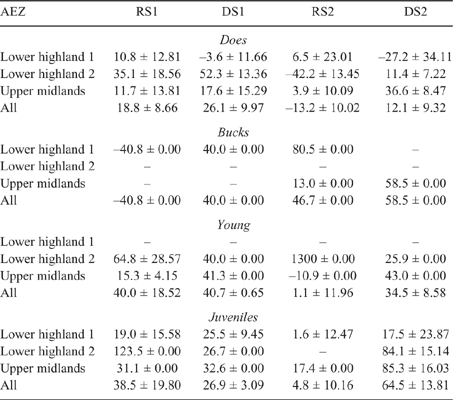
There was some seasonal fluctuation in the LW of mature stock of both species; however young stock and juveniles of both species showed strong LWG season on season, although trends varied between county and AEZ (as shown in Tables S5–S8). This is also reflected in LW change across seasons for the different classes of stock, with young stock and juveniles showing consistent LWGs (Tables 5, 6).
|
|
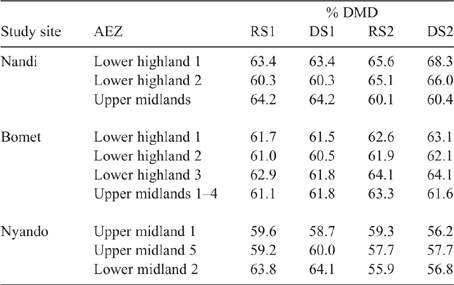
Detailed analysis of the weighted feed basket has been reported elsewhere for Nyando (Onyango et al. 2019), Nandi (Ndung’u et al. 2019) and Bomet (Table S9; Ndung’u, Goopy, Onyango, unpubl. data). Summary data for the weighted DMD of the seasonal feed basket is presented in Table 7. The DMD varied between seasons, AEZs and counties, but was in a fairly narrow range of 56–68%, with the Nyando sites tending to have lower DMD in feed across seasons than did either Nandi or Bomet.
|
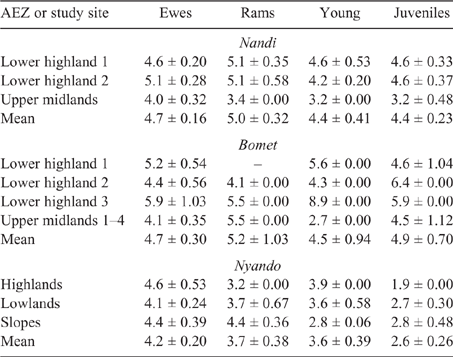
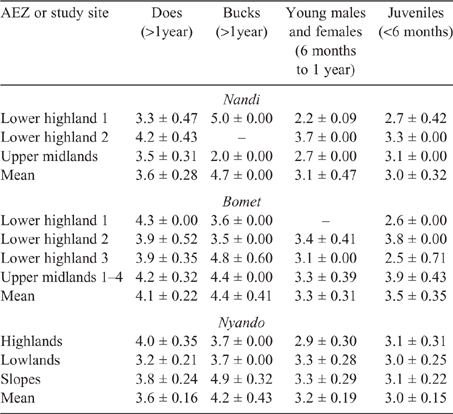
Young and juvenile sheep in both Bomet and Nandi had calculated EF approaching those of adult ewes and rams, this being underpinned by the high weight gains (70–135 g/day), driving MER, intake and, ultimately, DMP. While EF for goats of all classes were lower than those for sheep, they followed the same trend as the values for young, growing stock, namely, being similar to those of adults (Tables 8, 9).
|
|
Population-weighted mean LWs and EF for sheep and goats in the three counties (Table 10) showed that the influence of young stock dominating flock numbers tends to produce lower mean LWs across the regions. Additionally, the high growth rates observed in young stock, possibly the cumulative effect of management and nutrition, effectively lift EF of growing animals close to that of mature adults.
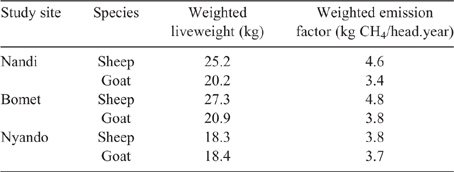
|
Increasing DMD (by 10%) reduced the mean EF by 12.9%, while the effect of increasing Ym was strictly proportional. In contrast, increasing LW increased EF by 5.7%, while increasing the EC of tissue for growth increased the EF by 0.11% on average.
Discussion
The EF developed for SR in the present study are similar for sheep (~4.4 kg vs 5.0 kg CH4/year), but substantially smaller for goats (3.7 vs 5 kg CH4/year) than those of the IPCC Tier I EF for SR in developing countries (Dong et al. 2006). This was unsurprising, given that MERMait tends to be the largest determinant of overall energy requirements in smallholder systems (Goopy et al. 2018), which, in turn, is proportional to LW, which strongly influences intake. This is also reflected in EF developed for SR in other studies, especially when compared with IPCC default values (Table 11). Generally, such studies have employed a combination of census or informal data collection with a (IPCC) Tier I or modified Tier II approaches (e.g. Defar et al. 2018; Svinurai et al. 2018). However, heterogeneity and seasonality of feed supply are hallmarks of livestock raising in the rain-fed smallholder farming of East Africa, which these approaches arguably fail to capture. The present study was designed to take account of this variability, but comes with its own potential limitations. Developing a framework to estimate intake from energy expenditure in SR (Freer and Nolan 2007) that is not based specifically on data from African livestock, has unknown implications, but represents the best and most relevant knowledge available at present. The validity of using an Ym derived from Australian cattle is open to disputation; however, there were good reasons for this decision. First, the constant (Ym = 6.3%) was derived from a large dataset of ruminant measurements (albeit cattle) consuming mainly C3 and C4 grasses (while, to our knowledge, no such study is available for SR), thus representing a fairly good match for ruminants in the present study, whose principal diet was C4 grasses. Second, the constant of Charmley et al. (2016) is in close agreement with the IPCC Ym for both cattle and sheep (6.5%; Dong et al. 2006) and is very similar to the value for sheep developed from a large literature (6.54%) by Patra et al. (2016). Finally, in their evaluation of the precision of numerous equations to predict enteric CH4 production from feed intake (and constituents), Benaouda et al. (2019) reported moderately large errors of prediction in all equations. Thus, it appears unlikely that any predictive equation will provide a high degree of accuracy in estimating DMP from feed. It is of concern that recently published work has determined that low levels of feeding in cattle substantially increase Ym over ad libitum levels of intake (Goopy et al. 2020). If demonstrated for SR, this would have important implications for inventory calculations, as well as presenting the challenge of applying an ‘inconstant constant’ to enteric CH4 calculations.

|
Sensitivity analysis showed the influence of feed digestibility on EF, but this is, in part, due to presumptive intake being driven by energy expenditure, with more digestible feeds providing greater digestible energy and, hence, lowering intake (and emissions). Physiologically, this appears to be incorrect, as, in practice, an animal would normally be expected to eat more, not less, of a more digestible food. However, these assumptions are needed to account for variations in intake in an environment where feeding is highly variable and even access to feed is frequently limited.
We compared the total enteric CH4 emissions of SR in these areas with the total emissions of cattle from previously published studies (Goopy et al. 2018; Ndung’u et al. 2019) to assess the relative importance of SR to overall livestock enteric emissions (Fig. 2). In contrast to published estimates, we found that SR contributed only ~5% of the estimated emissions Thus, it is clear, that at least in the areas studied, the contribution of SR to enteric CH4 emissions is much smaller than that of cattle (Fig. 2), both due to lower numbers and per capita biomass. In this respect, our findings were not dissimilar to those of recent studies in Ethiopia, which attributed 92% of total livestock GHG emissions to cattle (Defar et al. 2018). These results suggest that current modelling and estimates may overstate the importance of the contribution of SR to total livestock emissions in SSA (Herrero et al. 2008; Herrero et al. 2013), which suggest 15–25% of livestock-generated GHG across Africa are attributable to sheep and goats.

|
Conflict of interest
The authors declare no conflict of interest.
Acknowledgements
This research was conducted as part of the CGIAR Research Program on Livestock and is supported by contributors to the CGIAR Trust Fund. CGIAR (www.cgiar.org) is a global research partnership for a food-secure future. Its science is conducted by 15 Research Centers in close collaboration with hundreds of partners across the globe.
References
AOAC International (2005) Official methods of analysis of AOAC International. (AOAC International: Rockville, MD)Benaouda M, Martin C, Li X, Kebreab E, Hristov AN, Yu Z, Yáñez-Ruiz DR, Reynolds CK, Crompton LA, Dijkstra J, Bannink A, Schwarm A, Kreuzer M, McGee M, Lund P, Hellwing ALF, Weisbjerg MR, Moate PJ, Bayat AR, Shingfield KJ, Peiren N, Eugène M (2019) Evaluation of the performance of existing mathematical models predicting enteric methane emissions from ruminants: animal categories and dietary mitigation strategies. Animal Feed Science and Technology 255, 114207
| Evaluation of the performance of existing mathematical models predicting enteric methane emissions from ruminants: animal categories and dietary mitigation strategies.Crossref | GoogleScholarGoogle Scholar |
Brett D, Corbett J, Inskip M (1972) Estimation of the energy value of ewe milk. In ‘Proceedings of the Australian Society of Animal Production’. (Citeseer)
Cashburn G (2016) ‘How to tell the age of sheep.’ (Government of New South Wales Department of Primary Industries: Wagga Wagga, NSW, Australia)
Charmley E, Williams SRO, Moate PJ, Hegarty RS, Herd RM, Oddy VH, Reyenga P, Staunton KM, Anderson A, Hannah MC (2016) A universal equation to predict methane production of forage-fed cattle in Australia. Animal Production Science 56, 169–180.
| A universal equation to predict methane production of forage-fed cattle in Australia.Crossref | GoogleScholarGoogle Scholar |
Defar G, Mengistu A, Berhane G (2018) Estimation of livestock methane emissions in the extensive crop–livestock farming areas of Bale highland, Oromia, Ethiopia. Preprints 2018, 2018100104.
Dong H, Mangino J, McAllister T, Hatfield J, Johnson D, Lassey K, de Lima M, Romanovskaya A (2006) Chapter 10: emissions from livestock and manure management. In ‘IPCC guidelines for national greenhouse gas inventories. Vol. 4: agriculture, forestry, and other land use’. pp. 10.1–10.87. (IPCC: Paris, France) Available at http://www. ipcc-nggip. iges. or.jp/public/2006gl/pdf/4_Volume4/V4_10_Ch10_Livestock. pdf [Verified 13 May 2016]
Du Toit C, Van Niekerk WA, Meissner H (2013) Direct greenhouse gas emissions of the South African small stock sectors. South African Journal of Animal Science 43, 340–361.
| Direct greenhouse gas emissions of the South African small stock sectors.Crossref | GoogleScholarGoogle Scholar |
Freer HDM, Nolan JV (Eds) (2007) ‘Nutrient requirements of domesticated ruminants.’ (CSIRO Publishing: Melbourne, Vic., Australia)
Goopy JP, Onyango AA, Dickhoefer U, Butterbach-Bahl K (2018) A new approach for improving emission factors for enteric methane emissions of cattle in smallholder systems of East Africa: results for Nyando, western Kenya. Agricultural Systems 161, 72–80.
| A new approach for improving emission factors for enteric methane emissions of cattle in smallholder systems of East Africa: results for Nyando, western Kenya.Crossref | GoogleScholarGoogle Scholar |
Goopy JP, Korir D, Pelster D, Ali AIM, Wassie SE, Schlecht E, Dickhoefer U, Merbold L, Butterbach-Bahl K (2020) Severe below-maintenance feed intake increases methane yield from enteric fermentation in cattle. British Journal of Nutrition 123, 1239–1246.
| Severe below-maintenance feed intake increases methane yield from enteric fermentation in cattle.Crossref | GoogleScholarGoogle Scholar |
Herrero M, Thornton PK, Kruska R, Reid RS (2008) Systems dynamics and the spatial distribution of methane emissions from African domestic ruminants to 2030. Agriculture, Ecosystems & Environment 126, 122–137.
| Systems dynamics and the spatial distribution of methane emissions from African domestic ruminants to 2030.Crossref | GoogleScholarGoogle Scholar |
Herrero M, Thornton PK, Notenbaert AM, Wood S, Msangi S, Freeman HA, Bossio D, Dixon J, Peters M, van de Steeg J, Lynam J, Rao PP, Macmillan S, Gerard B, McDermott J, Seré C, Rosegrant M (2010) Smart investments in sustainable food production: revisiting mixed crop–livestock systems. Science 327, 822–825.
| Smart investments in sustainable food production: revisiting mixed crop–livestock systems.Crossref | GoogleScholarGoogle Scholar | 20150490PubMed |
Herrero M, Havlík P, Valin H, Notenbaert A, Rufino MC, Thornton PK, Blümmel M, Weiss F, Grace D, Obersteiner M (2013) Biomass use, production, feed efficiencies, and greenhouse gas emissions from global livestock systems. Proceedings of the National Academy of Sciences of the United States of America 110, 20888–20893.
| Biomass use, production, feed efficiencies, and greenhouse gas emissions from global livestock systems.Crossref | GoogleScholarGoogle Scholar | 24344273PubMed |
Jaetzold R, Schmidt H, Hornetz B, Shisanya C (1983) ‘Farm management handbook of Kenya. Vol. II: natural conditions and farm management information. Part A: west Kenya (Nyanza and Western provinces); and Part B: central Kenya (Rift Valley and Central provinces).’ (Ministry of Agriculture: Nairobi, Kenya)
Jahnke H, Tacher G, Kiel P, Rojat D (1988) Livestock production in tropical Africa, with special reference to the tsetse-affected zone. Livestock Production in Tsetse-affected Areas of Africa 3–21.
McPeak JG, Little PD (2006) ‘Pastoral livestock marketing in eastern Africa: research and policy challenges.’ (Intermediate Technology Publications: London, UK)
Morand-Fehr P, Sauvant D (1980) Composition and yield of goat milk as affected by nutritional manipulation 1. Journal of Dairy Science 63, 1671–1680.
| Composition and yield of goat milk as affected by nutritional manipulation 1.Crossref | GoogleScholarGoogle Scholar |
Ndao S, Moulin C-H, Traoré EH, Diop M, Bocquier F (2019) Contextualized re-calculation of enteric methane emission factors for small ruminants in subhumid western Africa is far lower than previous estimates. Tropical Animal Health and Production 51, 919–928.
| Contextualized re-calculation of enteric methane emission factors for small ruminants in subhumid western Africa is far lower than previous estimates.Crossref | GoogleScholarGoogle Scholar | 30565185PubMed |
Ndung’u PW, Bebe BO, Ondiek JO, Butterbach-Bahl K, Merbold L, Goopy JP (2019) Improved region-specific emission factors for enteric methane emissions from cattle in smallholder mixed crop: livestock systems of Nandi County, Kenya. Animal Production Science 59, 1136–1146.
| Improved region-specific emission factors for enteric methane emissions from cattle in smallholder mixed crop: livestock systems of Nandi County, Kenya.Crossref | GoogleScholarGoogle Scholar |
Oddy V, Robards G, Low S (1983) Prediction of in vivo dry matter digestibility from the fibre and nitrogen content of a feed, feed information and animal production. In ‘Proceedings of the second symposium of the International Network of Feed Information Centres’. (Eds GE Robards, RG Packham) (Commonwealth Agricultural Bureaux: Farnham Royal, Slough, UK).
Onyango AA, Dickhoefer U, Rufino MC, Butterbach-Bahl K, Goopy JP (2019) Temporal and spatial variability in the nutritive value of pasture vegetation and supplement feedstuffs for domestic ruminants in western Kenya. Asian-Australasian Journal of Animal Sciences 32, 637
| Temporal and spatial variability in the nutritive value of pasture vegetation and supplement feedstuffs for domestic ruminants in western Kenya.Crossref | GoogleScholarGoogle Scholar | 30056650PubMed |
Patra AK, Lalhriatpuii M, Debnath BC (2016) Predicting enteric methane emission in sheep using linear and non-linear statistical models from dietary variables. Animal Production Science 56, 574–584.
| Predicting enteric methane emission in sheep using linear and non-linear statistical models from dietary variables.Crossref | GoogleScholarGoogle Scholar |
Radostits O, Bell J (1970) Nutrition of the pre-ruminant dairy calf with special reference to the digestion and absorption of nutrients: a review. Canadian Journal of Animal Science 50, 405–452.
| Nutrition of the pre-ruminant dairy calf with special reference to the digestion and absorption of nutrients: a review.Crossref | GoogleScholarGoogle Scholar |
Reed JD, Soller H, Woodward A (1990) Fodder tree and straw diets for sheep: intake, growth, digestibility and the effects of phenolics on nitrogen utilisation. Animal Feed Science and Technology 30, 39–50.
| Fodder tree and straw diets for sheep: intake, growth, digestibility and the effects of phenolics on nitrogen utilisation.Crossref | GoogleScholarGoogle Scholar |
Svinurai W, Mapanda F, Sithole D, Moyo EN, Ndidzano K, Tsiga A, Zhakata W (2018) Enteric methane emissions and their response to agro-ecological and livestock production systems dynamics in Zimbabwe. The Science of the Total Environment 616–617, 710–719.
| Enteric methane emissions and their response to agro-ecological and livestock production systems dynamics in Zimbabwe.Crossref | GoogleScholarGoogle Scholar | 29122353PubMed |
Tubiello F, Salvatore M, Cóndor Golec R, Ferrara A, Rossi S, Biancalani R, Federici S, Jacobs H, Flammini A (2014) ‘Agriculture, forestry and other land use emissions by sources and removals by sinks.’ (Statistics Division, Food and Agriculture Organization: Rome, Italy)
Zhou G, Munga S, Minakawa N, Githeko AK, Yan G (2007) Spatial relationship between adult malaria vector abundance and environmental factors in western Kenya highlands. The American Journal of Tropical Medicine and Hygiene 77, 29–35.
| Spatial relationship between adult malaria vector abundance and environmental factors in western Kenya highlands.Crossref | GoogleScholarGoogle Scholar | 17620627PubMed |


