Statistical methodologies for drawing causal inference from an unreplicated farmlet experiment conducted by the Cicerone Project
R. Murison A and J. M. Scott B CA School of Science and Technology, University of New England, Armidale, NSW 2351, Australia.
B School of Environmental and Rural Science, University of New England, Armidale, NSW 2351, Australia.
C Corresponding author. Email: dr.jimscott@gmail.com
Animal Production Science 53(8) 643-648 https://doi.org/10.1071/AN11331
Submitted: 1 December 2011 Accepted: 17 June 2012 Published: 10 July 2013
Journal Compilation © CSIRO Publishing 2013 Open Access CC BY-NC-ND
Abstract
The present paper explains the statistical inference that can be drawn from an unreplicated field experiment that investigated three different pasture and grazing management strategies. The experiment was intended to assess these three strategies as whole farmlet systems where scale of the experiment precluded replication. The experiment was planned so that farmlets were allocated to matched paddocks on the basis of background variables that were measured across each paddock before the start of the experiment. These conditioning variables were used in the statistical model so that farmlet effects could be discerned from the longitudinal profiles of the responses. The purpose is to explain the principles by which longitudinal data collected from the experiment were interpreted. Two datasets, including (1) botanical composition and (2) hogget liveweights, are used in the present paper as examples. Inferences from the experiment are guarded because we acknowledge that the use of conditioning variables and matched paddocks does not provide the same power as replication. We, nevertheless, conclude that the differences observed are more likely to have been due to treatment effects than to random variation or bias.
Introduction
The Cicerone Project’s aim was to enhance the adoption of more profitable and sustainable farming enterprises by encouraging livestock producers to work closely with researchers and extension specialists to compare different livestock management systems selected following a thorough survey process (Kaine et al. 2013). The experiment is explained fully in Scott et al. (2013a) but, for the purposes of the present paper, it may be summarised as a grazing experiment to compare three farming systems (Table 1). A primary objective was that the farming systems should be applied to areas of sufficient size to resemble practical farming.

|
One farmlet (B) was chosen as a typical control with a moderate level of inputs, the second farmlet (A) focussed primarily on higher inputs in the form of pastures and fertiliser, and the third farmlet (C) employed intensive rotational grazing.
A fundamental tenet of experimental design adopted in most pasture and livestock field studies is that treatments need to be replicated to allow measurement of the experiment error; inference from the data is drawn by comparing the amount of information attributable to systematic treatment effects with the information that is attributable to the natural variation, which is estimated as an ‘experimental error’.
Acknowledging that a traditional form of statistical inference would not be possible, the experiment proceeded, nevertheless, to provide whole-farmlet data ranging from soil fertility, to botanical composition, pasture growth, herbage mass and quality, livestock production, as well as quantifying input costs and saleable livestock products. The decision to diverge from tradition for such experiments was recognised by Spedding and Brockington (1976) who acknowledged that when experimental scale is required for genuine relevance, then it is essential.
Tanaka et al. (2008) pointed out that large-scale, multidisciplinary field research that is relevant to farmers is extremely difficult to achieve because typically it can involve large areas, many animals and substantial financial support over extended periods. They noted also that such research can require novel statistical methods and compromises between researcher and farmer needs so as to create effective experiments.
The problem of lack of replication is encountered in a range of scientific disciplines, including, for example, observational studies, which are widely used in the social sciences (Holland 1986; Gelman and Hill 2007), and also in environmental-impact studies (Beyers 1998). In fact, as pointed out by Eberhardt and Thomas (1991), in field experiments in ecological research, issues of a small sample size and subsampling in replicated studies can result in inferior analyses compared with analytical sampling over entire populations.
Unreplicated treatments have been employed in a wide array of published studies, including experiments on fire behaviour (Owens et al. 2002) and agroforestry (Guevara-Escobar et al. 2002). A review of the literature relating to the analysis of unreplicated experiments (Machado and Petrie 2006) has pointed out that large, field-scale research is the most common type of research employing unreplicated treatments.
Published studies that have used unreplicated treatments relating to grazing livestock include a study of fertiliser and grazing management in New Zealand (Lambert et al. 1983), some treatments within the Sustainable Grazing Systems national experiment (Chapman et al. 2003), pasture leys (Grace et al. 1995), pasture legumes (Jones and Bunch 1995) and grazing studies (Hendricksen et al. 1994), including the study of nitrogen dynamics on dairy farmlets in New Zealand (Ledgard et al. 1996), environmental factors in grasslands (Pagnotta et al. 1997) and sheep and cattle studies over 6 years (Armstrong et al. 1997). It is noteworthy that Thomson et al. (1995) reported that an unreplicated model farm system generated particularly valuable whole-farm information about mixed-farming interactions in Syria.
The trade-off between replication and having appropriate scale for experiments with whole-farm systems was also recognised by Morley and Spedding (1968). They reported that, while the strict requirement for an experimental unit is a certain area of land or number of animals that receive the particular treatment under study, there are circumstances where the statistical analysis using animal (or paddock) as the experimental unit is acceptable. Those circumstances are that there are no interactions between treatment and group, and that the variance among animals within groups is not substantially greater or smaller than the variance among animals in the whole experiment. The Cicerone grazing experiment was set up to minimise the likelihood of an interaction between treatment (i.e. farming system) and paddocks by allocating land to farmlets so that, at the beginning of the experiment, the farmlets were balanced for any measured pre-existing conditions. Likewise, interactions between farmlets and animal groups were minimised by ensuring that, on purchase, any new livestock were allocated randomly to farmlets.
The inference from studies with unreplicated treatments is not as strong as that which can be made from replicated treatments. The observed differences among treatments may have arisen from ‘lurking’ variables that might influence the outcome. But if the observed differences are so large that it is more plausible that they be attributed to the different management systems rather than chance, it would be reasonable to infer that the farming systems caused the differences.
Oksanen (2001) categorised the different experimental approaches of ecologists as follows:
-
those that do not see any problems with sacrificing spatial and temporal scales to obtain replication, and
-
those that understand that appropriate scale must always have priority over replication.
The present paper concludes that random assignment of the treatments is normally sufficient for a deductive experiment, but the statistical model is not sufficient to make inference on what causes the observed effects. Recently, considerable attention has been given to developments in statistical methods that are suited to the analysis of data from ecological studies, which often are unsuited to traditional replicated studies (Zuur et al. 2007, 2009).
Materials and methods
Experiment design
Rubin and Waterman (2006) strongly advised that observational studies should be carefully designed to approximate randomised experiments. This requires that there is an overlap in the distributions of key covariates that assign treatments to units. Thus, the response of the key covariates from the unit (before treatments are applied) is regarded as a potential outcome and units are allocated so that distributions of potential outcomes are similar for the treatments.
There must be a model to allocate treatments to units to achieve balance and the model is based on covariates that are independent of those used to explain causal effects. Inference then relies on the strong assumption that, conditional on the allocation of covariates, the distribution of units across treatments is essentially random (Gelman and Hill 2007). In this observational study, it will be assumed that any of the farmlets at similar levels of the covariates would have the same probability of receiving a particular treatment. The above can be summarised as ‘control for pre-treatment variable’.
Another paper in this Special Issue (Scott et al. 2013b) has explained how the land was allocated to the farmlets (A, B and C) before treatments were applied so that the farmlets (or treatments) were matched in their pre-treatment status. The criteria for matching the land capability of each farmlet were based primarily on elevation, slope and soil type.
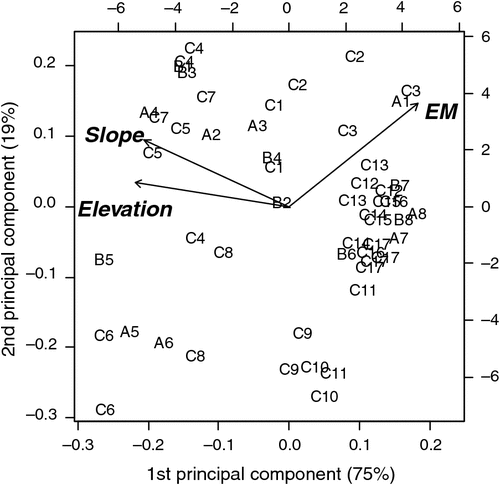
A comparison of the 53 paddocks in terms of the pre-treatment variables is shown in the biplot in Fig. 1. This reveals that the measurements of soil conductivity (measured as electromagnetic inductance, EM), slope and elevation explain most of the variation among the paddocks. Inspection of the distribution of paddock labels in this figure shows a high degree of overlap between the boundaries of each of the farmlet paddocks, indicating that the paddocks were evenly distributed among farmlets, with respect to these three measurement criteria.
|
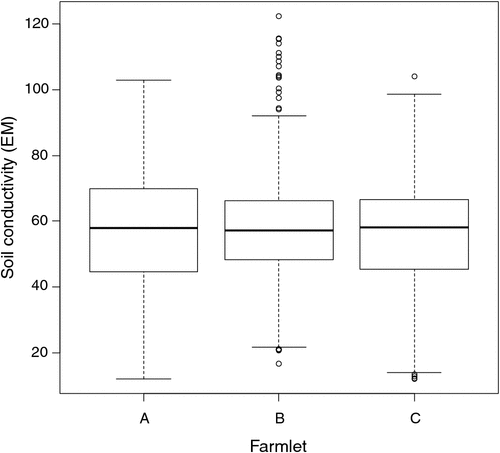
Much, but not all, of the variation among paddocks was related to the pre-treatment distribution of soil conductivity measured through EM. This variable was not the sole criterion for selecting which paddocks would be used in the different farming systems but suffices to show the intent of matching so that causal inference can be made from the experiment after the farming-system treatments had time to show effects. In Fig. 2, the distributions of the soil conductivity measurements (Scott et al. 2013b) are compared graphically to demonstrate the similarity of paddocks on each farmlet with respect to soil conductivity before the different management systems started. Figures 1 and 2 show that each farmlet was similar to the others, with respect to underlying conditions at the start of the experiment.
|
A strong assumption of the subsequent analyses of data from these paddocks is that the ‘lurking’ confounding variables are controlled by the pre-treatment variables through regression and that conditional on this, the distribution of units across treatments is essentially random (Gelman and Hill 2007). The pre-treatment variables are included in each model as covariates. The variables EM and Slope will be used as the pre-treatment variables to condition hidden confounding variables in the model of the regressions of botanical composition data. Elevation was not used due to its high correlation with Slope.
Botanical composition
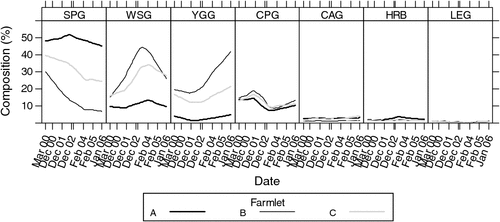
Botanical composition was measured within the paddocks of each of the three farming systems during late summer (March 2000) of the year before commencement of the farmlet treatments in July 2000. This was followed by sampling the botanical composition on seven other summer occasions during the trial (December 2000, December 2001, December 2002, February 2003, February 2004, February 2005 and January 2006). More details of the changes in botanical composition have been reported in a related paper by Shakhane et al. (2013). The data are frequencies (out of 100) along transects across each paddock determined by the BOTANAL estimation procedure (Tothill et al. 1978). Exploratory data plots of the profiles of the main botanical functional groups of plants are presented in Fig. 3. The plots indicate that the farming systems may not start with similar frequencies of the botanical functional groups and inference is restricted to whether the initial differences changed over time.
|
Statistical model
In these analyses, the BOTANAL data were considered as repeated measurements of botanical compositions that were represented as percentages of the total vegetation occupied by the different functional groups within each sampling unit (the paddock). The statistical model used had systematic components of farmlet, time and the interaction between farmlet and time. Two sources of correlation were included in the model, including that due to the multivariate response of seven functional groups and that due to repeated measures from the same plot.
The data were modelled using a generalised estimating equation (GEE) (Liang and Zeger 1986). The working correlation among residuals was estimated by a three-step process, as follows:
-
At each sampling and for each functional group, the frequencies were modelled as a simple binomial GLM taking out farmlet differences. The deviance residuals from each analysis were used to estimate the correlations among functional group frequencies at each sample time.
-
The frequency data from all functional groups were re-analysed at each time to get estimates of farmlet and functional group differences. This model was a GEE, with the working correlation among functional group frequencies having been determined in Step 1. The variogram of the deviance residuals from these analyses, and exploratory data plots, suggested that the repeated-measures correlations could be modelled by r(tj, tk) = exp {−α|tj−tk|} for sampling times (tj, tk), where the term α controls the rate at which the correlation decays as the time interval increases.
-
The two sets of correlations were combined to make the working correlation matrix by multiplying the two sets of correlations, treating the time effect and the functional group effect as separable.
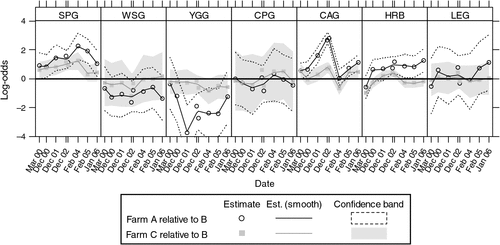
Statistical inferences among the treatments were based on log-odds ratios, with corresponding confidence intervals for either farmlet A or C compared with the control, farmlet B. These contrasts are plotted in Fig. 4.
|
The observed frequencies of Functional group j from Farmlet i and Paddock p at Time t (yijtp) are related to the treatments and time in days t by the following generalised estimating equation model with a binomial distribution and linear predictor:

where EM and Slope are the pre-treatment measurements of electromagnetic conductivity and the Slope, µ2 (intercept), is the mean (on the logit scale) for Treatment B (the control) botanical-composition Functional group 1, τA, τC are the contrasts between Treatments A or C and B for botanical-composition Functional group 1, βj is the effect of Functional group j, with β1 = 0, [τ : β]i,j are treatment by botanical-composition functional group interactions, and s(τ : β : t)i,j,t are spline terms to represent the trends over time for farmlet contrasts for Functional group j.
Hogget liveweights
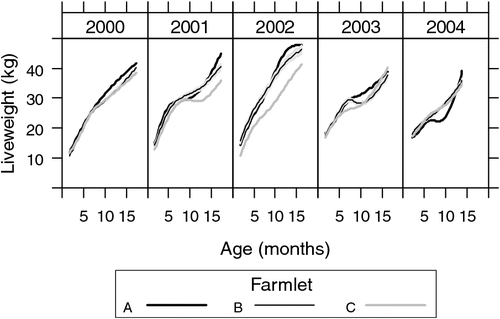
These data are liveweights measured at approximately monthly intervals of the entire population of hoggets born on the farmlets over the years 2000–2004, resulting in more than 19 000 records from a total of 1836 hoggets (735-A, 596-B, 505-C). Because the sheep were rotated around the paddocks within a farmlet, this analysis cannot use the pre-treatment variable as a conditional variable and inference relies wholly on the assumption that the farmlets were matched.
Exploratory data plots (not shown) suggested that the model for the mean of each group be represented as a spline. Individual traces diverged slightly over time and this suggested that animal : age random effects be included in the model to account for the changing variance over time and the correlations among the repeated measures from each hogget.
The initial statistical model for liveweights of each year cohort is


where farmlets are indexed by i, Age by j and sheep by k. The overall mean liveweight for farmlet B is µ2 and τi is the effect of Farmlet i (τi = 0), s(Age) is the spline effect of Age and µk is the random effect of Animal k.
Results
Botanical composition
Figure 4 plots the changes in the contrasts between farmlets A and C and farmlet B over time. The contrasts are on the logit scale (which is the scale for inference). A logit value of zero indicates that the proportions of a functional group are the same in farmlet A or C as in farmlet B.
Hogget liveweights
The fitted mean profiles of hogget liveweights are compared among farmlets within each cohort year in Fig. 5. The confidence region for farmlet B is denoted as the grey region, while confidence regions for farmlets A and C are not plotted to reduce clutter. They were similar to that for farmlet B and so the reader can discern by eye where the curves differ.
|
Discussion and conclusions
Although the lack of replication restricts the inference, a certain amount of information about the treatments can, nevertheless, be gained when the experimental units are matched and the analysis takes into account differences among the pre-treatment variables. While there is no test of model adequacy, theoretical considerations of the model and current best practices can guide the analyst to use a statistical model that is likely to have the appropriate attributes.
A further test of whether the inference about farmlet differences is tenable is obtained by a randomisation test. If the null hypothesis of no farmlet differences, in say botanical composition, were true, then similar distributions of responses would be observed if the treatment–paddock labels were randomly switched. This was done 99 times and the data were analysed as if it were responses from the permuted farm-paddock labels, using the same GEE model for botanical compositions. The summary statistic of log-likelihood was saved each time and compared with that statistic for the original analysis. The simulation study was repeated 10 times; every time, the maximum of the log-likelihoods from the 99 simulations (range from –36 741 to –36 434) was less than the log-likelihood from the model of the true data (–36 296).
This gives further evidence that the observed differences have arisen because the populations of botanical compositions on farmlets A and C differ from farmlet B. Once again, it is not possible to make the strong inference from the statistical model that the treatments caused these differences.
A logical argument that strengthens the inference is that any ‘lurking’ variables would have to be working synchronously across most paddocks within a treatment and be maintained during the experiment if they were to influence the treatment values. Because this does not seem plausible, it seems fair to deduce that the differences observed among treatments were more likely to have arisen because of the treatments. A related paper by Donald et al. (2013) provides support for this statement with independent data. These authors reported that greenness, as measured by remote sensing, was similar across farmlets just before the commencement of the trial and yet diverged over time as the treatments affected the pasture.
While this statistical model shows probable differences in the populations from the three farming systems, the inference does not extend to saying that the differences were caused by the treatments because there is no measure of ‘lurking’ variables.
The present approach has attempted to meet the request made by Murtagh (1975) for a ‘second generation’ of grazing experiments to go beyond classical, fixed stocking-rate experiments which have at times been conducted in spite of the stochastic nature of climatic conditions. Thus, the present experiment set out to assess the whole-farm effects of pasture and grazing management, not only with per head and per hectare assessments of livestock production, but also on emergent properties such as stocking rate over time on farmlets that were created without bias in the allocation of land.
In common with studies of the conservation value of habitat corridors (Beier and Noss 1998), the Cicerone farmlet experiment, as an agroecological experiment with its many paddocks and animals, all starting with the same estimated land capability and all subject to the same climate, seems to us to have provided the opportunity to convincingly demonstrate the differences between complex farm management systems.
References
Armstrong RH, Grant SA, Common TG, Beattie MM (1997) Controlled grazing studies on Nardus grassland: effects of between tussock sward height and species of grazer on diet selection and intake. Grass and Forage Science 52, 219–231.| Controlled grazing studies on Nardus grassland: effects of between tussock sward height and species of grazer on diet selection and intake.Crossref | GoogleScholarGoogle Scholar |
Beier P, Noss RF (1998) Do habitat corridors provide connectivity? Conservation Biology 12, 1241–1252.
| Do habitat corridors provide connectivity?Crossref | GoogleScholarGoogle Scholar |
Beyers DW (1998) Causal inference in environmental impact studies. Journal of the North American Benthological Society 17, 367–373.
| Causal inference in environmental impact studies.Crossref | GoogleScholarGoogle Scholar |
Chapman DF, McCaskill MR, Quigley PE, Thompson AN, Graham JF, Borg D, Lamb J, Kearney G, Saul GR, Clark SG (2003) Effects of grazing method and fertiliser inputs on the productivity and sustainability of phalaris-based pastures in western Victoria. Australian Journal of Experimental Agriculture 43, 785–798.
| Effects of grazing method and fertiliser inputs on the productivity and sustainability of phalaris-based pastures in western Victoria.Crossref | GoogleScholarGoogle Scholar |
Donald GE, Scott JM, Vickery PJ (2013) Satellite derived evidence of whole farmlet and paddock responses to management and climate. Animal Production Science 53, 699–710.
| Satellite derived evidence of whole farmlet and paddock responses to management and climate.Crossref | GoogleScholarGoogle Scholar |
Eberhardt LL, Thomas JM (1991) Designing environmental field studies. Ecological Monographs 61, 53–73.
| Designing environmental field studies.Crossref | GoogleScholarGoogle Scholar |
Gelman A, Hill J (2007) ‘Data analysis using regression and multilevel/hierarchical models.’ (Cambridge University Press: New York)
Grace PR, Oades JM, Keith H, Hancock TW (1995) Trends in wheat yields and soil organic carbon in the permanent rotation trial at the waite agricultural research institute, South Australia. Australian Journal of Experimental Agriculture 35, 857–864.
| Trends in wheat yields and soil organic carbon in the permanent rotation trial at the waite agricultural research institute, South Australia.Crossref | GoogleScholarGoogle Scholar | 1:CAS:528:DyaK28Xhs1yiu7k%3D&md5=b3f1749236691de1e8e023721c87bd1dCAS |
Guevara-Escobar A, Kemp PD, Mackay AD, Hodgson J (2002) Soil properties of a widely spaced, planted poplar (Populus deltoides)–pasture system in a hill environment. Australian Journal of Soil Research 40, 873–886.
| Soil properties of a widely spaced, planted poplar (Populus deltoides)–pasture system in a hill environment.Crossref | GoogleScholarGoogle Scholar |
Hendricksen RE, Ternouth JH, Punter LD (1994) Seasonal nutrient intake and phosphorus kinetics of grazing steers in northern Australia. Australian Journal of Agricultural Research 45, 1817–1829.
| Seasonal nutrient intake and phosphorus kinetics of grazing steers in northern Australia.Crossref | GoogleScholarGoogle Scholar |
Holland PW (1986) Statistics and causal inference. Journal of the American Statistical Association 81, 945–960.
Jones RM, Bunch GA (1995) Long-term records of legume persistence and animal production from pastures based on Safari Kenya clover and Leucaena in subtropical coastal Queensland. Tropical Grasslands 29, 74–80.
Kaine G, Doyle B, Sutherland H, Scott JM (2013) Surveying the management practices and research needs of graziers in the New England region of New South Wales. Animal Production Science 53, 602–609.
| Surveying the management practices and research needs of graziers in the New England region of New South Wales.Crossref | GoogleScholarGoogle Scholar |
Lambert MG, Clark DA, Grant DA, Costall DA, Fletcher RH (1983) Influence of fertiliser and grazing management on North Island moist hill country. 1. Herbage accumulation. New Zealand Journal of Agricultural Research 26, 95–108.
| Influence of fertiliser and grazing management on North Island moist hill country. 1. Herbage accumulation.Crossref | GoogleScholarGoogle Scholar |
Ledgard SF, Sprosen MS, Brier GJ, Nemaia EKK, Clark DA (1996) Nitrogen inputs and losses from New Zealand dairy farmlets, as affected by nitrogen fertilizer application: year one. Plant and Soil 181, 65–69.
| Nitrogen inputs and losses from New Zealand dairy farmlets, as affected by nitrogen fertilizer application: year one.Crossref | GoogleScholarGoogle Scholar | 1:CAS:528:DyaK28Xls12js7Y%3D&md5=ed1b208963cc292e8750aafc08d17b43CAS |
Liang KY, Zeger SL (1986) Longitudinal data analysis using generalized linear models. Biometrika 73, 13–22.
| Longitudinal data analysis using generalized linear models.Crossref | GoogleScholarGoogle Scholar |
Machado S, Petrie SE (2006) Symposium – Analysis of unreplicated experiments – Introduction. Crop Science 46, 2474–2475.
| Symposium – Analysis of unreplicated experiments – Introduction.Crossref | GoogleScholarGoogle Scholar |
Morley FHW, Spedding CRW (1968) Agricultural systems and grazing experiments. Herbage Abstracts 38, 279–287.
Murtagh G (1975) The need for alternative techniques of productivity assessment in grazing experiments. Tropical Grasslands 9, 151–158.
Oksanen L (2001) Logic of experiments in ecology: is pseudoreplication a pseudoissue? Oikos 94, 27–38.
| Logic of experiments in ecology: is pseudoreplication a pseudoissue?Crossref | GoogleScholarGoogle Scholar |
Owens MK, Mackley JW, Carroll CJ (2002) Vegetation dynamics following seasonal fires in mixed mesquite/acacia savannas. Journal of Range Management 55, 509–516.
| Vegetation dynamics following seasonal fires in mixed mesquite/acacia savannas.Crossref | GoogleScholarGoogle Scholar |
Pagnotta MA, Snaydon RW, Cocks PS (1997) The effects of environmental factors on components and attributes of a Mediterranean grassland. Journal of Applied Ecology 34, 29–42.
| The effects of environmental factors on components and attributes of a Mediterranean grassland.Crossref | GoogleScholarGoogle Scholar |
Rubin DB, Waterman RP (2006) Estimating the causal effects of marketing interventions using propensity score methodology. Statistical Science 21, 206–222.
| Estimating the causal effects of marketing interventions using propensity score methodology.Crossref | GoogleScholarGoogle Scholar |
Scott JM, Gaden CA, Edwards C, Paull DR, Marchant R, Hoad J, Sutherland H, Coventry T, Dutton P (2013a) Selection of experimental treatments, methods used and evolution of management guidelines for comparing and measuring three grazed farmlet systems. Animal Production Science 53, 628–642.
| Selection of experimental treatments, methods used and evolution of management guidelines for comparing and measuring three grazed farmlet systems.Crossref | GoogleScholarGoogle Scholar |
Scott JM, Munro M, Rollings N, Browne W, Vickery PJ, Macgregor C, Donald GE, Sutherland H (2013b) Planning for whole-farm systems research at a credible scale: subdividing land into farmlets with equivalent initial conditions. Animal Production Science 53, 618–627.
| Planning for whole-farm systems research at a credible scale: subdividing land into farmlets with equivalent initial conditions.Crossref | GoogleScholarGoogle Scholar |
Shakhane LM, Scott JM, Murison R, Mulcahy C, Hinch GN, Morrow A, Mackay DF (2013) Changes in botanical composition on three farmlets subjected to different pasture and grazing management strategies. Animal Production Science 53, 670–684.
| Changes in botanical composition on three farmlets subjected to different pasture and grazing management strategies.Crossref | GoogleScholarGoogle Scholar |
Spedding CRW, Brockington NR (1976) Guest editorial: the study of ecosystems. Agro-ecosystems 2, 165–172.
| Guest editorial: the study of ecosystems.Crossref | GoogleScholarGoogle Scholar |
Tanaka DL, Karn JF, Scholljegerdes EJ (2008) Integrated crop/livestock systems research: practical research considerations. Renewable Agriculture and Food Systems 23, 80–86.
| Integrated crop/livestock systems research: practical research considerations.Crossref | GoogleScholarGoogle Scholar |
Thomson EF, Bahhady FA, Nordblom TL, Harris HC (1995) A model-farm approach to research on crop livestock integration. 3. Benefits of crop livestock integration and a critique of the approach. Agricultural Systems 49, 31–44.
| A model-farm approach to research on crop livestock integration. 3. Benefits of crop livestock integration and a critique of the approach.Crossref | GoogleScholarGoogle Scholar |
Tothill JC, Hargreaves JNG, Jones RM (1978) BOTANAL: a comprehensive sampling and computing procedure for estimating pasture yield and composition. I. Field sampling. CSIRO Division of Tropical Crops and Pastures, Brisbane.
Zuur AF, Ieno EN, Smith GM (2007) ‘Analysing ecological data.’ (Springer: New York)
Zuur AF, Ieno EN, Walker N, Saveliev AA, Smith GM (2009) ‘Mixed effects models and extensions in ecology with R.’ (Springer-Verlag: New York)


