A genome-wide association study of tick burden and milk composition in cattle
Lex B. Turner A , Blair E. Harrison B , Rowan J. Bunch B , Laercio R. Porto Neto B , Yutao Li B and William Barendse B CA Queensland Department of Primary Industries and Fisheries, Mutdapilly Research Station, MS 825 Peak Crossing, Qld 4306, Australia.
B CSIRO Livestock Industries, 306 Carmody Road, St Lucia, Qld 4067, Australia.
C Corresponding author. Email: bill.barendse@csiro.au
Animal Production Science 50(4) 235-245 https://doi.org/10.1071/AN09135
Submitted: 8 October 2009 Accepted: 10 March 2010 Published: 12 May 2010
Abstract
To study the genetic basis of tick burden and milk production and their interrelationship, we collected a sample of 1961 cattle with multiple tick counts from northern Australia of which 973 had dairy production data in the Australian Dairy Herd Information Service database. We calculated heritabilities, genetic and phenotypic correlations for these traits and showed a negative relationship between tick counts and milk and milk component yield. Tests of polymorphisms of four genes associated with milk yield, ABCG2, DGAT1, GHR and PRLR, showed no statistically significant effect on tick burden but highly significant associations to milk component yield in these data and we confirmed separate effects for GHR and PRLR on bovine chromosome 20. To begin to identify some of the molecular genetic bases for these traits, we genotyped a sample of 189 of these cattle for 7397 single nucleotide polymorphisms in a genome-wide association study. Although the allele effects for adjusted milk fat and protein yield were highly correlated (r = 0.66), the correlations of allele effects of these milk component yields and tick burden were small (|r| ≤ 0.10). These results agree in general with the phenotypic correlations between tick counts and milk component yield and suggest that selection on markers for tick burden or milk component yield may have no undesirable effect on the other trait.
Introduction
There are many studies that show that there is a physiological trade-off between production and disease or parasite resistance and this has recently been reviewed (Morris 2007). In cattle, zebu have greater growth rates and performance in the presence of parasites, in hotter climates and fed lower quality feed than taurine animals, but poorer growth rates and performance in the absence of parasites, in cooler climates and fed better quality feed (Frisch and Vercoe 1977, 1984). However, these might represent breed genetic differences because genetic correlations for growth traits and parasite resistance traits are often close to zero when analysed within a breed (Prayaga and Henshall 2005; Prayaga et al. 2009).
The interrelationship between genes for parasite resistance and animal productivity is not well understood at the molecular level. So far, there are no systematic studies of the interrelationships between these traits at the molecular genetic level, to determine whether some of the genes that affect host resistance to a parasite also affect animal production. In such studies we are particularly interested in the effects due to genes of moderate to large effect, partly because they simplify selection decisions and partly because selection on all the polygenic variation will reconstruct the genetic correlations seen between the traits (Meuwissen et al. 2001). It is possible to identify some of the genetic effects on a trait using the genome-wide association study (GWAS) methodology (Risch and Merikangas 1996; Ozaki et al. 2002). GWAS of traits in humans have shown that most of the associations are to quantitative trait loci (QTL) or risk alleles for complex traits (RACT) that are small to very small in size (Burton et al. 2007; Weedon et al. 2008). However, GWAS have also identified Mendelian factors causing discrete phenotypes in several species (Klein et al. 2005; Karlsson et al. 2007; Charlier et al. 2008), as well as either discovering, or rediscovering, QTL or RACT of moderate to large effect in humans (Todd et al. 1987; Ellis et al. 2001; Burton et al. 2007; Gieger et al. 2008; Hillmer et al. 2008; Pollin et al. 2008; Benyamin et al. 2009; Daly et al. 2009). Some of these studies found genetic effects of moderate to large size even though the sample sizes used in those studies were quite small (i.e. 100 < n <300), because genes of large effect can be discovered in samples that have low intrinsic power. However, small sample sizes generate estimates with large standard errors, which will cause significant results to be overestimated in size.
In this study we examined the genetic relationship between tick burden and milk production traits of dairy cattle from the tick zone in northern Australia using a bivariate analysis and performed a GWAS to identify regions of the bovine genome that influenced milk composition or tick resistance. Given previous ideas of the relationship between parasite resistance and productivity we were interested in determining whether there were any strong phenotypic or genotypic relationships between genes of large effect for milk traits and host resistance to parasites. We included four putative functional nucleotide polymorphisms (FNP) for dairy traits, the diacylglycerol O-acyltransferase homologue 1 (DGAT1) gene, the growth hormone receptor (GHR), the prolactin receptor (PRLR) and the ATP-binding cassette subfamily G, member 2 (ABCG2) that affect milk yield and milk component yield (Fries and Winter 2002; Grisart et al. 2002; Blott et al. 2003; Cohen-Zinder et al. 2005; Viitala et al. 2006). The inclusion of these four QTL allowed us to test whether any of them had direct effects on tick counts, as well as providing a way of empirically assessing the power of the GWAS for both traits.
Materials and methods
Cattle samples
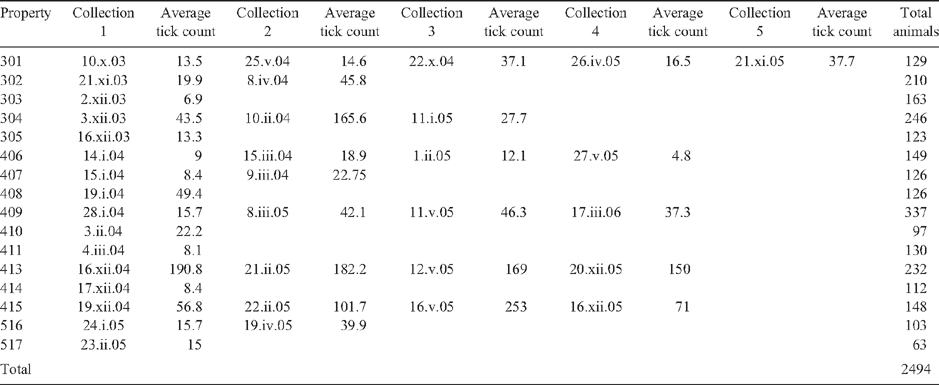
We collected blood samples from 2494 dairy cattle (Bos taurus L.) from 16 properties across the tick zone in tropical and subtropical north-eastern Australia (Table 1), of which 1961 had duplicate tick counts. Ethics approval for the use of these animals was obtained as noted previously (Barendse et al. 2009b). The animals were selected to represent the northern Australian dairy industry, which has a broad range of breeds and farmer initiated taurine composites to deal with the hot, dry, tick-infested conditions. This allowed us to take a broad sample of breeds, breed composites and sire lines to reduce linkage disequilibrium in the combined sample.
|
Previous research had shown that cattle of the Jersey and Illawarra Shorthorn breeds show lower tick burdens than other taurine cattle but not enough to be called tick resistant (Utech et al. 1978). In the Jersey, the mechanism appears to be a form of hypersensitivity. Partly to recognise this, and partly to ensure that allele frequencies between breeds did not act to confound the analysis, the animals were divided into six breed types based on ancestry: (1) the Australian Red breed (AUR), a modern composite that includes the Illawarra Shorthorn, Red Holstein, the Scandinavian Red and the Ayrshire. An animal had to have at least two purebred grandparents of these breeds to be included in this group; (2) the Brown Swiss and its crosses (BSWX), and the same level of stringency applied here as applied for the Australian Red; (3) the Channel Isle breeds of Jersey and Guernsey and their crosses (CHA) – here the animal had to have at least three purebred grandparents of these breeds to be considered in this group, except if it was a half Holstein × Jersey or Guernsey cross-bred or composite; (4) the Holstein–Friesian and its crosses (HOLX) – here the animal had to have at least three purebred grandparents of this breed to be considered in this group; (5) mixed taurine cattle (MIXT) with no more than one known grandparent of pure breed origin; and (6) cattle with at least one grandparent of known zebu ancestry (ZEBX), usually from the Sahiwal breed through the Australian Friesian Sahiwal. Pedigree information was obtained from the farmer and from the Australian Dairy Herd Improvement Scheme (ADHIS).
Tick counts
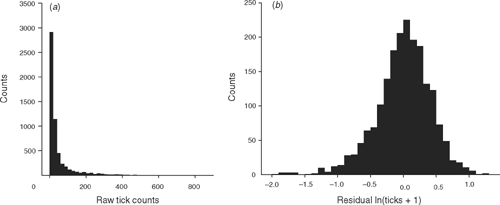
Tick counts of the one-host ixodid cattle tick (Boophilus microplus Canestrini) and DNA samples were obtained from each animal over 2–3 tick seasons. Tick numbers due to field infestations were counted in the size range 4.5–8.0 mm (Wharton et al. 1970) on one side of the animal by more than one counter over more than one season. A count was considered usable if the average number of counts for that day was 20 ticks per side (Table 1). Tick counts are usually log-transformed for parametric analyses (Fig. 1). The animals had to be treated for tick burden by dipping in acaricides, so tick counts were collected before dipping, at a point at which the farmer decided the cattle would be treated for the tick burden they carried.
|
Milk yield data
The dairy production trait values were obtained from the ADHIS database for animals in the study. We were able to obtain dairy production records for around half of the animals for which we had duplicate tick counts. Data included the national herd identifier, property number, ancestry, birth date, calving date, yields of total milk, total milk protein and total milk fat, number of parities and last herd recording. We excluded data records for incomplete lactations, but could only determine that a record was incomplete in those cases were duplicate records existed. After removing duplicate or incomplete data, there were 973 of the 1961 animals that had multiple tick counts that also had milk component yield data and a DNA sample suitable for genotyping.
Analysis of phenotypes
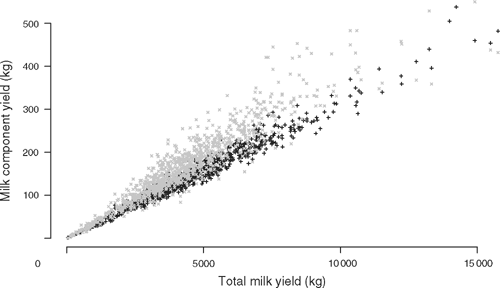
Initial fixed effect models were evaluated using the R software package (R Statistical Project http://cran.r-project.org/, verified 22 March 2010). Thereafter, trait values were fitted in a mixed model using the ASReml software (Gilmour et al. 2002) as follows: trait ~ mean + fixed effects + animal + error, with animal and error fitted as random effects. The proportion of the residual variance (R2) explained by a fixed effect in the model was calculated by comparing the residual sums of squares (RSS) of the model with the fixed effect (RSSf) to the RSS of the model without the fixed effect (RSSw), R2 = (RSSw – RSSf)/RSSf. Heritability estimates for the traits were obtained from the mixed model and genetic and phenotypic correlations were obtained from a bivariate analysis of these traits. In the bivariate analysis of tick counts and milk yield data, there are several tick counts per individual but only a single estimate of milk production so the mean of the ln-transformed tick counts was compared with milk production. This method of averaging tick counts was not used in the univariate analysis of tick counts due to the large variance in tick counts found between seasons, years and counters (cf. Results). In the univariate analysis, the tick counts were ln-transformed and modelled as ln(ticks + 1) ~ mean + property + season + breed type + animal + error, where the animal needed to have two tick counts out of the nine possible seasons to be included in the analysis. The model contained all available pedigree information of sire, dam and maternal grandsire identities, and season included the identity of tick counter. This model did not include effects of DNA polymorphisms. The residual tick count for each animal was extracted from the model and used as the phenotype in association analyses. The milk data were modelled as follows: milk fat or protein yield ~mean + total milk yield + birth year + property + breed type + animal + error. Total milk yield was used as a covariate for two reasons. First, as noted above, a low milk fat yield could be due purely to a low milk yield from an incomplete record. Second, we found a very strong relationship between milk yield and milk fat or protein yield (cf. Results, Fig. 2). Therefore, we fitted total milk yield to remove the possible effect of incomplete lactation records in the data and to emphasise the differences in protein or fat components, rather than analysing a proportional trait like milk fat or protein percentage. The residual protein and fat yields were extracted from the model and used as the phenotypes in association analyses. These protein and fat yields adjusted for total milk yield are called adjusted protein and fat yields below.
|
We evaluated associations between the trait and individual single nucleotide polymorphism (SNP) using regressions of residuals on number of copies of an allele rather than fit SNP as a covariate within the ASReml model. Both approaches have been used in the literature (Gieger et al. 2008; Weedon et al. 2008; Barendse et al. 2009a). We found that the regression of residuals on alleles gave slightly less significant results for milk trait associations than fitting the SNP as a covariate within the model (data not shown) and it is a speedier method of analysis of large datasets.
Genotyping
Animals selected for genotyping using the SNP chip were chosen in approximately equal numbers from five properties to a total of 189 plus three repeated animals, to generate two plates of 96 samples (Barendse et al. 2009b). The animals of this subset were chosen so that they were not closely related and were the offspring of 138 of the sires and 174 of the dams. They consisted of the breed types AUR (n = 61), BSWX (n = 35), CHA (n = 28), HOLX (n = 56), MIXT (n = 4), and ZEBX (n = 5). The aim was to reduce the linkage disequilibrium (LD) between SNP and to reduce any bias due to large differences in numbers of animals from different sires. The animals were selected without knowing their tick burdens or milk yield data. The genotyping of the sample of 189 cattle was performed using the MegAllele Genotyping Bovine 10 K SNP Panel (Hardenbol et al. 2005), a fully described set of SNP, by ParAllele Inc. on an Affymetrix GeneChip Scanner 3000, yielding an average spacing of 325 kb between SNP. Further details of the SNP can be found at the link ftp://ftp.hgsc.bcm.tmc.edu/pub/data/Btaurus/snp/Btau20050310/ (verified 22 March 2010). All samples with more than 10% missing data were excluded and then all loci with more than 10% of missing data were excluded, as previously described (Barendse et al. 2009b).
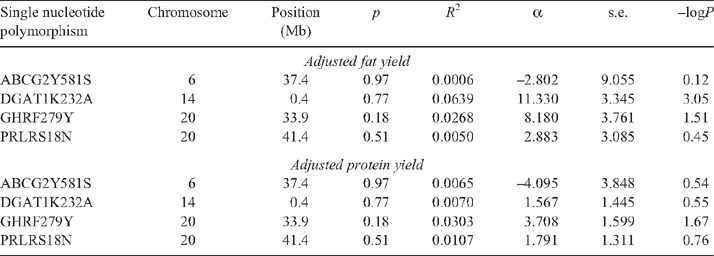
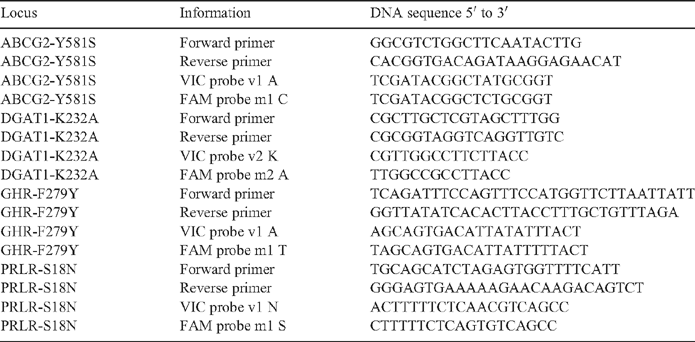
To provide positive controls for the GWAS and to examine the effects of important milk yield QTL on tick burdens, a set of FNP with moderate to large effects on milk traits were genotyped, first on the samples used for the GWAS and then on all animals with milk component yield data. Taqman assays were designed for the following DNA variants (Table 2). These were: (1) for the K232A MNP (multiple nucleotide polymorphism) in the DGAT1 gene on bovine chromosome 14 (BTA14) (Grisart et al. 2002; Winter et al. 2002); (2) for the F289Y SNP in the GHR (Blott et al. 2003) on BTA20; (3) for the S18N MNP in the PRLR (Viitala et al. 2006) on BTA20; and (4) for the Y581S SNP in the ABCG2 gene on BTA6 (Cohen-Zinder et al. 2005; Olsen et al. 2007). All of these genes affect milk yield and milk component yield, and the DGAT1 K232A MNP has an especially large effect on milk fat percentage.
|
Analyses of genotypes
Genotypes were tested for Hardy–Weinberg equilibrium within breeds and genotype frequencies were compared between breeds (Weir 1996). Allelic associations were evaluated by regression of the residual phenotype on the number of copies of an allele. For association tests, the P-values were reported as –logP values to allow for uniform and consistent reporting of very small P-values. The R2 was calculated from the correlation between residual phenotypes and numbers of copies of the reference allele. In the analysis of single-point associations in the GWAS, due to the small sample size, we set a threshold of a minor allele frequency (MAF) >0.05 for the analysis because a MAF <0.05 resulted in genotypic classes with one or two individuals of the rare homozygote.
The false positive rate FPR = Ep/Op where Ep is the expected number of SNP with P-values below a particular significance threshold, given the number of SNP in the panel and assuming that all tests are independent, and Op is the observed number of SNP with P-values below that same threshold. Standard sample size and power calculations using the critical points of the normal distribution were calculated as previously described (Snedecor and Cochran 1967).
Results
Phenotypic measures
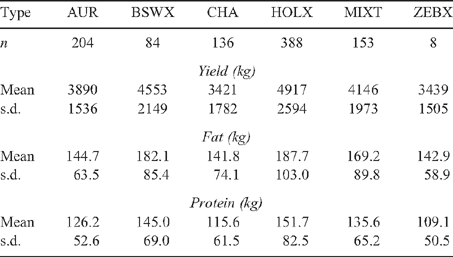
Tick counts in the sample of cattle (n = 1961) with duplicate counts ranged from 0 to 853 (Fig. 1). The tick counts for different breeds are shown in Table 3. The heritability and standard error of ln-transformed tick counts, when analysed as multiple counts of an animal, was h2 = 0.37 ± 0.02 in these taurine dairy cattle, larger than the h2 = 0.23 ± 0.15 obtained from analysing the mean ln-transformed tick counts. The most important factor affecting ln-transformed tick counts was the combined effect of season and counter, which was highly significant (P < 0.0001) and accounted for R2 = 35.7% of the residual variance in tick counts. Property, which includes the effect of management, although highly significant (P < 0.0001), explained a much smaller R2 = 2.4% of the variance. Breed type was highly significant (P < 0.001) in these taurine cattle but explained an inconsequential amount of the variance (R2 <0.1%) compared with the other two main effects. The amount of the variance explained by breed was consistent with the expectation that taurine dairy cattle breeds were in general similar to each other in tick burden. After accounting for property and season the MIXT, AUR and HOLX breed types all carried more ticks than the CHA breed, although the differences between these three breeds were not significant. The BSWX did not carry significantly more ticks than the CHA and the ZEBX did not carry significantly fewer ticks than the CHA.
The unadjusted milk protein, fat and total milk yields for cattle in the sample are shown in Table 4. The heritabilities for these traits are: for adjusted milk protein, h2 = 0.56 ± 0.19, for adjusted milk fat, h2 = 0.46 ± 0.19, and for total milk yield, h2 = 0.50 ± 0.19. Total milk yield was highly correlated with both milk fat yield and milk protein yield (Fig. 2), with correlations r = 0.94 and r = 0.98, n = 973, P < 0.0001. The correlation between total milk yield and milk fat yield showed visibly greater dispersion than the correlation between total milk yield and milk protein yield. Milk component yield was always adjusted for total milk yield, because nearly all of the variability in milk fat and protein yield was due to variation in total milk yield in these data. Property of origin explained R2 = 26 and 24% of the residual variance respectively for adjusted milk fat and protein yield (P < 0.0001). Breed type explained R2 = 4% and 5% of the residual variance respectively (P < 0.0001) for adjusted milk fat and protein yield. Cow birth year explained R2 = 3% of the residual variance (P < 0.05) for adjusted milk fat yield but did not have a significant effect on adjusted protein yield. To determine the effect of multiple breeds on a property compared with breeds occurring on several properties, we performed an analysis of breed nested within property and of property nested within breed for adjusted milk component yield. Breed type nested within property explained R2 = 9% and 8% of the residual variance respectively (P < 0.0001) for adjusted milk fat and protein yield. Property nested within breed type explained R2 = 32% and 27% of the residual variance respectively (P < 0.0001) for adjusted milk fat and protein yield. Due to the known differences in yield between breeds of cattle, and due to the same considerations of data stratification, breed type, property and birth year of the cow were fitted as effects in the association analyses.
|
The correlations between mean ln-transformed tick counts and milk and milk component yield varied substantially. The phenotypic correlation and standard error between adjusted milk fat and milk protein yields was rP = 0.53 ± 0.02 and the genetic correlation and standard error was rg = 0.73 ± 0.15. Correlations between adjusted milk component yield and mean ln-transformed tick counts could not be performed due to a lack of residual variance when total milk yield was fitted as a covariate. When total milk yield was removed from the model, the correlations between milk fat yield and mean ln-transformed tick counts were rP = –0.01 ± 0.03 and rg = –0.80 ± 0.40, and for milk protein yield and mean ln-transformed tick counts were rP = –0.01 ± 0.03 and rg = –0.73 ± 0.41. The correlations between total milk yield and ln-transformed tick counts were rP = –0.01 ± 0.03 and rg = –0.63 ± 0.44. These large negative genetic correlations between tick burden and milk production have large standard errors and so should not be over-interpreted, but they are in the direction of lower tick burdens with higher milk component yields.
Effect of the milk FNP on traits
The allele substitution effect of the DGAT1 K232A MNP was significantly (P = 0.0008, i.e. –logP = 3.05) associated with adjusted fat yield, it was one of the most significant associations for milk composition in the GWAS subsample and explained 6.4% of the residual variance in the GWAS sample (Table 5). The allele substitution effect of the GHR F289Y SNP was significantly (P < 0.05) associated with both adjusted fat and protein yield, explaining 2.7 and 3.0% of the R2, respectively, with the same favourable homozygote for both traits. The ABCG2 Y581S SNP and the PRLR S18N MNP were not significantly associated with either adjusted protein or fat yield. The sample of 189 animals had a power of detecting an effect of 6.9% of the variance at a 5% significance threshold with 90% power.
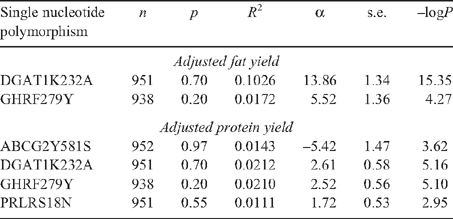
The genotyping of the four FNP on all available animals (n = 973) with adjusted fat and protein yields showed a significant effect of all these FNP (Table 6). The effect of the FNP at DGAT1 was very highly significant (–logP >15) and was five times larger than those of the other three FNP, having an effect of 10.3% of the R2 of adjusted fat yield. It had also a moderate effect on adjusted protein yield, with the same favourable homozygote for both traits. The other three FNP had effect sizes of between 1.1 and 2.1% of the R2 of adjusted milk protein yield. The GHR FNP had an effect on adjusted milk fat yield with the same favourable homozygote, but neither the ABCG2 nor the PRLR FNP had significant effects at the 5% threshold on adjusted fat yield in these data.
|
GHR and PRLR were on the same chromosome so the significant association of PRLR with adjusted protein yield may be due to LD between GHR and PRLR, although these genes are 7 Mb apart. We found that when GHR and PRLR were fitted as main effects in a mixed model, with PRLR fitted after GHR, the effect of PRLR on adjusted milk protein yield was still statistically significant (–logP = 2.4). Moreover, PRLR was also statistically significant (–logP = 1.63) when nested within GHR genotypes. There was no statistically significant interaction between GHR and PRLR, although such an analysis is not a formal test of epistasis.
None of these four FNP for milk fat and protein had significant associations to tick burden either when analysed on the GWAS sample or when tested on the full sample of animals with milk component yield data (data not tabulated). A sample of 973 animals should detect an effect of R2 = 1.1% with 90% power at the 5% significance threshold.
GWAS results for milk composition
Of the SNP in the 10 K Affymetrix panel, there were 7397 that passed quality control and were used for association mapping and of these, there were 6532 that had MAF >0.05 in the combined GWAS sample (n = 189). There are 6.5 SNP expected to be significant at the 0.1% threshold by chance if one assumed that the SNP tests were independent.
At the same threshold as that for DGAT1 in the GWAS sample (i.e. –logP = 3), there were six SNP with MAF >0.05 associated with adjusted milk fat yield (Table 7). The FPR was therefore 100% for milk component traits at the 0.1% significance threshold. Of these SNP, the one located immediately 3′ to the GPR126 gene on BTA9 was interesting because the same favourable homozygote had an effect on milk protein yield (–logP = 2.76, α = –4.158, s.e. = 1.307) on a chromosome with known QTL effects for milk fat and protein yield (Georges et al. 1995). A second SNP was in the NCOA2 gene, which is a co-activator of steroid hormone receptors including steroid, thyroid, retinoic acid and vitamin D receptors, including the oestrogen receptor (Hong et al. 1997). DGAT1 is some 30 Mb away from NCOA2 so this association is unlikely to be due to LD to DGAT1, and the variation in milk fat and protein yields on BTA14 was not fully explained by DGAT1 variation (Kaupe et al. 2007). At the same threshold there was one SNP with MAF >0.05 associated with adjusted protein yield (Table 6), which is much fewer than expected by chance. None of the other genes was a potential candidate gene.
GWAS results for tick burden
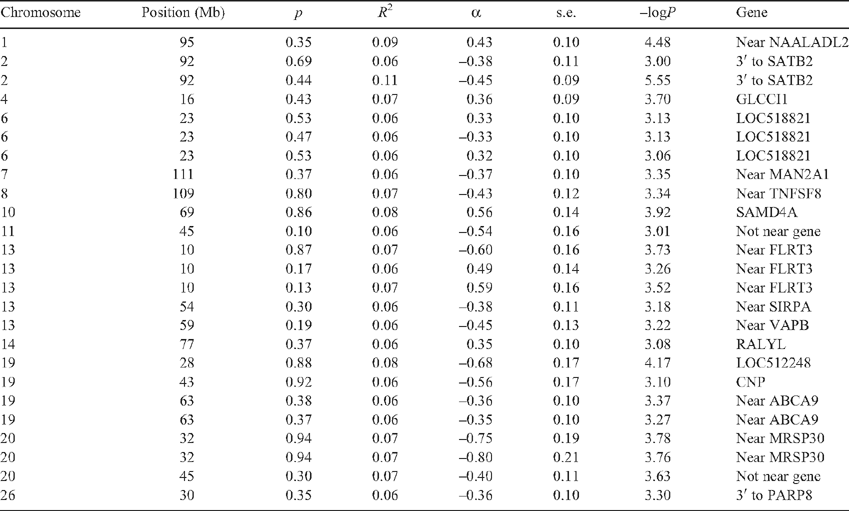
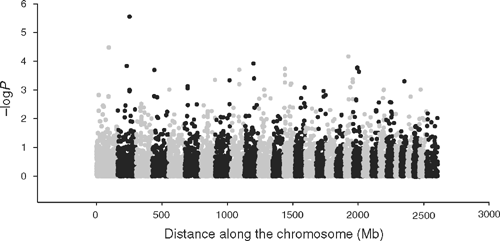
For tick burden, at a threshold of –logP = 3.0, there were 27 SNP with MAF >0.05 of which 25 could be located to the bovine genome (Table 8). The FPR = 24% for tick burden associations at the 0.1% significance threshold. The –logP values were plotted against genome location in Fig. 3. Several of these SNP were either in an exon or intron of a gene that had a known role in the adaptive immune system of mammals, or was within 50 kb of such a coding sequence. TNFSF8 (CD30) is a cytokine belonging to the tumour necrosis factor ligand family and has been shown to be upregulated in cutaneous inflammation and mediates degranulation-independent chemokine secretion (Fischer et al. 2006). SIRPA is a member of the immunoglobulin superfamily involved in the differentiation of monocytes to dendritic cells (Brooke et al. 1998), the most potent antigen presenting cell, and has a known role in binding to CD47 (Oldenborg et al. 2000). Of the others with a potential link to the immune system, SATB2 binds to the matrix attachment region of the immunoglobulin micro locus and enhances expression in pre-B-cells (Dobreva et al. 2003). MAN2A1 mutations are involved in systemic autoimmune disease (Chui et al. 2001), and the expression of ABCA9 was affected by cholesterol levels in blood and it belongs to a family of genes that are induced during monocyte differentiation into macrophages (Piehler et al. 2002). None of the genes listed in Table 8 was identified by gene expression profiling in cattle following artificial challenge using B. microplus larvae (Wang et al. 2007).
|
Global association between tick burden and milk composition
In a genomic selection framework, all of the SNP in the 10-K SNP panel may be used to predict the breeding values for a trait, so to estimate the relative effects of these SNP on several traits, correlations were calculated between the allele substitution effects of all three traits. The allele substitution effects for adjusted milk fat and adjusted milk protein yield were correlated with r = 0.66, those for adjusted milk fat yield and tick burden were slightly positively correlated with r = 0.10, and those for adjusted milk protein yield and tick burden were effectively uncorrelated with r = –0.03. These correlations are in general agreement with the phenotypic correlations for these traits (cf. above).
Discussion
In this study we calculated heritabilities and correlations between tick counts and milk production traits, examined the effects on parasite resistance of genes with known effects on milk yield and milk component yield, performed a low resolution GWAS to identify genomic regions associated with tick counts or milk component yield and compared the allele substitution effects of these traits across the genome to determine whether the effects for tick counts were correlated with those for milk component yield.
The genetic correlation between tick and milk traits was negative with large standard errors, while the heritabilities of these traits were similar to previous estimates. Compared with previous estimates the heritability for tick burden in this study was larger than the value of h2 = 0.15 found in zebu and zebu composite Brahman and Tropical Composite cattle for tick scores (Prayaga et al. 2009), but similar to the value of h2 = 0.41 ± 0.08 calculated for taurine cattle using multiple tick counts (Henshall 2004) and within the range of h2 = 0.34–0.49 previously calculated for cattle in Queensland (Wharton et al. 1970; Mackinnon et al. 1991). Heritabilities for the milk yields were similar to previously estimated values for these traits (Pander et al. 1992) but higher than previous estimates restricted to Australian Holstein and Jersey (Visscher and Goddard 1995). Phenotypic and genetic correlations for the milk traits are similar to values found in larger datasets (Visscher and Goddard 1995). We were not able to find estimates of tick burden and milk or milk component yield in the literature. The phenotypic correlations between milk and milk component yield and tick counts were close to zero but the genetic correlations were strongly negative. These latter estimates have large standard errors and so should not be over-interpreted, because the effects could be much weaker and are not >2 s.e. below zero, but they are in the direction of lower tick burdens correlated with higher milk and milk component yields. Selection for milk and milk component yield should therefore not increase tick burdens and may improve tick burdens if the genetic correlations are to be believed. The similarity of the correlations and heritabilities of other traits in this study with estimates from the literature suggests that the sample and analyses were not unusual, giving some credence to the correlations between tick counts and milk production traits.
The four previously identified FNP of moderate to large effect for milk and milk component yield, in the genes ABCG2, DGAT1, GHR and PRLR, all showed associations to milk compositional traits, including that the effect of DGAT1 on a phenotype was much greater than the effect of the other genes. Furthermore, we found that although GHR and PRLR were on the same chromosome, we were able to identify separate effects of these genes on milk component traits. This analysis agreed with Viitala et al. (2006) who had found separate effects for both GHR and PRLR with milk production traits in Finnish Ayrshire cattle whereas Blott et al. (2003) had not observed separate effects for PRLR in an earlier study primarily of Holstein cattle. These four FNP did not show a statistically significant association to tick counts in this sample – this sample cannot rule out very small effects, but if those small effects exist they are substantially smaller than the effects of these genes on milk traits. Their use to improve cattle production should have no negative effect on the host resistance of these cattle to ticks. Although the milk yield traits used in this study are for adjusted milk fat and protein yield, these four gene tests also have known direct effects on milk yield.
The results from the GWAS showed several promising results but these need to be kept in perspective. The sample of 189 animals had a power of detecting an effect of 6.9% of the variance at a 5% significance threshold with 90% power, which will result in many false negatives and false positives. False negatives would be examples of associations such as ABCG2 and PRLR to milk protein yield that are not significant at the 5% threshold in the GWAS sample – we know that they have an effect in these data because they showed statistically significant results in the full dataset. To identify false positives, additional research will be needed to confirm the associations of SNP to traits identified by the GWAS. Although many of these are highly significant (P < 0.001), they need to be confirmed in independent samples of cattle before they could be used for genetic testing. Many of these are likely to be false positives, and diagnostic tests need to be based on results from thousands of cattle (Barendse 2005). Nevertheless, we found little relationship between the allele effects for adjusted milk protein or fat yield and tick burden, consistent with the phenotypic correlations between these traits in this dataset. These results are in agreement that selection for milk component yield should have no or little effect on parasite loads in these cattle, whether this is based on phenotype or based on gene tests.
The FPR in the GWAS showed 100% for milk composition associations but only 24% for tick burden associations. There are at least three possible explanations for this difference. First, this could be a chance event, partly due to the small sample size used in the GWAS, although it is not clear how one would evaluate the likelihood of such a chance event – the sampling distribution of number of successful hits in a GWAS is not well understood when analysed over a range of traits in the same experiment. Second, the SNP in this panel are not uniformly distributed across the genome and show large gaps of more than 1 Mb between adjacent SNP in some areas (Barendse et al. 2009b). If the QTL for milk composition were located where SNP are less dense then fewer milk composition QTL would be found. There is some evidence to support this – there are no SNP within 3 Mb of DGAT1 and the other FNP were also flanked by a sparse number of SNP. Moreover, it is likely that other SNP near DGAT1 would also show LD to milk fat concentration, potentially increasing the number of SNP with very small P-values. However, arguing against this evidence, the P-value for DGAT1 was only slightly less than the 0.1% threshold in the GWAS sample, so it is not certain that other SNP in strong LD to DGAT1 would have been equally significant at that threshold. The third explanation is that there are more SNP of large effect associated with tick burden than for milk component yield segregating in the population. This would be consistent with strong selection for milk production traits and weak selection for host resistance to ticks, because persistent selection on a trait will cause genes of larger effect to become fixed sooner in a population (Kimura 1982). Selection for milk production is strong because it occurs on bulls in a national system of evaluation where many bulls are progeny tested, most outside the tick zone. Selection for host resistance to ticks is likely to be relatively weak because it occurs largely through culling of cows that carry extremely large tick burdens. Large numbers of ticks are not seen every year (Sutherst et al. 1979), and regular treatment with acaricides would also reduce the opportunity of seeing cows with large tick burdens, blunting opportunities for genetic selection.
To help identify genes that might have large effects on host resistance to parasites, we analysed the gene content near the most significant SNP and then determined whether the region had previously been identified to contain a signature of selection. It is unlikely that a QTL that makes a small contribution to the phenotypic variance will have a population genetic signature of selection (Kim and Stephan 2002). Locations on chromosome BTA2 showed an intersection of all three criteria: (1) significant allele effects associated with tick burden in a GWAS; (2) appropriate positional candidate genes; and (3) a signature of selection (Gibbs et al. 2009). Further research that may identify FNP for these QTL in the future will be able to determine whether the FNP were responsible for the selection signatures or whether some other trait, or combination of traits, is responsible for the selection signature.
Acknowledgements
This paper is dedicated to the memory of the late D. W. Kemp, with whom this work was planned. We thank G. Hetherington for help with the Australian Dairy Herd Improvement Scheme (ADHIS) database and M. B. Thomas for help with plating DNA samples. J. W. Kijas and M. Mariasegaram commented on the draft manuscript and two anonymous reviewers provided comments that improved the text and analysis. LRPN was supported in his doctoral work by an Endeavour International Postgraduate Research Scholarship, a University of Queensland International Student Living Allowance and a Beef CRC top-up scholarship. WB was partly supported by Dairy Australia under the grant CSLI10805.
Barendse W
(2005) The transition from quantitative trait loci to diagnostic test in cattle and other livestock. Australian Journal of Experimental Agriculture 45, 831–836.
| Crossref | GoogleScholarGoogle Scholar |

Barendse W,
Bunch RJ, Harrison BE
(2009a) Variation at CPE but not CEBPA appears to be associated with intramuscular fat deposition in the longissimus muscle of cattle. Animal Production Science 49, 558–562.
| Crossref | GoogleScholarGoogle Scholar |

Barendse W,
Harrison BE,
Bunch RJ,
Thomas MB, Turner LB
(2009b) Genome-wide signatures of positive selection: the comparison of independent samples and identification of regions associated to traits. BMC Genomics 10, 178.
| Crossref | GoogleScholarGoogle Scholar | PubMed |

Benyamin B,
McRae A,
Zhu G,
Gordon S, Henders A ,
et al
.
(2009) Variants in TF and HFE explain similar to 40% of genetic variation in serum-transferrin levels. American Journal of Human Genetics 84, 60–65.
| Crossref | GoogleScholarGoogle Scholar | PubMed |

Blott S,
Kim JJ,
Moisio S,
Schmidt-Küntzel A, Cornet A ,
et al
.
(2003) Molecular dissection of a quantitative trait locus: a phenylalanine-to-tyrosine substitution in the transmembrane domain of the bovine growth hormone receptor is associated with a major effect on milk yield and composition. Genetics 163, 253–266.
| PubMed |

Brooke GP,
Parsons KR, Howard CJ
(1998) Cloning of two members of the SIRP alpha family of protein tyrosine phosphatase binding proteins in cattle that are expressed on monocytes and a subpopulation of dendritic cells and which mediate binding to CD4 T cells. European Journal of Immunology 28, 1–11.
| Crossref | GoogleScholarGoogle Scholar | PubMed |

Burton PR,
Clayton DG,
Cardon LR,
Craddock N, Deloukas P ,
et al
.
(2007) Genome-wide association study of 14 000 cases of seven common diseases and 3000 shared controls. Nature 447, 661–678.
| Crossref | GoogleScholarGoogle Scholar | PubMed |

Charlier C,
Coppieters W,
Rollin F,
Desmecht D, Agerholm JS ,
et al
.
(2008) Highly effective SNP-based association mapping and management of recessive defects in livestock. Nature Genetics 40, 449–454.
| Crossref | GoogleScholarGoogle Scholar | PubMed |

Chui D,
Sellakumar G,
Green RS,
Sutton-Smith M,
McQuistan T,
Marek KW,
Morris HR,
Dell A, Marth JD
(2001) Genetic remodeling of protein glycosylation in vivo induces autoimmune disease. Proceedings of the National Academy of Sciences of the United States of America 98, 1142–1147.
| Crossref | GoogleScholarGoogle Scholar | PubMed |

Cohen-Zinder M,
Seroussi E,
Larkin DM,
Loor JJ, Everts-van der Wind A ,
et al
.
(2005) Identification of a missense mutation in the bovine ABCG2 gene with a major effect on the QTL on chromosome 6 affecting milk yield and composition in Holstein cattle. Genome Research 15, 936–944.
| Crossref | GoogleScholarGoogle Scholar | PubMed |

Daly AK,
Donaldson PT,
Bhatnagar P,
Shen Y, Pe’er I ,
et al
.
(2009) HLA-B*5701 genotype is a major determinant of drug-induced liver injury due to flucloxacillin. Nature Genetics 41, 816–819.
| Crossref | GoogleScholarGoogle Scholar | PubMed |

Dobreva G,
Dambacher J, Grosschedl R
(2003) SUMO modification of a novel MAR-binding protein, SATB2, modulates immunoglobulin μ gene expression. Genes & Development 17, 3048–3061.
| Crossref | GoogleScholarGoogle Scholar | PubMed |

Ellis JA,
Stebbing M, Harrap SB
(2001) Polymorphism of the androgen receptor gene is associated with male pattern baldness. The Journal of Investigative Dermatology 116, 452–455.
| Crossref | GoogleScholarGoogle Scholar | PubMed |

Fischer M,
Harvima IT,
Carvalho RFS,
Moller C,
Naukkarinen A,
Enblad G, Nilsson G
(2006) Mast cell CD30 ligand is upregulated in cutaneous inflammation and mediates degranulation-independent chemokine secretion. The Journal of Clinical Investigation 116, 2748–2756.
| Crossref | GoogleScholarGoogle Scholar | PubMed |

Frisch JE, Vercoe JE
(1977) Food intake, eating rate, weight gains, metabolic-rate and efficiency of feed utilization in Bos taurus and Bos indicus crossbred cattle. Animal Production 25, 343–358.

Frisch JE, Vercoe JE
(1984) An analysis of growth of different cattle genotypes reared in different environments. The Journal of Agricultural Science 103, 137–153.
| Crossref | GoogleScholarGoogle Scholar |

Georges M,
Nielsen D,
Mackinnon M,
Mishra A, Okimoto R ,
et al
.
(1995) Mapping quantitative trait loci controlling milk production in dairy cattle by exploiting progeny testing. Genetics 139, 907–920.
| PubMed |

Gibbs RA,
Taylor JF,
Van Tassell CP,
Barendse W, Eversole KA ,
et al
.
(2009) Genome-wide survey of SNP variation uncovers the genetic structure of cattle breeds. Science 324, 528–532.
| Crossref | GoogleScholarGoogle Scholar | PubMed |

Gieger C,
Geistlinger L,
Altmaier E,
de Angelis MH, Kronenberg F ,
et al
.
(2008) Genetics meets metabolomics: a genome-wide association study of metabolite profiles in human serum. PLOS Genetics 4, e1000282.
| Crossref | GoogleScholarGoogle Scholar | PubMed |

Grisart B,
Coppieters W,
Farnir F,
Karim L, Ford C ,
et al
.
(2002) Positional candidate cloning of a QTL in dairy cattle: identification of a missense mutation in the bovine DGAT1 gene with major effect on milk yield and composition. Genome Research 12, 222–231.
| Crossref | GoogleScholarGoogle Scholar | PubMed |

Hardenbol P,
Yu FL,
Belmont J,
MacKenzie J, Bruckner C ,
et al
.
(2005) Highly multiplexed molecular inversion probe genotyping: over 10 000 targeted SNPs genotyped in a single tube assay. Genome Research 15, 269–275.
| Crossref | GoogleScholarGoogle Scholar | PubMed |

Henshall JM
(2004) A genetic analysis of parasite resistance traits in a tropically adapted line of Bos taurus. Australian Journal of Agricultural Research 55, 1109–1116.
| Crossref | GoogleScholarGoogle Scholar |

Hillmer AM,
Brockschmidt FF,
Hanneken S,
Eigelshoven S, Steffens A ,
et al
.
(2008) Susceptibility variants for male-pattern baldness on chromosome 20p11. Nature Genetics 40, 1279–1281.
| Crossref | GoogleScholarGoogle Scholar | PubMed |

Hong H,
Kohli K,
Garabedian M, Stallcup M
(1997) GRIP1, a transcriptional coactivator for the AF-2 transactivation domain of steroid, thyroid, retinoid, and vitamin D receptors. Molecular and Cellular Biology 17, 2735–2744.
| PubMed |

Karlsson EK,
Baranowska I,
Wade CM,
Salmon Hillbertz NHC, Zody MC ,
et al
.
(2007) Efficient mapping of Mendelian traits in dogs through genome-wide association. Nature Genetics 39, 1321–1328.
| Crossref | GoogleScholarGoogle Scholar | PubMed |

Kaupe B,
Brandt H,
Prinzenberg EM, Erhardt G
(2007) Joint analysis of the influence of CYP11B1 and DGAT1 genetic variation on milk production, somatic cell score, conformation, reproduction, and productive lifespan in German Holstein cattle. Journal of Animal Science 85, 11–21.
| Crossref | GoogleScholarGoogle Scholar | PubMed |

Kim Y, Stephan W
(2002) Detecting a local signature of genetic hitchhiking along a recombining chromosome. Genetics 160, 765–777.
| PubMed |

Klein RJ,
Zeiss C,
Chew EY,
Tsai J-Y, Sackler RS ,
et al
.
(2005) Complement factor H polymorphism in age-related macular degeneration. Science 308, 385–389.
| Crossref | GoogleScholarGoogle Scholar | PubMed |

Mackinnon MJ,
Meyer K, Hetzel DJS
(1991) Genetic variation and covariation for growth, parasite resistance and heat tolerance in tropical cattle. Livestock Production Science 27, 105–122.
| Crossref | GoogleScholarGoogle Scholar |

Meuwissen THE,
Hayes BJ, Goddard ME
(2001) Prediction of total genetic value using genome-wide dense marker maps. Genetics 157, 1819–1829.
| PubMed |

Morris CA
(2007) A review of genetic resistance to disease in Bos taurus cattle. Veterinary Journal 174, 481–491.
| Crossref | GoogleScholarGoogle Scholar |

Oldenborg P-A,
Zheleznyak A,
Fang Y-F,
Lagenaur CF,
Gresham HD, Lindberg FP
(2000) Role of CD47 as a marker of self on red blood cells. Science 288, 2051–2054.
| Crossref | GoogleScholarGoogle Scholar | PubMed |

Olsen HG,
Nilsen H,
Hayes B,
Berg PR,
Svendsen M,
Lien S, Meuwissen T
(2007) Genetic support for a quantitative trait nucleotide in the ABCG2 gene affecting milk composition of dairy cattle. BMC Genetics 8, 32.
| Crossref | GoogleScholarGoogle Scholar | PubMed |

Ozaki K,
Ohnishi Y,
Iida A,
Sekine A, Yamada R ,
et al
.
(2002) Functional SNPs in the lymphotoxin-α gene that are associated with susceptibility to myocardial infarction. Nature Genetics 32, 650–654.
| Crossref | GoogleScholarGoogle Scholar | PubMed |

Pander BL,
Hill WG, Thompson R
(1992) Genetic parameters of test day records of British Holstein-Fresian heifers. Animal Production 55, 11–21.

Piehler A,
Kaminski WE,
Wenzel J,
Langmann T, Schmitz G
(2002) Molecular structure of a novel cholesterol-responsive A subclass ABC transporter, ABCA9. Biochemical and Biophysical Research Communications 295, 408–416.
| Crossref | GoogleScholarGoogle Scholar | PubMed |

Pollin TI,
Damcott CM,
Shen H,
Ott SH, Shelton J ,
et al
.
(2008) A null mutation in human APOC3 confers a favorable plasma lipid profile and apparent cardioprotection. Science 322, 1702–1705.
| Crossref | GoogleScholarGoogle Scholar | PubMed |

Prayaga KC, Henshall JM
(2005) Adaptability in tropical beef cattle: genetic parameters of growth, adaptive and temperament traits in a crossbred population. Australian Journal of Experimental Agriculture 45, 971–983.
| Crossref | GoogleScholarGoogle Scholar |

Prayaga KC,
Corbet NJ,
Johnston DJ,
Wolcott ML,
Fordyce G, Burrow HM
(2009) Genetics of adaptive traits in heifers and their relationship to growth, pubertal and carcass traits in two tropical beef cattle genotypes. Animal Production Science 49, 413–425.
| Crossref | GoogleScholarGoogle Scholar |

Risch N, Merikangas K
(1996) The future of genetic studies of complex human diseases. Science 273, 1516–1517.
| Crossref | GoogleScholarGoogle Scholar | PubMed |

Sutherst RW,
Wharton RH,
Cook IM,
Sutherland ID, Bourne AS
(1979) Long-term population studies of the cattle tick (Boophilus microplus) on untreated cattle selected for different levels of tick resistance. Australian Journal of Agricultural Research 30, 353–368.
| Crossref | GoogleScholarGoogle Scholar |

Todd JA,
Bell JI, McDevitt HO
(1987) HLA-DQβ gene contributes to susceptibility and resistance to insulin-dependent diabetes mellitus. Nature 329, 599–604.
| Crossref | GoogleScholarGoogle Scholar | PubMed |

Utech KBW,
Wharton RH, Kerr JD
(1978) Resistance to Boophilus microplus (Canestrini) in different breeds of cattle. Australian Journal of Agricultural Research 29, 885–895.
| Crossref | GoogleScholarGoogle Scholar |

Viitala S,
Szyda J,
Blott S,
Schulman N,
Lidauer M,
Maki-Tanila A,
Georges M, Vilkki J
(2006) The role of the bovine growth hormone receptor and prolactin receptor genes in milk, fat and protein production in Finnish Ayrshire dairy cattle. Genetics 173, 2151–2164.
| Crossref | GoogleScholarGoogle Scholar | PubMed |

Visscher PM, Goddard ME
(1995) Genetic parameters for milk yield, survival, workability, and type traits for Australian dairy cattle. Journal of Dairy Science 78, 205–220.
| Crossref |
PubMed |

Wang YH,
Reverter A,
Kemp D,
McWilliam SM,
Ingham A,
Davis CK,
Moore RJ, Lehnert SA
(2007) Gene expression profiling of Hereford Shorthorn cattle following challenge with Boophilus microplus tick larvae. Australian Journal of Experimental Agriculture 47, 1397–1407.
| Crossref | GoogleScholarGoogle Scholar |

Weedon MN,
Lango H,
Lindgren CM,
Wallace C, Evans DM ,
et al
.
(2008) Genome-wide association analysis identifies 20 loci that influence adult height. Nature Genetics 40, 575–583.
| Crossref | GoogleScholarGoogle Scholar | PubMed |

Wharton RH,
Utech KBW, Turner HG
(1970) Resistance to the cattle tick, Boophilus microplus in a herd of Australian Illawarra Shorthorn cattle: its assessment and heritability. Australian Journal of Agricultural Research 21, 163–181.
| Crossref | GoogleScholarGoogle Scholar |

Winter A,
Kramer W,
Werner FAO,
Kollers S, Kata S ,
et al
.
(2002) Association of a lysine-232/alanine polymorphism in a bovine gene encoding acyl-CoA: diacylglycerol acyltransferase (DGAT1) with variation at a quantitative trait locus for milk fat content. Proceedings of the National Academy of Sciences of the United States of America 99, 9300–9305.
| Crossref | GoogleScholarGoogle Scholar | PubMed |


