

Evaluation of genetic markers for the metabarcoding of Australian marsupials from predator scats
Catriona D. Campbell A , Anna J. MacDonald A B and Stephen D. Sarre A *
A
B
Abstract
DNA recovered from predator faeces (scats) can be used to determine the presence of fauna and shed light on their life histories and inter-species interactions. DNA metabarcoding, which involves concurrent amplification and sequencing of DNA from multiple taxa, represents an important advance by enabling the simultaneous detection of multiple species from such samples. Although an attractive proposition, metabarcoding requires ‘universally’ applicable genetic markers that can discriminate among a broad range of taxa, while also targeting sequences that are sufficiently short to be amplified from degraded DNA.
To identify, evaluate, and test metabarcoding DNA markers suitable for the detection of marsupials and other Australian fauna from terrestrial predator scats found in nature.
We apply a bioinformatic approach using publicly available DNA databases and a locally derived and marker-specific reference-DNA database to evaluate the diagnostic ability and likelihood of amplification of candidate metabarcoding markers for marsupials and other taxa that may be consumed by predators.
We identify two markers (12SV5 and 16SMam) that are suitable for use and successfully identify marsupial sequences at a high level of resolution. These markers work best in combination because they bring complementary levels of primer specificity and diagnostic ability in detecting multiple prey species as well as the predator. We also show that these samples work well in predator scats sampled from the wild in Tasmania.
These markers provide a useful tool for surveying mammalian predators and their prey and could also be applied to eDNA analyses from other sample types. Improvements to the reference database and further development of markers targeting different taxonomic groups will improve the resolution and usefulness of this approach.
Metabarcoding of predator scats provides a potent approach to non-invasive wildlife survey that offers the opportunity for the detection of multiple species across all vertebrates.
Keywords: applied ecology, conservation biology, endangered species, faeces, invasive species, molecular ecology, predator–prey interactions, threatened species, vertebrates.
Introduction
The detection of fauna from environmental samples obtained from water, soil, air, animal scats, carcasses, hair traps, or bite marks, presents challenges for DNA-based approaches. One of those challenges is the selection of genetic markers suitable for environmental DNA (eDNA) analyses. Markers need to be appropriate to the taxa being studied, the questions to be addressed, and the nature of the samples available. Environmental samples often comprise a mixture of DNA sequences derived from multiple species and can vary in terms of DNA quality and quantity. A traditional approach to species detection from such samples has been to develop highly targeted polymerase chain reaction (PCR)-based markers capable of amplifying diagnostic sequences from a single target species, or small numbers of target taxa, with a high level of confidence (Berry and Sarre 2007; Zeale et al. 2011; MacDonald and Sarre 2015; Ramsey et al. 2015; Berry et al. 2017; Modave et al. 2017; Wilkes Walburn et al. 2022). Such markers enable research at the level of species or genus, by detecting DNA from the target taxon but do not take advantage of other DNA sequences present in the sample and, as a result, cannot be used to address questions at broader taxonomic scales (Keck et al. 2022). DNA metabarcoding, where DNA from multiple species is detected and sequenced simultaneously from mixed samples using high-throughput sequencing (Taberlet et al. 2012), provides an alternative with greater power to characterise the taxa represented in environmental samples (Pompanon et al. 2012; Ficetola and Taberlet 2023).
DNA metabarcoding of environmental samples could provide a tool that complements traditional approaches to animal research through the detection of local presence, determination of distributions, identification of co-location with other species, and evidence of predation (Deagle et al. 2005; Berry et al. 2017; McInnes et al. 2017; Compson et al. 2020; Mena et al. 2021; Keck et al. 2022). The key challenge when developing markers for metabarcoding is to identify and validate sequences that can be amplified with high success, while also discriminating among the target taxa. Development of ‘universal’ primers that can amplify DNA from many taxa requires a priori knowledge of both the range of taxa likely to be encountered, and the availability of reference sequences from those species. Moreover, shorter (<200 bp) (Taberlet et al. 2012) sequences are required to counter the degraded nature of some eDNA samples (Coissac et al. 2012) arising from bacterial and fungal contamination, enzyme attack (Pääbo et al. 2004) and abiotic factors such as high acidity (Goldberg et al. 2018; Seymour et al. 2018). Ideal metabarcoding markers therefore should exhibit high and repeatable amplification from degraded DNA, while retaining their ability to discriminate among the taxa likely to be found in the area of study (MacDonald and Sarre 2017).
Mitochondrial DNA (mtDNA) markers are widely used for species detection from eDNA because the mitochondrial genome is present in multiple copies within cells, is more resistant than nuclear chromosomes to DNA degradation, and is conserved in both size and gene content while being useful in discriminating among members of closely related taxa (Avise 1986). Nevertheless, the mitochondrial markers that have been most used to answer taxonomic questions are often poor at distinguishing between biogeographically young species (Taberlet et al. 2012) or are poorly represented in reference libraries (Lindner et al. 2023) and must therefore be evaluated for risks of bias and mis-identification. A robust DNA reference library that includes sequences from all target species likely to be encountered (Ekrem et al. 2007; Pompanon et al. 2012) is required to definitively identify markers that will be appropriate for eDNA analyses. Although public databases such as NCBI GenBank (https://www.ncbi.nlm.nih.gov/genbank/; Benson et al. 2013) and BOLD (https://boldsystems.org/; Ratnasingham and Hebert 2007) include sequences from a wide range of taxa, many species remain under-represented or even unrepresented in diagnostic genetic databases, leading to problems in data interpretation, particularly in relation to local fauna.
For these reasons, Australian mammals provide a good case study with which to demonstrate the development and evaluation of eDNA resources for application to a less researched fauna. Here, we focus on the Tasmanian mammal fauna, specifically the order Diprotodontia. There are 125 extant species in the order Diprotodontia in Australia (Meredith et al. 2009) and 11 of these are found in Tasmania, making this the most diverse mammal order on the island. Several of the Tasmanian diprotodonts are of conservation concern, and improved eDNA resources would enable new approaches to detect and monitor these taxa for conservation management (MacDonald and Sarre 2017; Modave et al. 2017).
We apply a bioinformatic approach to evaluate the ability of three mitochondrial gene regions to detect and discriminate among marsupial species in an eDNA metabarcoding context. The COI gene has been studied extensively and a reference database of animal COI DNA barcodes is readily available (Ratnasingham and Hebert 2007). The mitochondrial 12S rRNA and 16S rRNA genes are also highly conserved among taxa and yet display sufficient variation to infer phylogenetic relationships among Australian marsupial species (Springer et al. 1994; Burk and Springer 2000; Osborne et al. 2002; Westerman et al. 2002, 2016; Frankham et al. 2012; May-Collado et al. 2015). Specifically, we evaluate five candidate primer sets from these genes in silico and identify two suitable markers (from the 12S and 16S genes) for application to marsupials. We then test those markers against a comprehensive reference sequence database from the Australian genus Diprotodontia, with a focus on animals that are likely to be sampled in the island state of Tasmania. Finally, and as a proof-of-concept, we apply the markers to scats collected from a site in Tasmania and successfully generate predator and prey profiles for those scats.
Materials and methods
Selection of candidate metabarcoding primers
Candidate marsupial metabarcoding primers were identified from the literature on the basis of amplicon length (<300 bp) and organism specificity (Supplementary Table S1). In total, we evaluated five sets of primers that have previously been shown to amplify mammalian DNA (Table S1). These included two sets of primers for each of the 12S rRNA and 16S rRNA genes, and one set of primers for the COI gene. For the 12S rRNA gene, the 12SV5 primers were developed for use with degraded DNA and tested on carnivore scats (Riaz et al. 2011) and have been used on Tasmanian devil scats to identify diet items (McLennan et al. 2022), whereas the primers L1085 and H1259 were designed on the basis of human sequences and have been tested across multiple mammalian taxa with high success (Kitano et al. 2007). Both the 16SMam primers (Taylor 1996) and the L2513 and H2714 primers (Kitano et al. 2007) for the 16S rRNA gene were developed for use with ancient or degraded DNA. Most published sets of COI primers amplify longer fragments, but the uni-minbar primers (Meusnier et al. 2008) were specifically designed to amplify shorter fragments of degraded DNA.
Evaluation of primer utility for amplification of mammal DNA
We used two analyses to determine the likely effectiveness of each candidate primer pair for reliably amplifying mammalian DNA from unknown samples. First, we used the R package PrimerTree (https://github.com/MVesuviusC/primerTree, Cannon et al. 2016) to evaluate the potential utility of each primer set to amplify DNA from, and distinguish among, taxa within the class Mammalia. We queried each candidate primer set against GenBank, using the BLAST function within PrimerTree (with the default settings), to identify all vertebrate sequences that could be amplified. In this context, sequences were considered to be amplifiable if they included complementary binding sites for both the forward and reverse primers for a given marker. Results were visualised by generating phylogenetic trees showing all amplifiable sequences for each marker at the level of class (noting that these trees do not necessarily represent true species relationships owing to the very short nature of the amplified region). Branch lengths on these trees relate directly to the level of resolution provided by a given marker for particular taxa; short branch lengths indicate that the marker is likely to have very low resolution, whereas long branch lengths indicate a high capacity to distinguish among species (Cannon et al. 2016). We estimated the likelihood that each primer set would bind to a high proportion of sequences within the target group, and whether they could also be expected to bind to non-target groups.
In our second analysis, we evaluated each of the five primer sets at the infraclass level, to determine their suitability for application to different groups of mammals, especially marsupials. For each of the three candidate genes, all available marsupial DNA sequences were downloaded from GenBank (12S, 16S and COI) and BOLD v3.0 (COI only) (accessed February 2017) and sorted into operational taxonomic units (OTUs) by using the R package PrimerMiner-0.12 (https://github.com/VascoElbrecht/PrimerMiner, Elbrecht and Leese 2016). OTUs were aligned in Geneious v10.0.5 by using a MAFFT alignment (Katoh et al. 2002) with the default settings. Primers were evaluated against OTU alignments following the recommended PrimerMiner protocol. PrimerMiner evaluates single primers or primer pairs, considering the adjacency, position and type of each mismatch between primers and the alignment. Each primer pair was tested at the following different thresholds: 50, 100, 150 and 200. A higher threshold allows for more base-pair mismatches in the primer binding region. The higher the required threshold, the less suitable the primer is likely to be for a given OTU. Therefore, primer pairs with lower thresholds assigned for an OTU would be preferred for further analysis and use in a metabarcoding study.
Construction of locally appropriate reference-DNA databases for the Tasmanian Diprotodontia
On the basis of our initial evaluation (see Results), we selected two markers, 12SV5 and 16SMam, for further consideration, because these showed the greatest potential for broad amplification of mammal DNA, including marsupials. To allow evaluation of the diagnostic ability of these markers in the Tasmanian Diprotodontia, a group that was depauperate in genomic resources, we generated custom reference DNA-sequence databases for the 12S rRNA and 16S rRNA genes. We sequenced representatives of most extant species of the order Diprotodontia that currently occur in Tasmania. For each target species, samples were included from across the geographic range where possible, including outside Tasmania (Table S1). Tissue and skin samples were sourced from museums, researchers, and through the collection of road-killed animals. DNA was extracted from tissue samples following a salting-out method, as follows: for each sample, a piece of tissue approximately 2 mm2 was incubated overnight at 55°C in 330 μL of tissue extraction buffer (40 mM Tris–HCl; 100 mM NaCl; 20 mM EDTA, pH 7.2; 0.6% SDS; 0.5 mg/mL Proteinase K). After incubation, 150 μL of 7.5 M ammonium acetate was added. Samples were chilled at −80°C for 25 min before centrifugation for 20 min at 19,000g and 4°C. Supernatant was transferred to a new tube and DNA was ethanol precipitated. DNA pellets were resuspended in 50 μL of 1 × TE (10 mM Tris-HCl; 1 mM EDTA) (MacDonald et al. 2011). In addition, following tissue lysis and incubation at 55°C, 3 μL of 4 ng/μL RNase A (Sigma-Aldrich) was added to each sample and incubated at 55°C for 30 min. DNA was extracted from skin samples using the Qiagen DNeasy® blood and tissue kit, following the manufacturer’s recommended protocol, with the addition of an extra 100 μL of ATL buffer (Qiagen) and 10 μL proteinase K during the lysis step, with incubation for 24 h.
An 800 bp region of the mitochondrial 12S rRNA gene was amplified using primers 12C (5′ AAAGCAAAKCACTGAAAATG 3′) and 12GG (5′ TRGGTGTARGCTRRRTGCTTT 3′) (Springer et al. 1995). PCRs of 25 μL contained 50 ng of DNA, 1 × MyTaq HS Red (Bioline), and 0.4 μM of each forward and reverse primer. PCR conditions consisted of denaturation at 95°C for 5 min, followed by 15 cycles of 95°C for 20 s, a touchdown of 65–50°C for 20 s and 72°C for 60 s, followed by 30 cycles of 95°C for 20 s, 50°C for 20 s, and 72°C for 60 s, followed by a final extension at 72°C for 4 min.
A 900 bp region of the mitochondrial 16S rRNA gene was amplified using primers Mammal_16SF (5′CGAGCCTGGTGATAGCTGGTT3′) (Modave 2017) and U16S-REV (5′ TCCGGTCTGAACTCAGATCAC 3′) (Yang et al. 2014). PCRs of 25 μL contained 50 ng of DNA, 1 × MyTaq HS Red (Bioline), and 0.4 μM of each forward and reverse primer. PCR conditions consisted of denaturation at 95°C for 5 min, followed by 15 cycles of 95°C for 20 s, a touchdown of 65–50°C for 20 s and 72°C for 60 s, followed by 30 cycles of 95°C for 20 s, 50°C for 20 s, and 72°C for 60 s, followed by a final extension at 72°C for 4 min.
PCR products were purified using Diffinity RapidTips (Sigma-Aldrich). Sequencing reactions of 20 μL included 1 μL of purified PCR product, 3.5 μL BigDye 3.1 (Applied Biosystems), 1 × BigDye sequencing buffer and 2 μM primer. The reaction conditions involved an initial denaturation at 94°C for 5 min, followed by 30 cycles of 96°C for 10 s, 50°C for 5 s, and 60°C for 4 min. Sequencing reactions were purified using a standard ethanol/EDTA precipitation method (Applied Biosystems 2009). Sequencing was performed on an AB 3730 × l DNA Analyser at the ACRF Biomolecular Resource Facility (Australian National University), following the manufacturer’s protocol. Forward and reverse raw sequences were aligned in Geneious v10.0.5 and subsequently checked and edited manually, before a consensus sequence was generated for each sample.
Our custom reference databases were supplemented with all publicly available 12S rRNA and 16S rRNA sequences from GenBank (accessed March 2017 for the target species; Table S1). The final DNA reference database for each gene was constructed in Geneious by aligning all sequences (consensus sequences generated in this study and sequences obtained from GenBank) using the MUSCLE option (Edgar 2004). The 12SV5 and 16SMam primers were then mapped to their respective custom reference database. For each marker in turn, the full gene alignment was trimmed to include only the sequence region between the primer binding sites, and these trimmed marker-specific alignments were used for subsequent analyses.
Genetic distance-based evaluation of the candidate metabarcoding markers
The R package SPIDER v1.1-2 (https://cran.r-project.org/web/packages/spider/index.html, Brown et al. 2012) was used to determine the diagnostic abilities of the 12SV5 and 16SMam markers, and the risks of false positive and false negative identifications associated with each. Singleton species (species for which only a single sequence was available) were removed from the two marker-specific reference databases, because intraspecific genetic differences could not be calculated for these species. Three analyses, the nearNeighbour, bestCloseMatch and threshID functions (included within the R package SPIDER), were then undertaken for each candidate marker (using the same code and parameters as described in (MacDonald and Sarre 2017)) to determine which sequences, if any, were likely to be ambiguously identified or misidentified. We evaluated genetic-distance thresholds of 1%, 3% and 5% for the bestCloseMatch and threshID analyses. Pairwise genetic distances were calculated using a raw or uncorrected model.
Phylogenetic evaluation of the candidate metabarcoding markers
We generated a maximum-likelihood phylogenetic tree for each marker, by using only the short gene regions amplified by each set of primers, to determine whether the 12SV5 and 16SMam markers have sufficient phylogenetic resolution to discriminate among the taxonomic groups of interest. The evolutionary history was inferred for the 92 bp 16SMam region by using the maximum-likelihood method based on the Tamura 3-parameter model (Tamura and Nei 1993). A discrete gamma distribution was used to model evolutionary rate differences among sites (+G, parameter = 0.7925) and was determined using the Akaike information criterion (AIC) calculations by using MEGA v7.0 (https://www.megasoftware.net/home, Kumar et al. 2016). The evolutionary history was inferred for the 100 bp 12SV5 fragment by using the maximum-likelihood method based on the Kimura 2-parameter model (Kimura 1980). A discrete gamma distribution was used to model evolutionary rate differences among sites (+G, parameter = 0.1723) and was determined using the AIC calculations by using MEGA v7.0 (https://www.megasoftware.net/home, Kumar et al. 2016). Phylogenetic trees were prepared using garli v2.01 (https://github.com/zwickl/garli, Zwickl 2006) with 1000 bootstraps. The trees were rooted using the genus Dasyurus as an outgroup, because the Dasyuromorphia represents a sister taxon to the Diprotodontia (Mitchell et al. 2014).
Field testing of candidate metabarcoding markers
We conducted a proof-of-concept analysis by using samples collected in one 3 km × 3 km grid square in north-eastern Tasmania as part of a broadscale predator-scat survey (Ramsey et al. 2018). Ten predator scats were collected on 1 day in the field in 2008, dried, and sent to the University of Canberra Trace DNA Laboratory for analysis. Laboratory and bioinformatic methods are outlined below.
Custom reference-DNA database for all known prey species in Tasmania
To enable interpretation of DNA metabarcoding data from predator scats, the two custom reference databases developed for Tasmanian Diprotodontia were augmented by the addition of sequences from other Tasmanian mammals. These included all extant species of Muridae, Dasyuridae, Felis and Leporidae that occur within Tasmania. We used Obitools v1.01 (https://pythonhosted.org/OBITools/introduction.html, Boyer et al. 2016) to generate metabarcoding reference databases including either 12SV5 or 16SMam sequences as appropriate, from all mammals represented in Genbank (Benson et al. 2013), to ensure that we represented as many potential predator and prey species likely to be encountered in Tasmania as possible. The final 12S rRNA custom DNA reference database constructed for prey analysis consisted of 321 sequences representing five orders, 10 families, 17 genera and 41 species. The 16S rRNA custom DNA reference database consisted of 204 sequences comprising five orders, 10 families, 17 genera and 35 species.
Scat survey
A series of predator-scat surveys were conducted across eastern Tasmania by the Department of Natural Resources and Environment, Tasmania, and the Invasive Animals Cooperative Research Centre (IACRC). Standardised methods were used, in which 3 km2 survey units were searched for a specified duration of 10 person-h, following linear features (Ramsey et al. 2018). These surveys focused on three zones, namely, north-eastern Tasmania, north-central Tasmania and south-eastern Tasmania, in 2008, 2009 and 2010 respectively (Sarre et al. 2013). Subsequently, the north-eastern zone was re-surveyed, by using the same methods and survey unit sites, in autumn 2014. All mammal-predator scats encountered, including those from Tasmanian devils, spotted-tailed and eastern quolls, cats, dogs, and red foxes, were collected, stored in individual paper bags, and air dried in preparation for DNA analysis. Each scat was also swabbed in situ before collection during the 2014 survey and air dried. Here, we focus on the scats collected from one survey unit (unit O101) in the north-east during 2008.
Scat DNA extraction and evaluation for metabarcoding
To obtain DNA for metabarcoding, DNA was extracted from 10 scats (0.1–0.2 g/scat) plus one extraction negative by using the Invitrogen™ ChargeSwitch® forensic DNA purification kit following the manufacturer’s protocol. DNA extraction and PCR set-up were conducted in a dedicated trace DNA laboratory that was located in a PCR product-free building and subjected to strict quarantine protocols to minimise the risk of contamination.
We used quantitative PCR (qPCR) to evaluate amplification success from serial dilutions of DNA from each sample, to provide an indication of expected metabarcoding success and the likely level of PCR inhibition in each sample (Ramsey et al. 2015). We used the ViiA7 Real-Time PCR System (Thermo Fisher Scientific) to screen three replicate PCRs (by using undiluted DNA extract, 1/10 dilution, and 1/100 dilution as the templates) of each DNA sample. Each reaction had a total volume of 25 μL, including 2.5 μL of 10 × Gold buffer, 50 μM MgCl2, 10 mg/μL bovine serum albumin (BSA), 10 μM each of the relevant forward and reverse (either 12SV5 or 16SMam) primers, 0.6 μL of 1/2000 dilution of SYBR Green, 6.3 μM dNTPs, 0.2 μL Amplitaq Gold, H2O and 2 μL of the appropriate DNA dilution. PCRs were denatured at 95°C for 5 min and cycled through 40 cycles of 95°C for 30 s, 57°C for 30 s, 72°C for 30 s, followed by denaturing at 95°C for 15 s and a melt curve from 60°C to 95°C at a rate of +1°C/5 s. We did not use a species-specific blocking primer targeted to block the predator DNA because we did not know, a priori, for any given scat, which species of predator each scat came from. Three negative controls containing PCR water instead of DNA were included in each run. We conducted a comparative CT analysis using the ViiA7 Real-Time PCR System’s software v1.2.4, (Thermo Fisher Scientific, https://www.thermofisher.com/au/en/home/life-science/pcr/real-time-pcr/real-time-pcr-instruments/viia-7-real-time-pcr-system/viia-7-software.html), with a threshold of 40,000 ΔRn determined automatically. We calculated the CT value for each dilution of each DNA sample and used this to select the most appropriate DNA dilution to use for generation of DNA metabarcoding libraries. Samples were excluded from further analysis if all replicates failed to amplify or if all replicates had a CT value higher than 39.
Metabarcoding-library preparation
Two metabarcoding libraries, namely one for the 12SV5 marker and one for the 16SMam marker, were constructed for each DNA extract and for each DNA extraction negative control. Library construction involved a single qPCR step using fusion-tagged primers for the relevant markers. For each marker, forward primers included, from 5′ to 3′, the Illumina P5 adapter, a custom MiSeq sequencing primer, a multiplex identifier (MID) sequence tag, and the gene-specific forward primer. Reverse primers included, from 5′ to 3′, the Illumina P7 adapter, a multiplex identifier (MID) sequence tag, and the gene-specific reverse primer. Molecular identification tags were used to identify libraries from individual scats, so that these could later be pooled. Reactions of 25 μL total volume included 2.5 μL of 10 × Amplitaq Gold buffer (Applied Biosystems), 50 μM MgCl2 (Applied Biosystems), 10 mg/μL BSA (Invitrogen), 20 μM each of the appropriate forward and reverse primers (Integrated DNA Technologies), 0.6 μL of 1/2000 dilution of SYBR Green I (Invitrogen), 6.5 μM dNTPs (Thermo Scientific), 0.2 μL Amplitaq Gold (Applied Biosystems), nuclease-free water (Integrated DNA Technologies) and 3 μL of DNA (using either undiluted DNA extract, 1/10 dilution, or 1/100 dilution as determined during the evaluation described above). qPCR conditions consisted of denaturation at 95°C for 5 min, 40 cycles of 95°C for 30 s, 57°C for 30 s and 72°C for 2 min, extension at 72°C for 10 min, denaturation at 95°C for 15 s, then a melt curve from 60°C to 95°C at a rate of +1°C/5 s, with a final hold at 4°C. We used the ViiA7 Real-Time PCR System (Thermo Fisher Scientific) and conducted comparative CT analyses by using the ViiA7 Real-Time PCR System’s software v1.2.4, with a threshold of 40,000 ΔRn determined automatically. We calculated the CT value for each library and submitted libraries for sequencing if they had a CT value lower than 39. Library construction was repeated for samples where amplification initially failed at only one gene. Samples, including DNA extraction negative controls, for which amplification failed at both genes were excluded from further analysis.
Amplicon libraries were pooled and cleaned in two stages. Initially, we pooled equal volumes of up to 10 libraries of similar concentration (as indicated by similar CT values); at this stage libraries from the two markers were not mixed. Each of these amplicon pools was cleaned using Ampure XP beads (Beckman Coulter), as described by (Murray et al. 2013), before being visualised on a 2% Tris–acetate–EDTA (TAE) agarose (Sigma Aldrich) gel stained with SYBR Safe (Invitrogen). A proportion of each library pool was then added to a final super pool, normalised according to its relative strength on the agarose gel. At this stage, libraries from the 12SV5 and 16SMam markers were mixed. The final super pool was cleaned using Ampure XP beads by using the same protocol, before equencing using the Illumina MiSeq platform, conducted at the Ramaciotti Centre for Genomics at UNSW.
Analysis of scat DNA metabarcoding data
We used Trimmomatic v0.36 (https://github.com/usadellab/Trimmomatic, Bolger et al. 2014) to remove adapter sequences, to trim poor-quality reads by using the sliding-window approach and default thresholds. We used Obitools v1.01 (https://pythonhosted.org/OBITools/introduction.html, Boyer et al. 2016) to cluster and identify reads. The ngsfilter command was used to demultiplex reads and assign each read to a gene and sample of origin according to the unique combination of MID tags and primers. We used the obistat command to remove possible chimeric sequences that are caused by PCR and sequencing errors (Schnell et al. 2015). We applied a threshold on sequence length taking only 12S rRNA sequences of greater than 80 bp and 16S rRNA sequences that were greater than 100 bp. Sequences were then compared with those in our Genbank reference-DNA database and our custom reference database of DNA sequences, by using the default settings in Obitools, and assigned to family, species and/or genus as appropriate. All reads that could be assigned to a family, genus or species of origin were compiled into a gene table for each marker, and then reviewed manually. Any sequence with only one read per scat was removed at this stage.
For each scat sample, the expected predator of origin was determined on the basis of results for each marker independently and then compared. Where results were ambiguous at the species level, the predator was assigned at the family or genus level as appropriate. Species inferences were based on the percentage of scats in which the prey was found by using presence or absence as the criterion because other methods based on the number of sequence reads do not necessarily reflect the intake of prey (Pompanon et al. 2012). Sequence reads from presumed prey items were identified to species level where possible. When these reads could be assigned to order or family only at one marker, results were cross-checked against reads observed at the other marker and against similar reads on GenBank, in case the identification could be resolved further. Results from the genetic distance-based evaluations described above suggest that a 1% genetic distance threshold would be sufficient to identify unknown sequences to species level for Diprotodontia at the 16S and 12S markers used here. Consequently, in basic local alignment search tool (BLAST) analyses, any unassigned scat DNA sequence that matched a GenBank sequence with an identity score of ≥99% and an E-value of ≤10–5, was assigned to that species, whereas the genus- or family-level identifications were retained for scat sequences that matched with identity scores of <99%. This reduced the probability that inaccurate species assignments remained in the dataset, because an inaccurate sequence is not expected to match a reference species at ≥99% by chance (Yamamoto et al. 2017). Finally, the tables for each gene were combined to produce one set of predator and prey sequences for each scat. Predators were assigned according to the highest number of reads in a sample and then removed from the prey column. Where reads from more than one predator species were identified from the same sample, the species with the highest number of reads was assumed to be the predator responsible for the scat, and species with lower read counts were included for analysis as potential prey.
Results
Evaluation of primer utility for amplification of mammal DNA
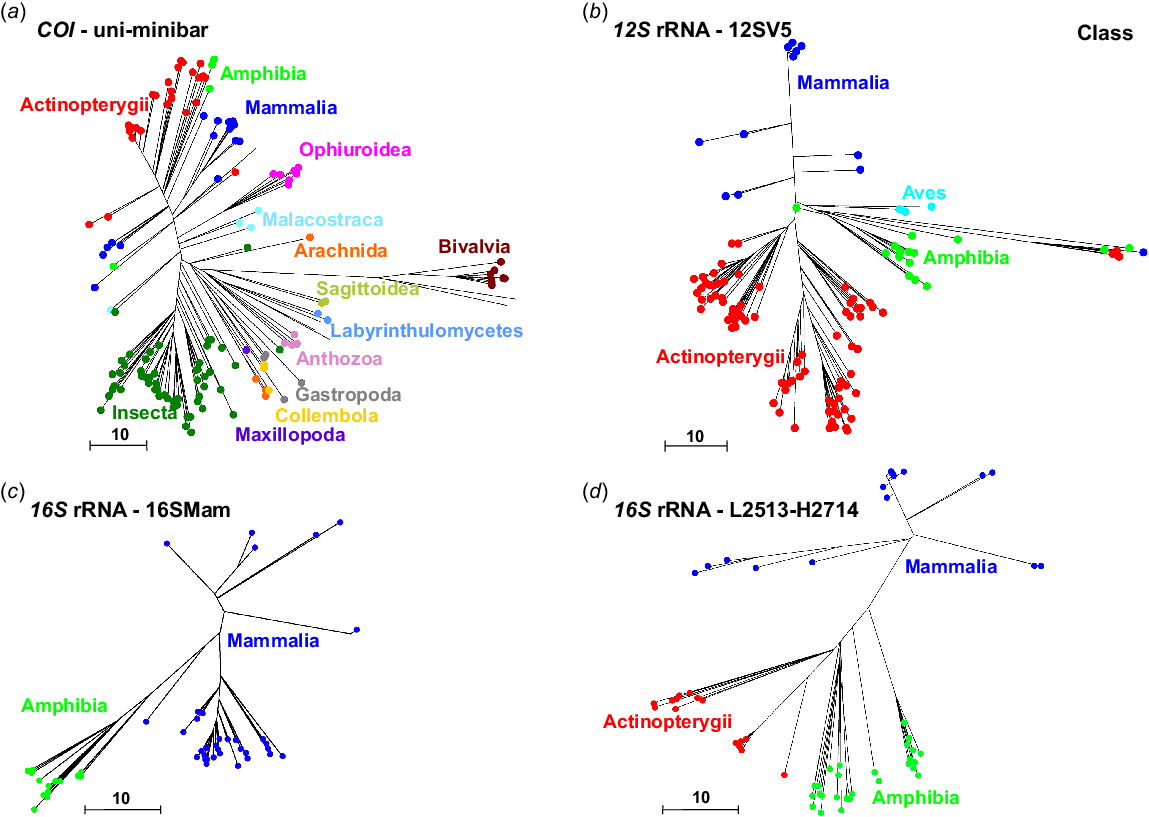
The COI primers uni-minbar were developed as universal eukaryote primers and have previously been tested on eutherian mammals and three species of South American, but not Australian, marsupials (Meusnier et al. 2008). Here, we used PrimerTree to identify the presence of uni-minibar primer binding sites in different classes of animal, by comparison to all published sequences from the COI gene. We observed that these primers have the potential to amplify sequences from a broad range of taxa, including some mammals and many invertebrates, but were unsuitable for application to birds, with few primer binding sites identified from COI sequences from the class Aves (Fig. 1a).
Phylogenetic trees generated using the R package PrimerTree (Cannon et al. 2016), showing: (a) COI sequences with suitable binding sites for the uni-minibar primers; (b) 12S rRNA sequences with suitable binding sites for the 12SV5 primers; (c) 16S rRNA sequences with suitable binding sites for the 16SMam primers; and (d) 16S rRNA sequences with suitable binding sites for the L2513–H2714 primers. Sequences are resolved at the level of class. These trees include only those sequences that are likely to be amplified using the relevant primers.
The PrimerTree analysis provides an indication of the breadth of taxa likely to be amplified by a candidate primer set, but it provides no indication of the proportion of species that are likely to be amplified within each taxonomic group. We used PrimerMiner-0.12 to evaluate expected amplification success for each candidate marker within a desired group, in this case the infraclass Marsupialia, by evaluating the conservation of primer binding sites in all published marsupial sequences. This allowed us to identify any potential taxonomic bias in amplification for each marker. Conservation of primer sites in a high proportion of species by using a lower threshold was desirable because higher thresholds allow a greater number of base-pair mismatches within the primer binding region.
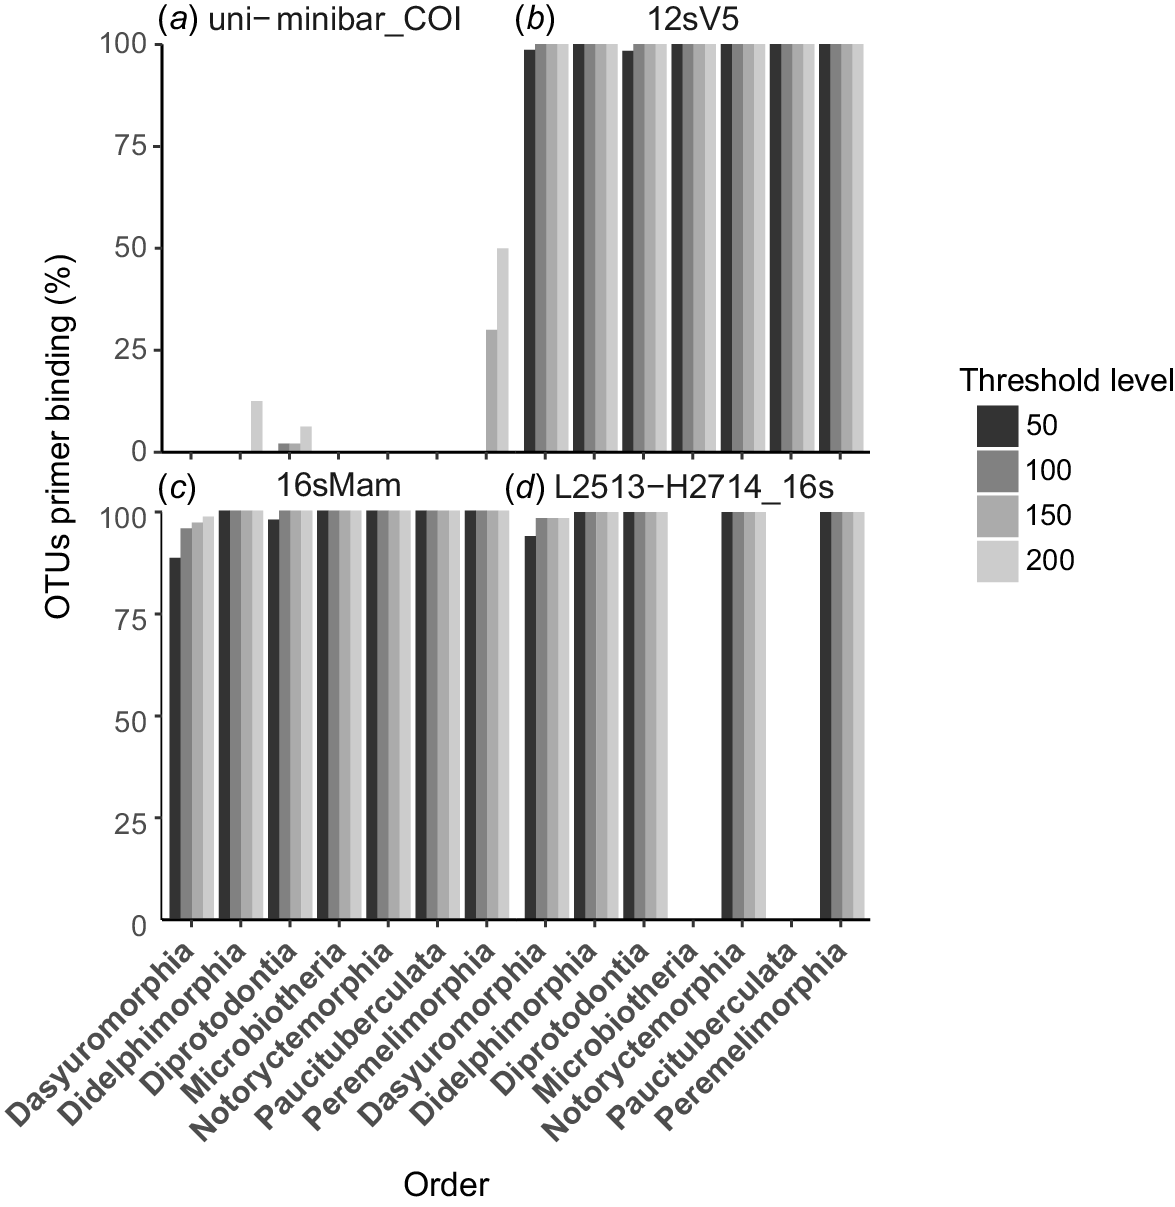
These results show that the COI uni-minbar marker is a poor marker for marsupial metabarcoding (Fig. 2a). We observed very low levels of primer binding-site conservation among published sequences from marsupial species, with only 6% of sequences from the order Diprotodontia, 10% from Didelphimorphia and 50% from Peramelemorphia considered to be likely to be amplified by this marker by using the least-stringent threshold of 200. Further, it appears that these primers would be unlikely to successfully amplify any sequences from the Dasyuromorphia, Microbiotheria, Paucituberculata or Notoryctemorphia. For these reasons, we did not consider the COI uni-minibar marker further in our analyses.
Bar plots showing the proportion of OTUs within each marsupial order for which primer binding sites are conserved for four candidate mitochondrial markers: (a) the COI uni-minibar primer sites showed extremely low conservation in any marsupial group; (b) primer sites were highly conserved across all marsupial orders for the 12SV5 marker; (c) primer sites were highly conserved across all marsupial orders for the 16SMam markers; (d) primer sites were conserved for some marsupial orders for the L2513–H2714 primers, but these would be unlikely to amplify DNA from Microbiotheria and Paucituberculata. Higher thresholds allow a greater number of nucleotide mismatches between primer and target sequences. Plot is not shown for the L1085–H1259 12S rRNA primers because we were unable to detect any published marsupial sequences that are likely to be amplified by these primers.
Only one of the 12S rRNA marker tested, 12SV5 (which was designed to be a universal marker for vertebrate species), was identified as broadly applicable by using PrimerTree (Fig. 1b). This analysis demonstrated that the 12SV5 primers are likely to amplify DNA from Mammalia, Amphibia, Aves and Actinopterygii, and therefore identified these primers as suitable for vertebrate metabarcoding. We were unable to generate a reliable tree for 12S rRNA primers L1085–H1259, even though initial testing in Geneious v10.0.5 suggested that the marker could be a suitable candidate for amplification of marsupial DNA.
We used PrimerMiner to evaluate both sets of 12S rRNA primers for all orders in the infraclass Marsupialia. Primer binding sites were highly conserved across all marsupial orders for the 12SV5 marker (Fig. 2b), with amplification expected from >98% of sequences from Dasyuromorphia and Diprotodontia, and 100% of sequences from all other marsupial orders by using the most stringent threshold of 50. This indicated that the 12SV5 marker is a suitable candidate for eDNA metabarcoding studies of Marsupialia. Despite initial indications that the L1085–H1259 marker would be a suitable candidate for amplification of marsupial DNA, we were unable to detect any published marsupial sequences that are likely to be amplified by these primers (Fig. 2c). For this reason, the L1085–H1259 marker was excluded from further consideration.
Our PrimerTree analysis demonstrated that both primer sets targeting the 16S rRNA gene are likely to reliably amplify mammal DNA. Binding sites for the L2513–H2714 primers were conserved in DNA sequences originating from Mammalia, Amphibia and Actinopterygii (Fig. 1d), whereas binding sites for the 16SMam primers were observed in DNA sequences from Amphibia and Mammalia (Fig. 1c).
PrimerMiner analysis of the 16SMam marker showed that primer binding sites were highly conserved across all orders in the infraclass Marsupialia (Fig. 2d), with amplification expected from >95% of sequences from Diprotodontia, >85% of sequences from Dasyuromorphia, and 100% of sequences from all other marsupial orders by using the most stringent threshold of 50. Similarly, the L2513–2714 primer binding sites were highly conserved within four of the seven marsupial orders (Fig. 2e), with potential for amplification of 100% of sequences at the least stringent threshold. This marker is also likely to be amplified from over 98% of sequences from the order Dasyuromorphia by using a threshold of 100, and from over 90% of sequences by using the most stringent threshold of 50. However, two of the three South American marsupial orders, Microbiotheria and Paucituberculata, exhibited poor conservation of primer binding sites and would be unlikely to amplify using the L2513–2714 marker. This result suggests that the marker L2513–2714 would be suitable for application to Australian but not South American marsupials. We elected to exclude this marker from further evaluation in this study, primarily because the longer amplicon length relative to the 16SMam marker makes this marker less suitable for analysis of degraded or eDNA. We selected the 16SMam marker for further evaluation because it has a shorter amplicon length (the primers were developed specifically for application to highly degraded DNA), it has broad applicability within Marsupialia, and it displays a higher utility for mammal DNA overall.
Genetic distance-based evaluation of the candidate metabarcoding markers
We constructed custom reference-DNA databases for all Tasmanian Diprotodontia and some mainland Australian Diprotodontia at the 12SV5 and 16SMam markers. We sequenced 58 tissue samples at the 16S rRNA gene and 164 tissue samples at the 12S rRNA gene. Gaps in these databases were filled with published sequences obtained from GenBank for both the 16S rRNA (n = 15) and 12S rRNA (n = 35) genes (Table S1). Singleton species were then removed, leaving a total of 194 sequences from 19 different species and 10 genera in the 12SV5 database, and 64 sequences from 11 different species and eight genera in the 16SMam database.
We used the R package SPIDER to conduct genetic distance-based analyses, which demonstrated that the 12SV5 and 16SMam markers can both identify marsupial sequences at a high level of resolution. All 64 sequences in the 16SMam database were correctly identified using a nearNeighbour analysis. In the bestCloseMatch analysis, 59 (using a 1% genetic distance threshold) or 63 (3% and 5% threshold) of the 64 sequences were correctly identified (Table S2). The remaining sequences could not be identified because no other sequences in the database were within the specified genetic-distance threshold. However, on closer inspection by using higher genetic-distance thresholds, the nearest neighbour to each of these sequences originated from a conspecific. This makes clear the importance of using a reference database that fully captures local intra-specific variation. In the threshID analysis, we again observed 59 correct identifications by using a 1% genetic-distance threshold. The same five sequences that could not be identified in the bestCloseMatch analysis remained unidentified in the threshold-identity analysis. Only 49 or 47 sequences were correctly identified using thresholds of 3% and 5% respectively (Table S3). No sequences were incorrectly identified and, as before, one sequence could not be identified because all other sequences in the database were outside the selected genetic-distance threshold.
We observed greater opportunity for ambiguity in identification when using the threshID analysis, which considers all sequences within the genetic distance threshold as potential matches, rather than just the closest match. This occurs when there is no clear barcoding gap between closely related species, typically because sequences from conspecifics and from at least one other species (usually a sister taxon) are within the specified-distance threshold. Unfortunately, location data were not available for several sequences obtained from GenBank, making it difficult to determine whether samples that could not be identified, or were ambiguously identified, may represent genetically distinct populations or subspecies, as might be expected for Tasmanian versus mainland Australian specimens. In these circumstances, and if data interpretation also considered gaps in coverage of intra-specific variation in the reference database, we considered it appropriate to recommend a bestCloseMatch analysis with a 3% threshold, for the 16SMam marker for Diprotodontia.
All 194 sequences in the 12SV5 database were correctly identified using a nearNeighbour analysis. In the bestCloseMatch analysis, 186 (using a 1% genetic distance threshold), 192 (3% threshold) or 193 (5% threshold) sequences were correctly identified (Table S4). Eight sequences (1% threshold) and two sequences (3% threshold) could not be identified because no other sequences in the database were within these specified-distance thresholds. Furthermore, a single sequence from Potorous tridactylus (sequence AY245617) was ambiguously identified (by using a 5% threshold) as being within a 5% genetic distance of sequences from other Potorous species as well as sequences from Bettongia penicillata and Thylogale thetis. No information is available regarding the origin of the sample from which this sequence was obtained (Westerman et al. 2004). This species is found in Tasmania and on mainland Australia, and some genetic differentiation has been observed among individuals from different geographic regions (Frankham et al. 2012). Consequently, this ambiguity could reflect regional genetic variation or mistaken identity. In the threshID analysis of the 12SV5 database, by using a 1% threshold, 182 sequences were correctly identified, and eight sequences could not be identified (these were the same eight sequences that could not be identified in the corresponding bestcloseMatch analysis). The remaining four sequences (two from Bettongia lesueur and two from Cercartetus nanus) were listed as incorrectly identified. However, we found that in each case no other sequence was within the 1% genetic distance threshold, indicating that ‘no identification’ would be a more appropriate result for these samples by using these parameters. Using a 3% threshold, each of these sequences clustered only with sequences from conspecifics, which suggests that incorrect identification of these samples would be unlikely. As observed for the 16SMam analysis, sampling location information was not available for some GenBank sequences, making it difficult to determine whether these sequences represent isolated populations or different subspecies. On the basis of our results, it again seems most appropriate to use the bestcloseMatch analysis, but this time with a 5% threshold, for the 12SV5 marker for Diprotodontia. However, care must be taken when considering identifications within the Macropodiformes, particularly the genus Potorous, which appears to display lower genetic differentiation at this marker. In this case, the combined use of two genetic markers for DNA metabarcoding would improve confidence in identification of species known to be at risk of misidentification or ambiguity.
Phylogenetic evaluation of the candidate metabarcoding markers
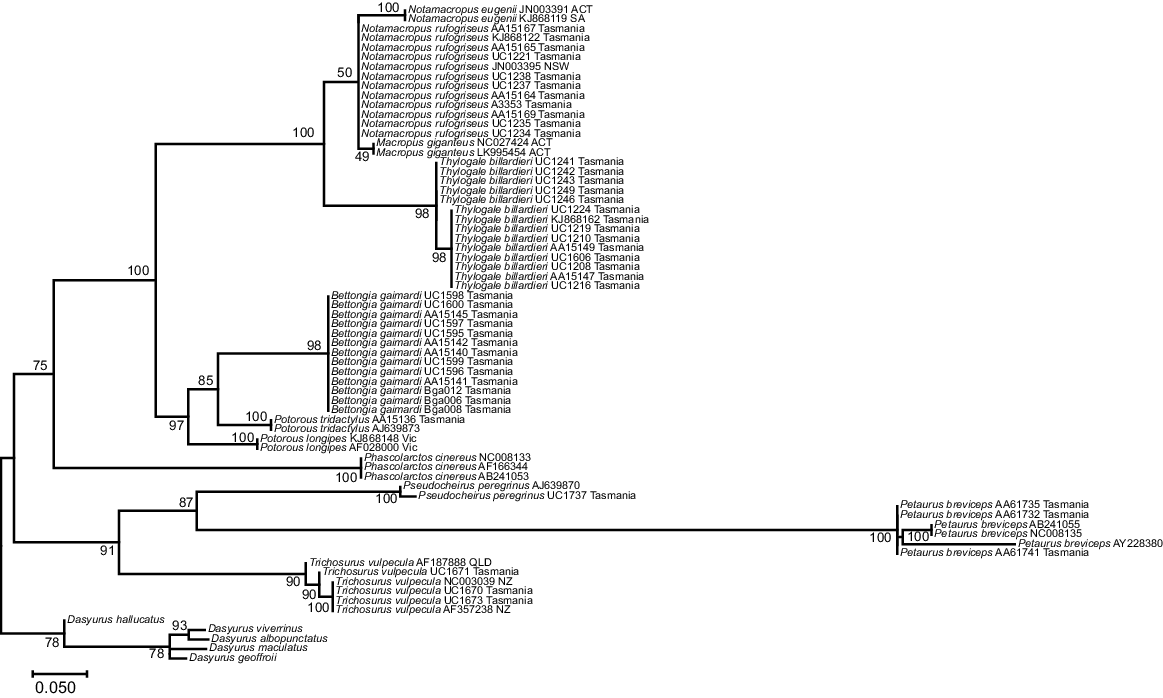
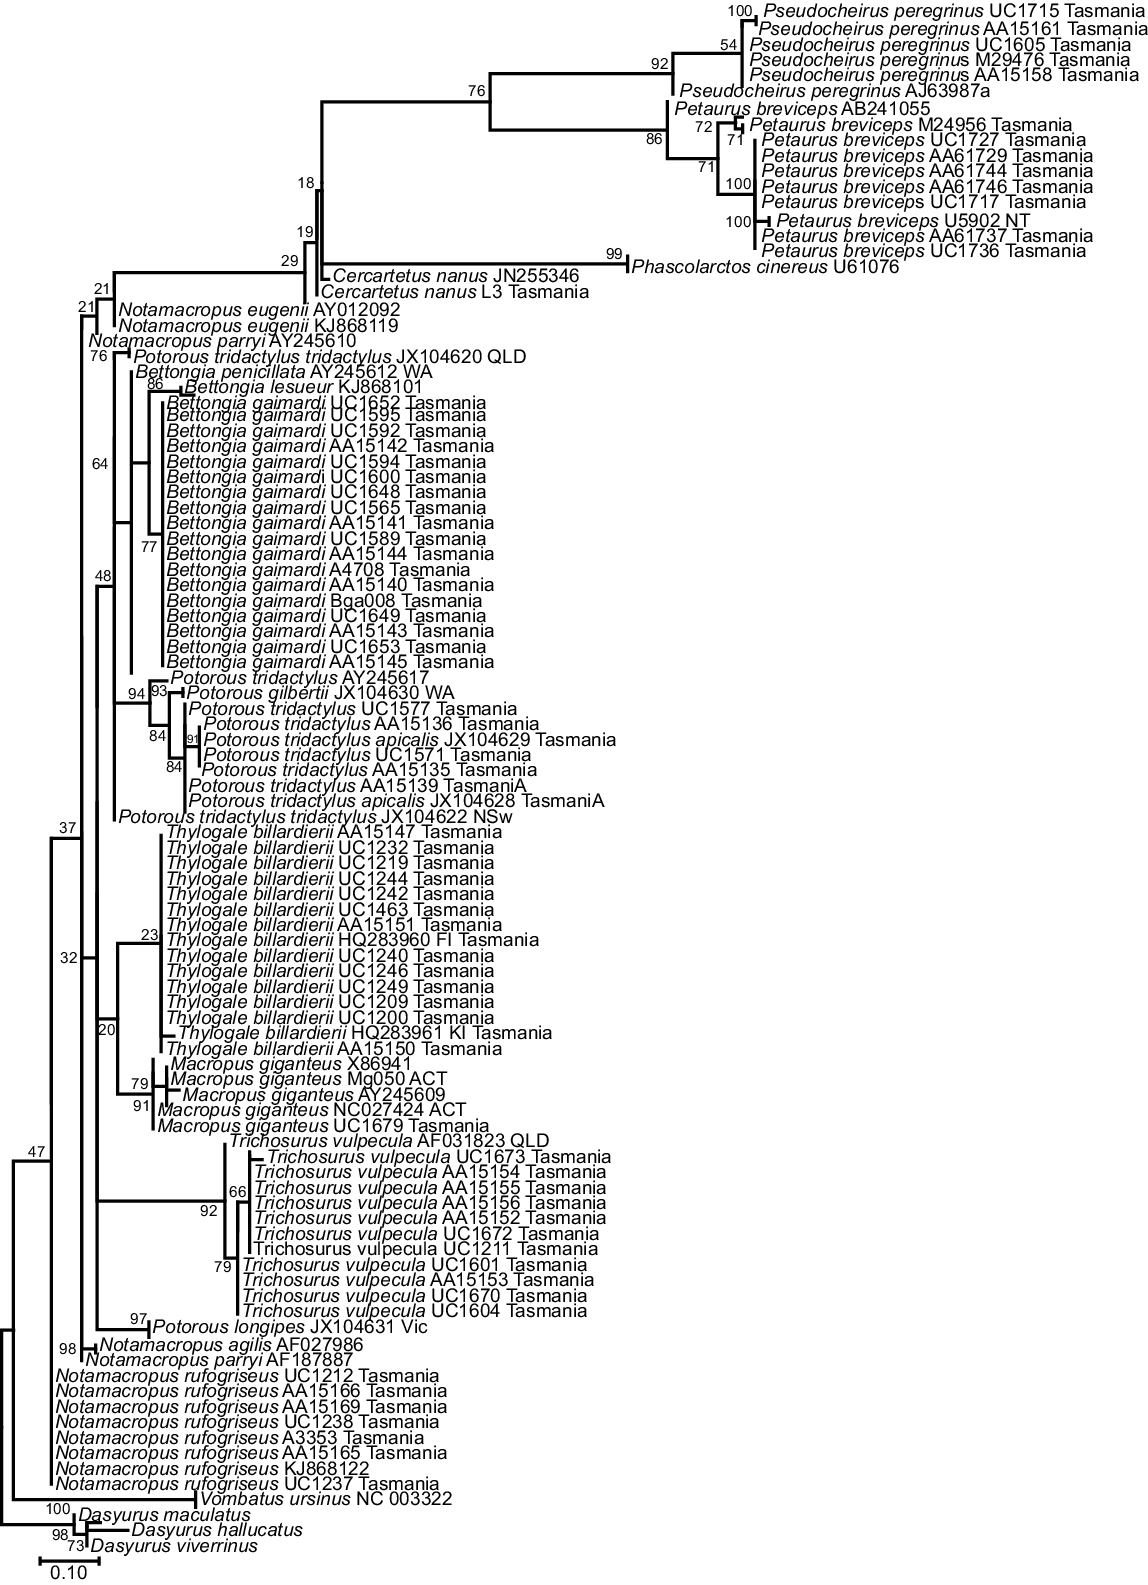
The phylogenetic tree for the 92 bp 16SMam amplicon demonstrated that all species included could be distinguished and grouped as expected according to their recognised taxonomic relationships (Fig. 3). All but two bootstrap values for differentiation within a genus were strongly supported (>90), with the exceptions being Notamacropus rufogriseus (50) and Macropus giganteus (49). All other bootstrap values between genera were well supported (>70), with the majority (seven) having very strong support (>90). Previous research identified two clades within Thylogale billardierii in Tasmania (Macqueen et al. 2010), and our results are consistent with this despite the much shorter sequence length used in this study. Published data at the 16S rRNA gene were limited for most extant species of Diprotodontia that have distributions covering both Tasmania and mainland Australia. This made it difficult to determine whether Tasmanian animals could be reliably distinguished from mainland Australian animals by using the 16SMam marker. In contrast to our results for the 16SMam amplicon, phylogenetic resolution was poor using the 12SV5 marker (Fig. 4). Specifically, the tree topology did not reflect recognised taxonomy and some bootstrap values were very low.
Maximum-likelihood tree for Tasmanian and some mainland Diprotodontia, with Dasyrus as an outgroup, at the mitochondrial 16S rRNA gene using the 16SMam marker. The evolutionary history was inferred by using the maximum- likelihood method based on the Tamura 3-parameter model. A discrete gamma distribution was used to model evolutionary rate differences among sites. The tree is drawn to scale, bootstraps shown at branch nodes.
Maximum-likelihood tree for Tasmanian and some mainland Diprotodontia, with Dasyurus as an outgroup, at the mitochondrial 12S rRNA gene using the 12SV5 marker. The evolutionary history was inferred by using the maximum-likelihood method based on the Kimura 2-parameter model. A discrete gamma distribution was used to model evolutionary rate differences among sites. The tree is drawn to scale, with bootstrap values at branch nodes.
Field testing of candidate metabarcoding markers
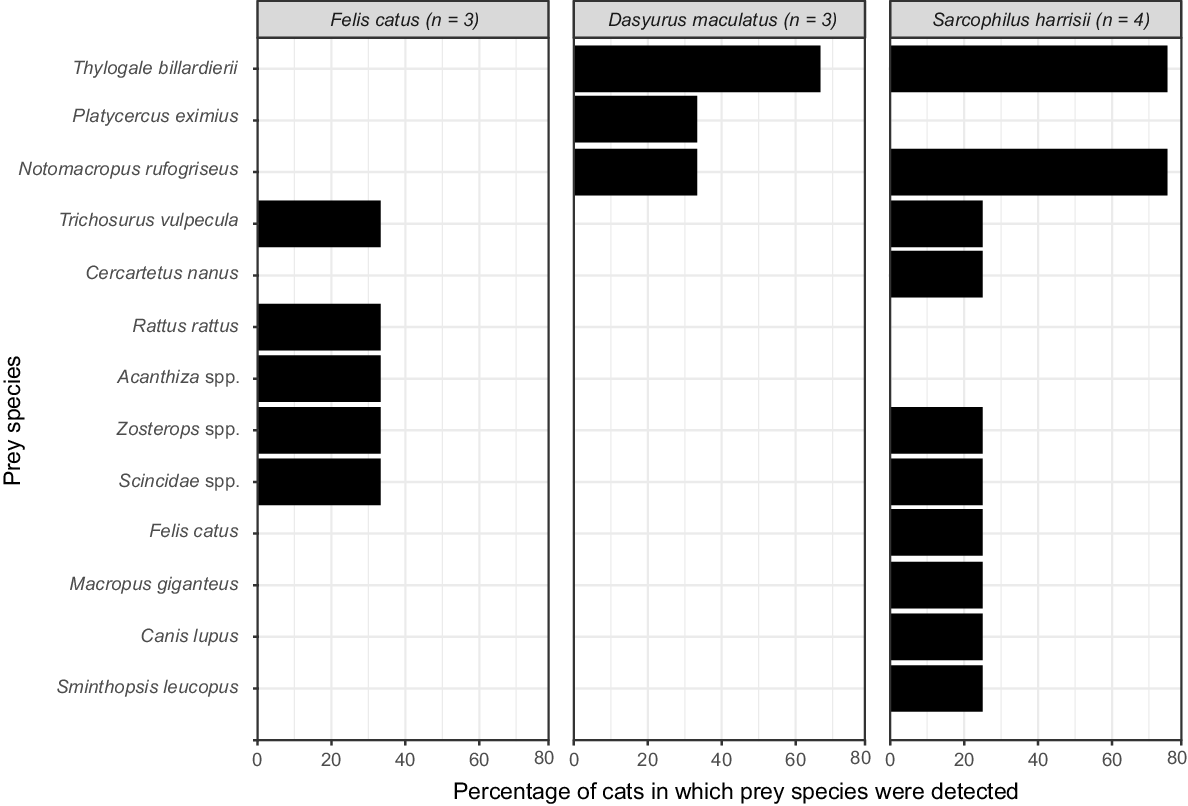
We applied our markers to 10 scats collected from a single survey unit (O101) from the north-east of Tasmania in 2008. Our metabarcoding analysis using the 12SV5 and 16SMam markers identified DNA from the following three predators among the scats (Fig. 5): Tasmanian devil (Sarcophilus harrisii, n = 4), feral cat (Felis catus, n = 3) and spotted-tail quoll (Dasyurus maculatus, n = 3). We also identified a total of 13 discrete prey taxa, including six species of marsupial, three species of bird, a lizard from the Scincidae family, and three common introduced animals of cats, dogs, and the black rat (Rattus rattus). However, we note that the methods used were unable to distinguish consumption of cats and dogs by devils from other potential interactions, for example, if a cat or dog were to overmark or otherwise come into direct contact with a devil scat. There were no obvious omissions of common taxa in our samples; however, further surveys would be required to determine the detectability of specific rare taxa. The resolution of prey species was high for Diprotodontia and Rodentia, but because our reference database was deficient in Tasmanian bird and reptile species, we were unable to assign all sequences to species level. We also note that spotted-tail quolls have been reported to eat large numbers of invertebrates at times (Fancourt et al. 2018). Our markers are unlikely to detect members of this class.
Discussion
DNA metabarcoding can provide an important tool for non-invasive ecological and wildlife management studies (Taberlet et al. 2012) through application to biodiversity monitoring, species identification, and diet analyses (Ji et al. 2013; Staats et al. 2016). The success of metabarcoding studies relies in part on the choice of appropriate genetic markers. In an ideal world, a single, standardised genetic marker (Hebert et al. 2003a) would be used to assign all unknown sequences to species level (Hebert et al. 2003b, 2004; Lambert et al. 2005; Dasmahapatra and Mallet 2006; Hajibabaei et al. 2007). However, it is now clear that the diagnostic power of COI varies too much among taxa to make that ideal possible (Deagle et al. 2014). Our results demonstrate that COI is not an ideal metabarcoding marker for marsupials. Instead, we have identified two alternative markers (12SV5 and 16SMam) that are suitable for use in DNA metabarcoding across all marsupial orders. Additionally, we note that the strengths and weaknesses of these two markers mean that they will work best in combination. Specifically, the 12SV5 marker exhibits a low risk of amplification failure but may not always provide sufficient resolution to assign unknown sequences to the species level, especially for the Potoroidae. Conversely, the 16SMam marker provides a higher level of resolution at species level than does 12SV5, but also introduces a higher risk of amplification bias because of a greater number of primer-site mismatches for some members of the Dasyuromorphia. Such amplification bias may reduce detectability of certain species.
With the increasing popularity of historic and environmental DNA analyses, there is a parallel need to develop comprehensive DNA-reference databases of high-quality and appropriate genetic markers for application to specific ecosystems (Keck et al. 2023). The challenges of species designation from eDNA samples are exacerbated by the often low quality of the samples, and the need to identify multiple species from samples of mixed origin (Taylor 1996; Taberlet et al. 2012). Consequently, genetic markers for DNA barcoding and metabarcoding must be selected carefully in the context of the specific needs of each particular study.
Whereas detailed localised sequence databases are lacking for marsupials, public DNA databases such as GenBank and BOLD are sufficient to provide an initial evaluation of appropriate markers for a given taxon. Here, we were able to use public databases to determine the likely amplification success of five primer sets across the different marsupial orders. On the basis of these analyses, we were able to exclude three candidate markers and focus further efforts on the two primer sets that seemed most broadly applicable to Australian mammals. However, as our study also illustrates, a locally derived and marker-specific reference database is critical for more thorough in silico evaluation of each marker and for reliable interpretation of metabarcoding results. We have identified two markers that show broad promise for analysis of degraded DNA in all marsupial groups, and we have demonstrated their capacity to distinguish among species from the Tasmanian Macropodidae with high confidence. We have also found that the prevalence of large and medium-sized mammal species in the scats of the Tasmanian devils and spotted-tail quolls are in alignment with expectations from previous diet studies of these members of the Dasyuridae (Jones and Barmuta 1998; Andersen et al. 2017; Fancourt et al. 2018), with scats from cats found to contain smaller prey items such as brushtail possums, rats, birds, and a skink. However, our local reference database was focused on the Diprotodontia and was not representative of other marsupial orders found in Tasmania, meaning that we are uncertain of the level of resolution that these markers may provide for other taxa. Even within Diprotodontia, we were unable to include sequences from wombat (Vombatus ursinus), eastern pygmy possum (Cercartetus nanus), little pygmy possum (Cercartetus lepidus), or several other mainland Australian species in our 16S database because we were unable to access appropriate reference samples.
Ideally, reference-DNA databases should be locally detailed, but also representative of the greatest geographic range possible for the taxa included (Porter and Hajibabaei 2018; Mugnai et al. 2023), so that unknown sequences can be identified with appropriate and measurable confidence. Fine-scale information about the distribution of sequence variants is important, because this provides greater confidence in the ability of a genetic marker to discriminate among closely related taxa (potentially even at the subspecies or population levels) by using lower genetic-distance thresholds. Moreover, other processes such as interspecific introgression and recent evolutionary mutations could be overlooked if inter- and intra-specific variation is not adequately captured in a reference database (Taberlet et al. 2012). Nevertheless, as the amount of available sequence information increases, data can be re-evaluated, and updated designations may be made for sequences previously collected.
Our phylogenetic evaluation illustrated the utility of the 12SV5 and 16SMam markers for discrimination among species within the order Diprotodontia, but also reinforced the point that phylogenetic analyses alone can be poor indicators of marker utility for species delimitation when marker lengths are very short (Collins and Cruickshank 2013). This highlights the problem with using tree-based methods alone to evaluate candidate markers for eDNA metabarcoding, particularly when using very short DNA sequences with an incomplete reference database (Collins and Cruickshank 2013). In these circumstances, using multiple approaches, especially genetic distance-based methods, is likely to be necessary to identify the most suitable markers for the specific taxa being studied (Collins and Cruickshank 2013). Our work also illustrated the feasibility and potential of eDNA surveys for species detection and for collection of data on marsupial taxa that may not be obtainable in any other way.
The current paucity of reference sequence information available for many taxa is likely to be limiting to the more general application of eDNA metabarcoding in Australia. Increasing the availability of reference data from marsupials, and the inclusion in public DNA databases of sequences from vouchered specimens with reliable metadata, must become a priority if marker evaluation and the quality and quantity of field-collected eDNA data are to be improved (Curry et al. 2018).
The Australian mammal fauna is rich in endemic marsupial species, many of which remain poorly understood because they are cryptic or are otherwise difficult to study. Many Australian marsupial species are also threatened and subject to conservation management (Archer et al. 2019; Ashman et al. 2019; Munro et al. 2019; Reside et al. 2019), compounding their study. DNA metabarcoding from environmental samples provides a fresh opportunity to detect and monitor these species using non-invasive methods. We have demonstrated, in principle, how this can be undertaken. The coordinated collection of predator scats, as previously undertaken in surveys to detect introduced species (Ramsey et al. 2018; McLennan et al. 2022), could be used to identify and map the distributions of not only marsupial predators, but many, if not all, of their prey species, and could also be applied to detect marsupial DNA from soil and water and other types of non-invasive and environmental samples.
Data availability
Reference DNA sequences generated in this study from known provenance samples are available from NCBI GenBank with accession numbers PP923470-PP923568 (12S rRNA) and PP923427-PP923469 (16S rRNA).
Declaration of funding
Project funding was provided to S. D. S. from the Invasive Animals CRC (1.L.21). C. D. C. was supported by an Australian Postgraduate Award and an Invasive Animals CRC postgraduate scholarship.
Acknowledgements
We thank Jonas Bylemans and Andrew O’Reilly Nugent for advice on data analysis and Matt Young, Sam Venables, and Llara Weaver for laboratory assistance. Samples were kindly contributed by Leo Joseph and Robert Palmer (Australian National Wildlife Collection, CSIRO), Belinda Bauer (Tasmanian Museum and Art Gallery), Tammy Gordon and David Maynard (Queen Victoria Museum and Art Gallery), Kathryn Medlock (Tasmanian Museum and Art Gallery), Gavin Dally (Museum and Art Gallery of the Northern Territory) and Elise Dewar (Department of Primary Industries, Parks, Water and Environment). This paper forms part of the PhD thesis of Catriona D. Campbell (2018).
References
Andersen GE, Johnson CN, Barmuta LA, Jones ME (2017) Dietary partitioning of Australia’s two marsupial hypercarnivores, the Tasmanian devil and the spotted-tailed quoll, across their shared distributional range. PLoS ONE 12, e0188529.
| Crossref | Google Scholar |
Applied Biosystems (2009) ‘DNA sequencing by capillary electrophoresis – chemistry guide.’ 2nd edn. (Springer) doi:10.1002/elps.200900218.DNA
Archer M, Bates H, Hand SJ, Evans T, Broome L, McAllan B, Geiser F, Jackson S, Myers T, Gillespie A, Palmer C, Hawke T, Horn AM (2019) The Burramys Project: a conservationist’s reach should exceed history’s grasp, or what is the fossil record for? Philosophical Transactions of the Royal Society B: Biological Sciences 374, 20190221.
| Crossref | Google Scholar | PubMed |
Ashman KR, Watchorn DJ, Whisson DA (2019) Prioritising research efforts for effective species conservation: a review of 145 years of koala research. Mammal Review 49, 189-200.
| Crossref | Google Scholar |
Avise JC (1986) Mitochondrial DNA and the evolutionary genetics of higher animals. Philosophical Transactions of the Royal Society B: Biological Sciences 312, 325-342.
| Crossref | Google Scholar |
Benson DA, Cavanaugh M, Clark K, Karsch-Mizrachi I, Lipman DJ, Ostell J, Sayers EW (2013) GenBank. Nucleic Acids Research 41, D36-D42.
| Crossref | Google Scholar | PubMed |
Berry O, Sarre SD (2007) Gel-free species identification using melt-curve analysis. Molecular Ecology Notes 7, 1-4.
| Crossref | Google Scholar |
Berry TE, Osterrieder SK, Murray DC, Coghlan ML, Richardson AJ, Grealy AK, Stat M, Bejder L, Bunce M (2017) DNA metabarcoding for diet analysis and biodiversity: a case study using the endangered Australian sea lion (Neophoca cinerea). Ecology and Evolution 7, 5435-5453.
| Crossref | Google Scholar |
Bolger AM, Lohse M, Usadel B (2014) Trimmomatic: a flexible trimmer for Illumina sequence data. Bioinformatics 30, 2114-2120.
| Crossref | Google Scholar | PubMed |
Boyer FF, Mercier CC, Bonin AA, Le Bras Y, Taberlet P, Coissac E (2016) OBITOOLS: a UNIX-inspired software package for DNA metabarcoding. Molecular Ecology Resources 16, 176-182.
| Crossref | Google Scholar | PubMed |
Brown SDJ, Collins RA, Boyer S, Lefort M-C, Malumbres-Olarte J, Vink CJ, Cruickshank RH (2012) Spider: an R package for the analysis of species identity and evolution, with particular reference to DNA barcoding. Molecular Ecology Resources 12, 562-565.
| Crossref | Google Scholar | PubMed |
Burk A, Springer MS (2000) Intergeneric relationships among macropodoidea (Metatheria:Diprotodontia) and the chronicle of kangaroo evolution. Journal of Mammalian Evolution 7, 213-237.
| Crossref | Google Scholar |
Cannon MV, Hester J, Shalkhauser A, Chan ER, Logue K, Small ST, Serre D (2016) In silico assessment of primers for eDNA studies using PrimerTree and application to characterize the biodiversity surrounding the Cuyahoga River. Scientific Reports 6, 22908.
| Crossref | Google Scholar | PubMed |
Coissac E, Riaz T, Puillandre N (2012) Bioinformatic challenges for DNA metabarcoding of plants and animals. Molecular Ecology 21, 1834-1847.
| Crossref | Google Scholar | PubMed |
Collins RA, Cruickshank RH (2013) The seven deadly sins of DNA barcoding. Molecular Ecology Resources 13, 969-975.
| Crossref | Google Scholar | PubMed |
Compson ZG, McClenaghan B, Singer GAC, Fahner NA, Hajibabaei M (2020) Metabarcoding from microbes to mammals: comprehensive bioassessment on a global scale. Frontiers in Ecology and Evolution 8, 581835.
| Crossref | Google Scholar |
Curry CJ, Gibson JF, Shokralla S, Hajibabaei M, Baird DJ (2018) Identifying North American freshwater invertebrates using DNA barcodes: are existing COI sequence libraries fit for purpose? Freshwater Science 37, 178-189.
| Crossref | Google Scholar |
Dasmahapatra KK, Mallet J (2006) Taxonomy: DNA barcodes: recent successes and future prospects. Heredity 97, 254-255.
| Crossref | Google Scholar | PubMed |
Deagle BE, Tollit DJ, Jarman SN, Hindell MA, Trites AW, Gales NJ (2005) Molecular scatology as a tool to study diet: analysis of prey DNA in scats from captive Steller sea lions. Molecular Ecology 14, 1831-1842.
| Crossref | Google Scholar | PubMed |
Deagle BE, Jarman SN, Coissac E, Pompanon F, Taberlet P (2014) DNA metabarcoding and the cytochrome c oxidase subunit I marker: not a perfect match. Biology Letters 10, 20140562.
| Crossref | Google Scholar | PubMed |
Edgar RC (2004) MUSCLE: multiple sequence alignment with high accuracy and high throughput. Nucleic Acids Research 32, 1792-1797.
| Crossref | Google Scholar | PubMed |
Ekrem T, Willassen E, Stur E (2007) A comprehensive DNA sequence library is essential for identification with DNA barcodes. Molecular Phylogenetics and Evolution 43, 530-542.
| Crossref | Google Scholar | PubMed |
Elbrecht V, Leese F (2016) PrimerMiner: an R package for development and in silico validation of DNA metabarcoding primers. Methods in Ecology and Evolution 8, 622-626.
| Crossref | Google Scholar |
Fancourt BA, Hawkins CE, Nicol SC (2018) Mechanisms of climate-change-induced species decline: spatial, temporal and long-term variation in the diet of an endangered marsupial carnivore, the eastern quoll. Wildlife Research 45, 737-750.
| Crossref | Google Scholar |
Ficetola GF, Taberlet P (2023) Towards exhaustive community ecology via DNA metabarcoding. Molecular Ecology 32, 6320-6329.
| Crossref | Google Scholar |
Frankham GJ, Handasyde KA, Eldridge MDB (2012) Novel insights into the phylogenetic relationships of the endangered marsupial genus Potorous. Molecular Phylogenetics and Evolution 64, 592-602.
| Crossref | Google Scholar | PubMed |
Goldberg CS, Strickler KM, Fremier AK (2018) Degradation and dispersion limit environmental DNA detection of rare amphibians in wetlands: increasing efficacy of sampling designs. Science of The Total Environment 633, 695-703.
| Crossref | Google Scholar | PubMed |
Hajibabaei M, Singer GAC, Hebert PDN, Hickey DA (2007) DNA barcoding: how it complements taxonomy, molecular phylogenetics and population genetics. Trends in Genetics 23, 167-172.
| Crossref | Google Scholar | PubMed |
Hebert PDN, Ratnasingham S, de Waard JR (2003a) Barcoding animal life: cytochrome c oxidase subunit 1 divergences among closely related species. Proceedings of the Royal Society of London. Series B: Biological Sciences 270, S96-S99.
| Crossref | Google Scholar |
Hebert PDN, Cywinska A, Ball SL, deWaard JR (2003b) Biological identifications through DNA barcodes. Proceedings of the Royal Society of London. Series B: Biological Sciences 270, 313-321.
| Crossref | Google Scholar |
Hebert PDN, Penton EH, Burns JM, Janzen DH, Hallwachs W (2004) Ten species in one: DNA barcoding reveals cryptic species in the neotropical skipper butterfly Astraptes fulgerator. Proceedings of the National Academy of Sciences of the United States of America 101, 14812-14817.
| Crossref | Google Scholar |
Ji Y, Ashton L, Pedley SM, Edwards DP, Tang Y, Nakamura A, Kitching R, Dolman PM, Woodcock P, Edwards FA, Larsen TH, Hsu WW, Benedick S, Hamer KC, Wilcove DS, Bruce C, Wang X, Levi T, Lott M, Emerson BC, Yu DW (2013) Reliable, verifiable and efficient monitoring of biodiversity via metabarcoding. Ecology Letters 16, 1245-1257.
| Crossref | Google Scholar | PubMed |
Jones ME, Barmuta LA (1998) Diet overlap and relative abundance of sympatric dasyurid carnivores: a hypothesis of competition. Journal of Animal Ecology 67, 410-421.
| Crossref | Google Scholar |
Katoh K, Misawa K, Kuma K, Miyata T (2002) MAFFT: a novel method for rapid multiple sequence alignment based on fast Fourier transform. Nucleic Acids Research 30, 3059-3066.
| Crossref | Google Scholar | PubMed |
Keck F, Blackman RC, Bossart R, Brantschen J, Couton M, Hurlemann S, Kirschner D, Locher N, Zhang H, Altermatt F (2022) Meta-analysis shows both congruence and complementarity of DNA and eDNA metabarcoding to traditional methods for biological community assessment. Molecular Ecology 31, 1820-1835.
| Crossref | Google Scholar | PubMed |
Keck F, Couton M, Altermatt F (2023) Navigating the seven challenges of taxonomic reference databases in metabarcoding analyses. Molecular Ecology Resources 23, 742-755.
| Crossref | Google Scholar | PubMed |
Kimura M (1980) A simple method for estimating evolutionary rates of base substitutions through comparative studies of nucleotide sequences. Journal of Molecular Evolution 16, 111-120.
| Crossref | Google Scholar | PubMed |
Kitano T, Umetsu K, Tian W, Osawa M (2007) Two universal primer sets for species identification among vertebrates. International Journal of Legal Medicine 121, 423-427.
| Crossref | Google Scholar | PubMed |
Kumar S, Stecher G, Tamura K (2016) MEGA7: molecular evolutionary genetics analysis version 7.0 for bigger datasets. Molecular Biology and Evolution 33, 1870-1874.
| Crossref | Google Scholar |
Lambert DM, Baker A, Huynen L, Haddrath O, Hebert PDN, Millar CD (2005) Is a large-scale DNA-based inventory of ancient life possible? Journal of Heredity 96, 279-284.
| Crossref | Google Scholar | PubMed |
Lindner MF, Gonçalves LT, Bianchi FM, Ferrari A, Cavalleri A (2023) Tiny insects, big troubles: a review of BOLD’s COI database for Thysanoptera (Insecta). Bulletin of Entomological Research 113, 1-13.
| Crossref | Google Scholar |
MacDonald AJ, Sarre SD (2015) Species assignment from trace DNA sequences: an in silico assessment of the test used to survey for foxes in Tasmania. Journal of Applied Ecology 52, 1649-1655.
| Crossref | Google Scholar |
MacDonald AJ, Sarre SD (2017) A framework for developing and validating taxon-specific primers for specimen identification from environmental DNA. Molecular Ecology Resources 17, 708-720.
| Crossref | Google Scholar | PubMed |
MacDonald AJ, Sarre SD, FitzSimmons NN, Aitken N (2011) Determining microsatellite genotyping reliability and mutation detection ability: an approach using small-pool PCR from sperm DNA. Molecular Genetics and Genomics 285, 1-18.
| Crossref | Google Scholar | PubMed |
Macqueen P, Seddon JM, Austin JJ, Hamilton S, Goldizen AW (2010) Phylogenetics of the pademelons (Macropodidae: Thylogale) and historical biogeography of the Australo-Papuan region. Molecular Phylogenetics and Evolution 57, 1134-1148.
| Crossref | Google Scholar | PubMed |
May-Collado LJ, Kilpatrick CW, Agnarsson I (2015) Mammals from ‘down under’: a multi-gene species-level phylogeny of marsupial mammals (Mammalia, Metatheria). PeerJ 3, e805.
| Crossref | Google Scholar | PubMed |
McInnes JC, Alderman R, Deagle BE, Lea M-A, Raymond B, Jarman SN (2017) Optimised scat collection protocols for dietary DNA metabarcoding in vertebrates. Methods in Ecology and Evolution 8, 192-202.
| Crossref | Google Scholar |
McLennan EA, Wise P, Lee AV, Grueber CE, Belov K, Hogg CJ (2022) DNA metabarcoding reveals a broad dietary range for Tasmanian devils introduced to a naive ecosystem. Ecology and Evolution 12, e8936.
| Crossref | Google Scholar | PubMed |
Mena JL, Yagui H, Tejeda V, Bonifaz E, Bellemain E, Valentini A, Tobler MW, Sánchez-Vendizú P, Lyet A (2021) Environmental DNA metabarcoding as a useful tool for evaluating terrestrial mammal diversity in tropical forests. Ecological Applications 31, e02335.
| Crossref | Google Scholar | PubMed |
Meredith RW, Westerman M, Springer MS (2009) A phylogeny of Diprotodontia (Marsupialia) based on sequences for five nuclear genes. Molecular Phylogenetics and Evolution 51, 554-571.
| Crossref | Google Scholar | PubMed |
Meusnier I, Singer GAC, Landry J-F, Hickey DA, Hebert PDN, Hajibabaei M (2008) A universal DNA mini-barcode for biodiversity analysis. BMC Genomics 9, 214.
| Crossref | Google Scholar | PubMed |
Mitchell KJ, Pratt RC, Watson LN, Gibb GC, Llamas B, Kasper M, Edson J, Hopwood B, Male D, Armstrong KN, Meyer M, Hofreiter M, Austin J, Donnellan SC, Lee MSY, Phillips MJ, Cooper A (2014) Molecular phylogeny, biogeography, and habitat preference evolution of marsupials. Molecular Biology and Evolution 31, 2322-2330.
| Crossref | Google Scholar | PubMed |
Modave E, MacDonald AJ, Sarre SD (2017) A single mini-barcode test to screen for Australian mammalian predators from environmental samples. GigaScience 6, 1-13.
| Crossref | Google Scholar | PubMed |
Mugnai F, Costantini F, Chenuil A, Leduc M, Gutiérrez Ortega JM, Meglécz E (2023) Be positive: customized reference databases and new, local barcodes balance false taxonomic assignments in metabarcoding studies. PeerJ 7, e14616.
| Crossref | Google Scholar | PubMed |
Munro NT, McIntyre S, Macdonald B, Cunningham SA, Gordon IJ, Cunningham RB, Manning AD (2019) Returning a lost process by reintroducing a locally extinct digging marsupial. PeerJ 2019, 1-24.
| Crossref | Google Scholar |
Murray DC, Haile J, Dortch J, White NE, Haouchar D, Bellgard MI, Allcock RJ, Prideaux GJ, Bunce M (2013) Scrapheap challenge: a novel bulk-bone metabarcoding method to investigate ancient DNA in faunal assemblages. Scientific Reports 3, 3371.
| Crossref | Google Scholar |
Osborne MJ, Christidis L, Norman JA (2002) Molecular phylogenetics of the Diprotodontia (kangaroos, wombats, koala, possums, and allies). Molecular Phylogenetics and Evolution 25, 219-228.
| Crossref | Google Scholar |
Pääbo S, Poinar H, Serre D, Jaenicke-Després V, Hebler J, Rohland N, Kuch M, Krause J, Vigilant L, Hofreiter M (2004) Genetic analyses from ancient DNA. Annual Review of Genetics 38, 645-679.
| Crossref | Google Scholar | PubMed |
Pompanon F, Deagle BE, Symondson WOC, Brown DS, Jarman SN, Taberlet P (2012) Who is eating what: diet assessment using next generation sequencing. Molecular Ecology 21, 1931-1950.
| Crossref | Google Scholar | PubMed |
Porter TM, Hajibabaei M (2018) Scaling up: a guide to high-throughput genomic approaches for biodiversity analysis. Molecular Ecology 27 313-338.
| Crossref | Google Scholar |
Ramsey DSL, MacDonald AJ, Quasim S, Barclay C, Sarre SD (2015) An examination of the accuracy of a sequential PCR and sequencing test used to detect the incursion of an invasive species: the case of the red fox in Tasmania. Journal of Applied Ecology 52, 562-570.
| Crossref | Google Scholar |
Ramsey DSL, Barclay C, Campbell CD, Dewar E, MacDonald AJ, Modave E, Quasim S, Sarre SD (2018) Detecting rare carnivores using scats: Implications for monitoring a fox incursion into Tasmania. Ecology and Evolution 8, 732-743.
| Crossref | Google Scholar | PubMed |
Ratnasingham S, Hebert PDN (2007) BOLD: the barcode of life data system (http://www.barcodinglife.org). Molecular Ecology Notes 7, 355-364.
| Crossref | Google Scholar | PubMed |
Reside AE, Briscoe NJ, Dickman CR, Greenville AC, Hradsky BA, Kark S, Kearney MR, Kutt AS, Nimmo DG, Pavey CR, Read JL, Ritchie EG, Roshier D, Skroblin A, Stone Z, West M, Fisher DO (2019) Persistence through tough times: fixed and shifting refuges in threatened species conservation. Biodiversity and Conservation 28, 1303-1330.
| Crossref | Google Scholar |
Riaz T, Shehzad W, Viari A, Pompanon F, Taberlet P, Coissac E (2011) EcoPrimers: inference of new DNA barcode markers from whole genome sequence analysis. Nucleic Acids Research 39, e145.
| Crossref | Google Scholar | PubMed |
Sarre SD, MacDonald AJ, Barclay C, Saunders GR, Ramsey DSL (2013) Foxes are now widespread in Tasmania: DNA detection defines the distribution of this rare but invasive carnivore. Journal of Applied Ecology 50, 459-468.
| Crossref | Google Scholar |
Schnell IB, Bohmann K, Gilbert MTP (2015) Tag jumps illuminated – reducing sequence-to-sample misidentifications in metabarcoding studies. Molecular Ecology Resources 15, 1289-1303.
| Crossref | Google Scholar |
Seymour M, Durance I, Cosby BJ, Ransom-Jones E, Deiner K, Ormerod SJ, Colbourne JK, Wilgar G, Carvalho GR, de Bruyn M, Edwards F, Emmett BA, Bik HM, Creer S (2018) Acidity promotes degradation of multi-species environmental DNA in lotic mesocosms. Communications Biology 1, 4.
| Crossref | Google Scholar |
Springer MS, Westerman M, Kirsch JAW (1994) Relationships among orders and families of marsupials based on 12S ribosomal DNA sequences and the timing of the marsupial radiation. Journal of Mammalian Evolution 2, 85-115.
| Crossref | Google Scholar |
Springer MS, Hollar LJ, Burk A (1995) Compensatory substitutions and the evolution of the mitochondrial 12S rRNA gene in mammals. Molecular Biology and Evolution 12, 1138-1150.
| Google Scholar |
Staats M, Arulandhu AJ, Gravendeel B, Holst-Jensen A, Scholtens I, Peelen T, Prins TW, Kok E (2016) Advances in DNA metabarcoding for food and wildlife forensic species identification. Analytical and Bioanalytical Chemistry 408, 4615-4630.
| Crossref | Google Scholar | PubMed |
Taberlet PP, Coissac E, Pompanon F, Brochmann C, Willerslev E (2012) Towards next-generation biodiversity assessment using DNA metabarcoding. Molecular Ecology 21, 2045-2050.
| Crossref | Google Scholar | PubMed |
Tamura K, Nei M (1993) Estimation of the number of nucleotide substitutions in the control region of mitochondrial DNA in humans and chimpanzees. Molecular Biology and Evolution 10, 512-526.
| Crossref | Google Scholar | PubMed |
Taylor PG (1996) Reproducibility of ancient DNA sequences from extinct Pleistocene fauna. Molecular Biology and Evolution 13, 283-285.
| Crossref | Google Scholar |
Westerman M, Burk A, Amrine-Madsen HM, Prideaux GJ, Case JA, Springer MS (2002) Molecular evidence for the last survivor of an ancient kangaroo lineage. Journal of Mammalian Evolution 9, 209-223.
| Google Scholar |
Westerman M, Loke S, Springer MS (2004) Molecular phylogenetic relationships of two extinct potoroid marsupials, Potorous platyops and Caloprymnus campestris (Potoroinae: Marsupialia). Molecular Phylogenetics and Evolution 31, 476-485.
| Crossref | Google Scholar | PubMed |
Westerman M, Krajewski C, Kear BP, Meehan L, Meredith RW, Emerling CA, Springer MS (2016) Phylogenetic relationships of dasyuromorphian marsupials revisited. Zoological Journal of the Linnean Society 176, 686-701.
| Crossref | Google Scholar |
Wilkes Walburn J, Rourke ML, Furlan E, DiBattista JD, Broadhurst MK, Fowler AM, Hughes JM, Fielder S (2022) Robust environmental DNA assay development and validation: a case study with two vulnerable Australian fish. Aquatic Conservation: Marine and Freshwater Ecosystems 32, 1225-1231.
| Crossref | Google Scholar |
Yamamoto S, Masuda R, Sato Y, Sado T, Araki H, Kondoh M, Minamoto T, Miya M (2017) Environmental DNA metabarcoding reveals local fish communities in a species-rich coastal sea. Scientific Reports 7, 40368.
| Crossref | Google Scholar | PubMed |
Yang L, Tan Z, Wang D, Xue L, Guan M-X, Huang T, Li R (2014) Species identification through mitochondrial rRNA genetic analysis. Scientific Reports 4, 4089.
| Crossref | Google Scholar | PubMed |
Zeale MRK, Butlin RK, Barker GLA, Lees DC, Jones G (2011) Taxon-specific PCR for DNA barcoding arthropod prey in bat faeces. Molecular Ecology Resources 11, 236-244.
| Crossref | Google Scholar | PubMed |
Zwickl DJ (2006) Genetic algorithm approaches for the phylogenetic analysis of large biological sequence datasets under the maximum likelihood criterion. PhD dissertation, University of Texas, USA. Available at http://www.zo.utexas.edu/faculty/antisense/garli/Garli.html