

Predicting cassowary–vehicle collision in the Wet Tropics of Australia
Bruce L. Webber A B * , Matt Bradford C D , Noboru Ota A and David Westcott C
A
B
C
D Present address:
Abstract
Roads act as significant disruptors to wildlife movement through landscapes, even in relatively undisturbed areas. Large terrestrial vertebrates often choose to cross roads, which brings risk of injury or mortality from vehicle collision. In the Wet Tropics bioregion in Queensland, Australia, the range of the southern cassowary (Casuarius casuarius) spans a diversity of habitats and intensity of road network development. There has been a large increase in the human population within cassowary habitat in recent decades and at local scales there remains concern over increasing mortality caused by vehicle collision.
To inform management decisions on where is the best to direct collision mitigation resources based on identifying environmental factors that correlate with higher collision risk.
We collated 28 years of data on cassowary–vehicle collisions from across the bioregion and sought to identify ecological, physical and anthropogenic correlates of collision at both landscape- and location-specific scales.
We identified a major hotspot of reported cassowary–vehicle collisions in a large area of coastal lowland between Innisfail and Mission Beach. At a landscape scale, vehicle collisions increased significantly when the proportion of cassowary core habitat in the landscape was >50% and as the density of major roads increased. To a lesser extent, collisions increased when minor road density exceeded 400 m/km2. At a location-specific scale, vehicle collisions are more likely to occur on straight sections of major roads that have high canopy cover on both sides of the road and were less likely to occur on roads passing through land use types with low canopy cover.
Our findings highlight the significant challenges faced in effectively addressing the cassowary–vehicle collision problem in the Wet Tropics bioregion. Where cassowary habitat and roads intersect, cassowary mortality will occur.
Construction of new roads within rainforest should be avoided where possible and over- or under-passes should be constructed on new and existing major roads that intersect cassowary habitat and where location-specific correlates of cassowary collision exist. In addition, further collision mitigation measures such as traffic slowing should be targeted with these results in mind.
Keywords: cassowary, habitat fragmentation, mortality, road density, road risk, threat mitigation, vehicle speed, visibility, wildlife-vehicle collision.
Introduction
Roads can be significant disruptors to free-roaming wildlife movement through landscapes (Andrews 1990; Laurance et al. 2014; Barrientos et al. 2021). Roads have a direct impact on wildlife populations through injury or mortality from vehicle collision, as well as reduction in habitat area, and restriction of movement to certain areas of a population’s range (Taylor and Goldingay 2010; Lesbarrères and Fahrig 2012; Pinto et al. 2020). Roads can also have indirect impacts resulting from reduced gene flow, impaired access to resources, and increased exposure to threats from introduced species, all of which can influence reproductive fitness and population resilience (Benítez-López et al. 2010; Barrientos et al. 2021). In turn, these impacts of roads on wildlife can have flow-on effects at the community level, through disruption of ecosystem processes such as seed dispersal, pollination and predator–prey dynamics (May and Norton 1996; Lambert et al. 2014).
In response to these recognised impacts, conservation managers are paying more attention to the impact of new road design and placement on wildlife movements, often incorporating structures to maintain connectivity and facilitate wildlife movements (Lesbarrères and Fahrig 2012). However, in regions where roads have been a feature of the landscape for many decades, retro-fitting mitigation strategies to existing roads can be more challenging (Denneboom et al. 2021). These solutions involve both physical modifications to the landscape and behavioural change for human road users (Hobday and Minstrell 2008; Taylor and Goldingay 2010). The effectiveness of such strategies appears to be highly variable and context specific (Pagany 2020; Soanes et al. 2024).
In the Wet Tropics bioregion of Queensland, Australia, the southern cassowary (Casuarius casuarius) is one such threatened species for which road impacts are a major cause of conservation concern. Cassowaries are large flightless birds that are active throughout the day, with peaks of activity in the early morning and late afternoon (Westcott et al. 2005). They are considered a keystone species, playing a significant role in rainforest resilience due to their role as the primary long distance dispersal agent of large-seeded fruits (Crome and Moore 1990; Bradford and Westcott 2010). Cassowaries maintain home ranges that vary in size and shape both seasonally and year to year – the size and shape depending on sex, patterns of food abundance and environmental conditions (Campbell et al. 2012). They may make repeated visits to a single rainforest tree during a given fruiting season. Cassowaries are also known to frequently visit orchards and fruit farms, and can become habituated to visiting and feeding in home gardens and tourist destinations (Kofron and Chapman 2006). Even in fragmented rainforest landscapes, cassowaries are important dispersers of native rainforest plants (Campbell et al. 2023).
Southern cassowaries have been facing mounting environmental pressures associated with a large increase in human population within cassowary habitat in recent decades. Population monitoring for cassowaries in the Wet Tropics region commenced in the 1980’s and since then, conservation efforts have consistently highlighted vehicle collision as the leading cause of death (Crome and Moore 1990; Westcott et al. 2014). The Queensland Department of Environment and Science’s (as of November 2024 it became known as the Department of the Environment, Tourism, Science and Innovation) unpublished database of cassowary–vehicle collisions recorded 215 verifiable incidents between 1991 and 2018, leading to 185 confirmed cassowary deaths. Presumably, additional collisions and deaths have gone unreported, making this a conservative estimate.
Long running public concern has led to a number of studies focused on potential mitigation strategies (e.g. Goosem et al. 2011). Measures such as signage, traffic slowing, education, speed limits, and road markings have been trialled or implemented in areas of particular concern. Despite these efforts, there has been no discernible reduction in the rate of reported vehicle collision. In fact, between the years 2016 to 2018 it was observed the highest number of annual reported collisions since recording commenced. This increase is at least partially a consequence of improved reporting through a dedicated cassowary hotline (which began in 2015–2016). Even so, these numbers suggest that vehicle collisions remain a conservation concern. If we assume that traffic volume will increase in the cassowary’s range with the region’s projected population growth (Cairns Regional Council 2015), then we might expect that cassowary–vehicle collisions will also increase unless successful mitigation measures are implemented.
A first step in addressing cassowary–vehicle collisions is to understand where incidents occur and the environmental and road design features that may influence the likelihood of such events. To date, investigations of cassowary–vehicle collision have focused on the area between Innisfail and Mission Beach in Queensland, where cassowary densities are moderate to high (Westcott et al. 2014) and where interaction with humans is most frequent. Early studies showed that cassowaries use specific and regular road crossings that are related to core habitat and foraging resources (Bentrupperbaumer 1992). Due to the number of roads passing through cassowary’s core habitat, most individuals have at least one road crossing within their home range in the Mission Beach area (Moore and Moore 1998; Moore 1999).
In the first examination of the Queensland Department of Environment and Science database of cassowary–vehicle collisions, Goosem et al. (2011) identified several zones of high vehicle collision mortality. In a more detailed examination of an updated version of the database, Dwyer et al. (2016) identified clusters of collisions that were associated with higher densities of public cassowary sightings and showed that the likelihood of a collision is associated with the presence of rainforest vegetation, while it was weakly related to road features. Radiotracking of a small sample of individuals by Campbell et al. (2012) showed that differences in home range size and habitat usage between male and female cassowaries have the potential to influence the probability of vehicle collision.
While past studies from the Wet Tropics provide clear evidence that cassowary behaviour and ecology influence the likelihood of vehicle collision, they are based on small areas and do not investigate the influence of a broad range of relevant ecological, physical and anthropogenic variables on the likelihood of collisions. This narrow focus limits the possibility of identifying collision hotspots at a broad scale, and in turn the determination of specific features at a location that increase the probability of vehicle collision.
In this study we use open data (i.e. freely available to use with attribution) on cassowaries to investigate the direct impacts of vehicle collision on cassowary populations for road networks across the Wet Tropics bioregion. We examined road type, traffic and land use information to investigate patterns of cassowary–vehicle collisions at two spatial scales across the southern cassowary’s range across the Wet Tropics bioregion over nearly 30 years. First, at a landscape scale we identified current hotspots for cassowary–vehicle collisions, and then examined ecological, physical and anthropogenic variables that could influence it. Second, at cassowary collision locations and at control (i.e. non-collision) locations, we investigated the ecological, physical and anthropogenic (including road design) variables associated with cassowary collision. Considered together, these insights can be used to inform management decisions on where cassowary–vehicle collisions are most likely to occur across the Wet Tropics, and how to identify mitigation measures that are likely to be most effective at reducing cassowary–vehicle interactions at specific locations.
Methods
Cassowary–vehicle collision data
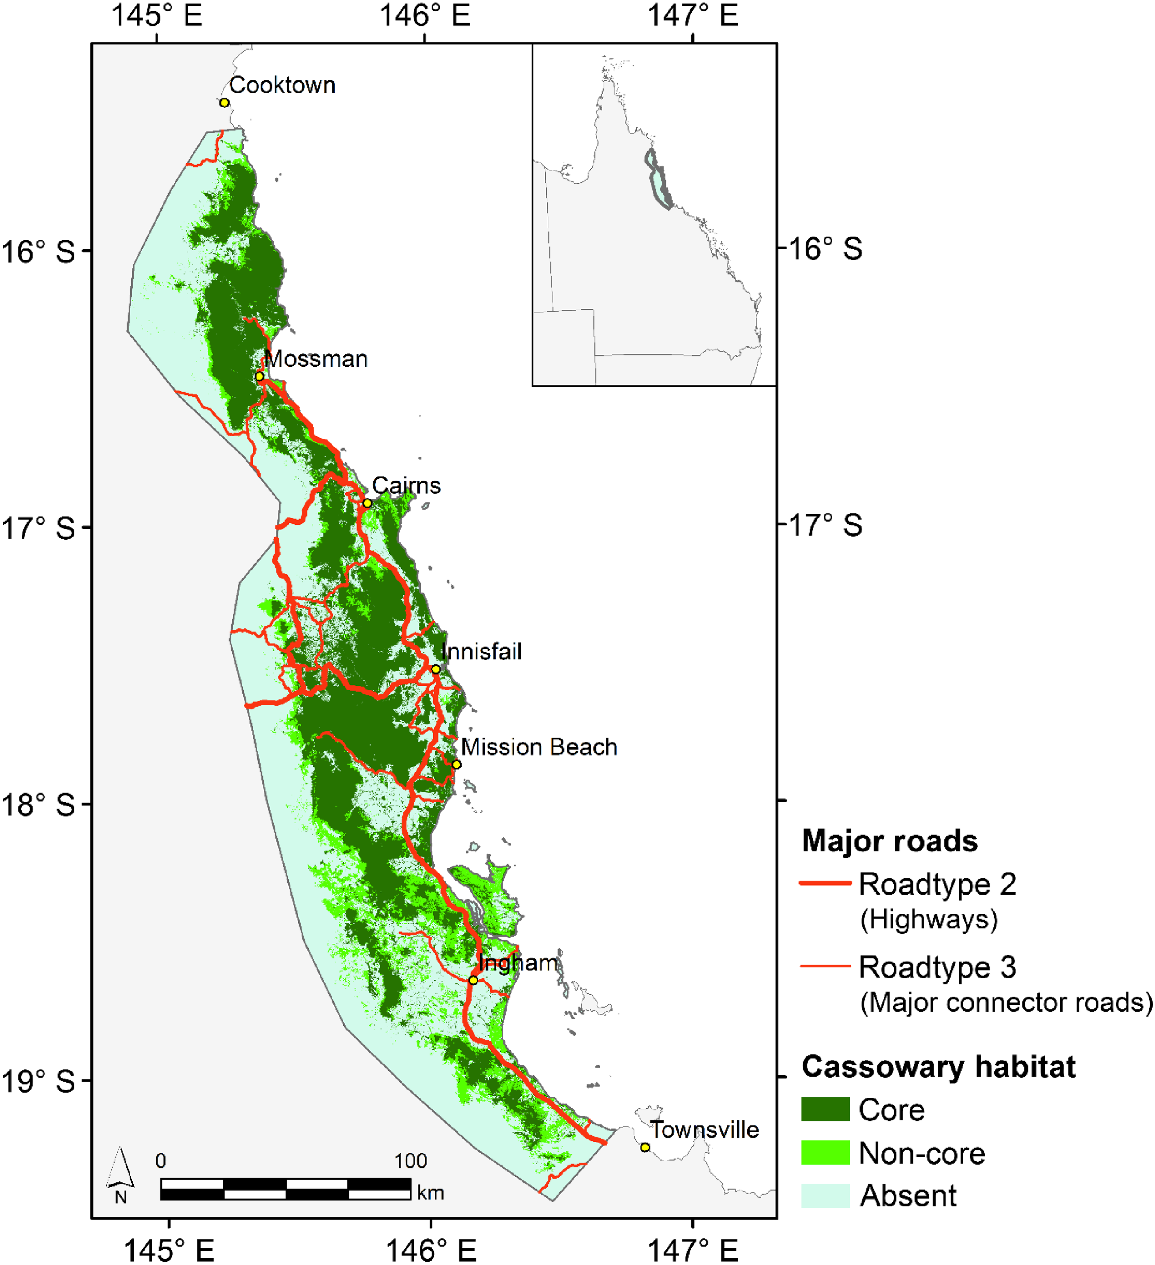
We assembled a databased of cassowary–vehicle collisions (both fatal and non-fatal) from across the Wet Tropics bioregion in Queensland, Australia (Fig. 1). The data assessed for this work covered the years from 1991 through to 2018. The data came from three primary sources: (1) the Queensland Department of Environment and Science (QDES) cassowary strike database, (2) data collected by C4 (Community for Coastal and Cassowary Conservation) based on observations from members of the public, and (3) unpublished data provided by Hamish Campbell (Charles Darwin University; last update Aug 2018). Collated data underwent quality control for inclusion in subsequent analyses. A minimum threshold for record inclusion required a date of observation and a reliable location that could be localised to within 50 m by a georeference (or occasionally a detailed locality description). Duplicate records of the same event were checked for and removed. Most records contained additional information including animal age, sex, cause of injury and if the animal was deceased. Time of collision was only available for a minority of records (n = 32), so was not pursued further in the analyses. Data quality control identified 215 records (QDES: 143, C4: 46, Campbell: 26) from between 12 March 1992 and 19 December 2018 that were considered suitable for inclusion. Further record exclusions were required depending on the specific analysis (see below).
The Wet Tropics bioregion of Queensland, Australia, showing remnant habitat of the southern cassowary (Queensland Department of Environment and Science 2018) and major roads (Roadtypes 2 and 3; Queensland Department of Transport and Main Roads).
Landscape-scale correlates of vehicle collision
We compiled a list of open-source data on ecological, physical and anthropogenic predictor variables that have the potential to either positively or negatively influence cassowary–vehicle collision at the landscape scale (Table 1). To inform this selection we considered previously published work on animal–vehicle collisions within the Wet Tropics bioregion (e.g. Dwyer et al. 2016;Goosem et al. 2011) and the authors’ expert knowledge. We conducted quality control on the Queensland Department of Environment and Science cassowary sightings database (Table 1), improving the accuracy of georeference data for 43 of the 545 records based on associated written information and local knowledge.
| Variable | Measure | Source | Description and justification | |
|---|---|---|---|---|
| Recorded cassowary sightings | Count per 5 km × 5 km grid cell | QLD Department of Environment and Science cassowary sighting database | Latitude and longitude of 545 recorded cassowary sightings from across the Wet Tropics Bioregion between 1991 and 2018 | |
| *Cassowary density | Birds/km2 | Westcott et al. (2014) | Mean number of cassowaries per km2 applied to major river catchments in the Wet Tropics Bioregion | |
| *Core habitat | Proportion in each 5 km × 5 km grid cell | Queensland Department of Environment and Science (2018) A | All Regional Ecosystems (Queensland Government 2019) considered core, or primary habitat of the cassowary. This reflects the habitat specificity of the cassowary | |
| *Non-core habitat | Proportion in each 5 km × 5 km grid cell | Queensland Department of Environment and Science (2018) A | All Regional Ecosystems (Queensland Government 2019) considered non-core, or secondary habitat of the cassowary, e.g. moist woodland, mangrove. The cassowary may use these communities to occasionally forage or to move between core habitats | |
| Absent habitat | Proportion | Queensland Department of Environment and Science (2018) A | All Regional Ecosystems (Queensland Government 2019) and non-remnant areas considered not to be cassowary habitat (e.g. open woodland, cleared land). The cassowary rarely uses these communities | |
| *Linear cassowary corridors | Count of corridors intersecting each grid cell | QLD Department of Environment and Science A | Areas identified as important cassowary corridors with either mature vegetation or revegetated areas (a minority with small unvegetated gaps), consolidated into 36 major defined corridors for subsequent analysis. | |
| Traffic volume | Vehicles/h | QLD Department of Transport and Main Roads A | Available data on traffic volume broken into various vehicle types for 80 road segments in the Wet Tropics Bioregion | |
| *Highway density | Length (km/km2) | Roadtype 2, QLD Department of Transport and Main Roads A | Highways (e.g. Bruce Highway). High speed, high volume roads | |
| *Major connector road density | Length (km/km2) | Roadtype 3, QLD Department of Transport and Main Roads | Secondary Roads (e.g. Tully-Mission Beach Road). High speed, high volume roads | |
| *Local connector road density | Length (km/km2) | Roadtype 4, QLD Department of Transport and Main Roads | Local connector roads (e.g. Bingil Bay Road). Moderate speed, moderate volume roads | |
| *Local/access road density | Length (km/km2) | Roadtype 5, QLD Department of Transport and Main Roads | Local roads. Low speed, low volume roads. | |
| Human population density | People/km2 | Australian Bureau of Statistics B | A surrogate for road density | |
| *Road curvature | Sinuosity (1–2) | QLD Department of Transport and Main Roads | Mean curvature (sinuosity) of all roads within a 5 km × 5 km grid cell. Individual roads are assigned a sinuosity measure between 1 and 2 by the QLD Department of Transport and Main Roads |
Variables marked with a * were used in the final analysis following collinearity tests. Road types 2 and 3, and 4 and 5 were combined for the analysis.
To prepare the data for analysis, we created a 5 km × 5 km fishnet (i.e. square) grid in ArcGIS (ver. 9.3) overlaying the region of interest. For the 215 cassowary–vehicle collision records and the set of predictor variables (Table 1), we calculated a value for each grid cell. The result was a dataset of values for 1210 grid squares across the Wet Tropics bioregion. We attempted to minimise ‘false zero’ collision values by excluding 5 km × 5 km grid cells that (1) had <20% land area (along coastal zones), (2) had no recorded roads in any of the road categories 2–5, or (3) had 100% cassowary-absent habitat. These exclusions reduced the number of grid cells in the dataset from 1210 to 569, and the total number of collisions from 215 to 207.
Location-specific correlates of vehicle collision
From the assembled cassowary–vehicle collision database, we used 174 records that had high reported spatial accuracy (i.e. ~10 m). Using results from previously published works on animal–vehicle collisions (e.g. Dwyer et al. 2016;Goosem et al. 2011) and the authors’ expert knowledge, we compiled a list of ecological, physical and anthropogenic variables that potentially influence cassowary–vehicle collision at a particular road location (Table 2). We parameterised each of the variables for the 174 locations in three ways. First, we used Google Earth imagery, matching the dates of vehicle collision to Google Earth historical imagery as best as we could. Second, we made site visits to inspect and record locations where Google Earth imagery was not able to generate robust insight. Third, we used our own local knowledge of these locations, particularly for interpreting Google Earth imagery.
| Variable | Measure | Description and justification | |
|---|---|---|---|
| Road direction | Aspect ± 100 m from collision location converted to an easting value between 0 and 1 using sin((2π × aspect)/360) | May result in the sun impairing the driver’s vision | |
| Road alignment | Categorical variable: straight or curved, >30° change in direction over ±100 m from collision location | May change driving habits, impair vision, or influence braking reaction | |
| 3D road visibility | Categorical variable: flat or sloped, >10% slope ± 100 m from collision location | May change driving habits, impair vision, or influence braking reaction | |
| Road surface | Categorical variable: sealed or unsealed | May influence drivers speed, braking distance, or ability to avoid a cassowary | |
| Roadtype category | Categorical variable, Roadtypes 2–5, highway, major connector roads, local connector roads, local/access roads (QLD Department of Transport and Main Roads) | A surrogate for traffic speed and volume. Highways and major connector roads – High speed, high volume roads. Local connector roads – Moderate speed, moderate volume roads. Local roads – Low speed, low volume roads | |
| Road width | Distance in metres from the edge of bitumen on each side of the road | May influence driver speed and reaction time, or ability of a driver to see and avoid a cassowary | |
| Verge width | Width of the maintained verge on each side of the road. Mean distance of both sides | May influence the ability of a driver to detect and avoid a cassowary | |
| Verge vegetation | Categorical variable: either mowed grass or cleared | May influence driver’s visibility or influence the cassowary’s decision to cross the road | |
| Canopy cover over road | % foliage projective cover of vegetation over both sides of the road combined (0–100%) | May influence the ability of a driver to detect and avoid a cassowary | |
| Mean canopy cover in a 50 m radius of the vehicle collision | Mean % foliage projective cover of both sides of the road (0–100%) | May influence the cassowary’s decision to use habitat adjacent to the road or cross at a particular place on the road | |
| Difference in canopy cover in a 50 m radius of the vehicle collision | Difference in % foliage projective cover between one side of the road and the other | May affect the contrast in light conditions in front of the driver | |
| Land use in a 50 m radius of the vehicle collision | Categorical variable: using a combination of land types on each side of the road, e.g. rainforest-banana. The land use options were banana, easement, grazing, horticulture, mangrove, melaleuca, peri-urban, rainforest, rural-residential, sugar, urban and woodland. | May influence the cassowary’s decision to use habitat adjacent to the road or cross at a particular place on the road | |
| Physical barriers | Categorical variable: fence or river on either side of the road. Due to the small number of river values categories were pooled to form a binary barrier vs no-barrier variable. | May channel the cassowary towards a particular place on the road | |
| Land use in a 250 m radius of vehicle collision | Categorical variable: using a combination of land types on each side of the road, e.g. rainforest-banana. The land use options were banana, grazing, horticulture, mangrove, melaleuca, peri-urban, rainforest, rural-residential, sugar, urban and woodland. | May influence the cassowary’s decision to use habitat adjacent to the road, or the density of animals using the habitat | |
| Forest condition in a 250 m radius | Categorical variable: intact, fragmented, linear fragment or cleared on both sides of the road | May influence the cassowary’s decision to use habitat adjacent to the road or the density of animals using the habitat | |
| Road surface | Categorical variable: sealed or unsealed | May influence drivers speed, braking distance, or ability to avoid a cassowary | |
| Roadtype category | Categorical variable, Roadtypes 2–5, highway, major connector roads, local connector roads, local/access roads (QLD Department of Transport and Main Roads) | A surrogate for traffic speed and volume. Highways and major connector roads – High speed, high volume roads. Local connector roads – Moderate speed, moderate volume roads. Local roads – Low speed, low volume roads | |
| Road width | Distance in metres from the edge of bitumen on each side of the road | May influence driver speed and reaction time, or ability of a driver to see and avoid a cassowary |
To determine whether cassowary collisions were non-random in relation to the distribution of local road attributes, we created 1000 non-collision ‘control’ locations within the same study region. These locations were selected through a stratified random approach using the ‘Create Random Points’ tool in ArcGIS. We constrained selection of random locations to Roadtypes 2–5 of the Queensland Department of Transport and Main Roads network. We ensured that non-collision locations per 5 km × 5 km grid cell were selected (1) in proportion to the number of cassowary sightings in each grid cell (Queensland Department of Environment and Science unpublished), and (2) in proportion to the distribution of observed collisions within habitat types (core habitat 66%, non-core habitat 9% and absent habitat 25%). We used the first 174 of these non-collision locations and recorded data for the same variables as in Table 2, using the same three approaches to parameterisation as for collision locations. Where a random location fell on a road that had no probability of vehicle collision, for example, disused roads or agricultural access tracks (n = 46), we discarded that location and selected the next random location.
Statistical analysis
Some measured variables were highly collinear with one another, and in cases where Pearson correlation coefficients were greater than r = 0.70 (Dormann et al. 2007) we removed the first variable of each correlated pair from the analysis (Supplementary material Table S1). We used nine variables in the final analysis following collinearity testing: cassowary density, core habitat, non-core habitat, linear cassowary corridors, highway density, major connector road density, local connector road density and road curvature (for further information on these variables, see Table 1). For the purposes of this analysis we combined Roadtype 2 and 3, and Roadtype 4 and 5 based on the large number of zero values in larger road-size categories 2 and 3, and the similarity of Roadtypes 4 and 5 following ground-truthing.
We tested for significant effects of landscape-scale predictors on the number of vehicle collisions per 5 km × 5 km grid cell using generalised additive models (GAMs) with a Poisson error distribution (and log link function) in the ‘mgcv’ package (Wood 2017) in R 4.0.3 (R Core Team 2020). The GAM function allows models to incorporate non-linearity of response and spatial covariance among adjacent grid cells (Wood 2017). To ensure the most stringent test of landscape-level predictors, we tested their effects after first accounting for potential non-independence of values in adjacent grid cells. To do this we used an explicit mapping of spatial covariance structure in the collision data using a Gaussian process smooth (bs = ‘gp’) with an exponential covariance function (m = 2; Wood 2017). Next, we included ‘linear cassowary corridors’ as a fixed (parametric) categorical effect in the GAM model, and ‘cassowary density’, ‘core habitat’, ‘non-core habitat’, ‘highway density’, ‘local connector road density’ and ‘road curvature’ were included as smooth terms. All tests of continuous predictors used thin plate regression splines as the penalised smoothing basis, bs = ‘tp’ (Wood 2017). GAM model parameters were set as gamma = 1.4, select = TRUE and method = ‘ML’ as recommended by Wood (2017).
Finally, to determine the final most-parsimonious model explaining variation in vehicle collisions, we used a model selection process (Anderson and Burnham 2002). This approach combines a comparison of penalised likelihood values and adjusted R2 values of competing models consisting of all possible combinations of predictors (Burnham and Anderson 2002). Continuous predictors were centred and standardised for model comparisons. The final best-fit model was re-fitted with restricted maximum likelihood to estimate final model coefficients.
For the dataset of 174 observed collisions and 172 non-collision control locations (two control locations were lost due to a data recording error), we tested for significant effects of the six continuous and nine categorical local-scale variables on the relative frequency of vehicle collisions. For categorical variables with a low frequency of counts (<5) in one or more variable category, these categories were pooled into an ‘other’ category (31 combinations of land use cover at the 50 m scale were reduced down to 12 categories; and 40 combinations of land use cover at the 250 m scale were reduced down to 11 categories). We used generalised additive models (GAMs) in the ‘mgcv’ package as described above, but with a binomial error distribution (and logit link function) to account for the binary collision vs non-collision response variable (Wood 2017). For consistency, we accounted for potential spatial dependence in the collision and non-collision locations using a Gaussian process smooth (bs = ‘gp’) with an exponential covariance function (Wood 2017). Next, we included the nine categorical variables (Table 2) as fixed (parametric) effects in the GAM model, and the six continuous variables (Table 2) as smooth terms in order to allow for potential non-linearity effect. As above, all tests of continuous predictors used thin plate regression splines as the penalised smoothing basis, bs = ‘tp’ (Wood 2017). The final most-parsimonious model explaining variation in vehicle collisions was determined using a model selection process (Anderson and Burnham 2002) combining a comparison of penalised likelihood values and adjusted R2 values of competing models consisting of all possible combinations of predictors (Burnham and Anderson 2002).
Results
Landscape-scale hotspots and correlates of vehicle collision
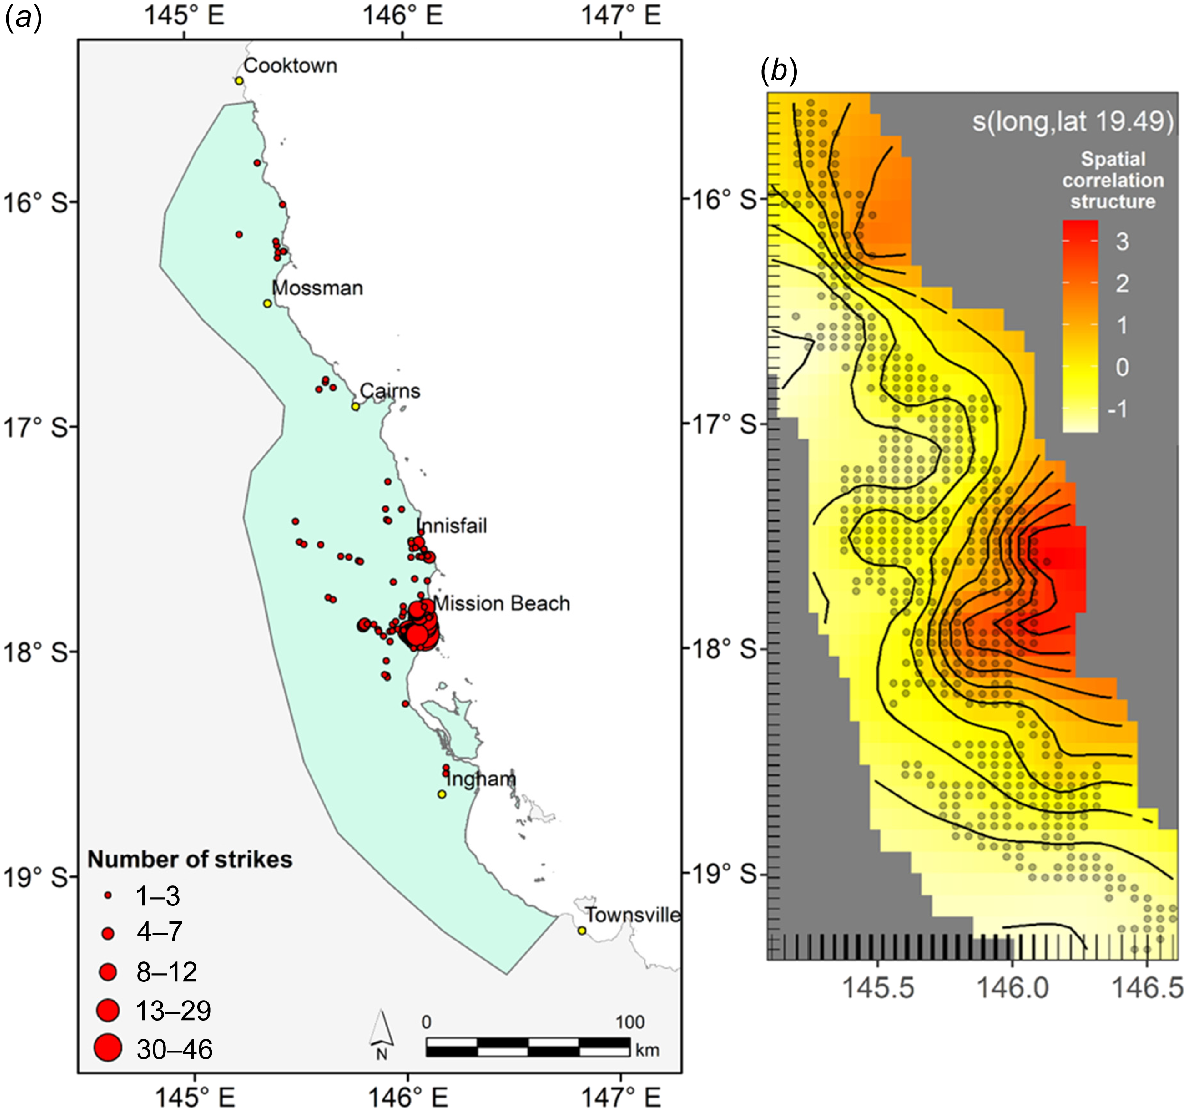
The reduced dataset comprised 207 cassowary–vehicle collisions recorded between 1991 and 2018 across 569 grid cells, with 61% of these collisions occurred in just five grid cells with a collision frequency as high as 46 per cell (Fig. 2a). In the GAM model, there was strong spatial covariance structure evident in the cassowary–vehicle collision data (GAM: s(long,lat, 19.49), Ref.d.f. = 99, χ2 = 204.21, P < 0.0001), highlighting a major vehicle collision hotspot in the coastal lowland from Innisfail in the north (−17.5°S) to South Mission Beach in the south (−18.0°S) and extending west up the Tully River Valley (Fig. 2b). A less prominent hotspot occurs in the north of the Wet Tropics bioregion from the Daintree River (−16.3°S) to Cape Tribulation (−16.1°S).
Landscape-scale analysis of cassowary–vehicle collisions in the Wet Tropics bioregion in Queensland, Australia. (a) the spatial distribution of data for cassowary–vehicle collisions between 1991 and 2018, (b) spatial covariance structure of collision data across the 5 km × 5 km grid cells. Darker red areas indicate areas of higher collision frequency.
Over and above the effects of spatial covariance in the collision data, the final most-parsimonious GAM model identified significant increases in vehicle collisions with increasing proportion of cassowary core habitat in the landscape (s(cass.core.hab, 3.42), Ref.d.f. = 9, χ2 = 65.23, P < 0.0001; Fig. 3a), increasing highway density (s(road23.dens, 0.98), Ref.d.f. = 9, χ2 = 63.74, P < 0.0001; Fig. 3b), and increasing minor road density (s(road45.dens, 1.78), Ref.d.f. = 9, χ2 = 11.29, P < 0.0003; Fig. 3c), together explaining 92.8% of the variance in the data (R2 adjusted = 0.928).
Landscape-scale correlates of cassowary–vehicle collision in the Wet Tropics bioregion in Queensland, Australia, (a) the proportion of core cassowary habitat, (b) density of major roads (highways and major connector roads) in m/km2, and (c) density of minor and local roads in m/km2. Fitted lines (±95% CI) are the model-predicted partial regression smooths from the best-fit generalised additive model. Note the log scaling on the x-axis. A value of zero on the y-axis indicates model-predicted average number of vehicle collisions across all grid squares. Where 95% CI overlaps zero, there is no significant additive effect of the predictor over that range of treatment levels.
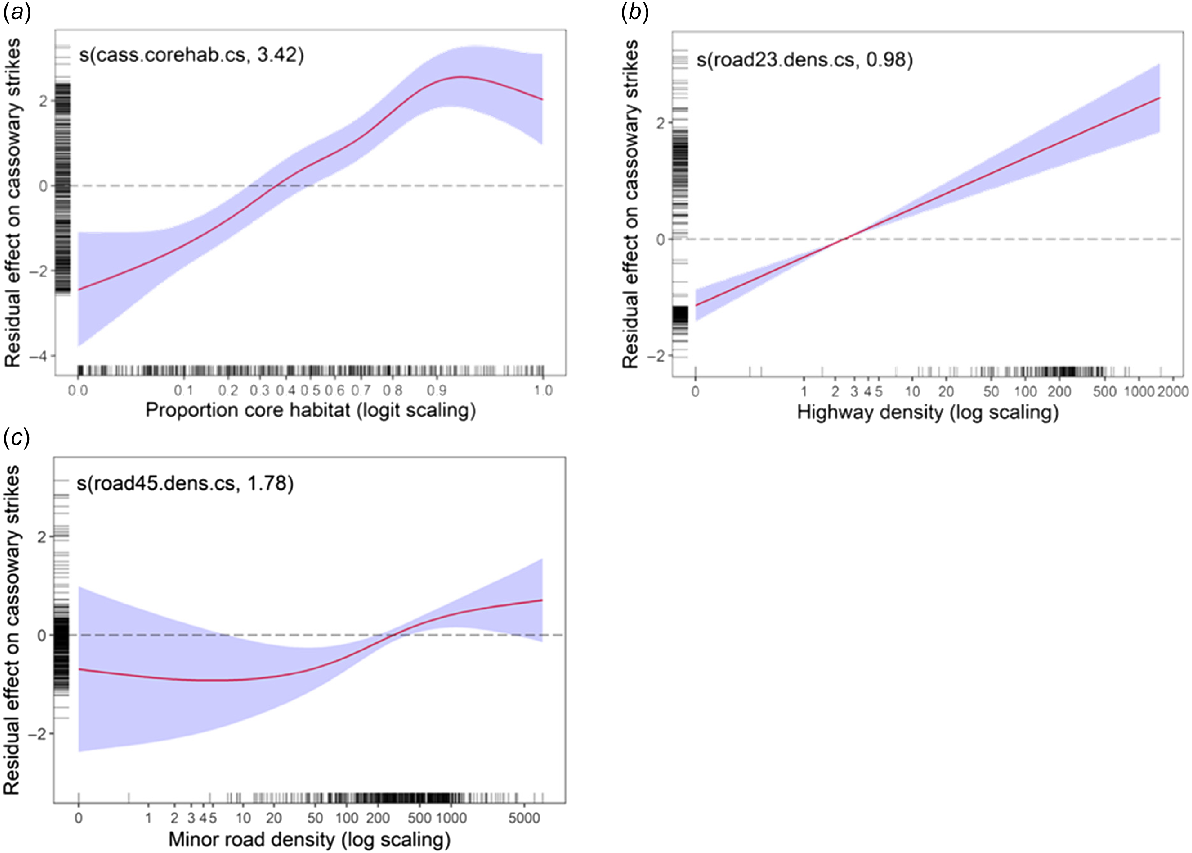
Specifically, a significantly lower number of collisions than expected (on average, across all grid squares) occurred in landscapes with a low proportion of core cassowary habitat (<25%) whereas a significantly greater number of collisions occurred in landscapes with 50–90% core cassowary habitat (Fig. 3a).
In landscapes with more than 95% core cassowary habitat, there was an indication of a slight decrease in the frequency of collisions but at very high collision levels relative to other grid squares on average. In addition, the frequency of cassowary collisions increased linearly with increasing density of major roads (Fig. 3b) where collisions in grid squares close to 10–20 m of major roads per km2 were higher than average. Finally, the frequency of collisions was higher in landscapes with greater than ~400 m/km2 of minor roads (local connector and local roads). However, it should be noted that variance around predicted estimates is high at both extremely low and extremely high densities of minor roads (Fig. 3c).
No significant relationship was detected between vehicle collision and cassowary population density, proportion of non-core habitat, number of corridors or road curvature. These factors were therefore removed from the analysis during model simplification.
Location-specific correlates of vehicle collision
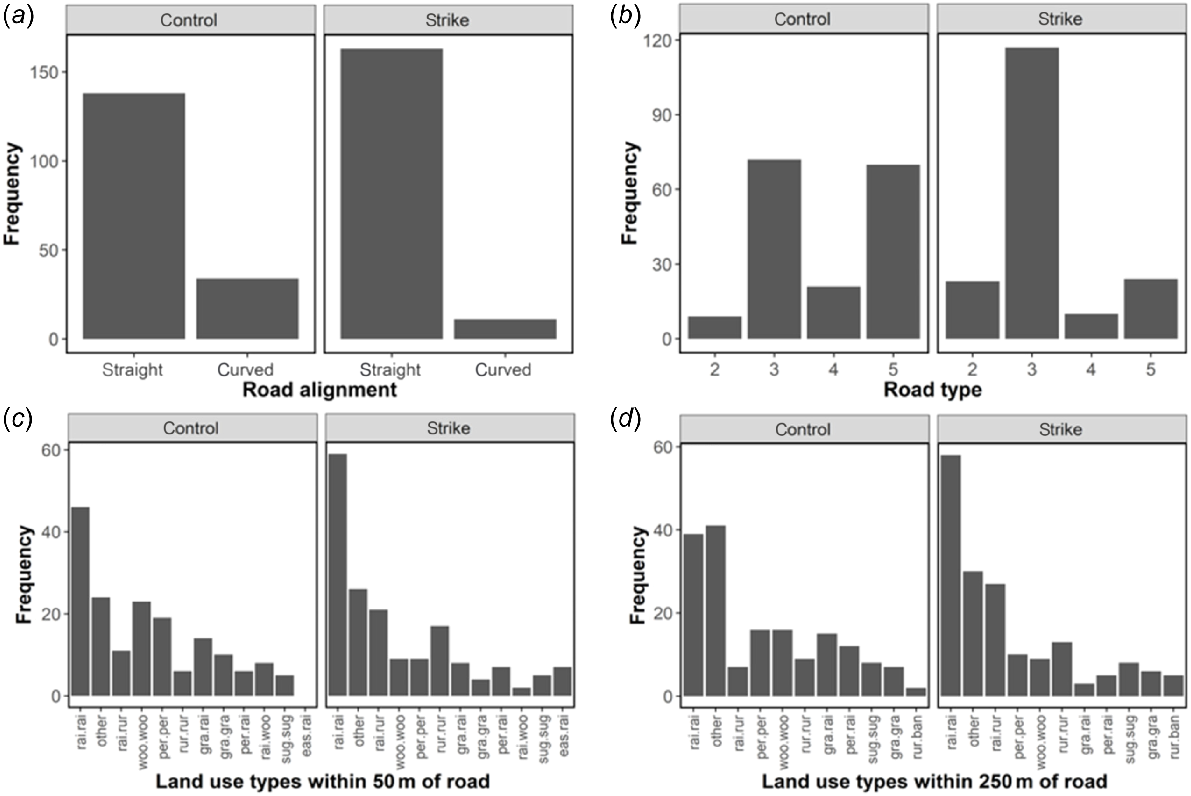
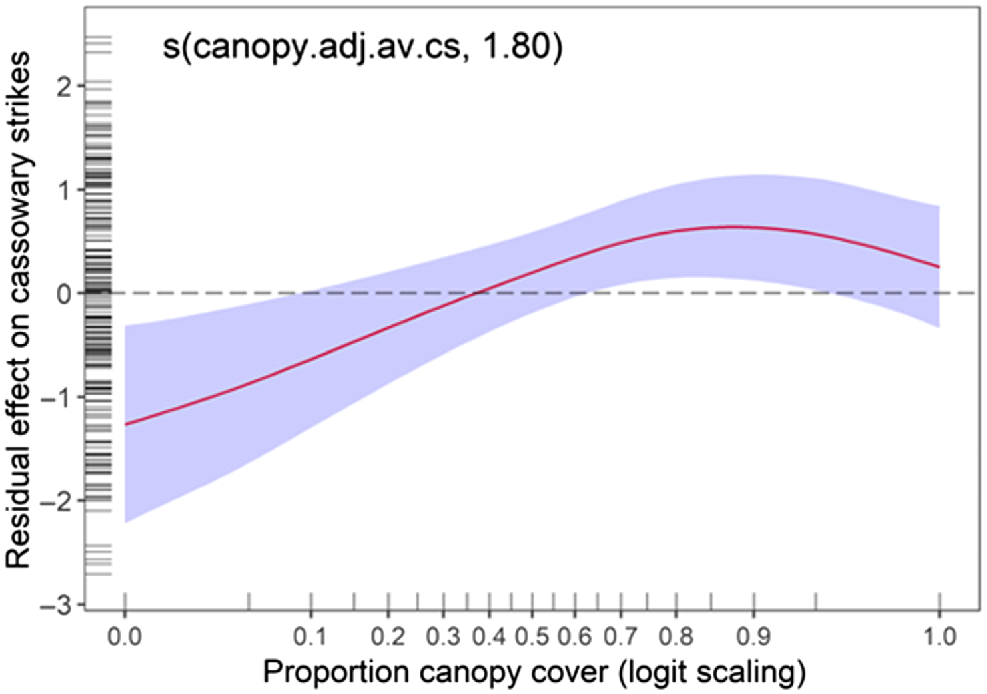
For the 174 recorded collisions and 172 randomly-selected non-collision ‘control’ locations, the final most-parsimonious GAM model showed no significant spatial correlation structure in the data. There was also no significant effects of five of the six continuous predictors (verge width, road direction, road width, canopy cover over road, and land use within 250 m) or five of the nine categorical predictors (3D road visibility, physical barriers, verge vegetation type, forest condition within 250 m, and road surface) on relative collision frequency. There was a significantly higher relative frequency of collisions on straight roads rather than curves, compared to what would be expected from the non-collision control locations (Fig. 4a). There was also a significantly higher relative frequency of collisions than expected on major roads (Road types 2 and 3) and a lower frequency of collisions than expected on minor roads (Road types 4 and 5; Fig. 4b). Land use adjacent to roads had a significant effect on collision frequency at both the 50 m scale (Fig. 4c) and the 250 m scale (Fig. 4d). In both cases, relative collision frequencies were significantly lower when there was woodland or grazing land adjacent to the road on either side, compared with other types of land cover classes such as rainforest (Fig. 4c, d). Finally, there was a significant effect of the proportion canopy cover of adjacent vegetation on cassowary collision frequency, with lower-than-average collisions at low canopy cover (<10%) and higher than average collisions at higher adjacent canopy cover (>65%; Fig. 5). Together the five predictors in the final most-parsimonious GAM model explained 26.8% of the variance in the data (R2adjusted = 0.268).
Categorical location-specific correlates of cassowary–vehicle collision at known collision locations (right panels) vs randomly located non-collision ‘control’ locations (left panels) in the Wet Tropics bioregion in Queensland, Australia. (a) road alignment, (b) road types as per the QLD Department of Transport and Main Roads categories, (c, d) land use categories across both sides of the road, specifically banana (ban), easement (eas), grazing (gra), peri-urban (per), rainforest (rai), rural-residential (rur), sugar (sug), and woodland (woo). Other land use types with low frequency were pooled as ‘other’ (horticulture, mangrove, melaleuca wetland and urban).
The proportion of canopy cover adjacent to a road as a location-specific correlate of cassowary–vehicle collision in the Wet Tropics bioregion in Queensland, Australia. Fitted lines (±95% CI) are the model-predicted partial regression smooths from the best-fit generalised additive model. Note the log scaling on the x-axis. A value of zero on the y-axis indicates model-predicted average number of vehicle collisions across all grid squares. Where 95% CI overlaps zero, there is no significant additive effect of the predictor over that range of treatment levels.
Discussion
The direct and indirect impacts of roads on terrestrial wildlife are becoming increasingly recognised and more robustly quantified. Identifying scale-dependence in these impacts is highly significant in determining when, where, and how to mitigate threat from vehicle collision. For the southern cassowary, our study has shown that different factors influence this risk at different local vs landscape scales, that new roads should be avoided through rainforest, and that there are specific locations where mitigation strategies are likely to be more effective (Rhodes et al. 2014).
Landscape-scale correlates of vehicle collision
We showed that any length of major road passing through a high proportion of core cassowary habitat will result in an increased likelihood of cassowary–vehicle collision. The severity of this effect increases in direct proportion to the density of roads. It is therefore not surprising that there is a concentration of cassowary–vehicle collisions over a large area between Innisfail and Mission Beach, where several major transport corridors sit within cassowary habitat. Similar associations have been found for other animals vulnerable to vehicle collision elsewhere in Australia (Lunney et al. 2022a). We also observed smaller concentrations of collisions on the Kuranda Range, north-west of Cairns, where a single major road passes through intact cassowary habitat, and north of the Daintree River where a number of minor roads pass through a large area of intact cassowary habitat. These three areas undoubtedly experience the majority of cassowary–vehicle collisions in the Wet Tropics. However, high reporting rates in these areas may introduce a local reporting bias due to active community environmental groups and a strong National Parks staff presence. There are several additional areas in the Wet Tropics that have a high density of major and minor roads passing through cassowary habitat, but a low number of reported collisions in the current available data. These are the Rex Range, the upper Palmerston Range, and the Bruce Highway north of Cardwell. Our analysis suggests that these areas have a high potential for cassowary collision and an absence of reported records may reflect under-reporting rather than true absences. As such, we recommend these areas as a focus for improving the effectiveness of reporting, and that they are also included in vehicle collision mitigation strategies.
It is reasonable to conclude that the density of roads within a habitat will exert a strong influence on animal–vehicle interactions (Goosem 2007; Laurance et al. 2008, 2009). This has been demonstrated repeatedly in a wide range of global studies (e.g. Philcox et al. 1999; Fabrizio et al. 2019). Nor is it unexpected that a higher density of major roads carrying high numbers of vehicles at high speed through an animal’s habitat will result in significantly increased frequency of collisions if no mitigation measures are in place (Shima et al. 2018; Collinson et al. 2019; Find’o et al. 2019; Filius et al. 2020). Therefore, if any major roads, or moderate densities of minor roads (i.e. >400 m/km2) are constructed through cassowary habitat without effective mitigation strategies, then cassowary mortality should be expected.
We show that vehicle collision frequency increases significantly when core cassowary habitat increases above 50% of the landscape. This reflects the habitat specificity of cassowaries and suggests that while vehicle collision can occur when animals are moving between core habitat and agricultural, urban and non-core habitat areas, vehicle collision is more likely to occur while animals are moving within continuous rainforest or between large fragments of rainforest. We also show that we cannot simply assume that higher cassowary densities at a landscape scale will result in more cassowary–vehicle collisions. There are likely to be numerous other variables that influence the likelihood of a cassowaries coming into proximity with and crossing a road, including home range size (Campbell et al. 2012), number of dispersing animals, topography (Mack 1995), localised cyclonic disturbance and resource availability.
Location-specific correlates of vehicle collision
Location-specific correlates of animal–vehicle collision are to some extent species specific but are also related to characteristics of the roads themselves (Gonçalves et al. 2018; Pagany 2020). Our location-specific results show that a combination of road features, high traffic volume and vehicle speed, and adjacent vegetation leads to a higher likelihood of cassowary–vehicle collisions. That is, cassowaries are more likely to be struck by vehicles while crossing a straight section of major road where forest canopy cover is high on both sides of the road. This is likely a function of two separate processes. First, on straight roads drivers feel more confident (Hansen and Chang 2019) and tend to drive faster than on curved roads (Kang et al. 2019). Accidents are more common as speed increases (Richter et al. 2006) and for vehicle–pedestrian collisions, fatalities increase dramatically as speed increases (Hussain et al. 2019). Second, the visual fixation point of a driver is highly correlated with vehicle speed and road curvature (Wilkie and Wann 2003). On curved roads a driver tends to fix their vision on the inner edge of the curve at a closer distance, becoming closer with greater curvature (Land and Lee 1994; Hu et al. 2020). As such, on straight roads a driver’s ability to perceive hazards close to the vehicle is impaired at the same time that a vehicle’s speed reduces the driver’s ability to avoid a collision.
Cassowaries show a tendency to use regular road crossings within rainforest (Goosem et al. 2011) and cassowary sightings on roads have been shown to be spatially clumped (Dwyer et al. 2016). Consequently, there is likely to be a strong relationship between cassowary sightings and vehicle collision (Dwyer et al. 2016). We show that greater canopy cover adjacent to the road is a positive location-specific predictor of collision. However, there is no evidence that any particular value of high canopy cover land use within 50 m or 250 m of the road, such as rainforest, increases the likelihood of collision. There was, however, evidence that low canopy cover land uses adjacent to the road, such as open woodland and grazing land, result in lower-than-average collisions. This likely indicates that cassowaries are avoiding low cover land use types, and drivers can detect and avoid animals more easily when there is minimal vegetation beyond the road verge, regardless of verge width. While this result could be interpreted as support for clearing or thinning vegetation beyond the road verge, such a response would amplify fragmentation and reduce connectivity with negative consequences for biodiversity conservation (Laurance et al. 2009).
Variables from our location-specific analysis only explain approximately 30% of data variance, suggesting other local or incident specific conditions may influence cassowary collisions. The most obvious of these factors are resource availability (e.g. food or water) and cassowary behaviour at that site or time. Resource availability is spatiotemporally variable and challenging to quantify, particularly when done post hoc. Moreover, a paucity of dietary resources may influence cassowary behaviour and vehicle collision as much as an abundance of resources. Cassowaries exhibit frequent movement throughout the day (Westcott et al. 2005), whether foraging or dispersing. They also have unpredictable foraging patterns, regularly returning to an area within hours when resources are scarce, but with a lower frequency when resources are abundant (Westcott et al. 2005). Movement patterns differ between sexes (Campbell et al. 2012) and between resident and dispersing animals. Encounters with vehicles may occur while foraging along a road, using the road as a movement corridor, or while crossing the road within habitat.
There are also cassowary behaviours that aid in predicting vehicle collisions. Cassowaries are overwhelmingly more active during daylight hours, with peaks of foraging activity in the early morning and late afternoon (Bentrupperbaumer 1998; Westcott et al. 2005). These times often correspond to higher traffic volumes along roads. Moreover, cassowaries are often inquisitive, easily distracted, generally slow moving, and therefore are likely to cross a road slowly (Goosem et al. 2011). Slow road crossings by cassowaries can be further aggravated by their opportunistic consumption of the remains of road-killed animals.
Management implications
Our findings that cassowary–vehicle collision is most influenced by the density of roads and the presence of rainforest is not unexpected, indicating that finding an effective solution will not be easy. First, human populations, transport corridors and agriculture are embedded within protected cassowary habitat, resulting in frequent cassowary–vehicle interactions. Second, a projected increase in the human population of this area (Cairns Regional Council 2015) will result in more roads and higher traffic volumes within cassowary habitat. Third, the increasing frequency of cassowary–vehicle collision (2016–2018 annual average of 21.0 vs 1992–2015 of 6.2) provides no evidence that cassowaries are becoming conditioned to roads and traffic. While we cannot exclude more active reporting as an explanation for increased collisions in recent years, the same data provide no evidence that humans are responding to (often emotionally driven) campaigns to change their driving behaviour. Such findings are not only specific to cassowaries, but apply widely to the problem of wildlife roadkill for conservation globally (Lunney 2013).
Given these factors, the only way of reducing cassowary–vehicle interaction is to avoid constructing any new roads within rainforest and to invest significant resources into engineering or re-engineering of existing roads to minimise the interaction between those factors that place cassowaries in danger and that increase the probability of vehicle collisions. For example, large overpasses and underpasses on new and existing roads (Goosem et al. 2011; Goosem 2012) to serve as functional road crossing points for cassowaries should be considered where roads pass through cassowary habitat, where location-specific correlates of cassowary collision exist, and where cassowary crossing locations are identified. As the density of major roads increases, so does the urgency of employing engineering measures in their construction or for the upgrading of existing roads.
The approach to corridor establishment across roads and restoration planting for cassowary habitat near roads should be re-evaluated in light of the findings of this work. Where corridor linkages cross a road, collision mitigation measures such as over- or under-passes, speed humps, guiding structures and speed limits should be incorporated (Goosem 2012; Lunney et al. 2022b). Careful consideration must be given to local context to ensure mitigation measures do not have unintended consequences (Goosem 2008) and that they are in fact effective at mitigating collision risk for cassowaries (Soanes et al. 2024).
Conclusions and future directions
Where habitat that is suitable for cassowaries intersects with roads carrying vehicles, cassowary mortality will continue to occur in the Wet Tropics region. Implementing more effective management solutions is critical to address this threat. Additionally, improved insight on how cassowaries interact with the road network will help to refine collision mitigation measures and understand their effectiveness. Cassowary sightings and vehicle collision, both fatal and non-fatal, must continue to be reported. Any opportunity to increase the likelihood of collisions and sightings being reported should be pursued, including novel ways to obtain this information. Methods to improve the quality and detail of this observation data should also be adopted. For example, greater insight on collision context and outcomes for the cassowary involved could lead to more effective solutions. More broadly, this work contributes to a growing awareness of how including local context is essential when deploying effective road risk mitigation strategies to improve conservation outcomes.
Data availability
The data that support this study will be shared upon reasonable request to the corresponding author.
Declaration of funding
This research was funded by the Queensland Government Department of Environment and Science and CSIRO.
Acknowledgements
We thank Matt Brien and Paul Beri (Queensland Department of Environment and Science) and Hamish Campbell (Charles Darwin University) for access to cassowary–vehicle collision and sighting data. We thank Paul Yeoh, Ruchira Somaweera, Glenn Maslen, and Edward Tsen (CSIRO) for logistical support.
References
Anderson DR, Burnham KP (2002) Avoiding pitfalls when using information-theoretic methods. The Journal of Wildlife Management 66, 912-918.
| Crossref | Google Scholar |
Andrews A (1990) Fragmentation of habitat by roads and utility corridors: a review. Australian Zoologist 26, 130-141.
| Crossref | Google Scholar |
Barrientos R, Ascensão F, D’Amico M, Grilo C, Pereira HM (2021) The lost road: do transportation networks imperil wildlife population persistence? Perspectives in Ecology and Conservation 19, 411-416.
| Crossref | Google Scholar |
Benítez-López A, Alkemade R, Verweij PA (2010) The impacts of roads and other infrastructure on mammal and bird populations: a meta-analysis. Biological Conservation 143, 1307-1316.
| Crossref | Google Scholar |
Bradford MG, Westcott DA (2010) Consequences of southern cassowary (Casuarius casuarius, L.) gut passage and deposition pattern on the germination of rainforest seeds. Austral Ecology 35, 325-333.
| Crossref | Google Scholar |
Campbell HA, Dwyer RG, Fitzgibbons S, Klein CJ, Lauridsen G, McKeown A, Olsson A, Sullivan S, Watts ME, Westcott DA (2012) Prioritising the protection of habitat utilised by southern cassowaries Casuarius casuarius johnsonii. Endangered Species Research 17, 53-61.
| Crossref | Google Scholar |
Campbell MA, Lawton T, Udyawer V, Bell-Anderson KS, Westcott D, Campbell HA (2023) The southern cassowary (Casuarius casuarius johnsonii) remains an important disperser of native plants in fragmented rainforest landscapes. Austral Ecology 48, 787-802.
| Crossref | Google Scholar |
Collinson WJ, Marneweck C, Davies-Mostert HT (2019) Protecting the protected: reducing wildlife roadkill in protected areas. Animal Conservation 22, 396-403.
| Crossref | Google Scholar |
Crome FHJ, Moore LA (1990) Cassowaries in north-eastern Queensland – report of a survey and a review and assessment of their status and conservation and management needs. Australian Wildlife Research 17, 369-385.
| Crossref | Google Scholar |
Denneboom D, Bar-Massada A, Shwartz A (2021) Factors affecting usage of crossing structures by wildlife – a systematic review and meta-analysis. Science of The Total Environment 777, 146061.
| Crossref | Google Scholar |
Dormann CF, McPherson JM, Araujo MB, Bivand R, Bolliger J, Carl G, Davies RG, Hirzel A, Jetz W, Kissling WD, Kühn I, Ohlemüller R, Peres-Neto PR, Reineking B, Schröder B, Schurr FM, Wilson R (2007) Methods to account for spatial autocorrelation in the analysis of species distributional data: a review. Ecography 30, 609-628.
| Crossref | Google Scholar |
Dwyer RG, Carpenter-Bundhoo L, Franklin CE, Campbell HA (2016) Using citizen-collected wildlife sightings to predict traffic strike hot spots for threatened species: a case study on the southern cassowary. Journal of Applied Ecology 53, 973-982.
| Crossref | Google Scholar |
Fabrizio M, Di Febbraro M, D’Amico M, Frate L, Roscioni F, Loy A (2019) Habitat suitability vs landscape connectivity determining roadkill risk at a regional scale: a case study on European badger (Meles meles). European Journal of Wildlife Research 65, 7.
| Crossref | Google Scholar |
Filius J, van der Hoek Y, Jarrin-V P, van Hooft P (2020) Wildlife roadkill patterns in a fragmented landscape of the Western Amazon. Ecology and Evolution 10, 6623-6635.
| Crossref | Google Scholar | PubMed |
Find’o S, Skuban M, Kajba M, Chalmers J, Kalaš M (2019) Identifying attributes associated with brown bear (Ursus arctos) road-crossing and roadkill sites. Canadian Journal of Zoology 97, 156-164.
| Crossref | Google Scholar |
Gonçalves LO, Alvares DJ, Teixeira FZ, Schuck G, Coelho IP, Esperandio IB, Anza J, Beduschi J, Bastazini VAG, Kindel A (2018) Reptile road-kills in southern Brazil: composition, hot moments and hotspots. Science of The Total Environment 615, 1438-1445.
| Crossref | Google Scholar | PubMed |
Goosem M (2007) Fragmentation impacts caused by roads through rainforests. Current Science 93, 1587-1595.
| Google Scholar |
Goosem M (2012) Mitigating the impacts of rainforest roads in Queensland’s Wet Tropics: effective or are further evaluations and new mitigation strategies required? Ecological Management & Restoration 13, 254-258.
| Crossref | Google Scholar |
Hansen R, Chang K (2019) Horizontal and vertical curvature and its effects on driver passing choice. Transportation Research Record 2673, 734-742.
| Crossref | Google Scholar |
Hobday AJ, Minstrell ML (2008) Distribution and abundance of roadkill on Tasmanian highways: human management options. Wildlife Research 35, 712-726.
| Crossref | Google Scholar |
Hu H, Cheng M, Gao F, Sheng Y, Zheng R (2020) Driver’s preview modeling based on visual characteristics through actual vehicle tests. Sensors 20, 6237.
| Crossref | Google Scholar |
Hussain Q, Feng H, Grzebieta R, Brijs T, Olivier J (2019) The relationship between impact speed and the probability of pedestrian fatality during a vehicle-pedestrian crash: a systematic review and meta-analysis. Accident Analysis & Prevention 129, 241-249.
| Crossref | Google Scholar | PubMed |
Kang X, Namgung M, Fujiwara A, Kim W, Wang W (2019) Analysis of vehicle maneuverability and driving characteristics on a curved road condition. KSCE Journal of Civil Engineering 23, 420-432.
| Crossref | Google Scholar |
Kofron CP, Chapman A (2006) Causes of mortality to the endangered southern cassowary Casuarius casuarius johnsonii in Queensland, Australia. Pacific Conservation Biology 12, 175-179.
| Crossref | Google Scholar |
Lambert TD, Sumpter KL, Dittel JW, Dupre S, Casanova K, Winker A, Adler GH (2014) Roads as barriers to seed dispersal by small mammals in a neotropical forest. Tropical Ecology 55, 263-269.
| Google Scholar |
Land MF, Lee DN (1994) Where we look when we steer. Nature 369, 742-744.
| Crossref | Google Scholar | PubMed |
Laurance WF, Croes BM, Guissouegou N, Buij R, Dethier M, Alonso A (2008) Impacts of roads, hunting, and habitat alteration on nocturnal mammals in African rainforests. Conservation Biology 22, 721-732.
| Crossref | Google Scholar | PubMed |
Laurance WF, Goosem M, Laurance SGW (2009) Impacts of roads and linear clearings on tropical forests. Trends in Ecology & Evolution 24, 659-669.
| Crossref | Google Scholar | PubMed |
Laurance WF, Clements GR, Sloan S, O’Connell CS, Mueller ND, Goosem M, Venter O, Edwards DP, Phalan B, Balmford A, Van Der Ree R, Arrea IB (2014) A global strategy for road building. Nature 513, 229-232.
| Crossref | Google Scholar | PubMed |
Lesbarrères D, Fahrig L (2012) Measures to reduce population fragmentation by roads: what has worked and how do we know? Trends in Ecology & Evolution 27, 374-380.
| Crossref | Google Scholar | PubMed |
Lunney D (2013) Wildlife roadkill: illuminating and overcoming a blind spot in public perception. Pacific Conservation Biology 19, 233-249.
| Crossref | Google Scholar |
Lunney D, Predavec M, Sonawane I, Moon C, Rhodes JR (2022a) Factors that drive koala roadkill: an analysis across multiple scales in New South Wales, Australia. Australian Mammalogy 44, 328-337.
| Crossref | Google Scholar |
Lunney D, Moon C, Sonawane I, Predavec M, Rhodes JR (2022b) A 6-year study of mitigating koala roadkill during an upgrade of the Pacific Highway at Lindsay’s cutting, Coffs Harbour New South Wales. Australian Mammalogy 44, 305-318.
| Crossref | Google Scholar |
Mack AL (1995) Distance and non-randomness of seed dispersal by the dwarf cassowary (Casuarius bennetti). Ecography 18, 286-295.
| Crossref | Google Scholar |
May SA, Norton TW (1996) Influence of fragmentation and disturbance on the potential impact of feral predators on native fauna in Australian forest ecosystems. Wildlife Research 23, 387-400.
| Crossref | Google Scholar |
Pagany R (2020) Wildlife-vehicle collisions – influencing factors, data collection and research methods. Biological Conservation 251, 108758.
| Crossref | Google Scholar |
Philcox CK, Grogan AL, Macdonald DW (1999) Patterns of otter Lutra lutra road mortality in Britain. Journal of Applied Ecology 36, 748-761.
| Crossref | Google Scholar |
Pinto FAS, Clevenger AP, Grilo C (2020) Effects of roads on terrestrial vertebrate species in Latin America. Environmental Impact Assessment Review 81, 106337.
| Crossref | Google Scholar |
Queensland Government (2019) Regional ecosystem mapping. Available at https://environment.ehp.qld.gov.au/regional-ecosystems/
Rhodes JR, Lunney D, Callaghan J, McAlpine CA (2014) A few large roads or many small ones? How to accommodate growth in vehicle numbers to minimise impacts on wildlife. PLOS ONE 9, e91093.
| Crossref | Google Scholar |
Richter ED, Berman T, Friedman L, Ben-David G (2006) Speed, road injury, and public health. Annual Review of Public Health 27, 125-152.
| Crossref | Google Scholar | PubMed |
Shima AL, Gillieson DS, Crowley GM, Dwyer RG, Berger L (2018) Factors affecting the mortality of Lumholtz’s tree-kangaroo (Dendrolagus lumholtzi) by vehicle strike. Wildlife Research 45, 559-569.
| Crossref | Google Scholar |
Soanes K, Rytwinski T, Fahrig L, Huijser MP, Jaeger JAG, Teixeira FZ, van der Ree R, van der Grift EA (2024) Do wildlife crossing structures mitigate the barrier effect of roads on animal movement? A global assessment. Journal of Applied Ecology 61, 417-430.
| Crossref | Google Scholar |
Taylor BD, Goldingay RL (2010) Roads and wildlife: impacts, mitigation and implications for wildlife management in Australia. Wildlife Research 37, 320-331.
| Crossref | Google Scholar |
Westcott DA, Bentrupperbaumer J, Bradford MG, McKeown A (2005) Incorporating patterns of disperser behaviour into models of seed dispersal and its effects on estimated dispersal curves. Oecologia 146, 57-67.
| Crossref | Google Scholar | PubMed |
Wilkie R, Wann J (2003) Controlling steering and judging heading: retinal flow, visual direction, and extraretinal information. Journal of Experimental Psychology: Human Perception and Performance 29, 363-378.
| Crossref | Google Scholar | PubMed |