

Cat among the birds and trees: feral cat movements respond to variation in spatiotemporal productivity in a large island ecosystem
Cyril R. E. Scomparin A * , Matthew D. Pauza B and Menna E. Jones A
A
B
Abstract
Feral cats (Felis catus) are a highly adaptable invasive species, widespread across mainlands and islands in Australia and globally. Managing feral cats to reduce their impact on native wildlife is a priority for conservation organisations, land managers, and policymakers.
This study aimed to examine how spatial and temporal heterogeneity in productivity influences the movement behaviour, habitat selection, and home range size of feral cats on lunawanna-alonnah/Bruny Island, Tasmania, Australia. Combining movement and landscape information provides a finer-scale understanding of habitat use and requirements, which is valuable for managing of invasive species.
We deployed GPS collars on 17 feral cats, across three sites on lunawanna-alonnah/Bruny Island, Tasmania, Australia. Two of the sites contained seabird colonies, whereas the third was located in wet eucalypt forests. The collars recorded data for periods ranging from 40 to 340 days. We describe and compare home range utilisations by using biased random-bridge kernels, classify movement paths by using hidden Markov models, and apply the Manly selection ratio approach to investigate habitat selection.
Cat home ranges and movements were smallest in the high-productivity situation of seasonally breeding seabird colonies and largest in the lower-productivity wet forest. Cats in wet forests spent more time travelling and made greater use of anthropogenic features, such as tracks and roads. Cats collared in the seabird colony avoided roads and mostly restricted their movements to the colony, with the exception of three males that made extensive extra-territorial movements after the seabirds departed the colony.
The sudden change in prey resources following seabird migration could present a threat to native wildlife if cats prey-switch, but offer an opportunity for lethal control because cats will be hungry, more mobile, and therefore more likely to encounter control activities.
Our results confirmed the importance of landscape productivity in shaping the behaviour of feral cats and provided information that can inform control programs in similar landscapes.
Keywords: animal movement, conservation, feral cat, geographical range, habitat use, invasive species, radio telemetry, seabird.
Introduction
Animal movements are determined by how individuals perceive the environment and the fitness benefits of optimal decisions, in which individuals trade-off resource gain with competition and predation risk (Lima and Zollner 1996). Patterns of movement show the compilation of behavioural decisions made over space and time and, so, how an animal values and uses elements of its environment. Combining movement and landscape information to obtain fine-scale understanding of habitat use and requirement is a useful tool for the effective and efficient management of invasive species. This is particularly the case for invasive alien predators, such as feral cats (Felis catus), which are among the most destructive species globally (Luque et al. 2014). Effective management of invasive species requires a detailed understanding of how animals interact with their environment. This includes knowledge of their habitat preferences, movement patterns, occasional long-distance excursions, and the spatial structure of their home ranges. Such information is crucial for designing effective control, eradication, or monitoring programs at appropriate scales, intensities, and locations (Norbury et al. 1998; Moseby et al. 2009; Recio et al. 2010). Additionally, understanding the spatial behaviour of invasive animals provides valuable insights into their ecological roles and impacts, including effects on predator–prey dynamics (Alterio et al. 1998), competition with native species (Wilson et al. 2010), and the spread of diseases (Sparkes et al. 2015).
From a behavioural perspective, animal home ranges are shaped according to the distribution of resources and the energy required to obtain and defend them (Mitchell and Powell 2004). The distribution of resources can vary in space and time, for example, with variation in the landscape features (such as slope, vegetation, substrate) or seasonal variation of prey availability, both of which will influence the movement cost for animals. Home range size is consequently not static but varies through an individual’s life, as well as among individuals and populations (Duncan et al. 2015). However, a flexible strategy in which ranging activity contracts and expands in response to changes in resource availability could be prohibitively costly to maintain (Lima 1984). Home ranges scale negatively with landscape productivity (Herfindal et al. 2005; Nilsen et al. 2005). Animals respond to higher productivity with reduced movement and spatial scale, leading to increased potential for intra-specific encounters. For predators, high abundance of prey should reduce the size of the home range, which would increase the density of predators and their impact (Bengsen et al. 2016; Hamer et al. 2021). Knowing the size of the home range is crucial for monitoring elusive species, and particularly for managing elusive invasive predators, because it will determine directly the effort required, such as the position, density or number of devices (such as motion-triggered cameras or traps) deployed.
On a finer scale, patterns of movement speed and tortuosity, called behavioural states, reflect the decisions made by an individual in the business of its daily life and can show which elements of the environment a species value and uses (Nathan et al. 2008). Understanding behavioural states, such as foraging and travelling, in the context of landscape attributes allows the identification of external factors that affect movement. Consequently, it shows the animal’s perception of the elements of its environment that constitute habitat for that species (Johnson 1980). A basic precept of behavioural ecology is that natural selection should favour organisms that use landscapes in a way that maximises their fitness (Krebs and Kacelnik 1991). For predators, a basic component of fitness is the rate of individual prey capture, which it is assumed is enhanced in areas of high prey density. Space use by predators is consequently either dictated by areas of the landscape where prey are particularly abundant or spatial locations where individual prey capture is more efficient.
The domestic cat has been introduced in many parts of the world and has been shown to be an adaptable and opportunistic predator that can use a broad range of habitats (Doherty et al. 2017). As such, feral cats are among the most successful and damaging invaders, especially on islands, and a significant driver of extinction and endangerment of small prey species (Bonnaud et al. 2011; Medina et al. 2011). Feral cats are cryptic and elusive predators, often occurring at low densities, and, consequently, are difficult to survey (Royle et al. 2008). It is particularly challenging to obtain information on landscape use of cats in rugged or dense environments, such as in rugged wet forest (Rees et al. 2019), making it challenging to sample and monitor their populations (Balme et al. 2009; Nottingham et al. 2022). As expected for a species that has spread successfully across a broad range of biomes, cats show inter-population variability in movement pattern and in the size of area that they use regularly (Bengsen et al. 2016; Jansen et al. 2021). Because cat home ranges vary with environmental context, it is difficult to generalise from previous studies when developing management programs for feral cats.
A useful opportunity to examine the role of environmental heterogeneity and productivity on the spatial ecology of feral cats at the scale of an entire large island was provided by a cat management program on lunawanna-alonnah/Bruny Island, the fourth-largest offshore island of lutruwita/Tasmania, Australia. Being an island, the study area is contained without edge effects and has a simpler mammalian food web than on the adjacent mainland. These features allow for a more controlled study of feral cat ecology. However, the island is sufficiently large and environmentally diverse to provide insights into how feral cats respond to habitat heterogeneity and resource distribution. Although there are differences from the mainland, such as the simpler food web, the fundamental ecological drivers of feral cat behaviour, such as resource availability and environmental productivity, remain consistent. Therefore, the results from this study can inform cat management efforts on the mainland, particularly in areas with similar environmental conditions. The project contributes to foundational work being undertaken since 2016 by the Bruny Island Cat Management Program (BICMP) to underpin planning for the long-term reduction or elimination of feral cat impacts on the island. Bruny Island is elongate in shape with over 320 km of coastline, supports numerous seabird colonies, and presents a mosaic of habitats, including rugged wet forest, as well as open dry forest and coastal heath. Feral cats reach high population densities in the vicinity of seabird colonies on the island (Scomparin et al. 2023), where migratory and colonially nesting short-tailed shearwaters (Ardenna tenuirostris) as well as little penguins (Eudyptula minor) breed over the summer months. Cat density within the island’s wet forests is also high, greater than the average density of feral cats in Australia.
The aim of the study is to understand the influence of environmental heterogeneity and productivity on the movement behaviour, habitat selection and home range size of feral cats, by using a large island ecosystem as a case study. We fitted cats with GPS collars to compare movement and spatial ecology in (1) coastal heath supporting seabird colonies and providing seasonally fluctuating abundance of prey, and (2) wet eucalypt forest assumed to be spatially and temporally homogeneous. We sought to examine (1) how broad habitat types influence home range size and cat movement behaviour, and (2) on a finer scale, the habitat selection of feral cats. By providing information on how cats use different environments on Bruny Island, we aim to identify attributes on which to focus monitoring and control programs, both on the island and more broadly, to deliver more effective and efficient conservation outcomes.
Materials and methods
Study areas
The study was conducted on lunawanna-allonnah/Bruny Island, located off the south-east coast of lutruwita/Tasmania, Australia (−43.27S, 147.34E), between 2017 and 2020. Bruny Island is a large offshore island of 362 km2, divided into two distinct continental land masses, North and South Bruny, which are connected by a narrow sand isthmus, ‘The Neck’. The climate is classified as cool temperate, with a strong gradient from drier and less cold in the north to wetter and colder in the south. The mean annual rainfall and the range of monthly mean temperatures is 516.9 mm and 9.7–17.2°C for North Bruny (on the basis of Bureau of Meteorology records from Dennes Point), and 769.1 mm and 9.3–16.1°C for South Bruny (on the basis of Bureau of Meteorology records from Cape Bruny).
Bruny Island has a subset of the mammal species present on mainland Tasmania (Driessen et al. 2011). Among the carnivores, the native marsupial eastern quoll (family Dasyuridae, Dasyurus viverrinus) and the feral cat (Felis catus) are the principal terrestrial predators. The larger native mesopredators, the Tasmanian devil (Sarcophilus harrisii) and the spotted-tailed quoll (D. maculatus), are absent from the island. Feral cats are the apex mammalian predator in this ecosystem, with implications for food web dynamics and cat behavioural use of the landscape. The invasive black rat (Rattus rattus), house mouse (Mus musculus) and European rabbit (Oryctolagus cuniculus), which are staple prey items for cats throughout much of Australia (Molsher et al. 1999), are present on the island, and have probably been present since European occupation in the early 1800s (Lawrence and Tucker 2002). Cats have been recorded on the island since the mid-1800s and occur across the entire island, with locally high densities.
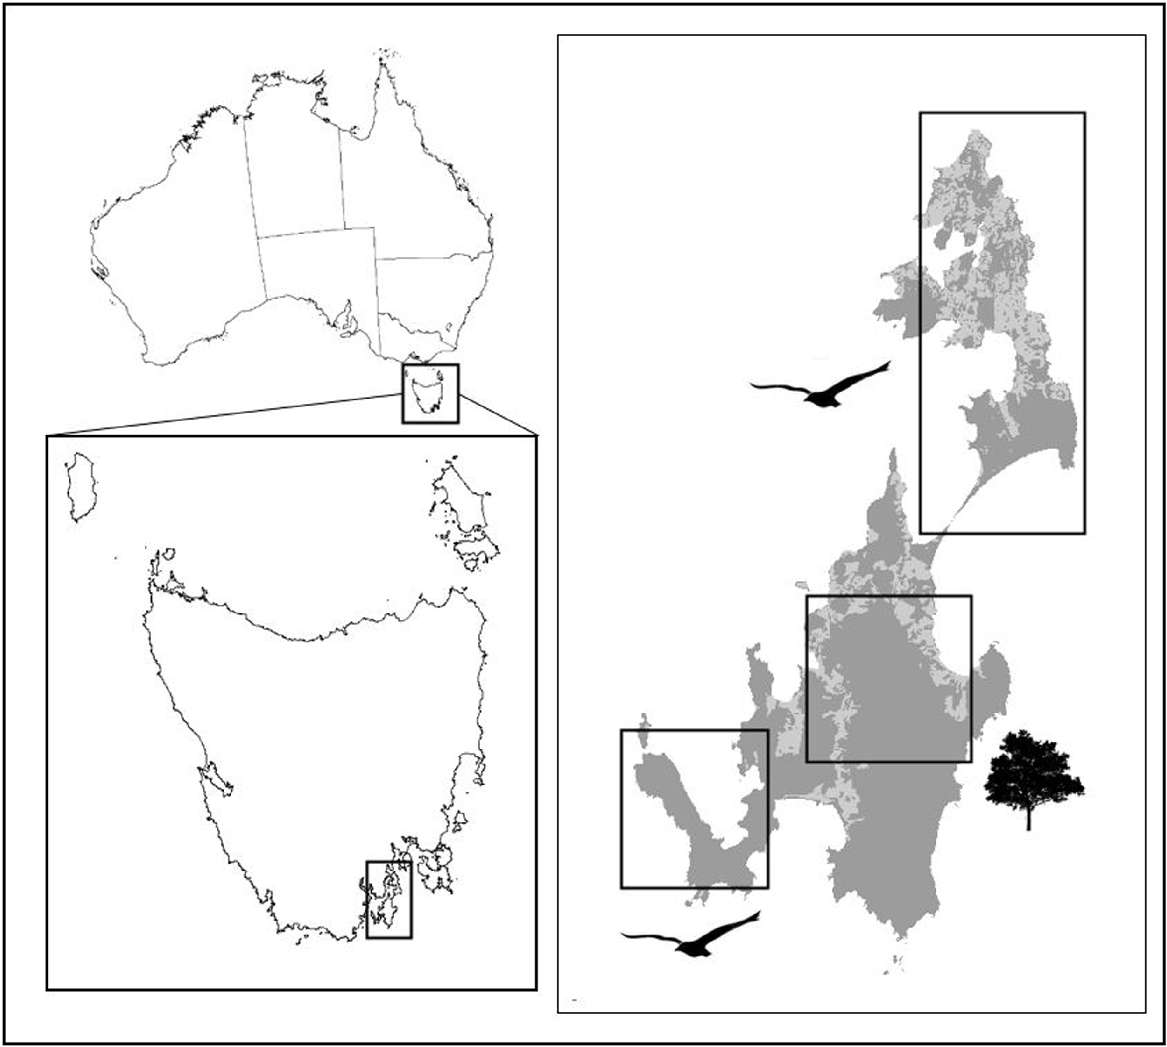
We collared feral cats to study their movements at the following three sites: (1) The Neck and Cape Queen Elizabeth shearwater colonies (hereafter Neck), (2) the Labillardiere Peninsula (hereafter Peninsula) in the south-west, and (3) in the wet forest around Mount Mangana in the south (Fig. 1). Sites 1 and 2 (Neck and Peninsula) have mosaics of coastal heathland, dry coastal forest, saltmarsh and a smaller amount of grassland (sourced from TASVEG, the state government GIS vegetation layer, Department of Primary Industries, Parks, Water and Environment 2013). Both sites have shearwater breeding colonies, with birds present from September to May, comprising adults from late September to late March, with chicks fledging during early May. These two sites differ in topography, where the narrow isthmus of the Neck creates a bottleneck for animal movement between two large land masses, and where the second site is a peninsula (Fig. 1). Site 3 (wet forest) is located on South Bruny and the vegetation is dominated by a mosaic of wet and dry eucalypt forest (Department of Primary Industries, Parks, Water and Environment 2013).
Map of lunawanna-allonnah/Bruny Island, located off the south-east coast of lutruwita/Tasmania, Australia, including the three field sites: The Neck (and North Bruny where cats travelled) and the Labillardiere Peninsula in the south-west, both of which have seabird colonies, and the wet forest on South Bruny. Dark grey is natural vegetation, and light grey is open disturbed vegetation (primarily cleared for livestock pasture).
Field data collection
We captured 29 individual feral cats in wire cage traps baited with chicken neck, chicken liver, or tinned fish between June 2017 and January 2020; seven at the Neck, 18 at the forest site, and four cats at the Peninsula site. We fitted 18 cats that weighed at least 2.6 kg with tracking collars that had both a GPS logger and a VHF transmitter (Telemetry Solutions, Quantum 4000). Three cats were collared at the Peninsula site, eight at the forest site and seven at the Neck. Collars weighed 80 g, ensuring that no cat was fitted with a collar that weighed more than 3% of its bodyweight (following Gannon and Sikes 2007). Collars were equipped with timed-release mechanisms to ensure the collars would drop off in the event we did not recapture them. At the Peninsula and forest sites, GPS units were programmed to attempt a location fix every 30 min for 5 days, then every 6 h for the next 25 days, then repeating this cycle. At the Neck, five GPS units were programmed to attempt a location fix every 2 h, and two GPS units every hour. To fit collars, the cats were first sedated using an intramuscular injection of medetomidine hydrochloride (Medetate©) at a rate of 0.1 mg/kg, the effects of which were reversed using atipamezole hydrochloride (Antipam©) at a rate of 0.5 mg/kg. All cats were then released at their site of capture. Collars were recovered when the cat was recaptured or the cat died in the field. In the forest site, no collars could be recovered after the timed-release mechanism detached because the vegetation and topography was complex, making it very difficult to locate a collar on the ground by using the VHF signal.
Analysis of home range and movement patterns
The data were filtered by removing spurious locations, including those with the horizontal dilution of precision (HDOP) = 9.9 (max. value), elevation >600 m above sea level and negative values of mean sea level, noting that the elevation range from 0 to 570 m across the study area. We then removed location fixes for which the rate of movement from the previous fix was implausible or the turning angle was between 166° and 194° (Bjørneraas et al. 2010), indicating a spike in the movement trajectory most likely to be a fix error. We set the upper plausible threshold for rate of movement at 7.5 km/h by examining sustained movement rates in the tracking data. This combined filtering process removed 5471 of 24,613 location fixes, retaining 77% of the original data.
We ascertained the utilisation distribution (UD) for each individual cat by using biased random-bridge kernels (BRB, Benhamou 2011). BRB is part of a modelling family that quantifies the UD on the basis of an animal’s movement path rather than just individual point. The UD represents the home range by estimating the size of the area used by the animal, but can also provide information regarding how intensely an animal is using different areas within that home range. The use of biased random-bridge kernels (BRBs) minimises the influence of tracking duration compared with older methods, as BRBs focus on the probabilistic utilisation of space on the basis of movement paths rather than assuming uniform space use. This makes BRBs more robust for analysing ranges, even when tracking durations vary. However, shorter tracking periods were still considered cautiously, and any ranges that did not show evidence of stabilisation were excluded from the analysis. We created separate UDs for the seabird breeding (September to May) and non-breeding (May to September) seasons for cats captured at the Neck and Peninsula sites, but just a single UD for cats captured in the forest where cats do not have access to a seabird colony. We calculated 95% and 50% UDs to define home range and core home range of the animal respectively (Laver and Kelly 2008). We used linear models to test the effects of site of capture, of the seabird breeding season and the sex on the different UDs. Three separate analyses were conducted to account for the unbalanced design. The effect of the presence or absence of breeding seabirds at colonies was modelled for the Neck and Peninsula sites only, with season and site as predictor variables. Sex differences in UD were compared with site across the Neck and forest sites only, because the three cats captured at the Peninsula were all males. Site effects were compared against the null model for all three sites.
Home ranges were also estimated using fixed kernel density home range estimation (KDE) with the reference smoothing factor href (recommended by Hemson et al. (2005)) and 100% minimum convex polygons (MCP100, Mohr 1947) for comparability with the broader literature. Although these methods are prone to overestimating the actual area used by an animal and are very sensitive to differences in sampling strategy, duration, and data outliers (Fieberg and Börger 2012), these metrics have been consistently reported in home range studies.
We calculated the average speed per day by averaging the sum of distance of successful fixes divided by the sum of time between those fixes for every day for each individual. We used the average speed per day to account for potential differences owing to fix-time differences or unsuccessful fixes. This speed was used as a proxy of energy spent. We used linear models and a Gaussian distribution to test for the effects of site of capture, sex and seabird breeding season on average speed of cats.
We used multi-model inference in an information theoretic framework (Anderson and Burnham 2004) to rank models. All models with a difference of >6 in Akaike information criterion (ΔAICc) between the best model and the one compared were discarded as non-competitive fits to the data (Richards 2015). Of the remaining competitive models, the more complex versions of models that had simpler, nested versions with smaller AICc values were also excluded to yield the final model set (Richards 2008, 2015). We implemented the BRB, KDE and MCP100 methods using the R packages ‘adehabitatHR’ (ver. 0.4.19; https://cran.r-project.org/web/packages/adehabitatHR/; Calenge 2011) in R (ver. 4.0.2; R Core Team 2020).
We classified the movement paths for each animal into two different movement states by using hidden Markov models (HMMs; Patterson et al. 2008), on the basis of differences in step length and turning angle between successive relocations. These analyses assume that characteristics of the movement path (in this case the speed and tortuosity of movement) are driven by underlying behavioural states. HMM analyses can therefore classify movement paths into approximations of these states, although care should be taken not to over-interpret the biological meaning of the patterns observed (Patterson et al. 2017).
Models were fit separately for each site to allow differences in movement behaviours among populations using cats with 30-min fix schedules. For cats captured at the Neck, only 1-h fix schedules were modelled. Cats followed with 2-h schedules were excluded from the analysis because the time difference between fixes was too long to describe a movement path. Twenty-five model iterations with randomly selected starting values were run for each model set, to determine optimal starting values and to indicate whether maximum likelihood had been approached. Analysis of movement was conducted using the ‘moveHMM’ package (ver. 1.9; https://cran.r-project.org/web/packages/moveHMM/; Michelot et al. 2016) in R statistical environment.
Analysis of habitat selection
We developed a fine-scale habitat map of the study area on the basis of five landscape features that we considered to be likely to influence feral cat habitat selection, namely, roads, hydrological features, vegetation type, seabird colony, and ecotone. The first two features are available from www.theLIST.tas.gov.au©State of Tasmania. We mapped four broad classes of vegetation types, namely wet forest, dry forest, pasture and heath, by using the state-wide vegetation mapping dataset TASVE 3.0 (Department of Primary Industries, Parks, Water and Environment 2013). We calculated the distance to the nearest road, hydrological feature, ecotone and seabird colony (for the Neck and the Peninsula only) with the function ‘gDistance’ from the R package rgeos (ver. 0.6-4; https://CRAN.R-project.org/package=rgeos).
To examine habitat selection by each cat as they moved through the landscape, we quantified the selection ratios for each tracked animal (Manly et al. 2007), by using the Manly selective measure to test for significant differences in used versus available habitat. We used a design III analysis, which recognises that the available habitat differs for each animal. The selection ratio is the proportional use divided by the proportional availability of each habitat attribute class. This index value is <1 or >1 if the area is respectively avoided or selected. Habitat-selection ratios were calculated for each site, sex and seabird breeding season independently, to investigate population differences.
To analyse whether cats selectively focus on a habitat attribute, we estimated the BRB utilisation distribution at 50% UD (representative of use) and 95% UD (animal home range representative of site availability) for each individual cat. We intended here to analyse the habitat attributes that cats focus on more intensively within the habitat they use. This differs from the typical but less precise method that compares the proportion of relocations within each habitat category with the availability of that habitat type in the surrounding area, usually represented by a circular polygon centred on the home range centroid, with radius as the maximum distance of any relocation during the tracking period. Using UD instead of relocations allowed to account for movement behaviour between fixes, and consequently identify a more general use of habitat, even when in movement. All calculations were performed using the ‘adehabitatHS’ package (ver. 0.3.18; https://cran.r-project.org/web/packages/adehabitatHS/; Calenge 2011) in the R statistical environment.
Ethics statements
This work was conducted under the University of Tasmania Animal Ethics Permits and Natural Resources and Environment Animal Ethics Permit: A0016370 and A0017365 and 7/2020-2; Department of Primary Industries, Parks, Water and Environment Permits: FA17040 and FA18156, and with authority to undertake research on Forest, Crown and Park lands.
Results
Data suitable for analysis were recovered from 17 of the 19 collared cats, including four males and three females at the Neck, three males and zero females at the Peninsula site and five males and two females at the forest site. Although five collars could not be recovered, we were able to collect at least some of the data remotely by using the UHF remote download function of the collars. Collars from two cats returned insufficient location fixes to describe home range use with fewer than 3 days of data (Supplementary Table S1). Two cats collared at the Peninsula site died during the study, both ~40 days after they were collared and about 2 months after the seabirds left on migration from the Peninsula colony. None of the 12 cats recovered alive or dead showed any signs of abrasion or other injury in the vicinity of the collar on their neck. Seven cats (one at the Peninsula and six at the Neck) were successfully followed during both seabird breeding season and pre-/post-breeding season. The proportion of missing data was 60, 39 and 19% for the forest, the Neck and the Peninsula sites respectively, but this reduction was buffered by the long-time frame of the study, in which data from individual animals ranged from 22 to 342 days (mean duration = 183 days), with 83–3093 successful fixes per individual (mean = 1125; Table S1). The large missing data rate in the forest could affect the interpretation of the UD, which means that the habitat selection analysis in the forest should be interpreted with caution.
Home range and speed
Home range size, estimated using the BRB utilisation distribution, varied considerably among individual cats. Home range sizes varied from 78 ha (Cat ID: Cs21) to 1896 ha (Cat ID: Cs22), on the basis of the 95% UD, with an average of 612 ha (Tables 1, S1), with core home ranges (UD50) ranging from 6 to 420 ha, with an average of 87 ha.
| Item | BRB50 | BRB95 | |
|---|---|---|---|
| Forest (n = 5) | 147.30 ± 39.4 | 824.3 ± 161.7 | |
| Neck (n = 13) | 64.47 ± 30.56 | 553.38 ± 216.18 | |
| Peninsula (n = 4) | 53.1 ± 14.4 | 431.7 ± 163.1 | |
| Male (n = 12) | 139.0 ± 36.4 | 968.0 ± 205.0 | |
| Female (n = 8) | 24.8 ± 8.47 | 168.0 ± 42.4 | |
| Seabird breeding (n = 7) | 32.5 ± 7.62 | 356.0 ± 103.4 | |
| Seabird no breeding (n = 10) | 82.29 ± 38.86 | 642.86 ± 276.23 | |
| Total (n = 24) | 86.72 ± 21.27 | 612.13 ± 129.09 |
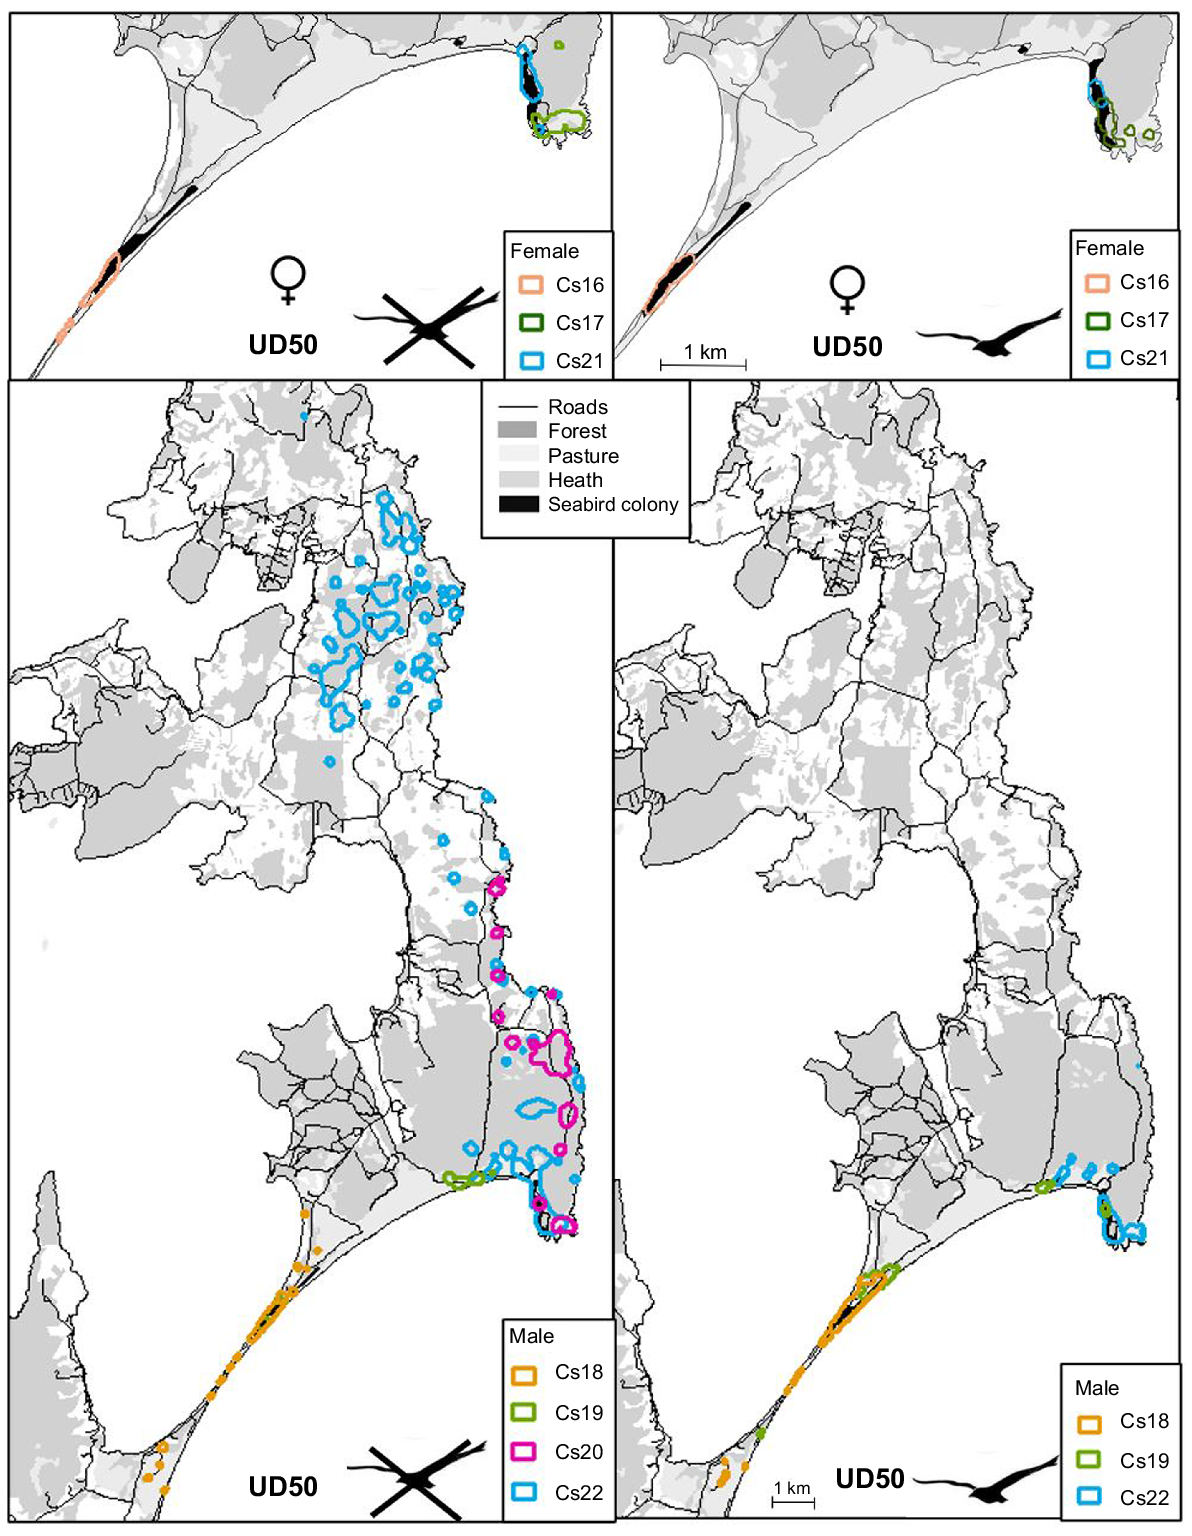
Male home ranges and core home ranges were consistently larger than those of females within each site, being approximately 3.4 and 7 times larger at the forest and Neck sites respectively (Table 2, Figs 2, 3). The final model sets for analysis of core (50% UD) and full (95% UD) home range size by sex at the forest and Neck sites, where both sexes were collared, included the sex by site interaction term because male home ranges were larger at the Neck than in the forest, whereas female home ranges did not differ between these sites to the same extent (Table 2, Figs 2, 3). Cat home range and core home range sizes were approximately 2.5 and 1.7 times larger at the forest site than at the Neck and the Peninsula (Tables 1, 2, Figs 2, 3). Finally, the size of the core home ranges and home range of cats living around the seabird colony were 2.5 times and 1.8 times smaller respectively, when the seabirds were present and breeding at the colony, than when the birds were not present. The statistical results, which were split across three separate analyses to account for the lack of female cats collared on the Peninsula, obscured the interesting result that at least one male cat (bodyweight 4.6 kg) travelled widely across the eastern half of North Bruny in the seabird non-breeding season, when there were no birds in the colony (Fig. 2).
| Model | Model description | Estimate | |||||||||
|---|---|---|---|---|---|---|---|---|---|---|---|
| Core home range | |||||||||||
| UD50 ~ Season | d.f. | AICc | dAICc | AICcwt | Intercept (Neck + bird) | Site (Peninsula) | Season (no bird) | Site × season | |||
| Model 3 | 6 | 182.27 | 0 | 0.96 | 31.03 ± 44.54 | 9.67 ± 109.52 | 62.39 ± 53.25 | −46.80 ± 125.28 | |||
| Model 2 | 5 | 188.92 | 6.65 | 0.03 | 35.60 ± 38.62 | −24.72 ± 60.11 | 54.11 ± 45.84 | ||||
| UD50 ~ Site | d.f. | AICc | dAICc | AICcwt | Intercept (forest) | Site (Neck) | Site (Peninsula) | ||||
|---|---|---|---|---|---|---|---|---|---|---|---|
| Model 1 | 5 | 272.4 | 0 | 1 | 147.30 ± 38.24 | −82.34 ± 48.50 | −131.86 ± 74.74 | ||||
| Model 0 | 3 | 289.22 | 16.82 | 0 | 88.98 ± 22.21 |
| UD50 ~ Sex | d.f. | AICc | dAICc | AICcwt | Intercept (forest + female) | Site (Neck) | Sex (male) | Sex × site | |||
|---|---|---|---|---|---|---|---|---|---|---|---|
| Model 3 | 6 | 217.17 | 0 | 0.97 | 53.33 ± 70.59 | −38.07 ± 81.74 | 131.56 ± 83.52 | −40.15 ± 100.63 | |||
| Model 2 | 5 | 224.19 | 7.02 | 0.03 | 73.23 ± 48.83 | −64.60 ± 46.26 | 103.71 ± 45.03 | – |
| Home range | |||||||||||
|---|---|---|---|---|---|---|---|---|---|---|---|
| UD95 ~ Season | d.f. | AICc | dAICc | AICcwt | Intercept (Neck + bird) | Site (Peninsula) | Season (no bird) | Site × season | |||
| Model 3 | 6 | 233.23 | 0 | 0.99 | 359.46 ± 298.36 | −15.13 ± 770.59 | 358.71 ± 341.60 | −235.88 ± 828.28 | |||
| Model 2 | 5 | 243.59 | 10.37 | 0.01 | 381.4 ± 280.3 | −191.0 ± 452.4 | 318.8 ± 295.1 | ||||
| UD95 ~ Site | d.f. | AICc | dAICc | AICcwt | Intercept (forest) | Site (Neck) | Site (Peninsula) | ||||
|---|---|---|---|---|---|---|---|---|---|---|---|
| Model 1 | 5 | 349.43 | 0 | 1 | 824.4 ± 243.2 | −268 ± 315.5 | −384.3 ± 419.6 | ||||
| Model 0 | 3 | 371.39 | 21.96 | 0 | 625.9 ± 137.4 |
| UD95 ~ Sex | d.f. | AICc | dAICc | AICcwt | Intercept (forest + female) | Site (Neck) | Sex (male) | Sex × site | |||
|---|---|---|---|---|---|---|---|---|---|---|---|
| Model 3 | 6 | 273.94 | 0 | 0.99 | 298.98 ± 418.9 | −174.7 ± 490.3 | 735.5 ± 495.6 | 57.84 ± 604.45 | |||
| Model 2 | 5 | 284.38 | 10.45 | 0.01 | 270.7 ± 291.8 | −163.2 ± 276.9 | 775.1 ± 273.2 |
| Average speed | |||||||||||
|---|---|---|---|---|---|---|---|---|---|---|---|
| Intercept | Site (Neck) | Site (Peninsula) | Sex (male) | Season (no bird) | Sex × season | ||||||
| Model 9 | 4 | −1101.25 | 0 | 0.71 | 0.06 ± 0.03 | – | – | 0.12 ± 0.03 | – | – | |
| Model 5 | 6 | −1098.53 | 2.73 | 0.18 | 0.13 ± 0.03 | −0.09 ± 0.02 | −0.11 ± 0.04 | 0.11 ± 0.02 | – | – | |
| Model 4 | 5 | −1096.58 | 4.67 | 0.07 | 0.05 ± 0.02 | – | – | 0.12 ± 0.03 | 0.02 ± 0.009 | – | |
Home range calculated with biased random bridge at 50% utilisation distribution (UD50), for male (♂) and female (♀), during the seabird breeding season (represented by a plain bird) and pre-/post-breeding season (represented by a crossed bird), a the Neck site.
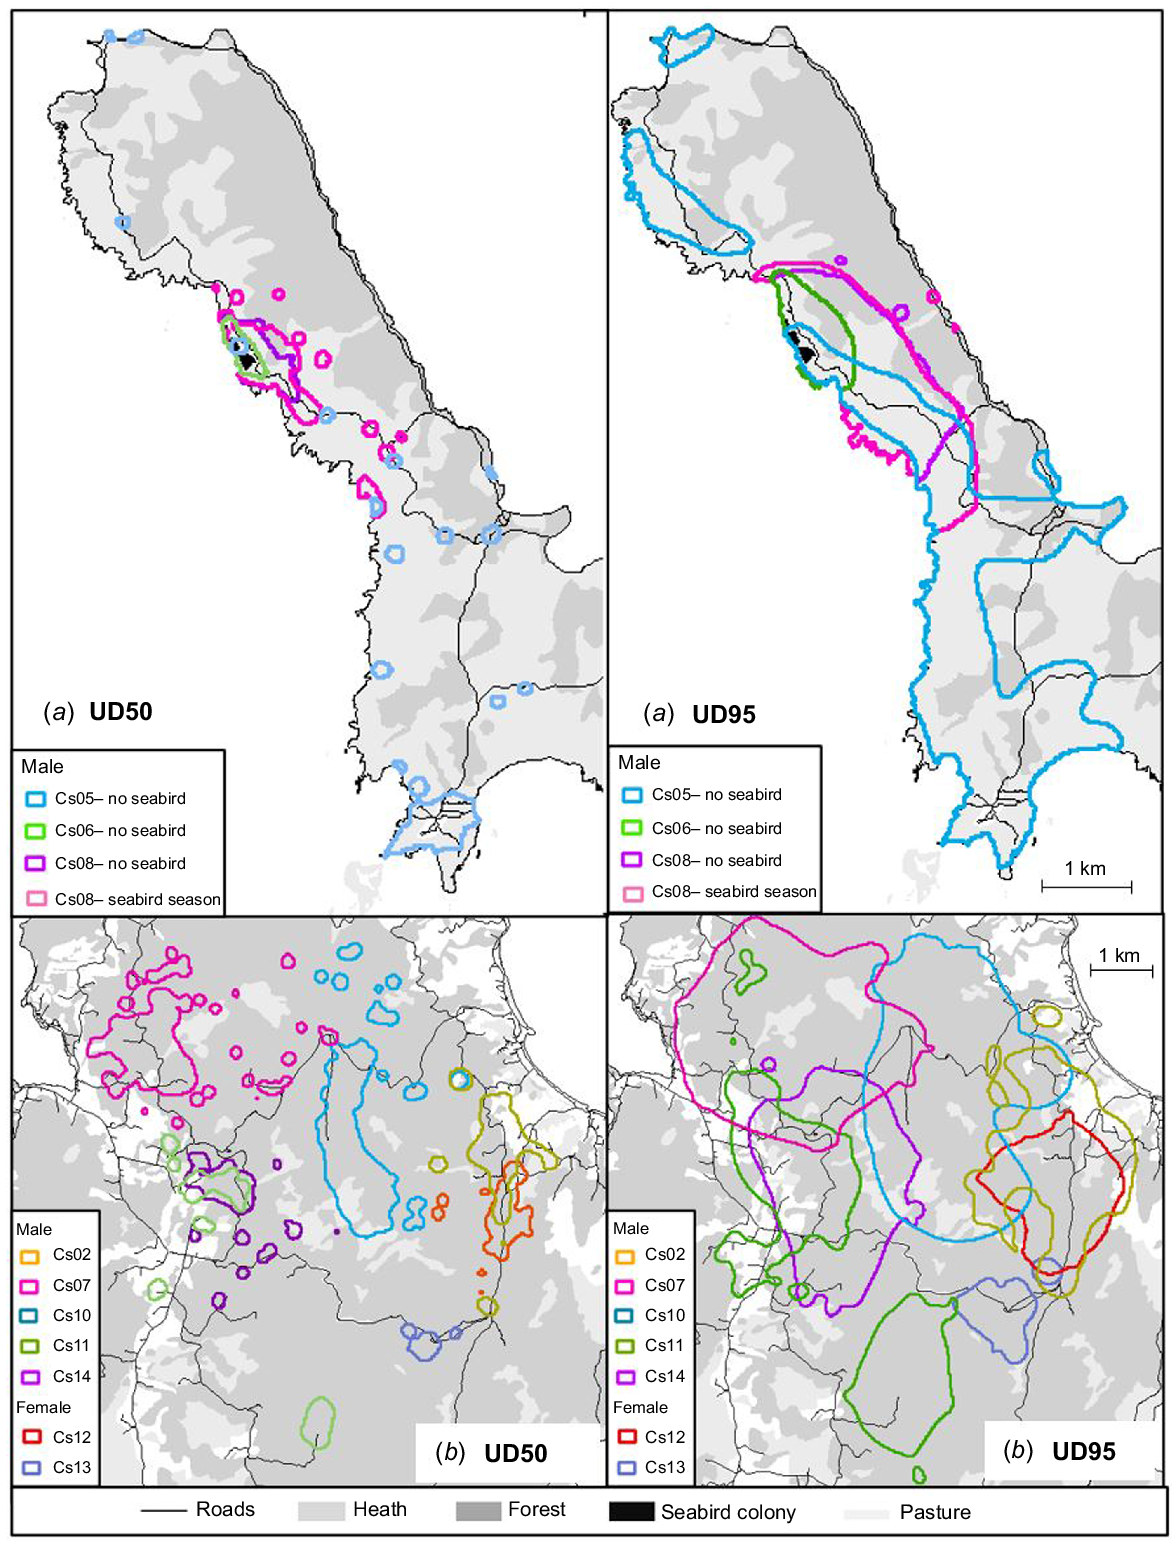
Home range calculated with biased random bridge at 50% utilisation distribution (UD50) and 95% (UD95), at the Peninsula (a) and Forest (b) sites.
In the analysis of average speed travelled per day, the final model set included three models of which the univariate model containing sex was the highest-ranked model and carried 71% of the AIC model weight. The second model included site, sex and season as predictors, was separated by 2.73 AIC points from the top model, and carried only 18% of the AIC weight. The third model carried very little weight. Cats in the forest moved at a higher average speed per day, than did cats on the Neck and the Peninsula. Male cats had a higher average speed per day than did females. Cats in the seabird non-breeding season had a higher speed per day than during the breeding season, although the effect of season was smaller than the influence of sex and site.
Hidden Markov models
The movement behaviour of cats was described by two states within all three of the sites studied. State 1, labelled ‘short movement’, comprising short tortuous movements, and state 2, labelled ‘travelling’, was a faster and more direct travelling movement (Table 3). Step length differed among sites for both of these movement states. Step lengths for both short movement and travelling states were larger for cats in the forest than for those in the Neck or Peninsula sites (Table 3). Turning angles were consistent across sites for each of the two movement states.
| Site | States | Description | Step length (m) | Turning angle (radians) | |
|---|---|---|---|---|---|
| Peninsula | 1 (0.5 h) | ‘Short movement’ | 19.00 ± 16.11 | 3.02 ± 0.42 | |
| 2 (0.5 h) | ‘Travelling’ | 180.59 ± 167.04 | −0.01 ± 0.35 | ||
| Forest | 1 (0.5 h) | ‘Short movement’ | 49.56 ± 42.87 | −3.04 ± 0.43 | |
| 2 (0.5 h) | ‘Travelling’ | 278.06 ± 237.76 | −0.08 ± 0.28 | ||
| Neck | 1 (1 h) | ‘Short movement’ | 6.96 ± 5.11 | 3.12 ± 0.69 | |
| 2 (1 h) | ‘Travelling’ | 183.04 ± 199.23 | 0.07 ± 0.19 |
For each site, movement is classified into two behavioral states: ‘short movement,’ characterised by small step lengths and high turning angles, and ‘travelling,’ characterised by longer step lengths and lower turning angles. Step length represents the average distance moved per time step, with variability expressed as mean ± s.d. Turning angle (in radians) indicates directional changes, with positive values indicating counterclockwise movement and negative values indicating clockwise movement. Time steps are 0.5 h for Peninsula and Forest sites, and 1 h for the Neck site.
Habitat selection
There was considerable variation in the relative availability of different landscape features among sites and individual home ranges. Results also showed variation in selection of landscape features by individual cats, indicated by variation in the confidence intervals for different features in Fig. 4. These strong but variable habitat preferences among individual cats lead to weak habitat selection at the population level.
Habitat preference of feral cats at the population level between (a) sites, (b) seabird breeding season, and (c) sex. Points represent individual tracked animals, black points represent the average for the population and confidence interval. The dashed central line indicates a selection ratio of 1 (neutral), where the habitat type was used in proportion to its availability. A selection ratio of 2 indicates that the habitat type was used twice as often as expected, whereas a selection ratio of 0.5 indicates that the habitat type was used half as often as expected on the basis of its availability in the home range.
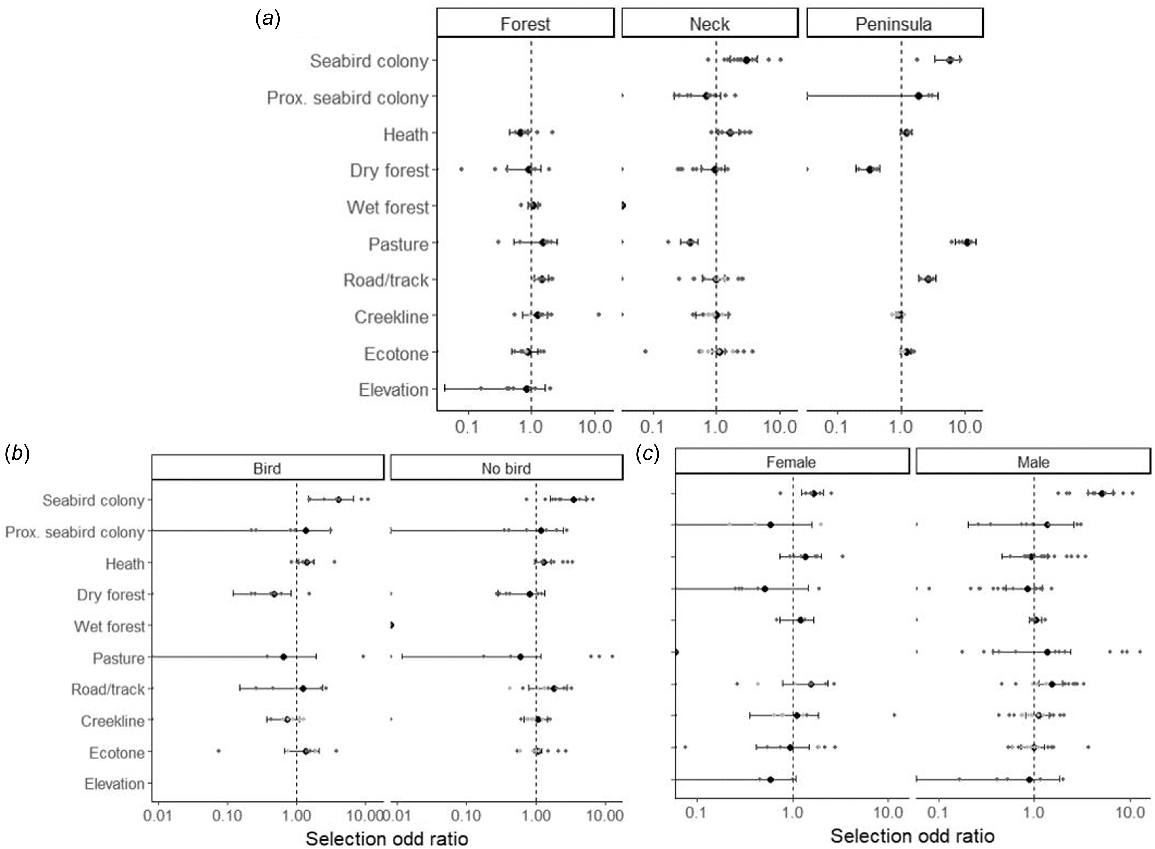
Within their home range, cats from the neck and the peninsula showed a strong preference for being in the seabird colony and not in the environs adjacent to the colony (Fig. 4a). At both these seabird sites, cats preferred heath vegetation, but then diverged in their preferences, with Peninsula cats preferring pasture and avoiding dry forest, and Neck cats avoiding pasture and being indifferent to dry forest. In the forest site, cats avoided heath and did not select any other vegetation type. Cats on the Peninsula and in the forest selected roads and tracks within their core home range, with no preference shown by Neck cats. Creeklines were neither avoided or selected by cats at any site, which means that cats were using creeklines in accordance with their availability. Ecotones were selected only on the Peninsula site, although this apparent preference could reflect the geography of the peninsula and that cats avoided dry forest and preferred heath (Fig. 4a). The only seasonal difference in preferences was a stronger avoidance of dry forest when seabirds were breeding. Cats preferred the seabird colony over the surrounding area during both seabird breeding and non-breeding seasons (Fig. 4b). The only sex difference was a stronger preference for roads and tracks by males (Fig. 4c).
Discussion
A highly adaptable and globally widespread invasive predator, feral cat, optimises its foraging behaviour to enhance food acquisition and this behaviour influences its movement patterns, the structure of its home range and its spatial distribution and, ultimately, the efficacy of control measures used to manage the species at a landscale scale (Bengsen et al. 2016). The novelty in our study is to show how cats respond in their movement and space use to spatial and temporal contrasts in productivity across an entire island.
Cat home ranges and movements were smallest in the high-productivity situation of a seasonally breeding seabird colony and largest in wet forest, a vegetation type typically not associated with cats in Australia (unpubl. data, SC). Cats in this lower productivity wet forest environment travelled further and faster per unit time and intensively used anthropogenic features such as tracks and roads, whereas cats in food-rich seabird colonies avoided these, limiting their movements to within the confines of the colony. The seabird colonies provide a rich food resource during the breeding season and a lagged productivity pulse with increased rodent recruitment after the birds leave (Scomparin et al. 2023). However, one male cat responded to this seasonal change in productivity by travelling extensively back and forth across North Bruny, an area with very low density of cats and staple prey such as rabbits or pademelons (Thylogale billardierii) (unpubl. data, SC).
Our work has provided one of the first insights into the spatial ecology of feral cats in Australian wet forest, a vegetation type rarely observed to support the high densities of cats we found here (Buckmaster 2012; unpubl. data, SC), although this habitat appeared challenging to collect GPS data. The home range sizes of cats living in the wet forests on Bruny Island (males, n = 5, 1034 ha; females, n = 2, 299 ha) are comparable with those of cats living in diverse but potentially also lower productivity habitats elsewhere in Australia, such as in open bushland (males = 11,200 ha; females = 720 ha, Hilmer 2010) and in arid areas (males = 13,500 ha; females = 700 ha, Burrows et al. 2003). In a review of cat densities globally, Bengsen et al. (2016) showed that home range sizes of feral cats vary widely across environments and scale negatively with landscape productivity and cat density. The relationship between home range and density (0.77–1.52 cats/km2, unpubl. data, SC) of cats in wet forest on Bruny Island conformed with the findings of Bengsen et al. (2016). Our study confirmed, with Rees et al. (2019), the ability of cats to live at a high density in wet forests in Australia. We suggest that cats living in wet forest on Bruny Island may be able to capitalise on the abundant native pademelons to achieve this density (unpubl. data, SC). Pademelons represent a large prey species (4.6–6.5 kg) for a cat, but cats are capable of killing them (Fancourt 2015). The presence of small mammals, such as swamp rats (Rattus lutreolus), antechinus (Antechinus spp), and pygmy possums (Cercartetus lepidus), may also contribute to the abundance of cats in this habitat. In contrast to the rich food resource in seabird colonies, cats in this wet forest need to move further and faster to encounter sufficient prey. Analysis of cat diet in wet forest will further elucidate the ecology and impacts of cats in these diverse and atypical environments (Buckmaster 2012).
Where prey density is low, predators use an extensive search mode, whereby rapid, straight-line travel can minimise the time spent travelling between richer patches and reduce search effort (Valeix et al. 2009). Roads and tracks provide the opportunity to increase hunting efficacy. Indeed, it is thought that roads enable invasive predators to access otherwise remote prey populations (May and Norton 1996). Positive associations between roads and cat occurrence have been demonstrated widely, in Australia (Towerton et al. 2016), Europe (Ruiz-Capillas et al. 2013) and in North America (Silva et al. 2009). Cats in wet forest on Bruny Island both increased their movement speed and spatial extent (home range) of movement and used roads and tracks to a much greater extent than did cats in the prey-rich seabird colonies. Although the methods used could have under estimated the movement in the forest because of high fix failure rate. Roads provide easy travel where the wet forest vegetation is dense and vehicle traffic and human presence is low. While some individual cats in the seabird colony selected for roads, most cats in this more productive and human-active environment used roads and tracks in proportion to their availability. Perceptions of prey abundance and distribution can dictate directly which mode of search behaviour is employed, and may have an important effect on the predator behavioural decisions around seasonal changes in food availability (Valeix et al. 2009).
In seasonally productive environments, predators face a dilemma between maintaining fixed home ranges, which may increase the risk of starvation during periods of lower productivity, and a flexible strategy in which ranging activity contracts and expands in response to changes in resource availability, but which may be costly to maintain (Lima 1984). Individual cats in our study followed both strategies, although fixed home ranges were more frequent. Three individual males made extensive movements from their release point when prey became scarce, but the behaviour of one male is noteworthy. A few days after the last shearwaters fledged and left the colony on their northern migration, a 4.6 kg male cat commenced extra-territorial movements, making 10 trips of between 10 and 16 km in distance and 4–17 days in duration. These trips covered the eastern half of North Bruny, returning to the seabird colony between each trip, until staying in the colony as a resident when the seabirds arrived for the next breeding season. Long-distance movements in feral cats can be characterised as ranging behaviour, with individuals moving over broad scales in response to condition-dependent factors such as competition, predation risk, breeding status, energy reserves or other factors (Roshier et al. 2008; Jansen et al. 2021). Whereas the initial motivation for leaving the seabird colony was likely to be in response to the reduction in food supply, the back-and-forth behaviours suggest one or a combination of the following factors to be in play: (1) the prey resources are less abundant in the travelled area than in the original region (the seabird colony); (2) the absence of mating partners in the travelled region; or (3) increased competition in the original home range. Although disentangling these factors was beyond the scope of our study, we believe that all three factors might contribute to the decisions by these male cats to travel. Reduced prey density and increased competition following seabird departure might initiate long-distance movement decisions and reduced mating opportunities might bring them back. Cat density is very low on North Bruny, possibly resulting from a novel trophic cascade, in which biocontrol of rabbits has reduced the density of this staple prey for cats to a low level, at which a native mesopredator, the eastern quoll, with the advantage of high bioclimatic suitability, may be able to keep rabbits populations so low that cats cannot survive at any but extremely low densities (unpubl. data, SC). The combination of these factors may drastically increase the energy expenditure of individual cats adventuring onto North Bruny for little gain in mating opportunities, thus discouraging them from establishing residence.
Finally, we observed more differences in habitat selection among sites than between sex or season, although there were large variations among individuals. When seabirds depart the breeding colonies on migration, cats increase the size of their home range, but the only change in habitat selection is a relaxation of avoidance of dry forest, where cats do not venture during the seabird breeding season because the birds maintain nesting burrows in more open heathland and sand dune habitats. Sexual dimorphism was apparent in habitat selection and home range size. Males have larger home ranges and use tracks and roads more than females, consistent with published studies and expectation of the polygynous mating system of cats (Bengsen et al. 2016). Larger home ranges are advantageous to males in allowing them to gain access to multiple females during the breeding season (Kerby and Macdonald 1988). Some home ranges overlap broadly, up to 100% between a male and a female, although home range overlaps may be under-represented because we may have not captured and collared all cats present at each site.
The analysis of the movement patterns and home range strategies provides critical information to land managers on the control and management of invasive species on island ecosystems. The challenges of invasive predator control in high productivity areas is with the efficacy of control tools used. The use of scent or food based lures during periods of high productivity to attract feral cats is likely to be uneffective owing to an over abundance of food. The use of passive tools such as the Felixer® grooming traps and thermal assisted ground shooting may be highly effectively in these circumstances (Read et al. 2019). Using the high productivity areas, such as seabird colonies that act as a temporal and spatial focal point for feral cats, to implement intensive control measures may provide effective management beyond the immediate control site and have similar outcomes to a broader landscape scale control program.
Conclusions
Feral cats express individual variation in their movement behaviour and space use, as well as behavioural plasticity, which have important implications for food web dynamics and could also complicate cat management for conservation. Focal points of high productivity in the landscape can be effective pinch points for the control of invasive predators. Food-rich patches such as seabird colonies support very high cat densities; however, the highly focused movements and small home ranges of these cats lend this situation to effective control through trapping and shooting operations. Seasonally productive environments such as seabird colonies present a risk to native wildlife because of the potential for prey-switching when the seabirds depart on migration, but also an opportunity for management because cats will be hungry and so are more easily captured then. Cats living in low productivity environments such as in wet forest (Otways, Rees et al. 2019; Bruny, unpubl. data, SC) present a greater challenge for control. These environments are more difficult to access for control operations and the cats move more extensively. Behavioural plasticity in cats increases the difficulty of monitoring and managing this destructive invasive predator. For instance, targeted trapping along roadsides might increase capture success but may not be effective in reducing the population, because many individuals will avoid roads. An understanding of the behavioural decisions of invasive predators in the context of large-scale temporal and spatial patterns of productivity and food resources is important for estimating risk to native species and for devising control strategies.
Data availability
The data that support this study will be shared upon reasonable request to the corresponding author.
Conflicts of interest
Cyril Scomparin reports financial support was provided by Kingborough Council. Cyril Scomparin reports financial support was provided by Bruny Island Coastal Retreats. Cyril Scomparin reports financial support was provided by Pennicott Wilderness Journeys.
Declaration of funding
The project was partly funded by the Australian Research Council (ARC DP170101653 to M. J.). Funding was also provided by the Australian Governement, National Landcare Programme, Local Programmes (grant ID 4100001525). C. S. was supported by a University of Tasmania PhD Scholarship and a top-up scholarship from Kingborough council, Bruny Island Coastal Retreats, and Pennicott Wilderness Journeys.
Author contributions
C. S. and M. E. J. conceived and designed, and M. E. J. coordinated the study for two sites and C. S. collected the data for those sites. M. D. P. conceived, designed, collected the data, and coordinated the study for one of the sites. C. S. conducted the analysis and drafted the manuscript. All authors participated in manuscript modifications.
Acknowledgements
We thank Kaylene Allen, Brett Woodruff, Conrad Daniels, of the Bruny Island Cat Management Program, Kingborough Council, and many volunteers for assistance in the field. We thank also Tasmanian Land Conservancy, Bruny Island Coastal Retreats, South Bruny Islands Parks and Wildlife and private landowners for access to properties.
References
Alterio N, Moller H, Ratz H (1998) Movements and habitat use of feral house cats Felis catus, stoats Mustela erminea and ferrets Mustela furo, in grassland surrounding yellow-eyed penguin Megadyptes antipodes breeding areas in spring. Biological Conservation 83(2), 187-194.
| Crossref | Google Scholar |
Balme GA, Hunter LTB, Slotow R (2009) Evaluating methods for counting cryptic carnivores. The Journal of Wildlife Management 73(3), 433-441.
| Crossref | Google Scholar |
Bengsen AJ, Algar D, Ballard G, Buckmaster T, Comer S, Fleming PJS, Friend JA, Johnston M, McGregor H, Moseby K, Zewe F (2016) Feral cat home-range size varies predictably with landscape productivity and population density. Journal of Zoology 298(2), 112-120.
| Crossref | Google Scholar |
Benhamou S (2011) Dynamic approach to space and habitat use based on biased random bridges. PLoS ONE 6(1), e14592.
| Crossref | Google Scholar |
Bjørneraas K, Van Moorter B, Rolandsen CM, Herfindal I (2010) Screening global positioning system location data for errors using animal movement characteristics. The Journal of Wildlife Management 74(6), 1361-1366.
| Google Scholar |
Bonnaud E, Medina FM, Vidal E, Nogales M, Tershy B, Zavaleta E, Donlan CJ, Keitt B, Le Corre M, Horwath SV (2011) The diet of feral cats on islands: a review and a call for more studies. Biological Invasions 13(3), 581-603.
| Crossref | Google Scholar |
Burrows ND, Algar D, Robinson AD, Sinagra J, Ward B, Liddelow G (2003) Controlling introduced predators in the Gibson Desert of Western Australia. Journal of Arid Environments 55(4), 691-713.
| Crossref | Google Scholar |
Doherty TS, Dickman CR, Johnson CN, Legge SM, Ritchie EG, Woinarski JCZ (2017) Impacts and management of feral cats Felis catus in Australia. Mammal Review 47(2), 83-97.
| Crossref | Google Scholar |
Driessen MM, Carlyon K, Gales R, Mooney N, Pauza M, Thurstans S, Visoiu M, Wise P (2011) Terrestrial mammals of a sheep-grazing property on Bruny Island, Tasmania. Papers and Proceedings of the Royal Society of Tasmania 145, 51-64.
| Google Scholar |
Duncan C, Nilsen EB, Linnell JDC, Pettorelli N (2015) Life-history attributes and resource dynamics determine intraspecific home-range sizes in Carnivora. Remote Sensing in Ecology and Conservation 1(1), 39-50.
| Crossref | Google Scholar |
Fancourt BA (2015) Making a killing: photographic evidence of predation of a Tasmanian pademelon (Thylogale billardierii) by a feral cat (Felis catus). Australian Mammalogy 37(1), 120-124.
| Crossref | Google Scholar |
Fieberg J, Börger L (2012) Could you please phrase ‘home range’ as a question? Journal of Mammalogy 93(4), 890-902.
| Crossref | Google Scholar |
Gannon WL, Sikes RS (2007) Animal Care and Use Committee of the American Society of Mammalogists. Guidelines ofthe American Society of Mammalogists for the use of wild mammals in research. Journal of Mammalogy 88(3), 809-823.
| Google Scholar |
Hamer RP, Gardiner RZ, Proft KM, Johnson CN, Jones ME (2021) A triple threat: high population density, high foraging intensity and flexible habitat preferences explain high impact of feral cats on prey. Proceedings of the Royal Society B: Biological Sciences 288(1942), 20201194.
| Crossref | Google Scholar |
Hemson G, Johnson P, South A, Kenward R, Ripley R, McDonald D (2005) Are kernels the mustard? Data from global positioning system (GPS) collars suggests problems for kernel home-range analyses with least-squares cross-validation. Journal of Animal Ecology 74, 455-463.
| Crossref | Google Scholar |
Herfindal I, Linnell JDC, Odden J, Nilsen EB, Andersen R (2005) Prey density, environmental productivity and home-range size in the Eurasian lynx (Lynx lynx). Journal of Zoology 265(1), 63-71.
| Crossref | Google Scholar |
Jansen J, McGregor H, Axford G, Dean AT, Comte S, Johnson CN, Moseby KE, Brandle R, Peacock DE, Jones ME (2021) Long-distance movements of feral cats in semi-arid South Australia and implications for conservation management. Animals 11(11), 3125.
| Crossref | Google Scholar |
Johnson DH (1980) The comparison of usage and availability measurements for evaluating resource preference. Ecology 61(1), 65-71.
| Crossref | Google Scholar |
Laver PN, Kelly MJ (2008) A critical review of home range studies. The Journal of Wildlife Management 72(1), 290-298.
| Crossref | Google Scholar |
Lawrence S, Tucker C (2002) Sources of meat in colonial diets: faunal evidence from two nineteenth century Tasmanian whaling stations. Environmental Archaeology 7(1), 23-34.
| Crossref | Google Scholar |
Lima SL (1984) Territoriality in variable environments: a simple model. The American Naturalist 124(5), 641-655.
| Crossref | Google Scholar |
Lima SL, Zollner PA (1996) Towards a behavioral ecology of ecological landscapes. Trends in Ecology & Evolution 11(3), 131-135.
| Crossref | Google Scholar | PubMed |
Luque GM, Bellard C, Bertelsmeier C, Bonnaud E, Genovesi P, Simberloff D, Courchamp F (2014) The 100th of the world’s worst invasive alien species. Biological Invasions 16(5), 981-985.
| Crossref | Google Scholar |
May SA, Norton TW (1996) Influence of fragmentation and disturbance on the potential impact of feral predators on native fauna in Australian forest ecosystems. Wildlife Research 23(4), 387-400.
| Crossref | Google Scholar |
Medina FM, Bonnaud E, Vidal E, Tershy BR, Zavaleta ES, Josh Donlan C, Keitt BS, Corre M, Horwath SV, Nogales M (2011) A global review of the impacts of invasive cats on island endangered vertebrates. Global Change Biology 17(11), 3503-3510.
| Crossref | Google Scholar |
Michelot T, Langrock R, Patterson TA (2016) moveHMM: an R package for the statistical modelling of animal movement data using hidden Markov models. Methods in Ecology and Evolution 7(11), 1308-1315.
| Crossref | Google Scholar |
Mitchell MS, Powell RA (2004) A mechanistic home range model for optimal use of spatially distributed resources. Ecological Modelling 177(1-2), 209-232.
| Crossref | Google Scholar |
Mohr CO (1947) Table of equivalent populations of North American small mammals. The American Midland Naturalist 37(1), 223-249.
| Crossref | Google Scholar |
Molsher R, Newsome A, Dickman C (1999) Feeding ecology and population dynamics of the feral cat (Felis catus) in relation to the availability of prey in central-eastern New South Wales. Wildlife Research 26(5), 593-607.
| Crossref | Google Scholar |
Moseby KE, Stott J, Crisp H (2009) Movement patterns of feral predators in an arid environment: implications for control through poison baiting. Wildlife Research 36(5), 422-435.
| Crossref | Google Scholar |
Nathan R, Getz WM, Revilla E, Holyoak M, Kadmon R, Saltz D, Smouse PE (2008) A movement ecology paradigm for unifying organismal movement research. Proceedings of the National Academy of Sciences 105(49), 19052-19059.
| Crossref | Google Scholar |
Nilsen EB, Herfindal I, Linnell JDC (2005) Can intra-specific variation in carnivore home-range size be explained using remote-sensing estimates of environmental productivity? Écoscience 12(1), 68-75.
| Crossref | Google Scholar |
Norbury GL, Norbury DC, Heyward RP (1998) Space use and denning behaviour of wild ferrets (Mustela furo) and cats (Felis catus). New Zealand Journal of Ecology 22, 149-159.
| Google Scholar |
Nottingham CM, Buckley HL, Case BS, Glen AS, Stanley MC (2022) Factors affecting home range size of feral cats. New Zealand Journal of Ecology 46(2), 3476.
| Crossref | Google Scholar |
Patterson TA, Thomas L, Wilcox C, Ovaskainen O, Matthiopoulos J (2008) State–space models of individual animal movement. Trends in Ecology & Evolution 23(2), 87-94.
| Crossref | Google Scholar | PubMed |
Patterson TA, Parton A, Langrock R, Blackwell PG, Thomas L, King R (2017) Statistical modelling of individual animal movement: an overview of key methods and a discussion of practical challenges. AStA Advances in Statistical Analysis 101(4), 399-438.
| Crossref | Google Scholar |
R Core Team (2020) ‘R: a language and environment for statistical computing.’ (R Foundation for Statistical Computing: Vienna, Austria). Available at https://www.R-project.org/
Read JL, Bowden T, Hodgens P, Hess M, McGregor H, Moseby K (2019) Target specificity of the felixer grooming ‘trap’. Wildlife Society Bulletin 43(1), 112-120.
| Crossref | Google Scholar |
Recio MR, Mathieu RS, Maloney R, Seddon PJ (2010) First results of feral cats (Felis catus) monitored with GPS collars in New Zealand. New Zealand Journal of Ecology 34(3), 288-296.
| Google Scholar |
Rees MW, Pascoe JH, Wintle BA, Le Pla M, Birnbaum EK, Hradsky BA (2019) Unexpectedly high densities of feral cats in a rugged temperate forest. Biological Conservation 239, 108287.
| Crossref | Google Scholar |
Richards SA (2008) Dealing with overdispersed count data in applied ecology. Journal of Applied Ecology 45(1), 218-227.
| Crossref | Google Scholar |
Richards SA (2015) Likelihood and model selection. In ‘Ecological statistics: contemporary theory and application’. (Eds GA Fox, S Negrete-Yankelevich, VJ Sosa) pp. 58–80 (Oxford Academic: Oxford) 10.1093/acprof:oso/9780199672547.003.0004
Roshier DA, Doerr VAJ, Doerr ED (2008) Animal movement in dynamic landscapes: interaction between behavioural strategies and resource distributions. Oecologia 156(2), 465-477.
| Crossref | Google Scholar |
Ruiz-Capillas P, Mata C, Malo JE (2013) Community response of mammalian predators and their prey to motorways: implications for predator–prey dynamics. Ecosystems 16(4), 617-626.
| Crossref | Google Scholar |
Scomparin C, Geale C, Johnson CN, Jones ME (2023) Limited top–down effects of feral cats on rodent dynamics in a seabird colony. Biological Invasions 25(12), 3965-3981.
| Crossref | Google Scholar |
Silva M, Johnson K, Opps S (2009) Habitat use and home range size of red foxes in Prince Edward Island (Canada) based on snow-tracking and radio-telemetry data. Open Life Sciences 4(2), 229-240.
| Crossref | Google Scholar |
Sparkes J, Fleming PJS, Ballard G, Scott-Orr H, Durr S, Ward MP (2015) Canine Rabies in Australia: a review of preparedness and research needs. Zoonoses and Public Health 62(4), 237-253.
| Crossref | Google Scholar |
Towerton AL, Kavanagh RP, Penman TD, Dickman CR (2016) Ranging behaviour and movements of the red fox in remnant forest habitats. Wildlife Research 43(6), 492-506.
| Crossref | Google Scholar |
Valeix M, Loveridge AJ, Chamaillé-Jammes S, Davidson Z, Murindagomo F, Fritz H, Macdonald DW (2009) Behavioral adjustments of African herbivores to predation risk by lions: spatiotemporal variations influence habitat use. Ecology 90(1), 23-30.
| Crossref | Google Scholar |
Wilson RR, Blankenship TL, Hooten MB, Shivik JA (2010) Prey-Mediated avoidance of an intraguild predator by its intraguild prey. Oecologia 164(4), 921-929.
| Crossref | Google Scholar |