

Seasonal litter decomposition and accumulation in north Australian savanna
Cameron Yates A * , Jay Evans A and Jeremy Russell-Smith AA
Abstract
Calculating greenhouse gas emissions from fires relies on estimation of available fuels at time of burn. Fuel accumulation and decomposition occur throughout the year, with seasonality of decomposition poorly researched in monsoonal Australia.
We investigate the decomposition and accumulation of litter fuels (leaves, twigs), and coarse woody debris (CWD >6 mm–<5 cm diameter) across a full monsoonal cycle.
The study was undertaken at three sites in long unburned (10 years+) eucalypts-dominated mesic savanna woodland. For measuring decomposition, twelve 50 g samples of leaves and twigs were placed in situ on the soil surface, with one sample removed and dried each month; one sample of CWD was tested after 12 months. Fine fuel accumulation was recorded monthly.
Significant statistical relationships were observed between soil moisture and leaf decomposition. Across the study period 66% of leaves, 35% of twig, and 27.2% of CWD decomposed. Fine fuel accumulation was consistent with previous studies and peaking in August. Combining monthly rates of accumulation and decomposition, net fine fuel loads were observed to be much greater late in the dry season.
The present study provides enhanced fine fuel load calculations by including seasonality of decomposition which allows for better estimates of emissions from savanna fires.
Keywords: coarse woody debris, EDS (early dry season), eucalyptus - dominated mesic savanna, fine fuels, fire emissions, fuel loads, LDS (late dry season), monsoonal Australia.
Introduction
Savannas are the most fire prone biome on Earth, accounting for approximately 90% of annual burned area globally (Giglio et al. 2018), and 62% of emissions from fire (van der Werf et al. 2017). Fire is a key ecological driver in tropical savannas (Scholes and Archer 1997; Lehmann et al. 2014; Murphy et al. 2023), including through the actions of Indigenous peoples with a long history of using fire for a variety of purposes (Pyne 1997; Yibarbuk et al. 2001; Russell-Smith et al. 2003; Moura et al. 2019). Fire can also have detrimental impacts not only for vulnerable savanna flora and fauna (Yates et al. 2008; Ziembicki et al. 2015), but also soil loss and erosion processes (Townsend and Douglas 2004; Russell-Smith et al. 2006) and impacts on biomass carbon stores and increased greenhouse (GHG) gas emissions (Murphy et al. 2023; Vernooij et al. 2023).
Since 2012 the Australian government has introduced legislation incentivising Indigenous custodians and land managers to undertake more sustainable savanna fire management through reduction of accountable GHG emissions (methane, CH4, and nitrous oxide, N2O). The method incentivises emissions reduction through carrying out prescribed fire management under relatively benign fire weather conditions in early dry season (EDS; before August), in order to reduce the extent and impact of late dry season (LDS) wildfires. The first of these legislated methods was the Carbon Farming methodology determination of 2012 (CoA (Commonwealth of Australia) 2013), following methodology developed by Russell-Smith et al. (2009). There have been two subsequent iterations of the legislation, the 2015 method (CoA (Commonwealth of Australia) 2015) extending the eligible geographic area from 600 mm to >1000 mm wet season rainfall (following Murphy et al. 2015), and a 2018 method (CoA (Commonwealth of Australia) 2018) which also included accounting for sequestration of coarse woody debris (CWD; woody components <5 cm diameter) fuels (following Cook and Meyer 2017). These methods enable accounting of emissions based on extensive field studies describing combustible fuel components (e.g. grass, litter, CWD) that accumulated since the last fire, the amount of fuel pyrolysed in fires of different seasonality and severity, and internationally certified emission factors for CH4 and N2O.
Various studies have investigated rates of decomposition in fire-prone environments with an emphasis on loss of soil organic matter, and litter affecting microbial activity by slowing decomposition rates (Rossiter-Rachor et al. 2008; Gould et al. 2011; Davies et al. 2013; Harris et al. 2016; Hopkins et al. 2020). Savanna-based studies have focused on nutrient cycling, the agents of decay (e.g. soil microbes, termites: Furniss et al. 1982; Rossiter-Rachor et al. 2008; Ngatia et al. 2014), including assessments of wet season decomposition but without describing full seasonal breakdown. Two previous north Australian studies have described decomposition in regionally typical eucalypts-dominated savanna woodlands. Cook (2003) assessed decomposition with a mix of tree litter and grass in litter bags with sub-samples collected every 2 months over a 12-month period. This author reported an annual decomposition rate of 80% but did not provide any seasonal breakdown. Rossiter-Rachor et al. (2008) compared decomposition in native (Alloteropsis semialata) and invasive (Andropogon gayanus) grass litter across a 120-day wet season period (November–May). The study assessed in situ samples as well as litter bags placed on the soil and suspended aerially, finding that 61% of in situ samples decomposed over the wet season at a rate of 0.21 g/m2 day.
A critical aspect in emissions accounting and fire spread models is the amount of fuel available for consumption, particularly fine fuel plant materials (<6 mm in diameter). Hanan et al. 2022 and Erin et al. 2022 note that the estimation of accumulated fine fuel components typically lacks decomposition data, thus imposing significant limitations on modelling. Fine fuels comprise grass and litter (leaf and twig) components, with the grass typically growing actively or senescent. To address current gaps in our understanding of the relative seasonal rates of fuel accumulation and decomposition in fire-prone savanna systems, and associated implications for modelling purposes, this study aims to describe seasonal variation in the litter and CWD fuel accumulation and decomposition over an annual monsoonal cycle for a typical north Australian eucalypts-dominated savanna setting under mesic (>1000 mm mean annual rainfall) conditions. We hypothesise that decomposition is correlated to soil moisture and follows monsoonal seasons with little to no decomposition happenning through the drier months. Therefore, accounting for the accumulation, fine fuel availability should be greater under LDS savanna conditions given well documented increased LDS litterfall inputs.
Methodology
Field sites
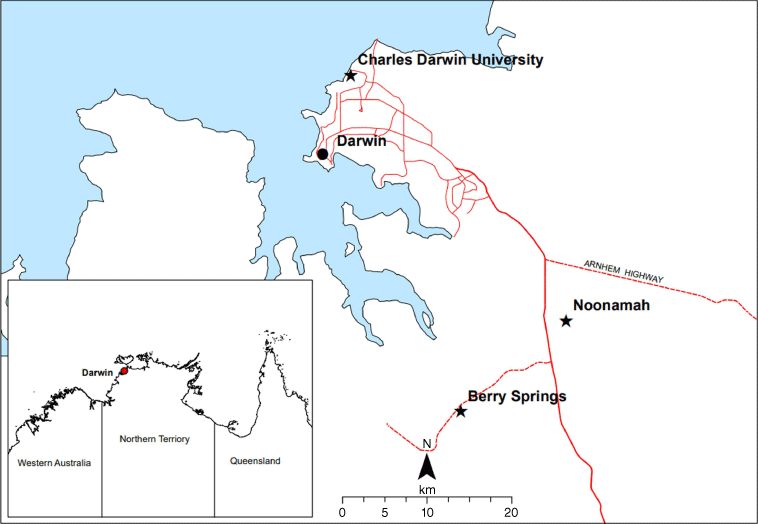
Tropical northern Australia experiences pronounced wet and dry seasons with higher average temperatures, humidity, and most rain falling in November to May, followed by a seasonal drought with limited rain through the dry season (Moise et al. 2015). The study was undertaken in long unburned (10 years+) savanna woodlands in the vicinity of Darwin with an overstory dominated by Eucalyptus tetrodonta and Eucalyptus miniata. Sites were established at three locations, at Charles Darwin University (CDU) in Darwin, at Noonamah, and Berry Springs to Darwin’s south-east (Fig. 1). Sites were located on relatively flat well-draining sandy loam soils under annual mean rainfall conditions of 1764, 1740 and 1714 mm, for CDU, Noonamah and Berry Springs respectively, and with an average annual day time temperature of 32°C for all (Table 1; source: Bureau of Meteorology – www.bom.gov.au).
| Site | Average annual rainfall (mm) | Rainyear rainfall, Jun 2020–Jul 2021 (mm) | Average daytime temperature (°C) | Basal AREA A (m2/ha) | Soil characteristics | |
|---|---|---|---|---|---|---|
| CDU | 1764 | 1965 | 32 | 9.2 | Deep Sandy well draining | |
| Noonamah | 1740 | 2016 | 32 | 8.5 | Shallow Sandy | |
| Berry Springs | 1714 | 2241 | 32 | 10.3 | Deep Sandy well draining |
Field plots
At each of these three locations three replicate plots were established roughly 50 m apart.
Each plot included a 3 m × 3 m area which was raked clean of all fine fuel, leaves, sticks and fruit materials, leaving bare ground at the start of the experiment. Twelve 50 g samples of leaves, and 12 samples of twigs comprising woody material of up to 5 mm in diameter, were collected from the surrounding area, weighed and scattered on the ground separately in 12 20 × 30 cm sub-plots. Samples were covered with wire baskets (with 1.5 × 1.5 cm gaps). Five CWD samples (>5 mm and <5 cm in diameter) were weighed, placed on bare ground and covered with a wire basket as for fine fuel samples. All baskets were then covered with a flyscreen wire mesh to keep out any falling material. A 15 cm high plastic fence around each 3 m × 3 m study area was erected to stop any sideways movement of material into or out of the enclosure (Fig. 2).
Site setup comprising 12 baskets with leaf and twig litter, the 13th basket containing CWD. Three leaf fall traps were positioned in three corners.
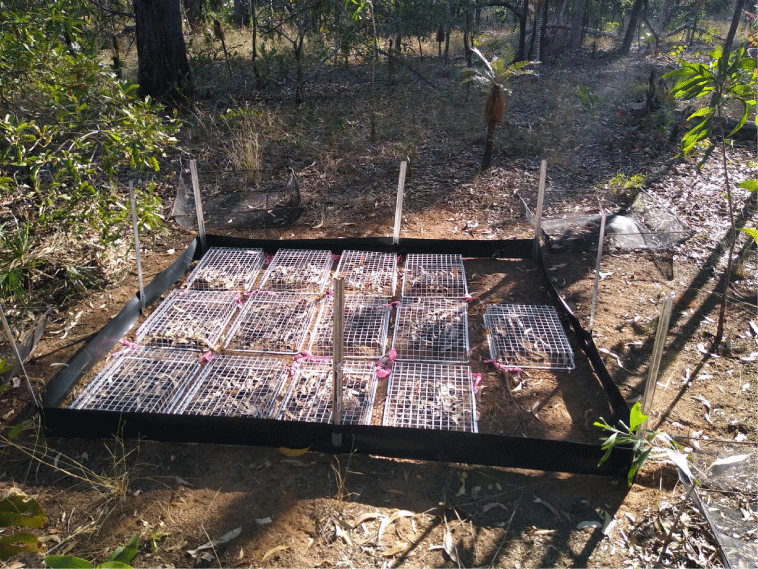
Decomposition plots were established at Berry Springs on the 2 June 2020 followed by CDU and Noonamah on the 1 July, with fuel accumulation plots established for all locations on the 31 July, a month after the decomposition plots were established. In three corners of the 3 m × 3 m cleared plot area, 1 m × 1 m welded wire baskets were placed to catch falling leaves, litter, bark, flowers, and fruits following the methodology outlined in Yates et al. (2020) (Fig. 2). Due to the start and end dates of the fuel accumulation study no data were collected for the month of July at both the start and end of the experiment.
Sampling was undertaken at the start of each study month (Table 2). One set (of the 12 originally established) of leaves and twigs was collected, sieved to remove any dirt, and oven dried for 48 h at 80°C to obtain sample dry weights. Leaf fall traps were emptied, separated into respective classes (leaf, twig, bark, CWD, other – including flowers and fruits) and weighed, with sub-samples of each component collected and oven dried to determine dry weights.
| Date | CDU1 | CDU2 | CDU3 | NMH1 | NMH2 | NMH3 | BS1 | BS2 | BS3 | |
|---|---|---|---|---|---|---|---|---|---|---|
| 2/06/2020 | ✓ | ✓ | ✓ | |||||||
| 1/07/2020 | ✓ | ✓ | ✓ | ✓ | ✓ | ✓ | ✓ | ✓ | ✓ | |
| 31/07/2020 | ✓ | ✓ | ✓ | ✓ | ✓ | ✓ | ✓ | ✓ | ✓ | |
| 1/09/2020 | ✓ | ✓ | ✓ | ✓ | ✓ | ✓ | ✓ | ✓ | ✓ | |
| 1/10/2020 | ✓ | ✓ | ✓ | ✓ | ✓ | ✓ | ✓ | ✓ | ✓ | |
| 30/10/2020 | ✓ | ✓ | ✓ | ✓ | ✓ | ✓ | ✓ | ✓ | ✓ | |
| 2/12/2020 | ✓ | ✓ | ✓ | ✓ | ✓ | ✓ | ✓ | ✓ | ✓ | |
| 4/01/2021 | ✓ | ✓ | ✓ | ✓ | ✓ | ✓ | ✓ | ✓ | ✓ | |
| 1/02/2021 | ✓ | ✓ | ✓ | ✓ | ✓ | ✓ | ✓ | ✓ | ✓ | |
| 1/03/2021 | ✓ | ✓ | ✓ | ✓ | ✓ | ✓ | ✓ | ✓ | ✓ | |
| 1/04/2021 | ✓ | ✓ | ✓ | ✓ | ✓ | ✓ | ✓ | ✓ | ✓ | |
| 4/05/2021 | ✓ | ✓ | ✓ | ✓ | ✓ | ✓ | ✓ | ✓ | ✓ | |
| 1/06/2021 | burned | burned | ✓ | ✓ | ✓ | ✓ | ✓ | ✓ | ✓ | |
| 6/07/2021 | ✓ | ✓ | ✓ |
The CWD fuel samples were weighed once at the end of the exercise. A CWD sub-sample was collected at time of plot establishment to determine fuel moisture, with the samples collected and weighed again at the end of the experiment. The samples were oven dried to determine dry weight. The CWD samples only investigated the total loss over the 12-month period.
Soil moisture samples were collected at each site visit with a metal tube (7.5 cm in diameter, 6 cm high) hammered into the ground to collect a consistently-sized sample. Soil samples were weighed in the field, then oven dried at 80°C for at least 48 h and re-weighed to calculate moisture content.
Data assessment and analysis
Monthly decomposition data for leaf and twig components were converted into daily decomposition rates by dividing the difference in weight between subsequent visits by the number of days for each plot. The three plots per location were then averaged, with the daily rate of decomposition averaged separately for wet season (November–April) and dry season (May–October) periods. CWD decomposition was calculated as an annual rate. Fuel accumulation was collated as monthly amounts but also as averages for wet and dry season periods.
Daily rainfall data were compiled from three rain stations: Bureau of Meteorology stations 14246 (Leanyer) located 2 km away from CDU; Station 14222 (Elizabeth Valley), situated 1 km from the Noonamah site; and records from the Berry Springs site supplemented with records from station 14264 (Territory Wildlife Park) 1 km from the Berry Springs site. Daily rainfall data were compiled for monthly periods between respective visits, (Bureau of Meteorology, http://www.bom.gov.au/climate/data/index.shtml).
The one-way ANOVA was used to determine any statistical difference in decomposition between the three locations. Simple linear regressions were conducted combining data assembled from respective plots at each site to assess statistical relationships between rainfall and soil moisture, as well as between soil moisture and rates of leaf and twig decomposition. Two-tailed t-tests were also undertaken to determine if there were statistical differences separately between wet and dry season decomposition rates, and accumulation.
Results
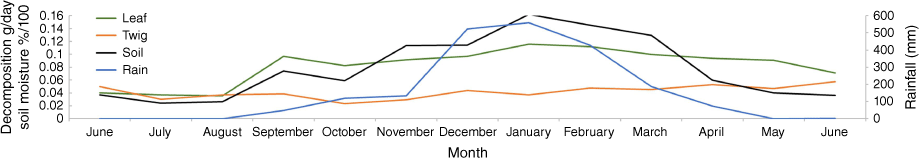
All sites were visited approximately once monthly from July 2020 with the exception of CDU plots which were burned in June 2021 (Table 2); however, given that 11 consecutive monthly samples were available, the impact of fire at the CDU site was likely minimal for the analysis purposes. After 11 months, across all plots on average 66% of leaf samples and 35% of twig samples had decomposed.
No significant difference was observed between decomposition at the three locations (Table 3). Significant relationships (P < 0.0005) were observed between monthly rainfall and soil moisture, and also between soil moisture and daily leaf decomposition (Table 3). No significant relationships were observed between soil moisture and twig decomposition. The mean rate of leaf decomposition was significantly greater (P < 0.005) for the typical wet season period (November–April) compared to the dry season period (May–October) (Figs 3, 4, Table 3). No significant difference between wet and dry season periods was observed for twig decomposition.
| (n) | s.e. | P-value | |||
|---|---|---|---|---|---|
| (a) Regressions with soil moisture | |||||
| Rainfall vs soil moisture | y = 0.5197 + 0.0002x | 103 | 0.000019 | <0.0005 | |
| Soil moisture vs leaf decomposition rate | y = 0.0261 + 0.6857x | 103 | 0.12 | <0.0005 | |
| Soil moisture vs twig decomposition rate | y = 0.0789 + 0.1331x | 103 | 0.19 | 0.4861 | |
| (b) t-tests, wet and dry season differences | |||||
| Decomposition | |||||
| Leaf | 9 | 0.0016 | |||
| Twig | 9 | 0.8592 | |||
| (c) One-way ANOVA between site locations | |||||
| Leaf | 12 | 0.1536 | |||
| Twig | 12 | 0.7933 | |||
| Soil | 12 | 0.6268 | |||
Daily decomposition of leaf and twig given in green and orange lines, respectively, expressed as grams lost per day. Soil moisture given as the black line expressed as percent moisture divided by 100, and rainfall given as the blue line expressed as monthly rainfall in mm, starting on June 2020, ending June 2021.
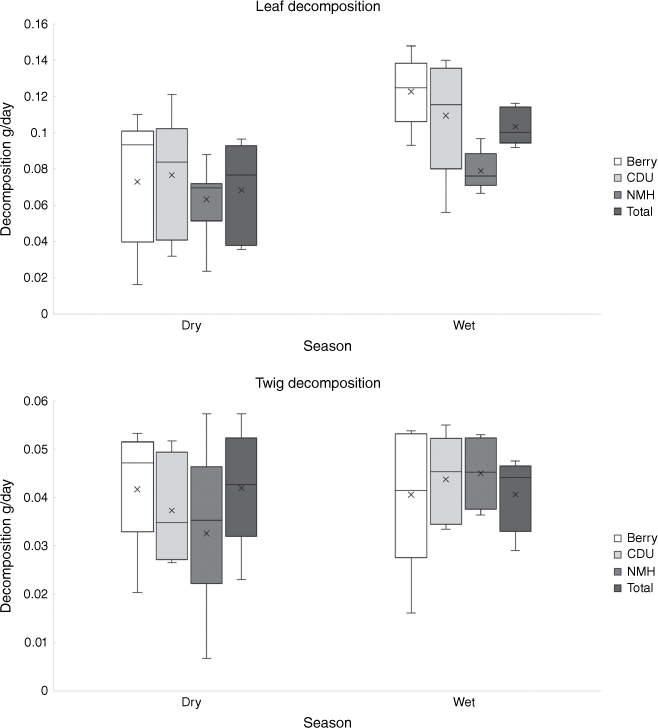
Daily leaf and twig decomposition (g/day) for wet (November–April) and dry (May–October) seasons for each study location; Berry Springs (Berry), Charles Darwin University (CDU), Noonamah (NMH) and total.
Average CWD decomposition over the 12-month assessment period was 34.6% and 25.5%, recorded at Noonamah and Berry Springs sites respectively. Two plots at the CDU site were burned prior to the end of the exercise, so no coarse measurements were possible with average annual CWD decomposition of 9.79% recorded for the one unburned plot. Overall, an average of 27.2% CWD decomposition was recorded over the 12-month period for all available plot data.
Despite stochastic variability evident at different sample sites (refer to Discussion), mean fine fuel accumulation peaked in August (Fig. 3). No seasonal effects were apparent in accumulation of twigs, bark, and other components (Fig. 5). Averaged across respective sites, annual leaf inputs contributed 62%, twigs 18%, bark 7%, and ‘other’ 13% of total fine fuels (Table 4). Total fine fuel accumulation averaged 55.1 g/month in the wet season, and 96.5 g/month in the dry season.
Fine fuel accumulation for leaves, twigs, bark and ‘other’ (g/month) averaged across the three study locations (CDU, Noonamah, Berry Springs). Note July is not included due to sampling dates.

| Month | Leaf | Twig | Bark | Other | Total Fine | CWD | |
|---|---|---|---|---|---|---|---|
| January | 18.06 | 7.20 | 1.31 | 4.69 | 31.26 | 0.00 | |
| February | 13.38 | 5.56 | 0.62 | 3.38 | 22.94 | 0.03 | |
| March | 39.72 | 15.15 | 0.38 | 3.55 | 58.79 | 0.00 | |
| April | 69.79 | 9.99 | 0.36 | 8.89 | 89.03 | 23.67 | |
| May | 92.54 | 22.50 | 0.88 | 12.01 | 127.94 | 0.00 | |
| June | 55.56 | 19.05 | 11.81 | 9.33 | 95.75 | 0.00 | |
| August | 72.60 | 25.77 | 20.29 | 18.21 | 136.86 | 0.00 | |
| September | 33.30 | 13.12 | 10.43 | 18.22 | 75.07 | 0.00 | |
| October | 20.91 | 7.62 | 10.50 | 7.91 | 46.94 | 0.00 | |
| November | 66.81 | 17.92 | 0.45 | 7.33 | 92.52 | 0.00 | |
| December | 15.40 | 7.40 | 0.56 | 12.56 | 35.91 | 1.06 | |
| Monthly average | 43.43 | 12.80 | 4.77 | 9.14 | 70.14 | 2.44 | |
| % of Total | 61.92 | 18.25 | 6.80 | 13.03 |
Discussion
Fuel accumulation is often based on empirical models derived from field observations, with Olson curves (Olson 1963) often used to derive a decay function to account for decomposition (e.g. microbial, herbivory). For calculation of decomposition following Cook and Meyer (2017), the current 2018 emissions accounting method simply assumes an equal monthly rate derived from an estimated annual decay (k = 0.8) divided by 12 – in effect assuming that decomposition occurs equally under seasonally moist and dry conditions. By contrast, fine fuel accumulation in the 2018 method is estimated as monthly fuel loads derived from Olson curve relationships (Department of the Environment and Energy – Australian Government (2019)). Despite fine fuels generally peaking around August (start of the LDS) associated with pronounced leaf fall (Cook 2003; Meyer and Cook 2015; Yates et al. 2020), if you assume a constant aseasonal decomposition rate, it means that fuel loads, and hence risk of high severity fires and resultant emissions are estimated in the 2018 method to be lower in the LDS period.
This study describes the seasonal availability of fine fuels under regionally typical mesic eucalypt savanna conditions, taking into account both input and decomposition processes. For describing decomposition, in contrast to most studies which deploy sample fuels placed in sealed litter bags, our approach has involved regular (monthly) measurement of decay from fuel samples placed in open contact with the soil surface and thereby ambient microbial and herbivory processes.
Rainfall during the study period was higher than the average across all three locations (Table 1); with Berry Springs experiencing a significant excess of 527 mm above average. All three locations exhibited typical monsoonal rainfall patterns, characterised by distinct wet and dry seasons, with most precipitation occurring between November and April, followed by an extended dry period from May to October (Fig. 3). This higher-than-average rainfall pattern likely had little effect on seasonal decomposition as there was no flooding or pooling of water given that they all feature well-draining soils. Soil moisture closely followed the rainfall pattern (Fig. 3).
Patterns in leaf decomposition were very similar across all three locations, with no statistical difference measured (Table 3). However the Noonamah site displayed a slightly lower decomposition rate despite comparable soil moisture levels across all sites. While the CDU and Berry Springs sites are situated on deep sandy loam soils, the Noonamah site sits on shallower, well-draining soils atop a rocky ridge. The shallower soil may potentially hold fewer microbes available for decomposition, though this was not tested. However, this lower rate of leaf decomposition did not translate to twig decomposition where no statistical difference was observed between sites (Table 3), exhibiting a consistent rate with no discernible relationship with soil moisture, season, or location.
Averaging across wet and dry seasons reveals a distinct difference in leaf decomposition rate at all locations, with a total average of 0.071 g/day in the dry season and 0.104 g/day in the wet season. This is likely associated with higher microbial activity in the wet season; Chen et al. (2002) recorded a fourfold increase in microbial activity in the wet season under similar regional vegetation and edaphic conditions. The largest variation in decomposition was observed at Berry Springs, with values similar to those at CDU, while the variation between seasons at Noonamah was less pronounced. These observations are substantially lower than the 80% decomposition of grass and leaves reported by Cook (2003), but broadly similar to the 61% decomposition of grasses reported by Rossiter-Rachor et al. (2017), also under similar eucalypts-dominated tropical savanna conditions.
There was no significant difference in twig decomposition between seasons or sites. The disparity in the seasonality of decomposition for leaf and twigs has implications for emissions calculation and fire spread models, particularly those broadly applying all-encompassing fine fuels. In reality, fine fuels consist of a combination of grass and litter, with the litter component further broken down into detached grass, leaf litter, and twigs (<6 mm in diameter). As such, decomposition should not be applied uniformly to fine fuels throughout the year, given the differential seasonal effects of soil moisture on decomposition of leaf and twig components, and absence of decomposition in the attached grass component.
Decomposition of CWD fuels was not assessed for seasonality with only one measure of decomposition at the end of the sampling period. Average CWD decomposition (27.2%) was slightly lower than that of twigs (35%) and might be expected to follow a similar aseasonal trend.
The majority of accumulated litter comprised leaves (62%), followed by twigs (18%), ‘other’ debris (13%), and bark (7%). Peak litter accumulation in August followed a similar trend as observed in previous studies (Cook 2003; Yates et al. 2020). However, spikes in leaf fall were observed in May at Noonamah, and in November at CDU, likely due to high wind events. Similar accumulation events attributed to fires and storms have been reported previously in relation to stochastic accumulation of especially CWD materials (Cuff and Brocklehurst 2015; Yates et al. 2020).
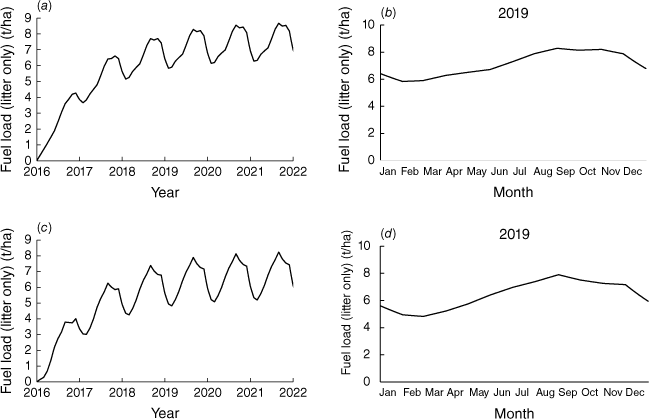
Accumulated fuel (litter) is not static throughout the year, with both inputs and decomposition both occurring more or less continuously but to different temporal patterns. A simple model for accumulated leaf fuels utilising the seasonality of accumulation from both Yates et al. (2020) and this study, was integrated with decomposition data collected in this study (Fig. 6). Noting that accumulated fuels in the Yates et al. (2020) study, representing 7 years (2016–2022) of fuel accumulation data assembled from seven plots in eucalypts-dominated savanna more-or-less evenly spread over a rainfall gradient from 800 to 1750 mm/year, and comprising all tree litter fractions (leaves, twigs, bark, other), we find that over the assessment period net accumulated tree litter fuels peaked in 2022 at 8.43 t/ha (Fig. 6a), in the LDS period (Fig. 6b). Utilising only leaf litter data presented here, we find that net accumulated leaf litter data peak at 8.24 t/ha (Fig. 6c) illustrating the major contribution of leaf litter fuels only, again in the LDS period (Fig. 6d). Integrating the seasonality of fuel accumulation and decomposition demonstrably improves emission estimates to better reflect fuels available for consumption at time of burning.
Predicted pattern of fine fuel accumulation, (a) derived from all leaf litter (including twigs, bark, others) accumulation as per Yates et al. (2020), and decomposition data from this study, calculated over period 2016–2022, (b) as per (a) but for 1 year (2019) only, (c) derived from leaf litter only and decomposition data from this study, for period 2016–2022, (d) as per (c) but for 1 year (2019) only.
This study improves estimates of fine fuels for the northern savanna of Australia, by including a seasonality component not currently accounted for in emissions estimates. Given the relationship with decomposition and soil moisture, future work should investigate decomposition in lower rainfall regions which is not yet included.
Conflicts of interest
Jeremy Russell-Smith is a Guest Editor of the International Journal of Wildland Fire. To mitigate this potential conflict of interest Jeremy had no editor-level access to this manuscript during peer review. The authors have no other conflicts of interest to declare.
Acknowledgements
The authors would like to thank Harry MacDermott, Andrew Edwards, and Patrice Weber for help with data collection, and Harry MacDermott and Kate van Wezel for use of their property at Noonamah, and Jeremy Russell-Smith and Diane Lucas at Berry Springs.
References
Chen X, Eamus D, Hutley LB (2002) Seasonal patterns of soil carbon dioxide efflux from a wet–dry tropical savanna of northern Australia. Australian Journal of Botany 50, 43-52.
| Crossref | Google Scholar |
CoA (Commonwealth of Australia) (2013) Carbon Credits (Carbon Farming Initiative) Reduction of Greenhouse Gas Emissions through Early Dry Season Savanna Burning—1.1) Methodology Determination 2013. Available at http://www.comlaw.gov.au/Series/F2013L01165
CoA (Commonwealth of Australia) (2015) Carbon Credits (Carbon Farming Initiative—Emissions Abatement through Savanna Fire Management) Methodology Determination 2015. (ComLaw, Australian Govt.: Canberra, ACT). Available at http://www.comlaw.gov.au/Details/F2015L00344
CoA (Commonwealth of Australia) (2018) Carbon Credits (Carbon Farming Initiative—Savanna Fire Management—Emissions Avoidance) Methodology Determination 2018. (Dept Environment and Energy, Australian Government: Canberra, ACT). Available at https://www.legislation.gov.au/F2018L00560/latest/text
Cuff N, Brocklehurst P (2015) Leaf and coarse fuel accumulation relationships with vegetation attributes in evergreen tropical eucalypt savanna. In ‘Carbon accounting and savanna fire management’. (Eds BP Murphy, AC Edwards, CP Meyer, J Russell-Smith) pp. 133–168. (CSIRO Publishing: Melbourne, Australia)
Davies AB, van Rensburg BJ, Eggleton P, Parr CL (2013) Interactive effects of fire, rainfall, and litter quality on decomposition in savannas: frequent fire leads to contrasting effects. Ecosystems 16, 866-880.
| Crossref | Google Scholar |
Erin EJ, Kennedy MC, Ren J, Johnson MC, Smith AMS (2022) Missing climate feedbacks in fire models: limitations and uncertainties in fuel loadings and the role of decomposition in fine fuel accumulation. Journal of Advances in Modeling Earth Systems 14(3), e2021MS002818.
| Crossref | Google Scholar |
Furniss PR, Ferrar P, Morris JW, Bezuidenhout JJ (1982) A model of savanna litter decomposition. Ecological Modelling 17(1), 33-51.
| Crossref | Google Scholar |
Giglio L, Boschetti L, Roy DP, Humber ML, Justice CO (2018) The Collection 6 MODIS burned area mapping algorithm and product. Remote Sensing of Environment 217, 72-85.
| Crossref | Google Scholar | PubMed |
Gould JS, McCaw WL, Cheney NP (2011) Quantifying fine fuel dynamics and structure in dry eucalypt forest (Eucalyptus marginata) in Western Australia for fire management. Forest Ecology and Management 262(3), 531-546 ISSN 0378-112.
| Crossref | Google Scholar |
Hanan EJ, Kennedy MC, Ren J, Johnson MC, Smith AM (2022) Missing climate feedbacks in fire models: limitations and uncertainties in fuel loadings and the role of decomposition in fine fuel accumulation. Journal of Advances in Modeling Earth Systems 14(3), e2021MS002818.
| Crossref | Google Scholar |
Harris RMB, Remenyi TA, Williamson GJ, Bindoff NL, Bowman DMJS (2016) Climate–vegetation–fire interactions and feedbacks: trivial detail or major barrier to projecting the future of the Earth system? WIREs Climate Change 7, 910-931.
| Crossref | Google Scholar |
Hopkins JR, Huffman JM, Platt WJ, Sikes BA (2020) Frequent fire slows microbial decomposition of newly deposited fine fuels in a pyrophilic ecosystem. Oecologia 193, 631-643.
| Crossref | Google Scholar | PubMed |
Lehmann CER, Anderson TM, Sankaran M, Higgins SI, Archibald S, Hoffmann WA, Hanan NP, Williams RJ, Fensham R, Felfili J, Hutley L, Ratnam J, San Jose J, Montes R, Franklin DC, Russell-Smith J, Ryan C, Durigan G, Hiernaux P, Haidar R, Bowman DMJS, Bond WJ (2014) Savanna vegetation-fire-climate relationships differ between continents. Science 343, 548-552.
| Crossref | Google Scholar |
Moise A, Abbs D, Bhend J, Chiew F, Church J, Ekström M, Kirono D, Lenton A, Lucas C, McInnes K, Monselesan D, Mpelasoka F, Webb L, Whetton P (2015) Monsoonal North Cluster Report, Climate Change in Australia Projections for Australia’s Natural Resource Management Regions: Cluster Reports. (Eds M Ekström, P Whetton, C Gerbing, M Grose, L Webb, J Risbey) (CSIRO and Bureau of Meteorology: Australia)
Moura LC, Scariot AO, Schmidt IB, Beatty R, Russell-Smith J (2019) The legacy of colonial fire management policies on traditional livelihoods and ecological sustainability in savannas: impacts, consequences, new directions. Journal of Environmental Management 232, 600-606.
| Crossref | Google Scholar | PubMed |
Murphy B, Whitehead PJ, Evans J, Yates CP, Edwards AC, MacDermott HJ, Lynch DC, Russell‐Smith J (2023) Using a demographic model to project the long‐term effects of fire management on tree biomass in Australian savannas. Ecological Monographs 93(2), e1564.
| Crossref | Google Scholar |
Ngatia LW, Reddy KR, Nair PKR, Pringle RM, Palmer TM, Turner BT (2014) Seasonal patterns in decomposition and nutrient release from East African savanna grasses grown under contrasting nutrient conditions. Agriculture, Ecosystems & Environment 188, 12-19.
| Crossref | Google Scholar |
Olson JS (1963) Energy storage and the balance of producers and decomposers in ecological systems. Ecology 44, 322-334.
| Crossref | Google Scholar |
Rossiter-Rachor NA, Setterfield SA, Douglas MM, Hutley LB, Cook GD (2008) Andropogon gayanus (gamba grass) invasion increases fire-mediated nitrogen losses in the tropical savannas of northern Australia. Ecosystems 11, 77-88.
| Crossref | Google Scholar |
Rossiter-Rachor NA, Setterfield SA, Hutley LB, McMaster D, Schmidt S, Douglas MM (2017) Invasive Andropogon gayanus (Gamba grass) alters litter decomposition and nitrogen fluxes in an Australian tropical savanna. Scientific Reports 7(1), 11705.
| Crossref | Google Scholar | PubMed |
Russell-Smith J, Yates C, Edwards A, Allan GE, Cook GD, Cooke P, Craig R, Heath B, Smith R (2003) Contemporary fire regimes of northern Australia, 1997–2001: change since Aboriginal occupancy, challenges for sustainable management. International Journal of Wildland Fire 12, 283-297.
| Crossref | Google Scholar |
Russell-Smith J, Yates C, Lynch B (2006) Fire regimes and soil erosion in north Australian hilly savannas. International Journal of Wildland Fire 15, 551-556.
| Crossref | Google Scholar |
Russell-Smith J, Murphy BP, Meyer CPM, Cook GD, Maier S, Edwards AC, Schatz J, Brocklehurst P (2009) Improving estimates of savanna burning emissions for greenhouse accounting in northern Australia: limitations, challenges, applications. International Journal of Wildland Fire 18(1), 1-18.
| Crossref | Google Scholar |
Scholes RJ, Archer SR (1997) Tree-grass interactions in savannas. Annual Review of Ecology and Systematics 28, 517-544.
| Crossref | Google Scholar |
Townsend SA, Douglas MM (2004) The effect of a wildfire on stream water quality and catchment water yield in a tropical savanna excluded from fire for 10 years (Kakadu National Park, North Australia). Water Research 38(13), 3051-3058.
| Crossref | Google Scholar | PubMed |
van der Werf GR, Randerson JT, Giglio L, van Leeuwen TT, Chen Y, Rogers BM, Mu M, van Marle MJE, Morton DC, Collatz GJ, Yokelson RJ, Kasibhatla PS (2017) Global fire emissions estimates during 1997–2016. Earth System Science Data 9, 697-720.
| Crossref | Google Scholar |
Vernooij R, Eames T, Russell-Smith J, Yates C, Beatty R, Evans J, Edwards A (2023) Dynamic savanna burning emission factors based on satellite data using a machine learning approach. EGUsphere 2023, 1-31.
| Crossref | Google Scholar |
Yates CP, Edwards AC, Russell-Smith J (2008) Big fires and their ecological impacts in Australian savannas: size and frequency matters. International Journal of Wildland Fire 17, 768-781.
| Crossref | Google Scholar |
Yates C, MacDermott H, Evans J, Murphy BP, Russell-Smith J (2020) Seasonal fine fuel and coarse woody debris dynamics in north Australian savannas. International Journal of Wildland Fire 29, 1109-1119.
| Crossref | Google Scholar |
Yibarbuk D, Whitehead PJ, Russell‐Smith J, Jackson D, Godjuwa C, Fisher A, Cooke P, Choquenot D, Bowman D (2001) Fire ecology and Aboriginal land management in central Arnhem Land, northern Australia: a tradition of ecosystem management. Journal of Biogeography 28(3), 325-343.
| Crossref | Google Scholar |
Ziembicki MR, Woinarski JCZ, Webb JK, Vanderduys E, Tuft K, Smith J, Ritchie EG (2015) Stemming the tide: progress towards resolving the causes of decline and implementing management responses for the disappearing mammal fauna of northern Australia. Therya 6(1), 169-225.
| Crossref | Google Scholar |