Is the smoke aloft? Caveats regarding the use of the Hazard Mapping System (HMS) smoke product as a proxy for surface smoke presence across the United States
Tianjia Liu A G * , Frances Marie Panday B , Miah C. Caine C , Makoto Kelp A , Drew C. Pendergrass D , Loretta J. Mickley D , Evan A. Ellicott B , Miriam E. Marlier E , Ravan Ahmadov F and Eric P. James F
A
B
C
D
E
F
G
Abstract
NOAA’s Hazard Mapping System (HMS) smoke product comprises smoke plumes digitised from satellite imagery. Recent studies have used HMS as a proxy for surface smoke presence.
We compare HMS with airport observations, air quality station measurements and model estimates of near-surface smoke.
We quantify the agreement in numbers of smoke days and trends, regional discrepancies in levels of near-surface smoke fine particulate matter (PM2.5) within HMS polygons, and separation of total PM2.5 on smoke and non-smoke days across the contiguous US and Alaska from 2010 to 2021.
We find large overestimates in HMS-derived smoke days and trends if we include light smoke plumes in the HMS smoke day definition. Outside the western US and Alaska, near-surface smoke PM2.5 within areas of HMS smoke plumes is low and almost indistinguishable across density categories, likely indicating frequent smoke aloft.
Compared with airport, Environmental Protection Agency (EPA) and model-derived estimates, HMS most closely reflects surface smoke in the Pacific and Mountain regions and Alaska when smoke days are defined using only heavy plumes or both medium and heavy plumes.
We recommend careful consideration of biases in the HMS smoke product for air quality and public health assessments of fires.
Keywords: data evaluation, emissions, fine particulate matter, fires, Hazard Mapping System, observations, PM2.5, pollutants: air, remote sensing, satellite data, scale: regional, smoke.
Introduction
Smoke pollution from wildfires in the western United States is increasingly a major public health concern with recent record-breaking fire seasons in 2018, 2020 and 2021 (Burke et al. 2021; Zhou et al. 2021). Decades of fire suppression in the 1900s and droughts in a warming climate together led to longer and more severe fire seasons, punctuated by megafires that spiral out of control (Syphard et al. 2017; Williams et al. 2019; Juang et al. 2022). The growing human population living in the wildland–urban interface is vulnerable to fires and in turn may cause more accidental ignitions. There is an increasing effort to attribute public health impacts to wildfire smoke pollution, but the caveats of underlying datasets used to quantify smoke are not yet fully explored (O’Dell et al. 2021; Zhou et al. 2021; Qiu et al. 2024).
Recent public health studies have relied on the National Oceanic and Atmospheric Administration’s (NOAA) Hazard Mapping System (HMS) smoke product to quantify the smoke fraction in surface fine particulate matter (PM2.5) in the US (Aguilera et al. 2021; O’Dell et al. 2021; Zhou et al. 2021). This statistical approach diagnoses smoke PM2.5 in surface PM2.5 observations on days when PM2.5 anomalies align with digitised HMS smoke plume polygons. ‘Background’ PM2.5 from other pollution sources in these studies is often calculated as the median PM2.5 observed during non-smoke days (Burke et al. 2021; Childs et al. 2022). More advanced methods interpolate station measurements onto a grid (O’Dell et al. 2021) or fill in the cloud-induced gaps in HMS data by tracking the trajectory of smoke transport from active fires (Childs et al. 2022). When using a statistical method to calculate smoke PM2.5 – that is, using total PM2.5 observations with HMS to partition smoke and non-smoke days – overestimates in smoke days may result in overestimates of smoke-related air pollution and public health impacts. This is because the calculation of the background PM2.5 using median or mean values is imperfect, and elevated PM2.5 may be incorrectly attributed to smoke. Traditional air quality and public health assessments of fires on air quality have relied on 3D chemical transport models with input emissions inventories to estimate smoke PM2.5 by comparing model runs with and without fire (Wiggins et al. 2018; Carter et al. 2020) or calculating the sensitivity footprint of a receptor to nearby emissions (Koplitz et al. 2016; Marlier et al. 2019; Kelp et al. 2023); however, this process is computationally expensive. The HMS statistical approach circumvents having to grapple with model biases stemming from uncertainty in the meteorology driving the smoke transport and plume rise and in the fire emissions estimates, which are calculated from fire activity, fuel load and combustion efficiency and depend on poorly constrained emissions factors (Liu et al. 2020). Additionally, the HMS smoke product is observationally grounded and readily accessible to experts in fields adjacent to the atmospheric sciences. However, without prior knowledge of emissions levels from different sectors, uncertainty arises from the reliance on the HMS smoke product to distinguish smoke PM2.5 from other types of PM2.5. Thus, here we seek to understand: how well does the HMS smoke product reflect surface smoke conditions?
The HMS smoke product relies on NOAA analysts to digitise smoke plumes using satellite imagery primarily from the Geostationary Operational Environmental Satellites (GOES) (Rolph et al. 2009; Brey et al. 2018). However, the ability of the HMS smoke product to represent surface smoke conditions with high spatial accuracy is uncertain as the product has not yet been fully validated against surface observations. First, HMS smoke polygons represent limited daytime snapshots of column smoke presence and do not contain information about the vertical location of smoke, i.e. whether the smoke is aloft or near the surface. HMS may be a poor indicator of surface smoke where smoke is expected to be mostly aloft, such as over states in the Midwest and Northeast that do not receive large amounts of smoke from wildfires and prescribed fires but instead receive smoke transported from other regions. Second, the spatial accuracy of HMS, particularly at the edges of smoke polygons, is affected by the coarse spatial resolution of GOES imagery. The GOES imagery from which HMS smoke is derived has a spatial resolution of 2 km at the equator, but the resolution over the contiguous United States (CONUS) and Alaska is lower depending on the pixel’s latitude and proximity to the edge of the viewing disc – i.e. the satellite viewing angle. If a region is prone to high-altitude cloud cover, GOES satellites have an advantage over polar-orbiting satellites (e.g. Terra, Aqua, S-NPP, NOAA-20) as they can potentially wait until the clouds move away from the smoke layers. Additionally, HMS does not account for the parallax effect, in which objects observed by GOES are displaced from their actual location. This displacement is dependent on its location and altitude and can affect spatial accuracy of HMS plume edges. Third, HMS does not fully capture the dynamic nature of smoke dispersion. Although HMS labels the apparent density of individual plumes as light, medium, or heavy, there may still be high variation in smoke levels within polygons. Because HMS analysts must cover North America every day with only two major updates, the spatial and temporal information HMS provides is coarse. The potential spatial heterogeneity in accuracy suggests that caution should be exercised in public health analyses dependent on the HMS smoke product.
In this study, we evaluate the use of the HMS smoke product as a proxy for surface smoke on a regional level across the US. For comparison, we select three open-access datasets and products available in near-real-time: airport observations from the NOAA Integrated Surface Database (ISD), air quality station (AQS) measurements from the US Environmental Protection Agency (EPA), and model estimates from the NOAA High-Resolution Rapid Refresh (HRRR)-Smoke operational model. Although each has its own strengths and caveats, end-users may draw more robust conclusions in regions with good agreement between HMS and other estimates, whereas strong disagreement could undermine HMS-based results. First, we compare the magnitude and trends in HMS smoke days with a network of ISD airport observations. Second, we use EPA AQS measurements to quantify the regional variation in surface smoke PM2.5 concentrations within HMS smoke plumes and differences among the density categories. Third, we use HRRR-Smoke model estimates during a high fire year in a similar regional analysis of spatial variation but not limited to locations of EPA monitors.
Data and methods
NOAA’s Hazard Mapping System (HMS) smoke product
To produce NOAA’s Hazard Mapping System (HMS) smoke product, analysts use visible satellite imagery to draw polygons of the extent of wildfire smoke (Rolph et al. 2009; Brey et al. 2018). The HMS smoke product is available from August 2005 and produced daily, in near-real-time (https://www.ospo.noaa.gov/Products/land/hms.html). HMS analysts use true-colour images primarily from the GOES-East and GOES-West satellites for smoke plume digitisation. The longitudinal position of GOES-East is 75°W and that of GOES-West is 137°W. Currently, the GOES full disc view of North and South America is 2 km in spatial resolution at the equator and recorded every 10 min, whereas the CONUS-specific view is recorded every 5 min. Owing to favourable optics at high solar zenith angles, analysts typically update smoke plume polygons for large areas of smoke just twice per day – early morning after sunrise and late afternoon before sunset – whereas smaller smoke plumes can be updated anytime during daytime hours. Analysts use an animated sequence of satellite images to identify smoke-affected areas and digitise the maximum extent of smoke visible. Each plume’s density is further qualitatively classified as light/thin, medium, or heavy/thick smoke based on the apparent opacity of the plume in satellite imagery. Starting from 2008, HMS smoke plumes are categorically labelled as 5, 16 and 27, which approximately correspond to PM2.5 equivalents based on the now discontinued GOES Aerosol Smoke Product (GASP): 5 [0–10] μg/m3 (light/thin), 16 [10–21] μg/m3 (medium) and 27 [21–32] μg/m3 (heavy/thick). However, an update to the HMS smoke product in 2022 removed this connection to the PM2.5 equivalents, instead opting for the text labels of ‘light’, ‘medium’ and ‘heavy.’ Owing to data loss of smoke density information for almost all polygons in 2009, we set our study time period as 2010–2021. For quality control, we remove malformed HMS polygons with edges crossing, unclosed rings, out-of-bounds coordinates and insufficient number of vertices, i.e. drawn as lines; these excluded polygons comprise <0.1% of all polygons.
NOAA’s Integrated Surface Database airport observations
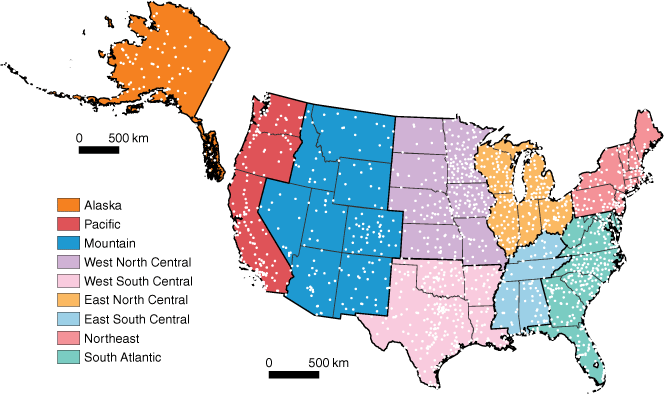
NOAA’s Integrated Surface Database (ISD) collates observations of meteorological parameters at airports at varying temporal frequencies (Smith et al. 2011) (accessed from: https://www.ncei.noaa.gov/data/global-hourly/). Meteorological observations include air temperature, surface pressure and visibility, as well as indicators of low visibility due to haze, clouds/mist, dust and smoke. We use the atmospheric condition codes from the automated weather (AW) reports in the ISD dataset. To define a smoke observation, we use the ‘smoke’ (AW = 5) code. Observer guidelines define visibility reduction associated with smoke as ‘a suspension in the air of small particles produced by combustion’; further visual cues outlined for smoke include the colour of the disc of the sun appearing red during sunrise/sunset or orange when above the horizon (Office of the Federal Coordinator for Meteorological Services and Supporting Research 1995; US Department of Transportation Federal Aviation Administration 2016). We filter out airports that have no smoke observations and on average have less than one valid observation of visibility per day from 2010 to 2021. We use a total of 1598 airports across CONUS and 108 airports in Alaska (Fig. 1). To filter out spurious ISD smoke observations, we designate a day as a smoke day if >5% of all observations during that day are labelled as smoke.
Evaluating HMS smoke days with ISD airport observations
For HMS, we test three definitions of smoke days based on presence of the light, medium and heavy smoke density categories: (1) all (light, medium, or heavy), (2) medium/heavy, and (3) heavy only. In the heavy-only definition, for example, we designate a day as a smoke day only if a heavy smoke plume overlaps with a particular location; otherwise, days are considered non-smoke days. At each airport, we compare the average number of smoke days and linear trend in smoke days as derived from smoke observations from ISD airport and HMS data during smoky-heavy months, or months with >5% of annual HMS smoke days. This constraint limits our analysis to months when fire-related smoke is likely a dominant pollution source.
For each airport location, we quantify the difference in HMS and airport average smoke days per year and trend in smoke days from 2010 to 2021. We compare statistics and accuracy metrics for nine sub-regions: Alaska, Pacific, Mountain, West North Central, West South Central, East North Central, East South Central, Northeast and South Atlantic (Fig. 1). Broader regions referred to in this study are defined as follows: the West covers Pacific and Mountain and parts of West North Central and West South Central; the East covers the rest of CONUS outside of the West; the Midwest covers East North Central and West North Central; and the Southeast covers East South Central and South Atlantic. We use two accuracy metrics, Cohen’s kappa (κ) and Matthews correlation coefficient (MCC), to evaluate the agreement between HMS and airport smoke day classifications. Cohen’s kappa is a widely used metric for validation in remote sensing studies that involve classification, such as mapping land cover types and change (Cohen 1960). The MCC is a proposed alternative for Cohen’s kappa; although both metrics are derived from confusion matrices, the MCC performs better on imbalanced datasets and overall is a more informative and reliable metric to evaluate binary classification (Matthews 1975; Chicco et al. 2021). For two-class comparisons, the Cohen’s kappa and MCC metrics are calculated as follows:
where TP is number the true positives (i.e. both airport and HMS = smoke day), TN is the number of true negatives (i.e. both airport and HMS = non-smoke day), FP is the number of false positives (i.e. airport = non-smoke day, HMS = smoke day) and FN is the number of false negatives (i.e. airport = smoke day, HMS = non-smoke day).
Additionally, we calculate the true positive rate (TPR, recall), positive predictive value (PPV, precision), false positive rate (FPR) and negative predictive value (NPV) to complement our analysis:
Evaluating elevated PM2.5 at EPA stations during HMS smoke days
As an additional way to evaluate the HMS smoke density categories, we use daily average PM2.5 measurements at EPA stations across CONUS and Alaska. We obtain daily average EPA PM2.5 data under parameter codes 88801 and 88502, which refer to the designation of federal reference method (FRM) and federal equivalent method (FEM) for quality control (https://aqs.epa.gov/aqsweb/airdata/download_files.html). For our study period of 2010–2021, we use a total of 1024 EPA stations that have at least a decade of measurements from 2009 to 2022 (buffer years to calculate background PM2.5) and over an average of 100 measurements per year (Supplementary Fig. S1). To approximate smoke PM2.5, we subtract the total PM2.5 from the background PM2.5. Following Childs et al. (2022), we calculate the background PM2.5 as the median PM2.5 on days with no coincident HMS smoke plumes during the same month across a 3-year period. For example, the background PM2.5 for January 2019 is the median of PM2.5 on non-smoke days during January 2018, 2019 and 2020. We then classify the PM2.5 anomalies on HMS smoke days by the maximum HMS smoke density category of each day and compare across regions. Large variation exists in the background PM2.5, but we would expect the PM2.5 anomalies on the HMS smoke days to fall at the higher end of the distribution of PM2.5 anomalies on non-smoke, or ‘background’, days. To test this, we also report the percentile at which the PM2.5 anomalies on smoke days lies on the cumulative probability distribution of PM2.5 anomalies on non-smoke days. The percentile measures the separation between the PM2.5 on smoke and non-smoke days; higher percentiles imply greater confidence in attributing elevated PM2.5 to smoke.
Evaluating the spatial consistency of modelled near-surface smoke PM2.5 within HMS polygons
We use the NOAA’s operational HRRR-Smoke model forecast products to track the spatial consistency in near-surface smoke PM2.5 across CONUS (https://rapidrefresh.noaa.gov/hrrr/HRRRsmoke/). HRRR-Smoke is based on the Weather and Research Forecasting model coupled with Chemistry (WRF-Chem) and input fire emissions calculated from fire radiative power (FRP), a proxy for fire intensity that is directly proportional to emissions (Ahmadov et al. 2017; Benjamin et al. 2021; Dowell et al. 2022). The FRP is derived from observations by the Visible Infrared Imaging Radiometer Suite (VIIRS) sensor aboard the Suomi-NPP and NOAA-20 satellites and Moderate Resolution Imaging Spectroradiometer (MODIS) sensor aboard the Terra and Aqua satellites. HRRR-Smoke provides real-time hourly surface smoke concentrations (primary PM2.5 from wildland fires) at 3-km spatial resolution that we then average to daily scale. We use the HRRR-Smoke 2D outputs (‘wrfsfc’) at forecast Hour 0 in 2021, a high fire year and the first full year that the near-surface smoke PM2.5 variable (‘MASSDEN’) became available in the operational product (accessed from: https://noaa-hrrr-bdp-pds.s3.amazonaws.com/index.html). We track how the HRRR-Smoke simulated smoke concentrations vary across smoke polygons with the same density category. For example, the occurrence of low smoke PM2.5 values (<10 μg m−3) from HRRR-Smoke located within heavy HMS smoke polygons may signal that the smoke is lofted, and that HMS does not accurately reflect surface smoke levels in those areas. Surface smoke concentrations from HRRR-Smoke have been evaluated using observations from ground-based monitors for California (Rosenthal et al. 2022) and extreme fire events such as the Camp Fire (Chow et al. 2022) and Williams Flats Fire (Ye et al. 2021) in 2019. Generally, HRRR-Smoke well represents the temporal coherence of smoke PM2.5 compared with observations, but biases may arise from assumptions for nighttime burning, biomass burning emission persistence and fire plume injection heights. It should be noted that the model does not include any smoke chemistry owing to limited computational resources available for the HRRR forecast model.
Results and discussion
Evaluating HMS and ISD average smoke days and trends in smoke days by airport
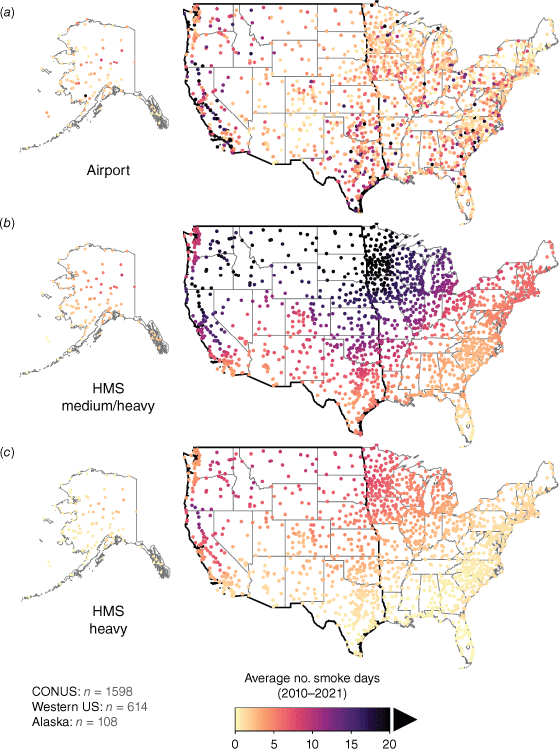
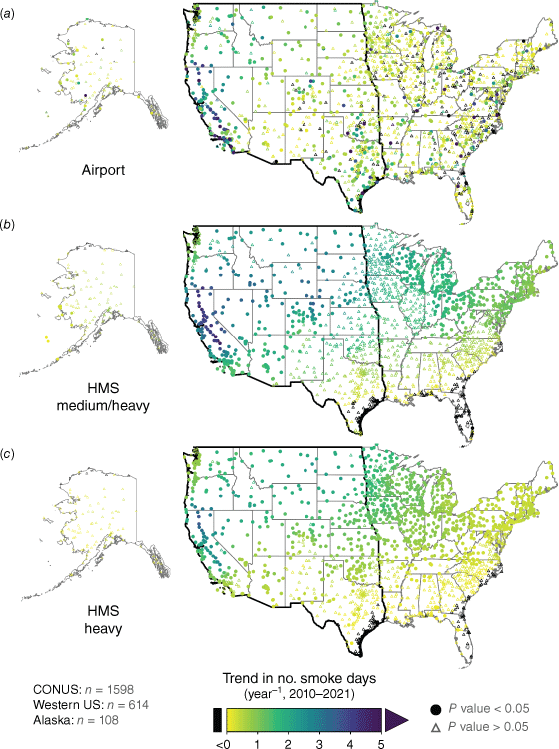
We compare HMS and ISD average smoke days (Fig. 2, Supplementary Table S2) and trends in smoke days (Fig. 3, Supplementary Tables S1, S3) from 2010 to 2021 across airport locations in CONUS (n = 1598) and Alaska (n = 108). In general, HMS shows large-scale changes in smoke presence with high spatial autocorrelation, whereas ISD shows more localised patterns in smoke days and their trends. Sporadic hotspots evident in ISD smoke days across the East and Midwest may be attributed to inconsistencies in the automated system for smoke detection or contamination from nearby local pollution sources. Despite this caveat in ISD data, we can still examine differences between HMS and ISD on a broad regional scale (Fig. 1).
Average number of smoke days across the contiguous United States (CONUS) and Alaska from 2010 to 2021. Smoke days for each year are derived from: (a) ISD airport smoke observations; (b) HMS medium and heavy smoke plumes; and (c) HMS heavy smoke plumes. The colour indicates the average number of HMS smoke days at airport locations. Values inset indicate the total number of airport locations in CONUS, western US and Alaska. States in the western US are outlined by the thick border.
Linear trends in number of smoke days per year across the contiguous United States (CONUS) and Alaska from 2010 to 2021. Trends are calculated from: (a) ISD airport smoke observations; (b) HMS medium and heavy smoke plumes; and (c) HMS heavy smoke plumes. HMS trends in (b) and (c) are shown at the ISD airport locations in (a). The colour indicates the magnitude of the linear trend in smoke days per year at airport locations. Locations with statistically significant trends (P value < 0.05) are denoted by filled-in circles; conversely, locations where linear trends are not statistically significant (P value > 0.05) are denoted by small triangles. Values inset indicate the total number of airport locations in CONUS, western US and Alaska. States in the western US are outlined by the thick border.
The dominant source of smoke varies by region. Wildfires dominate the West and Alaska, while the Southeast mainly sees agricultural fires and prescribed burns; the Midwest and Northeast typically experience smoke transported from western states or Canada (Cottle et al. 2014; Brey et al. 2018). HMS identifies the highest smoke pollution in Pacific and Midwest states. Consistent across HMS and ISD-derived smoke days, Pacific states (CA, WA and OR) comprise the most smoke-polluted region (Figs 2, 3). This finding is underscored by a cluster of airport locations observing over 10 smoke days per year within California’s Central Valley, which is in close proximity to large wildfires and experiences frequent temperature inversions that trap smoke near the surface. In contrast, a large discrepancy between HMS and ISD is evident in the Midwest, or the East North Central and West North Central states. The high smoke pollution derived from HMS in the Midwest – on par or exceeding that in Pacific states in some cases – is largely absent in ISD data. This result suggests that the smoke over the Midwest is often aloft and may not affect surface air quality, in line with key findings by Brey et al. (2018).
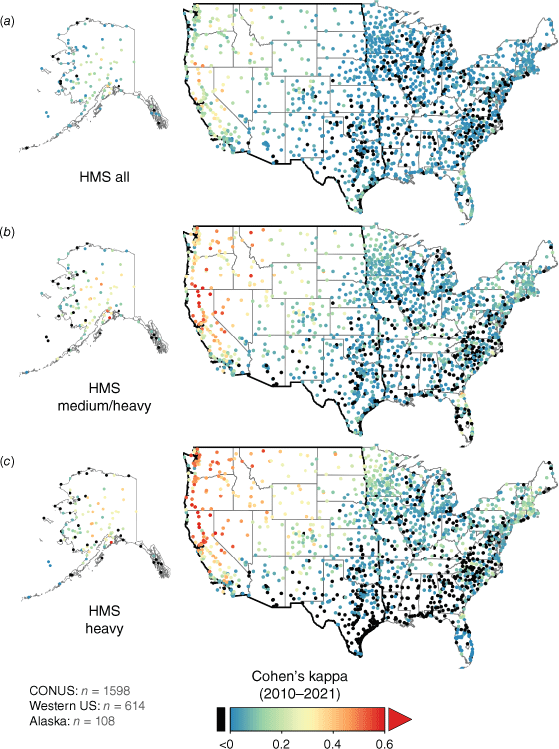
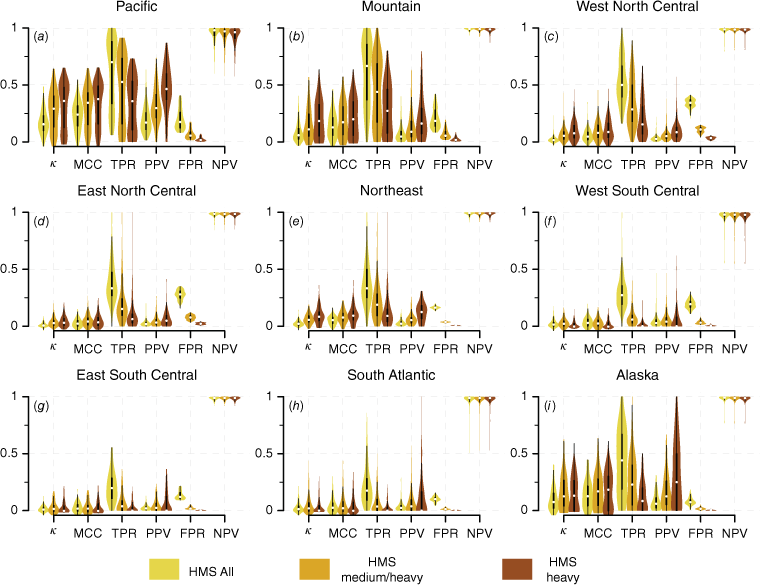
The contrast between Pacific and Midwest states is supported by the spatial variation in Cohen’s kappa and MCC values calculated from the HMS-ISD agreement in smoke days (Fig. 4). We observe the highest HMS-airport agreement in Pacific states (median κ = 0.36, MCC = 0.38), weak agreement in Mountain states and Alaska (median κ = 0.13–0.18, MCC = 0.18–0.20) and low agreement elsewhere (median κ < 0.1, MCC < 0.1) for the heavy-only HMS smoke day definition (Fig. 5). Across almost all regions, using heavy-only HMS smoke leads to lower recall (TPR) but higher precision (PPV) and lower false positive rates. This results in higher Cohen’s kappa and MCC values for the heavy-only HMS smoke day definition compared with those using both medium and heavy plumes or all HMS plumes. Exceptions where the medium/heavy smoke definition slightly outperforms the heavy-only smoke definition are in West South Central, East South Central and South Atlantic, where the accuracy for all HMS smoke definitions is among the lowest across all regions (median κ ≤ 0.03, MCC ≤ 0.03). The negative predictive value is close to 1 in all regions and for all HMS smoke definitions, indicating low misclassification of non-smoke days.
Agreement between airport and HMS no. smoke days across the contiguous United States (CONUS) and Alaska from 2010 to 2021. For HMS, smoke days for each year are derived from: (a) all smoke plumes; (b) medium and heavy smoke plumes; and (c) heavy smoke plumes. Agreement is shown at airport locations, and states in the western US are outlined by the thick border. Inset values denote the total number of airport locations in CONUS, western US and Alaska. Agreement is shown as Cohen’s kappa, where higher values (warmer colours) indicate greater agreement. Negative Cohen’s kappa, or no agreement, is indicated by black dots.
Violin plots of the agreement between HMS and airport no. smoke days in the United States and Alaska by region from 2010 to 2021. Regions represented in (a)–(i) are defined in Fig. 1. The violin plot is a hybrid of a box plot and a kernel density plot (as shown by the shape). Smoke days are derived from ISD airport smoke observations and compared with those derived from all HMS smoke plumes (yellow), HMS medium and heavy smoke plumes (goldenrod) and HMS heavy smoke plumes (brown). The agreement metrics – Cohen’s kappa (κ), Matthews correlation coefficient (MCC), true positive rate (TPR), positive predictive value (PPV), false positive rate (FPR) and negative predictive value (NPV) – are spatially averaged across airport locations in each region. A value of 1 for κ, MCC, TPR, PPV and NPV and a value of 0 for FPR indicate perfect agreement. The plots show that the best agreement between HMS and airport smoke days – e.g. the greatest κ and MCC – occurs in Pacific and Mountain states and Alaska.
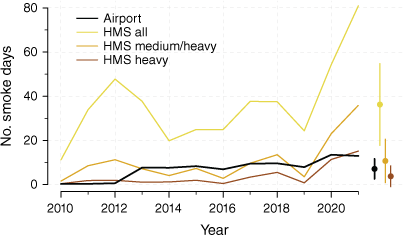
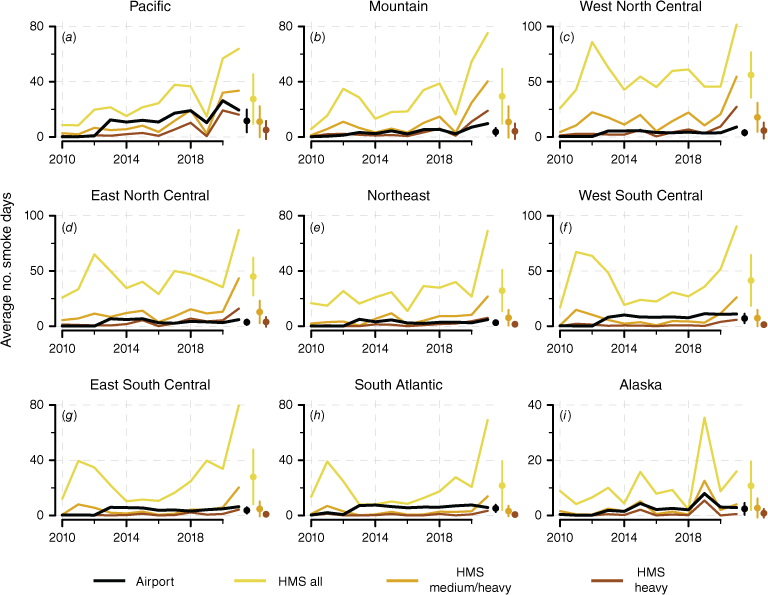
The overestimation of smoke days and their trends by HMS compared with ISD is evident when including medium smoke with heavy smoke, and even more pronounced when all smoke types are considered (Figs 2, 3, 6, 7, Supplementary Tables S2, S3). In the western US, we estimate 7.1 average airport-observed smoke days from 2010 to 2021 at 614 airport locations. In contrast, the number of average HMS-observed smoke days is highly variable depending on the definition, ranging from 3.7 days for heavy smoke to 10.7 days for medium/heavy smoke to 36.2 days for all smoke categories combined (Fig. 6). This pattern extends across all CONUS regions and Alaska, where the inclusion of light smoke plumes leads to 2.4–14.6 times the number of airport smoke days (Fig. 7). Our results suggest that light smoke plumes should generally be excluded for a binary classification of smoke and non-smoke days at the surface.
Number of smoke days in the western United States from 2010 to 2021. Smoke days are spatially averaged across airport locations in the western US, as defined in Fig. 2, and are derived from ISD airport smoke observations (black line), all HMS smoke plumes (yellow line), HMS medium and heavy smoke plumes (goldenrod line) and HMS heavy smoke plumes (brown line).
Number of smoke days in the United States and Alaska by region from 2010 to 2021. Smoke days are spatially averaged across airport locations in each region (a)–(i), as defined in Fig. 1, and are derived from ISD airport smoke observations (black line), all HMS smoke plumes (yellow line), HMS medium and heavy smoke plumes (goldenrod line), and HMS heavy smoke plumes (brown line). Dots to the right of each panel denote annually averaged smoke day number across all years for the four conditions, with error bars representing 1 s.d.
Spatial variability in observed and modelled near-surface smoke PM2.5 levels within HMS smoke polygons
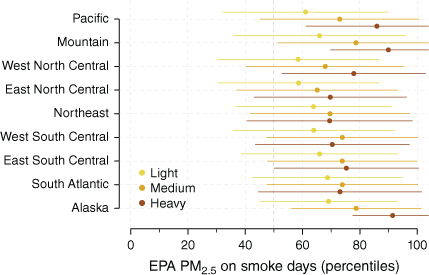
In general, we find that the EPA PM2.5 – particularly on days with a heavy HMS plume overhead – is more easily separated from the PM2.5 on non-smoke days in the Pacific and Mountain regions and Alaska (Fig. 8). On HMS smoke days with heavy plumes, surface concentrations of total PM2.5 in these regions fall in the range of 86–91% on the cumulative probability distribution of background PM2.5 values, whereas those in other regions range from 69 to 78%. Because the 50th percentile, or the median, is often used as the upper limit for background PM2.5 (Koplitz et al. 2016; Childs et al. 2022), PM2.5 on HMS smoke days falling in low percentiles may be misclassified as smoke-affected. The percentiles are generally lowest for light smoke days (58–69%), and highest for heavy smoke days (69–91%), which indicates greater confidence in attributing elevated PM2.5 to smoke during the latter.
Separation of PM2.5 anomalies on smoke and non-smoke days by region at EPA stations from 2010 to 2021. The percentile of the PM2.5 anomaly on an HMS smoke day is calculated relative to the empirical cumulative distribution of PM2.5 anomalies on non-smoke days. Smoke days are classified as light, medium and heavy according to the designation of HMS plume density on that day; if there are multiple plumes, we use the maximum HMS density. The dots show the mean percentile, and the horizontal bars show ±1 s.d. across EPA stations in each region. The 50th percentile, denoted by the vertical grey dotted line, represents the typical value used as the background PM2.5. Higher percentiles denote more separation between the PM2.5 on smoke and non-smoke days and imply greater confidence in attribution of elevated PM2.5 to smoke.
We find that in 2021, the PM2.5 equivalents of the HMS light (5 [0–10] μg/m3), medium (16 [10–21] μg/m3) and heavy (27 [21–32] μg/m3) density categories correspond well to the EPA and HRRR-Smoke near-surface smoke PM2.5 concentrations in the Pacific and Mountain regions and Alaska, but not so well elsewhere across CONUS (Fig. 9). Modelled smoke concentrations in 2021 for the Pacific region are close to the HMS equivalent values for those plumes, with averages of 9, 17 and 36 μg/m3 in the three categories in order of increasing density (Fig. 9b). For the Mountain region, the distinctions between near-surface modelled PM2.5 within the three categories of HMS plumes are much less, with averages of 5, 9 and 16 μg/m3; these modelled values also deviate from the HMS PM2.5 equivalent ranges. For all other regions, the average near-surface PM2.5 values within medium and heavy plumes all fall within the light smoke PM2.5 equivalent range (<10 μg/m3), which suggests that most smoke is actually aloft over these regions. We find similar patterns in the EPA AQS-derived smoke PM2.5 in 2021 (Fig. 9a). Reasons for the slightly lower smoke PM2.5 from EPA relative to HRRR-Smoke may include the imperfect assumption of the background PM2.5 as the median PM2.5 on non-smoke days, missing data and spatial bias of EPA stations in urban centres and overall sparsity in spatial coverage. Previous studies have found night-time overestimates in HRRR-Smoke and underestimates in this dataset when FRP is biased low compared with observations (Ye et al. 2021; Chow et al. 2022).
Violin plots of daily smoke PM2.5 from EPA monitors and the HRRR-Smoke by region and HMS smoke density category in 2021. The violin plot is a hybrid of a box plot and a kernel density plot (as shown by the shape). The violin plots show the distribution of daily PM2.5 within light (yellow), medium (goldenrod) and heavy (brown) HMS smoke polygons (a) at EPA monitors, and (b) from the HRRR-Smoke model. The vertically shaded areas show the equivalent PM2.5 ranges for the HMS smoke density categories. For example, the brown violin for the Northeast US shows the range of EPA and HRRR-Smoke PM2.5 concentrations occurring within HMS polygons designated as heavy. The median of this subset in both the HRRR and EPA datasets in the Northeast (white dots) is <10 μg m−3, whereas the approximate range of values for heavy HMS smoke is designated as 21–32 μg m−3. This large mismatch suggests that much of the heavy smoke detected by HMS in this region is likely aloft.
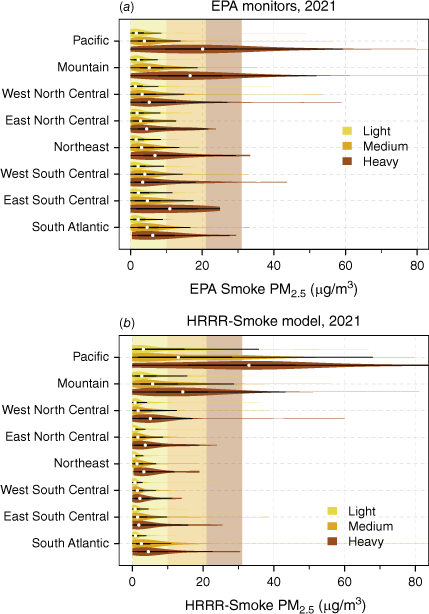
Even within HMS plumes of the same category, we find regional biases in the magnitude of the surface smoke PM2.5 concentration and the separation of the PM2.5 from the background PM2.5. Although a smoke plume may have uniform opacity and thickness as seen from satellite imagery – thereby allowing an analyst to justify labelling it with a single HMS density category – the underlying surface smoke PM2.5 may differ substantially depending on location. The reprocessing of the HMS smoke product in 2022 removed the link between the smoke density categories and PM2.5 equivalents, which discouraged the data user from incorrectly deriving surface smoke PM2.5 from HMS. We recommend that data users interpret the HMS smoke density categories with caution and carefully assess potential regional biases.
Comparison of strengths and caveats of HMS, airport and model estimates of surface smoke presence
Here, we outline the strengths and caveats of using HMS, airport observations, EPA AQS measurements and model estimates as indicators of surface smoke presence. Understanding the strengths and caveats of these different datasets is an important step in designing a study on quantifying the impacts of fire-induced smoke exposure.
The HMS smoke product is available in near-real-time and provides a simple classification of smoke density (light, medium, heavy) for digitised smoke plumes. However, the smoke plumes are mapped based on an analyst’s interpretation of true-colour satellite imagery during the daytime, primarily around sunrise and sunset when it is easiest to isolate smoke in satellite imagery. Human error, limited digitisation of smoke throughout the daytime, the coarse resolution and parallax displacement of GOES imagery, as well as potential cloud cover, can all lead to biases and inconsistencies in the dataset. Additionally, the HMS smoke product represents column observations of smoke. When used as an indicator of surface smoke, regional biases arise, caused by variance in the altitude of smoke plumes. Using HMS leads to inflated surface smoke estimates in regions with mostly aloft smoke. This regional bias propagates to using the smoke density categories to differentiate surface smoke levels.
Airport observations are available in near-real-time and provide a ground-level view of smoke presence and levels of visibility reduction. However, the density of observations is sparse given the available airport locations (Fig. 1). Caveats include airport-to-airport differences in observations, potential contamination by local sources (e.g. industrial combustion unrelated to wildfires), or misdiagnosis of smoke as some other air pollutant, which could lead to errors in reporting smoke influence. Differences between the judgement of observers likely contribute to inconsistencies between airports. Dilute smoke may also be under-reported as such smoke is unlikely to create any visibility challenges for pilots. As airport data is underused, these caveats of the ISD dataset are currently not well understood.
EPA stations offer high-quality, ground-based observations of air pollution levels, often in near-real-time. Like the network of ISD airports, the EPA stations are sparsely distributed across the US with a bias toward urban centres (Supplementary Fig. S2). A main caveat is that EPA stations often only report the total PM2.5. The task to separate smoke PM2.5 from the background PM2.5 is non-trivial, with many studies relying on statistical methods. Station measurements from the Interagency Monitoring of Protected Visual Environments (IMPROVE) network and Chemical Speciation Network (CSN) offer some insights into the PM2.5 composition – e.g. organic and black carbon (OC and BC) – but only report every 3 days. It is possible to infer smoke contribution to total PM2.5 during days dominated by OC + BC, but direct attribution is difficult owing to co-varying sources, such as traffic, industrial facilities, dust and secondary organic aerosol formation. Additional data from low-cost sensors, such as the PurpleAir network, may supplement the EPA data and decrease the spatial sparsity of station locations. Barriers to using low-cost sensor data include inherent biases compared with EPA monitors that must be corrected (Jaffe et al. 2023) and recent adoption of pricing schemes that charge end-users for historical data downloads.
Surface smoke estimates from the HRRR-Smoke model or other atmospheric transport models are subject to important limitations and uncertainties. One of the key limitations is dependence on infrequent polar-orbiting satellite fire detections, which can be inaccurate under cloudy or thick smoke conditions (Chow et al. 2022). Beyond the limitation of missing fire detections, there are uncertainties in emission estimates and plume rise parameterisation, as well as deposition and wet and dry removal. The HRRR-Smoke model does not include any chemistry, which can lead to increased uncertainty for more aged smoke plumes. Despite these uncertainties, model outputs provide spatially cohesive smoke PM2.5 estimates and are important where there are few to no ground monitors.
Airport observations, EPA AQS measurements and model estimates have their own biases and uncertainties. However, future studies can take advantage of the agreement and disagreement between ground, satellite and model estimates to draw more robust conclusions. Based on such comparison, we can pinpoint regions where HMS may not accurately reflect surface smoke presence, such as outside Alaska and the Pacific and Mountain regions.
Accounting for uncertainty in smoke PM2.5 attribution and estimation
Aguilera et al. (2021) and Childs et al. (2022) used HMS smoke plumes as a binary input to statistical and machine learning models to designate PM2.5 as smoke or non-smoke related. In line with our results, Qiu et al. (2024) found that chemical transport models outperform HMS-based models in the Midwest and eastern US where smoke is generally aloft.
We show that HMS-based studies can account for uncertainty in smoke attribution by leveraging (1) the three smoke density categories inherent to the HMS smoke product, as well as (2) the degree of separation between PM2.5 anomalies and the distribution of historical non-smoke PM2.5 anomalies. For example, those days with a heavy HMS plume overhead and PM2.5 anomaly at a high percentile relative to background PM2.5 anomalies are more likely to be smoke-driven. Using the two criteria, we can define ‘confidence’ levels ranging from low to high, where high confidence represents a conservative or lower bound estimate, and conversely, low confidence represents a lax or upper bound estimate (Supplementary Table S4, Supplementary Fig. S2). We find the lowest ratios of low versus high confidence categories for smoke PM2.5 in Alaska and the Pacific and Mountain regions (1.6–2.8) compared with other regions (4.6–28.5) (Supplementary Fig. S3). Thus, inclusion of HMS light smoke plumes to designate smoke days leads to more positive bias in the Midwest and eastern US.
To extend analyses prior to 2010, we develop a random forest model to recover the loss of smoke density categories with a test accuracy of 85% for light smoke, 58% for medium smoke and 66% for heavy smoke (Supplementary Information, Fig. S4, Table S5). Although the gap-filling method does not recover the smoke density categories perfectly, it is still useful – for example, for reducing overestimates in smoke PM2.5 by excluding days with only light smoke plumes.
As we show here, end-users can implement a confidence-based system based on criteria such as HMS smoke density categories and the degree of separation from the background PM2.5 anomalies to provide lower and upper-bound smoke PM2.5 estimates and account for uncertainty in smoke PM2.5 attribution. Additional observational, satellite, model-based information can be used to improve this system, in particular to identify underestimates in HMS smoke days due to observational constraints from daytime-only mapping or cloud cover.
Conclusion
In summary, we present three lines of evidence from airport observations, EPA AQS measurements and HRRR-Smoke model estimates that across much of CONUS and Alaska, the HMS smoke product conflates surface smoke presence with smoke aloft. Only in western US and Alaska does the HMS smoke product appear to agree consistently with other measures of surface smoke. For example, compared with the airport-observed average of 7.1 smoke days per year in the western US from 2010 to 2021, HMS severely overestimates the number of smoke days if all smoke density categories (light, medium and heavy) are included (36.2 days). Using only medium and heavy plumes (10.7 days) or only heavy plumes (3.7 days) leads to better agreement with airport observations in this region. Outside the western US and Alaska, observed and modelled surface smoke PM2.5 concentrations occurring within medium and heavy HMS plumes are similar to those of light plumes (<10 μg/m3). This finding suggests that the impact of smoke on surface air quality is relatively low in areas where smoke is often aloft, though the corresponding plumes may be categorised as medium or heavy density by HMS. Exceptions to this, however, can be seen from Canada’s recent record-breaking fire season in 2023, when smoke from these fires degraded surface air quality to unhealthy levels in northeastern and midwestern states. For future studies, we urge caution in using the HMS smoke product as a broad indicator of surface smoke, as its performance varies widely by region, and inclusion of light smoke – and sometimes, even medium smoke – inflates both the number of and trend in smoke days. We recommend using the HMS smoke product in conjunction with surface monitor observations and the HRRR-Smoke or other smoke forecast models. For defining smoke days, using only heavy or both medium and heavy smoke plumes can serve as lower and upper bound estimates, respectively.
Data availability
The Hazard Mapping System (HMS) smoke product (https://satepsanone.nesdis.noaa.gov/pub/FIRE/web/HMS/Smoke_Polygons/Shapefile/), Integrated Surface Database (ISD) of airport observations (https://www.ncei.noaa.gov/data/global-hourly/archive/csv/) and HRRR-Smoke model outputs (https://rapidrefresh.noaa.gov/hrrr/HRRRsmoke/) are distributed by NOAA. The MODIS MAIAC aerosol product is distributed by NASA (https://doi.org/10.5067/MODIS/MCD19A2.006) and available from the Google Earth Engine public data catalogue. Code for processing and visualizing the HMS smoke product is available in a GitHub repository (https://github.com/tianjialiu/HMS-Smoke).
Declaration of funding
This study was supported by the NOAA Climate Program Office’s Modelling, Analysis, Predictions, and Projections Program (MAPP), Grant NA22OAR4310140. T. Liu and D. C. Pendergrass were funded by NSF Graduate Research Fellowships (NSF grant DGE1745303). T. Liu and M. Kelp were funded by the NOAA Climate and Global Change Postdoctoral Fellowship Program, administered by UCAR’s Cooperative Programs for the Advancement of Earth System Science (CPAESS) under the NOAA Science Collaboration Program award NA21OAR4310383. F. M. Panday was funded by the NSF program for Research Experiences for Undergraduates, Grant 2150058. M. C. Caine was funded by the Harvard University Center for the Environment (HUCE) Summer Undergraduate Research Fund and Harvard College Research Program (HCRP).
References
Aguilera R, Corringham T, Gershunov A, Benmarhnia T (2021) Wildfire smoke impacts respiratory health more than fine particles from other sources: observational evidence from Southern California. Nature Communications 12, 1493.
| Crossref | Google Scholar | PubMed |
Ahmadov R, Grell G, James E, Csiszar I, Tsidulko M, Pierce B, McKeen S, Benjamin S, Alexander C, Pereira G, Freitas S, Goldberg M (2017) Using VIIRS fire radiative power data to simulate biomass burning emissions, plume rise and smoke transport in a real-time air quality modeling system. In ‘2017 IEEE International Geoscience and Remote Sensing Symposium (IGARSS)’. Fort Worth, TX, USA. pp. 2806–2808. 10.1109/IGARSS.2017.8127581
Benjamin SG, James EP, Brown JM, Szoke EJ, Kenyon JS, Ahmadov R, Turner DD (2021) Diagnostic fields developed for hourly updated NOAA weather models. 10.25923/f7b4-rx42
Brey SJ, Ruminski M, Atwood SA, Fischer EV (2018) Connecting smoke plumes to sources using Hazard Mapping System (HMS) smoke and fire location data over North America. Atmospheric Chemistry and Physics 18, 1745-1761.
| Crossref | Google Scholar |
Burke M, Driscoll A, Heft-Neal S, Xue J, Burney J, Wara M (2021) The changing risk and burden of wildfire in the United States. Proceedings of the National Academy of Sciences 118, e2011048118.
| Crossref | Google Scholar | PubMed |
Carter T, Heald C, Jimenez J, Campuzano-Jost P, Kondo Y, Moteki N, Schwarz J, Wiedinmyer C, Darmenov A, Kaiser J (2020) How emissions uncertainty influences the distribution and radiative impacts of smoke from fires in North America. Atmospheric Chemistry and Physics 20, 2073-2097.
| Crossref | Google Scholar |
Chicco D, Warrens MJ, Jurman G (2021) The Matthews Correlation Coefficient (MCC) is more informative than Cohen’s Kappa and Brier Score in binary classification assessment. IEEE Access 9, 78368-78381.
| Crossref | Google Scholar |
Childs ML, Li J, Wen J, Heft-neal S, Driscoll A, Wang S, Gould CF, Qiu M, Burney J, Burke M (2022) Daily local-level estimates of ambient wildfire smoke PM2.5 for the contiguous US. Environmental Science & Technology 56, 13607-13621.
| Crossref | Google Scholar | PubMed |
Chow FK, Yu KA, Young A, James E, Grell GA, Csiszar I, Tsidulko M, Freitas S, Pereira G, Giglio L, Friberg MD, Ahmadov R (2022) High-resolution smoke forecasting for the 2018 Camp Fire in California. Bulletin of the American Meteorological Society 103, E1531-E1552.
| Crossref | Google Scholar |
Cohen J (1960) A coefficient of agreement for nominal scales. Educational and Psychological Measurement 20, 37-46.
| Crossref | Google Scholar |
Cottle P, Strawbridge K, McKendry I (2014) Long-range transport of Siberian wildfire smoke to British Columbia: Lidar observations and air quality impacts. Atmospheric Environment 90, 71-77.
| Crossref | Google Scholar |
Dowell DC, Alexander CR, James EP, Weygandt SS, Benjamin SG, Manikin GS, Blake BT, Brown JM, Olson JB, Hu M, Smirnova TG, Ladwig T, Kenyon JS, Ahmadov R, Turner DD, Duda JD, Alcott TI (2022) The High-Resolution Rapid Refresh (HRRR): an hourly updating convection-allowing forecast model. Part I: Motivation and system description. Weather and Forecasting 37, 1371-1395.
| Crossref | Google Scholar |
Jaffe DA, Miller C, Thompson K, Finley B, Nelson M, Ouimette J, Andrews E (2023) An evaluation of the US EPA’s correction equation for PurpleAir sensor data in smoke, dust, and wintertime urban pollution events. Atmospheric Measurement Techniques 16, 1311-1322.
| Crossref | Google Scholar |
Juang CS, Williams AP, Abatzoglou JT, Balch JK, Hurteau MD, Moritz MA (2022) Rapid growth of large forest fires drives the exponential response of annual forest‐fire area to aridity in the western United States. Geophysical Research Letters 49, e2021GL097131.
| Crossref | Google Scholar | PubMed |
Kelp MM, Carroll MC, Liu T, Yantosca RM, Hockenberry HE, Mickley LJ (2023) Prescribed burns as a tool to mitigate future wildfire smoke exposure: lessons for states and rural environmental Justice Communities. Earth’s Future 11, e2022EF003468.
| Crossref | Google Scholar |
Koplitz SN, Mickley LJ, Marlier ME, Buonocore JJ, Kim PS, Liu T, Sulprizio MP, DeFries RS, Jacob DJ, Schwartz J, Pongsiri M, Myers SS (2016) Public health impacts of the severe haze in Equatorial Asia in September–October 2015: demonstration of a new framework for informing fire management strategies to reduce downwind smoke exposure. Environmental Research Letters 11, 94023.
| Crossref | Google Scholar |
Liu T, Mickley LJ, Marlier ME, DeFries RS, Khan MF, Latif MT, Karambelas A (2020) Diagnosing spatial biases and uncertainties in global fire emissions inventories: Indonesia as regional case study. Remote Sensing of Environment 237, 111557.
| Crossref | Google Scholar |
Marlier ME, Liu T, Yu K, Buonocore JJ, Koplitz SN, DeFries RS, Mickley LJ, Jacob DJ, Schwartz J, Wardhana BS, Myers SS (2019) Fires, smoke exposure, and public health: an integrative framework to maximize health benefits from peatland restoration. GeoHealth 3, 178-189.
| Crossref | Google Scholar | PubMed |
Matthews BW (1975) Comparison of the predicted and observed secondary structure of T4 phage lysozyme. Biochimica et Biophysica Acta 405, 442-451.
| Crossref | Google Scholar | PubMed |
O’Dell K, Bilsback K, Ford B, Martenies SE, Magzamen S, Fischer EV, Pierce JR (2021) Estimated mortality and morbidity attributable to smoke plumes in the United States: not just a western US problem. GeoHealth 5, e2021GH000457.
| Crossref | Google Scholar | PubMed |
Office of the Federal Coordinator for Meteorological Services and Supporting Research (1995) Federal Meteorological Handbook No. 1: Surface Weather Observations and Reports. https://www.icams-portal.gov/resources/ofcm/fmh/FMH1/fmh1_2019.pdf
Qiu M, Kelp M, Heft-Neal S, Jin X, Gould CF, Tong DQ, Burke M (2024) Evaluating estimation methods for wildfire smoke and their implications for assessing health effects. Environmental Science & Technology
| Crossref | Google Scholar |
Rolph GD, Draxler RR, Stein AF, Taylor A, Ruminski MG, Kondragunta S, Zeng J, Huang HC, Manikin G, McQueen JT, Davidson PM (2009) Description and verification of the NOAA smoke forecasting system: the 2007 fire season. Weather and Forecasting 24, 361-378.
| Crossref | Google Scholar |
Rosenthal N, Benmarhnia T, Ahmadov R, James E, Marlier ME (2022) Population co-exposure to extreme heat and wildfire smoke pollution in California during 2020. Environmental Research: Climate 1, 025004.
| Crossref | Google Scholar |
Smith A, Lott N, Vose R (2011) The Integrated Surface Database: recent developments and partnerships. Bulletin of the American Meteorological Society 92, 704-708.
| Crossref | Google Scholar |
Syphard AD, Keeley JE, Pfaff AH, Ferschweiler K (2017) Human presence diminishes the importance of climate in driving fire activity across the United States. Proceedings of the National Academy of Sciences 114, 13750-13755.
| Crossref | Google Scholar | PubMed |
US Department of Transportation Federal Aviation Administration (2016) Air Traffic Organization Policy Order JO 7900.5D: Surface Weather Observing. Available at https://www.faa.gov/documentLibrary/media/Order/7900_5D.pdf
Wiggins EB, Yu LE, Holden SR, Chen Y, Kai FM, Czimczik CI, Harvey CF, Santos GM, Xu X, Randerson JT (2018) Smoke radiocarbon measurements from Indonesian fires provide evidence for burning of millennia-aged peat. Proceedings of the National Academy of Sciences 115, 12419-12424.
| Crossref | Google Scholar | PubMed |
Williams AP, Abatzoglou JT, Gershunov A, Guzman‐Morales J, Bishop DA, Balch JK, Lettenmaier DP (2019) Observed impacts of anthropogenic climate change on wildfire in California. Earth’s Future 7, 892-910.
| Crossref | Google Scholar |
Ye X, Arab P, Ahmadov R, James E, Grell GA, Pierce B, Kumar A, Makar P, Chen J, Davignon D, Carmichael GR, Ferrada G, Mcqueen J, Huang J, Kumar R, Emmons L, Herron-Thorpe FL, Parrington M, Engelen R, Peuch VH, Da Silva A, Soja A, Gargulinski E, Wiggins E, Hair JW, Fenn M, Shingler T, Kondragunta S, Lyapustin A, Wang Y, Holben B, Giles DM, Saide PE (2021) Evaluation and intercomparison of wildfire smoke forecasts from multiple modeling systems for the 2019 Williams Flats fire. Atmospheric Chemistry and Physics 21, 14427-14469.
| Crossref | Google Scholar |
Zhou X, Josey K, Kamareddine L, Caine MC, Liu T, Mickley LJ, Cooper M, Dominici F (2021) Excess of COVID-19 cases and deaths due to fine particulate matter exposure during the 2020 wildfires in the United States. Science Advances 7, eabi8789.
| Crossref | Google Scholar | PubMed |


