

Trends and associated factors in HIV testing among heterosexual men and women in Melbourne, Australia, 2011–2020
Warittha Tieosapjaroen A B * , Jason J. Ong A B C , Christopher K. Fairley A B , Kanwal Saleem A B , Tiffany R. Phillips A B , Julien Tran A B , Catriona S. Bradshaw A B , Marcus Y. Chen A B and Eric P. F. Chow A B D
A Melbourne Sexual Health Centre, Alfred Health, Melbourne, Vic., Australia.
B Central Clinical School, Faculty of Medicine, Nursing and Health Sciences, Monash University, Melbourne, Vic., Australia.
C Faculty of Infectious Diseases, London School of Hygiene and Tropical Medicine, London, UK.
D Centre for Epidemiology and Biostatistics, Melbourne School of Population and Global Health, The University of Melbourne, Melbourne, Vic., Australia.
Abstract
Despite the increase in the proportion of HIV notifications attributed to heterosexuals in Australia, little is known about their HIV testing behaviours. We investigated the trends and factors associated with HIV testing behaviours among heterosexuals.
We analysed the trend and proportion of heterosexuals attending the centre for the first time between 2011 and 2020, who had ever tested and tested for HIV in the past 12 months and the median number of months since their last HIV test. We identified factors associated with HIV testing behaviours using univariable and multivariable logistic regressions.
Of the 78 652 heterosexuals included, 53.1% were men and 46.9% were women. Overall, the proportion of heterosexuals who had ever tested for HIV was 40.8%, with a declining testing trend from 40.2% in 2011 to 36.5% in 2020 (Ptrend < 0.001). Overall, the proportion of heterosexuals tested for HIV in the past 12 months was 15.7%, with no significant change from 15.3% in 2011 to 14.7% in 2020 (Ptrend = 0.489). The median number of months since the last HIV test decreased from 18.0 (IQR 6.9–37.3) in 2011 to 15.0 (IQR 6.4–32.5) in 2020 (Ptrend < 0.001). Individuals who had condomless sex with casual partners (aOR 0.92, 95% CI 0.88–0.96) and who were diagnosed with a sexually transmitted infection (aOR 0.88, 95% CI 0.84–0.93) were less likely to have ever tested for HIV.
HIV testing was low among heterosexuals, and individuals who engaged in condomless sex and had another sexually transmitted infection were less likely to be tested. To reduce HIV transmission, strategies to improve HIV testing among heterosexuals are needed.
Keywords: condoms, diagnostics, heterosexuality, HIV testing, HIV/AIDS, infection, sexual practices, STIs.
Introduction
It is estimated that ~29 090 people were living with HIV in Australia in 2020.1 The average lifetime cost of HIV management is more than AU$280 000 for each individual in Australia.2 Reducing the number of HIV cases will benefit the public health system and the nation in terms of finance and workforce.3 Given the absence of an effective cure for HIV, it is imperative to prioritise the prevention of transmission and early diagnosis to control the number of new HIV cases in Australia.4
HIV notification rates in Australia have significantly declined, from 4.5 per 100 000 in 2011 to 2.5 per 100 000 in 2020. This reduction was mainly due to the scale-up of effective combined antiretroviral therapy and the availability of HIV pre-exposure prophylaxis.5 In Australia, the majority of new HIV cases were among gay, bisexual and other men who have sex with men (MSM); however, there has been an increase in the proportion of new HIV cases among the heterosexual population. Indeed, the proportion of HIV notifications among MSM decreased from 70% in 2012 to 58% in 2020, whereas new HIV cases among heterosexuals increased from 19% in 2012 to 24% in 2020.6,7 It is estimated that up to 31% of new HIV infections were caused by transmission from a partner with unknown HIV status to another partner,8 and ~9% of individuals with HIV in Australia in 2020 were unaware that they are living with HIV.6 Regular HIV testing facilitates early diagnosis and treatments for individuals, which is essential to end this pandemic.8–10
Numerous Australian studies have examined HIV testing patterns and factors associated with HIV testing.5,11–13 However, most of these studies focus on MSM, and there are limited studies on heterosexuals, despite heterosexuals living with HIV accounting for 24% of the new HIV cases in 2020.6 The Second Australian Study of Health and Relationships conducted in 2012–2013 reported that the proportion of heterosexual men who had ever tested for HIV was only 35% compared with 89% among gay men; similarly, the proportion of heterosexual women who had ever tested for HIV was 37% compared with 50% among bisexual women.14
Several strategies, such as an expansion of HIV testing technologies (e.g. point-of-care or HIV self-testing) and variable access to rapid HIV testing in community and clinical settings, were introduced to boost HIV testing in Australia.15 According to the Eighth National HIV Strategy 2018–2022, in Australia, HIV testing is indicated for groups that are vulnerable to acquiring HIV, including MSM, transgender women, Aboriginal and Torres Strait Islander peoples, and other groups, such as people who inject drugs and/or those who have travelled to countries with high HIV prevalence.15 Heterosexual individuals usually have a comparatively low risk for HIV acquisition, and thus are not recommended for regular HIV testing.
Given the rise in the proportion of new HIV notifications among heterosexuals,16 and little is known about HIV testing behaviours among heterosexuals, particularly after 2013,17 we, therefore, conducted this study to investigate the trends and associated factors in HIV testing behaviours among heterosexuals attending an urban public sexual health clinic in Melbourne, Australia, between 2011 and 2020.
Method
Data collection and setting
The Melbourne Sexual Health Centre (MSHC) is the largest public sexual health centre providing free testing and treatment for HIV and other sexually transmitted infections (STI) in Victoria, Australia. There were approximately 57 000 consultations in 2019.18 Upon arrival, all new clients were invited to complete a routine questionnaire via computer-assisted self-interviewing, which collected information on demographic characteristics, sexual behaviours and HIV test history. We extracted data relevant to HIV testing (e.g. the date of the last HIV test and HIV diagnosis) from the electronic medical records. Ethics approval for this study was obtained from the Alfred Hospital Ethics Committee, Melbourne, Australia (project number 172/20).
Definition of study populations and subpopulations
We included heterosexual individuals who were aged at least 16 years, and visited MSHC for the first time between 2011 and 2020. In this study, we defined ‘heterosexual’ as men or women who did not have any same-sex partners in the past 12 months. We excluded individuals if they: (1) were currently working or had ever worked as sex workers, because sex workers in Victoria were required to have regular HIV tests for work during the study period;19 (2) reported an invalid date of the last HIV test, such as the date of last HIV test was after the date of consultation or the date of the last HIV test before 1 January 1985; (3) had sex with at least one same-sex partner in the past 12 months; or (4) reported they were living with HIV. We also categorised individuals into several subgroups in relation to their risk of HIV. We defined ‘individuals with an STI’ as individuals who were diagnosed with an STI (i.e. chlamydia, gonorrhoea or syphilis) on the consultation day; and ‘symptomatic individuals’ as individuals who presented to the clinic with STI-related symptoms or other specific reasons that require testing (e.g. reported contact with sexual partners with an STI).11 We categorised individuals’ regions of birth into nine regions as per the Standard Australian Classification of Countries.20 Furthermore, we defined ‘recently arrived’ individuals as individuals who arrived in Australia <5 years from the visit date.21
Statistical analysis
We calculated the proportion of individuals who: (1) had ever tested for HIV, and (2) had tested for HIV in the past 12 months. We also calculated the time since the last HIV test from the date of the last HIV test to the consultation day, and we reported the median and interquartile range (IQR) of the months since the last HIV test. Univariable and multivariable logistic regression analyses were performed to identify the factors associated with individuals who had ever tested for HIV and individuals who had tested for HIV in the past 12 months. Factors with P ≤ 0.2 in univariable logistic regression analyses were considered potential confounding factors and were included in the multivariable logistic regression analyses. We adjusted for sex, age, region of birth, aboriginal status, history of STI, injecting drug use, marital status, the total number of partners, condom use with regular partners and casual partners, year of consultation, year of arrival, and STI diagnosis on the consultation day. Crude and adjusted odds ratios (OR) and the corresponding 95% confidence intervals (CIs) were reported. The Chi-squared trend test was used to examine whether there was an increasing or decreasing trend in the proportion of HIV testing over the study period (had ever tested for HIV and tested for HIV in the past 12 months). Trends were also examined among individuals with an STI and symptomatic individuals separately. The Jonckheere–Terpstra trend test was used to examine whether there was an increasing or decreasing trend in the median number of months since the last HIV test over the study period. When comparing more than two groups, Kruskal–Wallis test was used. All statistical analyses were performed using Stata (ver. 17.0; StataCorp LP, College Station, TX, USA).
Results
Demographic characteristics
There were 90 768 heterosexual individuals who first visited MSHC between 2011 and 2020. We excluded 12 116 individuals due to: being current or previous sex workers (n = 5914), having same-sex partners in the past 12 months (n = 3630), duplicated records on the same day (n = 1780), living with HIV (n = 716), having an invalid date of the last HIV test (n = 71), or missing data on age (n = 5; Supplementary Table S1). The remaining 78 652 heterosexual individuals were included in the final analysis, with 41 779 (53.1%) men and 36 873 (46.9%) women. The mean age was 28.7 years (s.d. ± 8.74 years). There were 44.0% (n = 18 399) born in Oceania and Antarctica, followed by 24.6% (n = 10 276) in North-west Europe and 5.6% (n = 2357) in the Americas. The median number of opposite-sex partners in the past 12 months was three (IQR 2, 5). There were 24 304 (58.2%) heterosexuals who reported at least one occasion of condomless sex in the past 12 months (Table 1).
| Men (N = 41 779) | % | Women (N = 36 873) | % | Overall (N = 78 652) | % | ||
|---|---|---|---|---|---|---|---|
| Age (years) | |||||||
| Mean (± s.d.) | 30.2 (±9.7) | 26.9 (±7.2) | 28.7 (±8.7) | ||||
| Median (IQR) | 27 (24, 33) | 25 (23, 29) | 26 (23, 31) | ||||
| Age (years), n (%) | |||||||
| 16–19 | 1293 | 3.1 | 2141 | 5.8 | 3434 | 4.4 | |
| 20–29 | 24 411 | 58.4 | 26 196 | 71.0 | 50 607 | 64.4 | |
| 30–39 | 10 047 | 24.1 | 6405 | 17.4 | 16 452 | 20.9 | |
| 40–49 | 3536 | 8.5 | 1373 | 3.7 | 4909 | 6.2 | |
| 50–59 | 1699 | 4.1 | 539 | 1.5 | 2238 | 2.9 | |
| ≥60 | 793 | 1.9 | 219 | 0.6 | 1012 | 1.3 | |
| Region of birth, n (%) | |||||||
| Oceania and Antarctica | 18 399 | 44.0 | 11 482 | 31.1 | 29 881 | 38.0 | |
| North-west Europe | 10 276 | 24.6 | 11 475 | 31.1 | 21 751 | 27.7 | |
| South-east Europe | 1499 | 3.6 | 1232 | 3.3 | 2731 | 3.5 | |
| North Africa and Middle East | 931 | 2.2 | 356 | 1.0 | 1287 | 1.6 | |
| South-east Asia | 1259 | 3.0 | 1932 | 5.2 | 3191 | 4.1 | |
| North-east Asia | 1567 | 3.8 | 2482 | 6.7 | 4049 | 5.2 | |
| South-central Asia | 2019 | 4.8 | 437 | 1.2 | 2456 | 3.1 | |
| Americas | 2357 | 5.6 | 4155 | 11.3 | 6512 | 8.3 | |
| Sub-Saharan Africa | 680 | 1.6 | 499 | 1.4 | 1179 | 1.5 | |
| Unknown | 2792 | 6.7 | 2823 | 7.7 | 5615 | 7.1 | |
| Aboriginal Torres Strait Islander, n (%) | |||||||
| No | 35 928 | 86.0 | 31 374 | 85.1 | 67 302 | 85.6 | |
| Yes | 329 | 0.8 | 412 | 1.1 | 741 | 0.9 | |
| Unknown | 5522 | 13.2 | 5087 | 13.8 | 10 609 | 13.5 | |
| Injecting drug use, n (%) | |||||||
| Never injected | 39 316 | 94.1 | 34 517 | 93.6 | 73 833 | 93.9 | |
| Ever injected | 724 | 1.7 | 365 | 1.0 | 1089 | 1.4 | |
| Unknown | 1739 | 4.2 | 1991 | 5.4 | 3730 | 4.7 | |
| Marital status, n (%) | |||||||
| Married/defacto | 5838 | 14.0 | 2985 | 8.1 | 8823 | 11.2 | |
| Divorced/separated/widowed | 2313 | 5.5 | 1539 | 4.2 | 3852 | 4.9 | |
| Single/never married | 28 590 | 68.4 | 28 028 | 76.0 | 56 618 | 72.0 | |
| Unknown | 5038 | 12.1 | 4321 | 11.7 | 9359 | 11.9 | |
| Presence of symptoms, n (%) | |||||||
| Asymptomatic | 18 426 | 44.1 | 14 501 | 39.3 | 32 927 | 41.9 | |
| Symptomatic/contact of infection | 18 335 | 43.9 | 18 036 | 48.9 | 36 371 | 46.2 | |
| Unknown | 5018 | 12.0 | 4336 | 11.8 | 9354 | 11.9 | |
| Self-reported history of STI, n (%) | |||||||
| No | 31 824 | 76.2 | 26 240 | 71.2 | 58 064 | 73.8 | |
| Yes | 7648 | 18.3 | 8740 | 23.7 | 16 388 | 20.8 | |
| Unknown | 2307 | 5.5 | 1893 | 5.1 | 4200 | 5.3 | |
| STI diagnosis on the consultation day, n (%) | |||||||
| No | 34 123 | 81.7 | 30 544 | 82.8 | 64 667 | 82.2 | |
| Yes | 4165 | 10.0 | 3529 | 9.6 | 7694 | 9.8 | |
| Unknown | 3491 | 8.4 | 2800 | 7.6 | 6291 | 8.0 | |
| No. of partners in the past 12 months | |||||||
| Mean (± s.d.) | 3.6 (±3.7) | 4.9 (±6.2) | 4.3 (±5.2) | ||||
| Median (IQR) | 3 (2, 5) | 3 (2, 6) | 3 (2, 5) | ||||
| Condom use with regular partner in the past 12 months, n (%) | |||||||
| Always | 3143 | 7.5 | 2688 | 7.3 | 5831 | 7.4 | |
| Not always | 14 258 | 34.1 | 12 281 | 33.3 | 26 539 | 33.7 | |
| No regular partner | 18 987 | 45.5 | 17 178 | 46.6 | 36 165 | 46.0 | |
| Unknown | 5391 | 12.9 | 4726 | 12.8 | 10 117 | 12.9 | |
| Condom use with casual partners in the past 12 months, n (%) | |||||||
| Always | 6541 | 15.7 | 4491 | 12.2 | 11 032 | 14.0 | |
| Not always | 24 304 | 58.2 | 22 922 | 62.2 | 47 226 | 60.1 | |
| No casual partner | 5754 | 13.8 | 5327 | 14.5 | 11 081 | 14.1 | |
| Unknown | 5178 | 12.4 | 4132 | 11.2 | 9310 | 11.8 | |
| Year of consultation | |||||||
| 2011 | 3540 | 8.5 | 2457 | 6.7 | 5997 | 7.6 | |
| 2012 | 4095 | 9.8 | 2900 | 7.9 | 6995 | 8.9 | |
| 2013 | 4294 | 10.3 | 3485 | 9.5 | 7779 | 9.9 | |
| 2014 | 4406 | 10.6 | 3553 | 9.6 | 7959 | 10.1 | |
| 2015 | 4290 | 10.3 | 3793 | 10.3 | 8083 | 10.3 | |
| 2016 | 4257 | 10.2 | 4084 | 11.1 | 8341 | 10.6 | |
| 2017 | 3999 | 9.6 | 3844 | 10.4 | 7843 | 10.0 | |
| 2018 | 4810 | 11.5 | 4556 | 12.4 | 9366 | 11.9 | |
| 2019 | 5149 | 12.3 | 5204 | 14.1 | 10 353 | 13.2 | |
| 2020 | 2939 | 7.0 | 2997 | 8.1 | 5936 | 7.6 | |
| Year of arrival | |||||||
| ≤5 years | 6159 | 14.8 | 9188 | 24.9 | 15 347 | 19.5 | |
| >5 years | 14 351 | 34.4 | 12 748 | 34.6 | 27 099 | 34.5 | |
| Unknown | 21 269 | 50.9 | 14 937 | 40.5 | 36 206 | 46.0 | |
Number of partners in the past 12 months includes regular and casual partners. STI, diagnosed with chlamydia, gonorrhoea or syphilis on the day of consultation.
Trends in ever having tested for HIV
Overall, the proportion of heterosexuals who had ever tested for HIV was 40.8% (32 078/78 652), with a decline testing trend from 40.2% (2412/5997) in 2011 to 36.5% (2164/5936) in 2020, with a significant annual decrease of 0.99% (95% CI: 0.99–0.99, Ptrend < 0.001) after adjusting for other potential confounders (Table 2).
| Factor | n/N | % | OR | 95% CI | P-value | aOR | 95% CI | P-value | |
|---|---|---|---|---|---|---|---|---|---|
| Sex | |||||||||
| Male | 16 696/41 779 | 39.96 | Ref | Ref | |||||
| Female | 15 382/36 873 | 41.71 | 1.08 | 1.04–1.11 | <0.001 | 1.08 | 1.05–1.12 | <0.001 | |
| Age (years), n (%) | 1.13 | 1.11–1.14 | <0.001 | 1.92 | 1.80–2.05 | <0.001 | |||
| 16–19 | 386/3434 | 11.24 | Ref | Ref | |||||
| 20–29 | 20 214/50 607 | 39.94 | 5.25 | 4.72–5.85 | <0.001 | 3.69 | 3.30–4.13 | <0.001 | |
| 30–39 | 8284/16 452 | 50.35 | 8.01 | 7.17–8.94 | <0.001 | 6.59 | 5.88–7.40 | <0.001 | |
| 40–49 | 2202/4909 | 44.84 | 6.42 | 5.69–7.24 | <0.001 | 6.27 | 5.52–7.14 | <0.001 | |
| 50–59 | 780/2238 | 34.85 | 4.22 | 3.68–4.84 | <0.001 | 4.24 | 3.65–4.92 | <0.001 | |
| ≥60 | 212/1012 | 20.95 | 2.09 | 1.74–2.52 | <0.001 | 2.45 | 2.01–3.00 | <0.001 | |
| Region of birth, n (%) | |||||||||
| Oceania and Antarctica | 10 723/29 881 | 35.88 | Ref | Ref | |||||
| North-west Europe | 10 998/21 751 | 50.56 | 1.83 | 1.76–1.89 | <0.001 | 1.92 | 1.79–205 | <0.001 | |
| South-wast Europe | 1225/2731 | 44.86 | 1.45 | 1.34–1.57 | <0.001 | 1.55 | 1.40–1.71 | <0.001 | |
| North Africa and Middle East | 542/1287 | 42.11 | 1.30 | 1.16–1.46 | <0.001 | 1.56 | 1.36–1.78 | <0.001 | |
| South-east Asia | 1013/3191 | 31.76 | 0.83 | 0.77–0.90 | <0.001 | 1.04 | 0.95–1.15 | 0.395 | |
| North-east Asia | 1135/4049 | 28.03 | 0.70 | 0.65–0.75 | <0.001 | 0.89 | 0.81–0.98 | 0.018 | |
| South-central Asia | 882/2456 | 35.91 | 1.00 | 0.92–1.09 | 0.979 | 1.22 | 1.09–1.35 | <0.001 | |
| Americas | 3460/6512 | 53.12 | 2.03 | 1.92–2.14 | <0.001 | 2.16 | 1.99–2.34 | <0.001 | |
| Sub-Saharan Africa | 625/1179 | 53.01 | 2.02 | 1.79–2.27 | <0.001 | 2.58 | 2.25–2.95 | <0.001 | |
| Unknown | 1475/5615 | 26.25 | 0.64 | 0.60–0.68 | <0.001 | 1.23 | 1.13–1.35 | <0.001 | |
| Aboriginal and Torres Strait Islander, n (%) | |||||||||
| No | 28 422/67 302 | 42.23 | Ref | Ref | |||||
| Yes | 222/741 | 29.96 | 0.59 | 0.50–0.69 | <0.001 | 0.90 | 0.75–1.07 | 0.225 | |
| Unknown | 3434/10 609 | 32.37 | 0.65 | 0.63–0.68 | <0.001 | 0.90 | 0.85–0.95 | <0.001 | |
| Self-reported history of STI, n (%) | |||||||||
| No | 19 650/58 064 | 33.84 | Ref | Ref | |||||
| Yes | 10 510/16 388 | 64.13 | 3.50 | 3.37–3.62 | <0.001 | 2.85 | 2.74–2.96 | <0.001 | |
| Unknown | 1918/4200 | 45.67 | 1.64 | 1.54–1.75 | <0.001 | 1.57 | 1.47–1.68 | <0.001 | |
| Injecting drug use, n (%) | |||||||||
| Never injected | 31 194/73 833 | 42.25 | Ref | Ref | |||||
| Ever injected | 518/1089 | 47.57 | 1.24 | 1.10–1.40 | 0.001 | 1.22 | 1.07–1.39 | 0.003 | |
| Unknown | 366/3730 | 9.81 | 0.15 | 0.13–0.17 | <0.001 | 0.45 | 0.39–0.50 | <0.001 | |
| Marital status, n (%) | |||||||||
| Married/defecto | 3741/8823 | 42.40 | Ref | Ref | |||||
| Divorced/separated/widowed | 1769/3852 | 45.92 | 1.15 | 1.07–1.24 | <0.001 | 1.03 | 0.95–1.13 | 0.429 | |
| Single/never married | 23 846/56 618 | 42.12 | 0.99 | 0.94–1.03 | 0.616 | 0.96 | 0.91–1.01 | 0.150 | |
| Unknown | 2722/9359 | 29.08 | 0.56 | 0.52–0.59 | <0.001 | 0.90 | 0.83–0.98 | 0.012 | |
| Presence of symptom, n (%) | |||||||||
| Asymptomatic | 13 280/32 927 | 40.33 | Ref | ||||||
| Symptomatic/contact of infection | 15 559/36 371 | 42.78 | 1.11 | 1.07–1.14 | <0.001 | ||||
| Unknown | 3239/9354 | 34.63 | 0.78 | 0.75–0.82 | <0.001 | ||||
| STI diagnosis on the consultation day, n (%) | |||||||||
| No | 26 532/64 667 | 41.03 | Ref | Ref | |||||
| Yes | 2977/7694 | 38.69 | 0.91 | 0.86–0.95 | <0.001 | 0.88 | 0.84–0.93 | <0.001 | |
| Unknown | 2569/6291 | 40.84 | 0.99 | 0.94–1.05 | 0.767 | 1.59 | 1.49–1.69 | <0.001 | |
| No. of partners in the past 12 months | 1.04 | 1.03–1.04 | <0.001 | 1.01 | 1.01–1.02 | <0.001 | |||
| 4.83 (±5.58) | |||||||||
| 3 (2, 6) | |||||||||
| Condom use with regular partners in the past 12 months, n (%) | |||||||||
| Always | 2431/5831 | 41.69 | Ref | Ref | |||||
| Not always | 11 882/26 539 | 44.77 | 1.13 | 1.07–1.20 | <0.001 | 1.05 | 0.99–1.12 | 0.084 | |
| No regular partner | 16 186/36 165 | 44.76 | 1.13 | 1.07–1.20 | <0.001 | 0.96 | 0.90–1.02 | 0.234 | |
| Unknown | 1579/10 117 | 15.61 | 0.26 | 0.24–0.28 | <0.001 | 0.38 | 0.35–0.42 | <0.001 | |
| Condom use with casual partners in the past 12 months, n (%) | |||||||||
| Always | 4932/11 032 | 44.71 | Ref | Ref | |||||
| Not always | 21 272/47 226 | 45.04 | 1.01 | 0.97–1.06 | 0.522 | 0.92 | 0.88–0.96 | <0.001 | |
| No casual partner | 2186/11081 | 19.73 | 0.30 | 0.29–0.32 | <0.001 | 0.48 | 0.46–0.52 | <0.001 | |
| Unknown | 3688/9313 | 39.6 | 0.81 | 0.78–0.84 | <0.001 | 1.07 | 1.00–1.14 | 0.055 | |
| Year of consultation | 0.99 | 0.99–0.99 | <0.001 | 0.99 | 0.99–0.99 | <0.001 | |||
| 2011 | 2412/5997 | 40.22 | Ref | ||||||
| 2012 | 2920/6995 | 41.04 | 1.07 | 0.99–1.14 | 0.078 | ||||
| 2013 | 3232/7779 | 41.55 | 1.06 | 0.99–1.13 | 0.116 | ||||
| 2014 | 3312/7959 | 41.61 | 1.06 | 0.99–1.13 | 0.098 | ||||
| 2015 | 3426/8083 | 42.39 | 1.09 | 1.02–1.17 | 0.010 | ||||
| 2016 | 3510/8341 | 42.08 | 1.08 | 1.01–1.16 | 0.026 | ||||
| 2017 | 3290/7843 | 41.95 | 1.07 | 1.00–1.15A | 0.041 | ||||
| 2018 | 3826/9366 | 40.85 | 1.03 | 0.96–1.10 | 0.438 | ||||
| 2019 | 3986/10 353 | 38.50 | 0.93 | 0.87–0.99 | 0.030 | ||||
| 2020 | 2164/5936 | 36.46 | 0.85 | 0.79–0.92 | <0.001 | ||||
| Year of arrival | |||||||||
| ≤5 years | 12 283/27 099 | 45.33 | Ref | Ref | |||||
| >5 years | 7182/15 347 | 46.80 | 0.94 | 0.91–0.98 | 0.003 | 0.95 | 0.90–0.99 | 0.022 | |
| Unknown | 12 613/36 206 | 34.84 | 0.61 | 0.58–0.63 | <0.001 | 1.00 | 0.93–1.07 | 0.0907 | |
STI, diagnosed with chlamydia, gonorrhoea or syphilis on the day of consultation.
n, the number of heterosexuals tested for HIV; N, the number of heterosexuals in the subgroup; OR, odds ratio; CI, confidence interval; aOR, adjusted odds ratio; Ref, reference; s.d., standard deviation; IQR, interquartile range. Number of partners in the past 12 months includes regular and casual sex partners.
A95% CI 1.003–1.150.
The proportions of individuals who had ever tested for HIV among heterosexual men and women were 40.0% (16 696/41 779) and 41.7% (15 382/36 873), respectively. In addition, the proportion of symptomatic heterosexuals who had ever tested was 42.8% (15 559/36 371; Table 2), with the declining trend of HIV testing from 42.1% (1318/3131) in 2011 to 39.7% (1311/3300) in 2020 (Ptrend < 0.001; Fig. 1, Table S2).
The trend of the proportion of heterosexuals who had ever tested for HIV between 2011 and 2020.
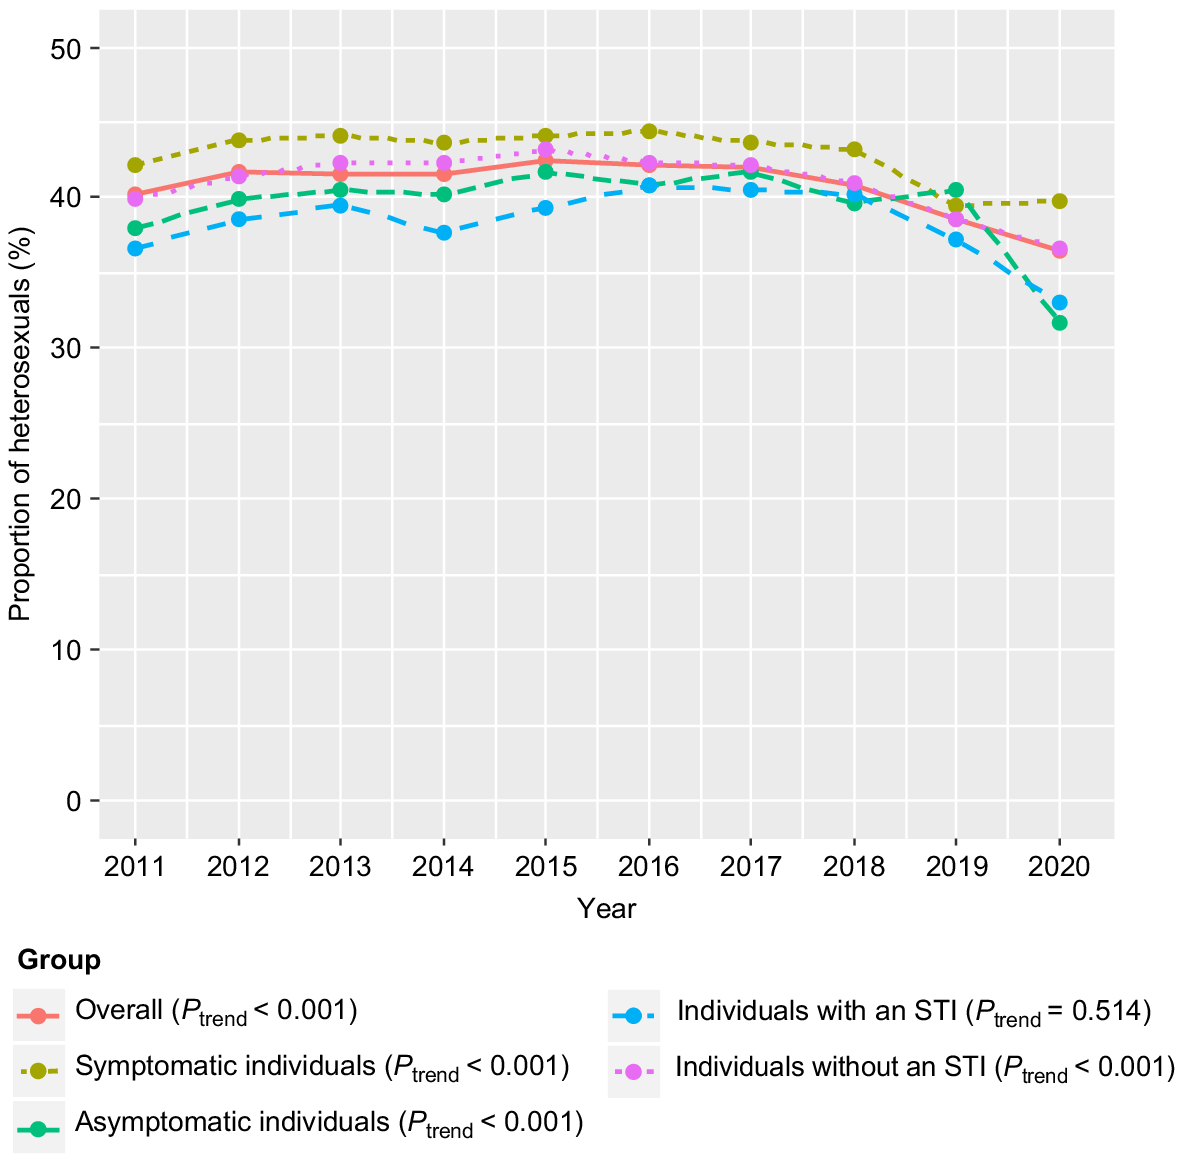
After adjusting for other confounders, the odds of ever testing for HIV in women were higher than in men (aOR 1.08, 95% CI 1.05–1.12; Table 2). Compared with individuals who were born in the Oceania and Antarctica region, individuals who were born in other regions had the highest odds of ever testing; except for individuals who were born in South-east and North-east Asia regions (aOR 1.04, 95% CI 0.95–1.15 and aOR 0.89, 95% CI 0.81–0.98, respectively) after adjusting other confounders (Table 2). Furthermore, individuals who had a past STI (aOR 2.85, 95% CI 2.74–2.96) and individuals with an increased number of partners in the past 12 months (aOR 1.01, 95% CI 1.01–1.02) had higher odds of ever testing for HIV. However, individuals with an STI diagnosis on the day (aOR 0.88, 95% CI 0.84–0.93), had condomless sex with casual partners in the past 12 months (aOR 0.92, 95% CI 0.88–0.96) and arrived in Australia >5 years ago (aOR 0.95, 95% CI 0.90–0.99) had lower odds of ever testing for HIV (Table 2).
Trends in having tested for HIV in the past 12 months
Overall, the proportion of heterosexuals who had ever tested for HIV in the past 12 months was 15.7% (12 354/78 652; Table 3), and there was no significant change between 2011 and 2020 (Ptrend = 0.489; Fig. S1, Table S3). The proportion of heterosexuals with an STI diagnosis on the day who had been tested for HIV in the past 12 months was 16.4% (1265/7694; Table 3), with a rising trend from 13.1% (70/536) in 2011 to 16.6% (81/475) in 2020 (Ptrend < 0.001; Fig. S1, Table S3).
| Factor | n/N | % | OR | 95% CI | P-value | aOR | 95% CI | P-value | ||
|---|---|---|---|---|---|---|---|---|---|---|
| Sex | ||||||||||
| Male | 6239/41 779 | 14.93 | Ref | Ref | ||||||
| Female | 6115/36 873 | 16.58 | 1.13 | 1.09–1.18 | <0.001 | 1.11 | 1.06–1.15 | <0.001 | ||
| Age (years), n (%) | 0.98 | 0.95–1.00 | 0.03 | 1 | 0.97–1.03 | 0.86 | ||||
| 16–19 | 232/3434 | 6.76 | Ref | Ref | ||||||
| 20–29 | 8254/50 607 | 16.31 | 2.69 | 2.35–3.08 | <0.001 | 2.03 | 1.77–2.34 | <0.001 | ||
| 30–39 | 2804/16 452 | 17.04 | 2.84 | 2.47–3.26 | <0.001 | 2.17 | 1.88–2.50 | <0.001 | ||
| 40–49 | 751/4909 | 15.3 | 2.49 | 2.14–2.91 | <0.001 | 2.04 | 1.73–2.40 | <0.001 | ||
| 50–59 | 244/2238 | 10.9 | 1.69 | 1.40–2.04 | <0.001 | 1.47 | 1.20–1.79 | 0.001 | ||
| ≥60 | 69/1012 | 6.82 | 1.01 | 0.76–1.33 | 0.945 | 1 | 0.74–1.33 | 0.981 | ||
| Region of birth, n (%) | ||||||||||
| Oceania and Antarctica | 4496/29 881 | 15.05 | Ref | Ref | ||||||
| North-west Europe | 3848/21 751 | 17.69 | 1.21 | 1.16–1.27 | <0.001 | 1.32 | 1.22–1.44 | <0.001 | ||
| South-east Europe | 431/2731 | 15.78 | 1.06 | 0.95–1.18 | 0.304 | 1.32 | 1.16–1.50 | <0.001 | ||
| North Africa and Middle East | 236/1287 | 18.34 | 1.27 | 1.10–1.47 | 0.001 | 1.7 | 1.44–2.01 | <0.001 | ||
| South-east Asia | 438/3191 | 13.73 | 0.9 | 0.81–1.00 | 0.047 | 1.28 | 1.13–1.46 | <0.001 | ||
| North-east Asia | 540/4049 | 13.34 | 0.87 | 0.79–0.96 | 0.004 | 1.25 | 1.10–1.41 | <0.001 | ||
| South-central Asia | 360/2456 | 14.66 | 0.97 | 0.86–1.09 | 0.605 | 1.43 | 1.24–1.64 | <0.001 | ||
| Americas | 1243/6512 | 19.09 | 1.33 | 1.24–1.43 | <0.001 | 1.54 | 1.39–1.70 | <0.001 | ||
| Sub-Saharan Africa | 222/1179 | 18.83 | 1.31 | 1.13–1.52 | <0.001 | 1.84 | 1.55–2.18 | <0.001 | ||
| Unknown | 540/5615 | 9.62 | 0.6 | 0.55–0.66 | <0.001 | 1 | 089–1.13 | 0.984 | ||
| Aboriginal and Torres Strait Islander, n (%) | ||||||||||
| No | 10 899/67 302 | 16.19 | Ref | Ref | ||||||
| Yes | 91/741 | 12.28 | 0.72 | 0.58–0.90 | 0.004 | 0.92 | 0.73–1.16 | 0.504 | ||
| Unknown | 1364/10 609 | 12.86 | 0.76 | 0.72–0.81 | <0.001 | 1.01 | 0.94–1.09 | 0.754 | ||
| Self-reported history of STI, n (%) | ||||||||||
| No | 6770/58 064 | 11.66 | Ref | Ref | ||||||
| Yes | 4724/16 388 | 28.83 | 3.07 | 2.94–3.20 | <0.001 | 2.53 | 2.42–2.64 | <0.001 | ||
| Unknown | 860/4200 | 20.48 | 1.95 | 1.80–2.11 | <0.001 | 1.78 | 1.64–1.93 | <0.001 | ||
| Injecting drug use | ||||||||||
| Never injected | 12 020/73 833 | 16.28 | Ref | Ref | ||||||
| Ever injected | 193/1089 | 17.76 | 1.11 | 0.95–1.30 | 0.201 | 1.05 | 0.89–1.24 | 0.539 | ||
| Unknown | 141/3730 | 3.83 | 0.20 | 0.17–0.24 | <0.001 | 0.48 | 0.40–0.58 | <0.001 | ||
| Marital status, n (%) | ||||||||||
| Married/defecto | 1327/8823 | 15.04 | Ref | Ref | ||||||
| Divorced/separated/widowed | 669/3852 | 17.37 | 1.19 | 1.07–1.31 | 0.001 | 1.15 | 1.03–1.28 | 0.013 | ||
| Single/never married | 9391/56 618 | 16.59 | 1.12 | 1.06–1.20 | <0.001 | 1.01 | 0.93–1.08 | 0.885 | ||
| Unknown | 967/9359 | 10.33 | 0.65 | 0.60–0.71 | <0.001 | 0.83 | 0.75–0.93 | 0.001 | ||
| Presence of symptom, n (%) | ||||||||||
| Asymptomatic | 4444/32 927 | 13.5 | Ref | |||||||
| Symptomatic/contact of infection | 6442/36 371 | 17.71 | 1.38 | 1.32–1.44 | <0.001 | |||||
| Unknown | 1468/9354 | 15.69 | 1.19 | 1.12–1.27 | <0.001 | |||||
| STI diagnosis on the consultation day, n (%) | ||||||||||
| No | 9488/64 667 | 14.67 | Ref | Ref | ||||||
| Yes | 1265/7694 | 16.44 | 1.14 | 1.07–1.22 | <0.001 | 1.09 | 1.02–1.17 | 0.01 | ||
| Unknown | 1601/6291 | 25.45 | 1.99 | 1.87–2.11 | <0.001 | 2.87 | 2.67–3.07 | <0.001 | ||
| No. of partners in the past 12 months, n (± s.d.) | 1.03 | 1.02–1.03 | <0.001 | 1.02 | 1.01–1.02 | |||||
| Mean (± s.d.) | 5.06 (±5.97) | |||||||||
| Median (IQR) | 4 (2, 6) | |||||||||
| Condom use with regular partner in the past 12 months, n (%) | ||||||||||
| Always | 890/5831 | 15.26 | Ref | Ref | ||||||
| Not always | 4503/26 539 | 16.97 | 1.13 | 1.05–1.23 | 0.002 | 1.08 | 0.99–1.17 | 0.084 | ||
| No regular partner | 6357/36 165 | 17.58 | 1.18 | 1.10–1.28 | <0.001 | 1.06 | 0.98–1.15 | 0.149 | ||
| Unknown | 604/10 117 | 5.97 | 0.35 | 0.32–0.39 | <0.001 | 0.48 | 0.42–0.54 | <0.001 | ||
| Condom use with casual partner in the past 12 months, n (%) | ||||||||||
| Always | 1866/11 032 | 16.91 | Ref | Ref | ||||||
| Not always | 8252/47 226 | 17.47 | 1.04 | 0.98–1.10 | 0.163 | 0.96 | 0.91–1.02 | 0.184 | ||
| No casual partner | 743/11 081 | 6.71 | 0.35 | 0.32–0.39 | <0.001 | 0.49 | 0.45–0.55 | <0.001 | ||
| Unknown | 1493/9313 | 16.04 | 0.94 | 0.87–1.01 | 0.093 | 1.09 | 1.00–1.18 | 0.04 | ||
| Year of consultation | 1.00 | 1.00–1.01 | 0.489 | 1.00 | 1.00–1.01 | 0.535 | ||||
| 2011 | 919/5997 | 15.32 | Ref | |||||||
| 2012 | 1009/6995 | 14.42 | 0.93 | 0.85–1.03 | 0.15 | |||||
| 2013 | 1131/7779 | 14.54 | 0.94 | 0.86–1.03 | 0.199 | |||||
| 2014 | 1201/7959 | 15.09 | 0.98 | 0.89–1.08 | 0.702 | |||||
| 2015 | 1278/8083 | 15.81 | 1.04 | 0.95–1.14 | 0.431 | |||||
| 2016 | 1428/8341 | 17.12 | 1.04 | 1.04–1.25 | 0.004 | |||||
| 2017 | 1285/7843 | 16.38 | 1.08 | 0.99–1.19 | 0.091 | |||||
| 2018 | 1603/9366 | 17.12 | 1.14 | 1.04–1.25 | 0.003 | |||||
| 2019 | 1627/10 353 | 15.72 | 1.03 | 0.94–1.12 | 0.506 | |||||
| 2020 | 873/5936 | 14.71 | 0.95 | 0.86–1.05 | 0.345 | |||||
| Year of arrival | ||||||||||
| ≤5 years | 4339/27 099 | 16.01 | Ref | Ref | ||||||
| >5 years | 2763/15 347 | 18.00 | 0.87 | 0.82–0.92 | <0.001 | 0.91 | 0.86–0.96 | 0.002 | ||
| Unknown | 5252/36 206 | 14.51 | 0.77 | 0.73–0.81 | <0.001 | 1.15 | 1.05–1.25 | 0.002 | ||
Number of partners in the past 12 months includes regular and casual partners. STI, diagnosed with chlamydia, gonorrhoea or syphilis on the day of consultation.
n, the number of heterosexuals tested for HIV; N, the number of heterosexuals in the subgroup; OR, odds ratio; CI, confidence interval; aOR, adjusted odd ratio; Ref, reference; s.d., standard deviation; IQR, interquartile range.
After adjusting for other potential confounders, sub-Saharan African born had the highest odds of testing for HIV in the past 12 months (aOR 1.84, 95% CI 1.55–2.18), whereas North-east Asia had the lowest odds of testing for HIV in the past 12 months (aOR 1.25, 95% CI 1.10–1.41) compared with Oceania- and Antarctica-born heterosexuals. The odds of testing for HIV in the past 12 months among heterosexuals with an STI diagnosis on the consultation day were higher than those without an STI (aOR 1.09, 95% CI 1.02–1.17). Additionally, the odds of testing for HIV in the past 12 months among heterosexuals who had condomless sex with casual partners was similar to that of heterosexuals who always used condoms (aOR 0.96, 95% CI 0.91–1.02). Overseas-born individuals who arrived >5 years ago had lower odds of testing for HIV in the past 12 months compared with those who recently arrived in Australia (aOR 0.91, 95% CI 0.86–0.96; Table 3).
Median number of months since the last HIV test
The median number of months since the last HIV test decreased significantly from 18.0 months (IQR 6.7–37.3 months) in 2011 to 15.0 months (IQR 6.4–32.5 months) in 2020 (Ptrend < 0.001; Table 4). There was a significant difference in the median number of months since the last HIV test between men (18.0 months, IQR 6.9–38.7 months) and women (15.8 months, IQR 6.9–31.7 months; Ptrend < 0.001). The median number of months since the last HIV test increased significantly with increasing age, from 9.1 months (IQR 3.4–18.1 months) in individuals aged 16–19 years, to 32.3 months (IQR 6.4–125.6 months) in individuals aged ≥60 years (Ptrend < 0.001). Individuals who had a past STI had a significantly shorter median time from the last HIV test compared with those who did not have a past STI (14.0 vs 18.9 months, P = 0.001). Furthermore, heterosexuals with an STI diagnosis on the day had a significantly shorter time since the last HIV test than heterosexuals without an STI (15.0 vs 18.0 months, P < 0.001; Table 4).
| Factor | Mean months since last HIV test (±s.d.) | Median months since last HIV test (IQR) | P-value | |
|---|---|---|---|---|
| All | 29.5 (±39.7) | 16.7 (6.9, 35.3) | ||
| Sex | ||||
| Male | 33.0 (±44.8) | 18.0 (6.9, 38.7) | <0.001 | |
| Female | 25.8 (±32.8) | 15.8 (6.9, 31.7) | ||
| Age (years) | ||||
| 16–19 | 12.9 (±13.0) | 9.1 (3.4, 18.1) | <0.001 | |
| 20–29 | 22.0 (±22.1) | 15.2 (6.8, 29.2) | ||
| 30–39 | 34.7 (±39.5) | 20.9 (7.6, 46.2) | ||
| 40–49 | 59.8 (±75.2) | 25.9 (6.6, 83.4) | ||
| 50–59 | 79.8 (±97.6) | 31.8 (7.4, 128.7) | ||
| ≥60 | 77.8 (±94.2) | 32.3 (6.4, 125.6) | ||
| Region of birth | ||||
| Oceania and Antarctica | 33.5 (±49.1) | 16.1 (5.2, 38.1) | <0.001 | |
| North-west Europe | 27.2 (±32.3) | 17.4 (8.4, 33.8) | ||
| South-east Europe | 30.6 (±37.3) | 18.9 (7.5, 38.1) | ||
| North Africa and Middle East | 24.2 (±30.5) | 14.4 (5.5, 29.9) | ||
| South-east Asia | 26.1 (±34.8) | 15.0 (5.3, 32.2) | ||
| North-east Asia | 23.1 (±30.6) | 13.0 (4.5, 29.6) | ||
| South-central Asia | 27.6 (±33.6) | 17.2 (5.3, 35.6) | ||
| Americas | 26.2 (±29.8) | 16.7 (8.5, 32.2) | ||
| Sub-Saharan Africa | 31.2 (±34.4) | 18.9 (7.7, 40.2) | ||
| Unknown | 34.4 (±49.0) | 17.9 (7.1, 39.2) | ||
| Aboriginal and Torres Strait Islander | ||||
| No | 29.4 (±39.4) | 16.8 (6.9, 68.8) | 0.706 | |
| Yes | 25.9 (±30.2) | 16.1 (6.2, 34.1) | ||
| Unknown | 30.6 (±42.9) | 16.5 (6.7, 36.3) | ||
| Self-reported history of STI | ||||
| No | 31.8 (±40.5) | 18.9 (8.1, 38.2) | <0.001 | |
| Yes | 25.6 (±37.7) | 14.0 (5.4, 29.4) | ||
| Unknown | 27.3 (±40.6) | 14.2 (4.7, 32.1) | ||
| Injecting drug use | ||||
| Never injected | 29.4 (±39.4) | 16.7 (6.9, 35.2) | 0.094 | |
| Ever injected | 38.5(±53.3) | 20.0 (6.0, 43.8) | ||
| Unknown | 27.8 (±38.6) | 17.2 (6.0, 34.3) | ||
| Marital status | ||||
| Married/defecto | 43.8 (±58.8) | 21.8 (6.4, 55.7) | <0.001 | |
| Divorced/separated/widowed | 48.3 (±68.5) | 20.2 (5.6, 60.0) | ||
| Single/never married | 25.0 (±29.1) | 16.0 (6.9, 31.9) | ||
| Unknown | 37.1 (±51.1) | 18.8 (7.6, 41.0) | ||
| Presence of symptoms | ||||
| Asymptomatic | 31.1 (±38.8) | 18.9 (8.6, 37.5) | <0.001 | |
| Symptomatic/contact of infection | 28.7 (±40.5) | 15.7 (6.0, 33.6) | ||
| Unknown | 26.9 (±39.0) | 13.9 (5.4, 31.6) | ||
| STI diagnosis on the consultation day | ||||
| No | 31.5 (±40.8) | 18.4 (8.1, 37.3) | <0.001 | |
| Yes | 25.8 (±33.3) | 15.3 (6.0, 31.1) | ||
| Unknown | 22.4 (±36.5) | 10.5 (3.1, 25.7) | ||
| Condom use with regular partner | ||||
| Always | 31.9 (±41.4) | 18.4 (7.3, 39.7) | <0.001 | |
| Not always | 32.2 (±44.0) | 17.6 (6.7, 38.0) | ||
| No regular partner | 26.7 (±34.6) | 16.0 (2.9, 32.5) | ||
| Unknown | 34.6 (±48.5) | 39.1 (6.2, 40.5) | ||
| Condom use with casual partner in the past 12 months | ||||
| Always | 31.4 (±43.0) | 17.5 (7.0, 36.1) | <0.001 | |
| Not always | 27.8 (±36.0) | 16.4 (7.0, 34.1) | ||
| No casual partner | 37.2 (±49.8) | 20.3 (7.0, 45.7) | ||
| Unknown | 32.3 (±47.4) | 15.9 (6.0, 36.5) | ||
| Year of consultation | ||||
| 2011 | 30.9 (±39.7) | 18.0 (6.9, 37.3) | <0.001 | |
| 2012 | 32.8 (±40.9) | 19.9 (7.7, 40.1) | ||
| 2013 | 30.6 (±38.1) | 18.6 (7.9, 37.5) | ||
| 2014 | 30.0 (±36.9) | 17.9 (7.7, 37.2) | ||
| 2015 | 30.1 (±39.9) | 17.6 (7.1, 35.6) | ||
| 2016 | 29.2 (±41.1) | 15.8 (6.2, 34.2) | ||
| 2017 | 29.4 (±41.3) | 16.0 (6.7, 34.1) | ||
| 2018 | 27.6 (±39.6) | 15.2 (6.0, 31.4) | ||
| 2019 | 27.1 (±37.4) | 15.6 (6.7, 32.4) | ||
| 2020 | 29.0 (±43.0) | 15.0 (6.4, 32.5) | ||
| Year of arrival | ||||
| ≤5 years | 23.2 (±24.2) | 15.8 (7.8, 29.5) | <0.001 | |
| >5 years | 30.0 (±37.1) | 18.3 (7.9, 36.9) | ||
| Unknown | 32.7 (±48.0) | 15.9 (5.4, 37.2) | ||
The Jonchkeere test was used to analyse median months since the last HIV test regarding sex, age, year of consultation and year of arrival. The Kruskal–Walis was used to analyse median months since the last HIV test regarding region of birth, Aboriginal and Torres Strait Islander, self-reported history of STI, injecting drug use, marital status, presence of symptoms, STI diagnosis on the consultation day, condom use with regular partner, and condom use with casual partners in the past 12 months.
s.d., standard deviation; IQR, interquartile range.
Discussion
Our study demonstrated trends and associated factors in HIV testing among heterosexual men and women attending an urban public sexual health clinic in Melbourne over a period of 9 years. We found a declining trend in the proportion of heterosexuals who had ever tested for HIV, and there was no temporal change in the proportion of heterosexuals tested for HIV in the past 12 months between 2011 and 2020. Furthermore, we found that heterosexuals who had condomless sex with casual partners or individuals with an STI diagnosis on the consultation day were less likely to ever test for HIV. With the rise in the proportion of new HIV cases among heterosexuals in Australia, our study findings indicate the need for additional approaches to increase HIV awareness and promote HIV testing in heterosexuals to reduce HIV transmission.
Despite a shift in the proportion of HIV notifications to heterosexuals,6 we found a declining trend in heterosexuals who had ever tested for HIV between 2011 and 2020, and <40% of heterosexuals visiting the clinic for the first time had ever tested for HIV in 2020. Meanwhile, the proportion of MSM who had ever tested for HIV was high in Australia, with >90% in 2021,22 suggesting that we should increase awareness of HIV risk and uptake of HIV testing among heterosexuals. Barriers to HIV testing reported among heterosexuals include a low perceived risk of HIV, stigma and distrust in healthcare services.23–25 A study comparing the experience related to HIV stigma of heterosexuals and gay people living with HIV in Australia found that heterosexual participants felt more stigmatised by living with HIV, when accessing HIV treatment and by people’s reaction to their HIV status, compared with gay men, and consequently, they were less likely to access HIV treatment.26 Community-based participatory approaches, such as crowdsourcing and designathon, could be introduced to create tailored solutions to reduce HIV-related stigma among heterosexuals, and ultimately reduce HIV transmission among this population.
We found that the HIV testing rate in Asian-born heterosexuals was low, although free HIV testing is provided in Australia.27 Our study showed that only 32% of South-east and 28% of North-east Asian-born heterosexuals had ever tested for HIV. As per the Victorian HIV surveillance report, there were 1072 new HIV diagnoses among overseas-born individuals in 2012–2021, and the majority (45%) were from South-east or North-east Asia; however, there was no further breakdown by the mode of transmission or population at risk. Of the 518 heterosexuals newly diagnosed with HIV in Victoria in 2012–2021, the primary HIV exposure was the index case from a high-prevalence country (25%),28 followed by the index case having sex with a person from a high-prevalence country (13%), as per the Victorian Department of Health’s definition.29 There was an increasing trend in late HIV notifications among overseas-born heterosexuals,7 resulting in a more advanced HIV stage among this population.21 Other possible barriers for Asian-born individuals in accessing sexual health services include limited knowledge of HIV prevention strategies and sexual health service accessibility for Medicare-ineligible individuals and HIV stigmatisation in their country of origin.30 We suggest clinicians should recommend HIV testing for individuals who had sex from a high-prevalence country or sexually active individuals who have recently arrived in Australia.
The proportion of heterosexuals who had ever tested for HIV was lower among those who had an STI diagnosis compared with those who did not have an STI diagnosis on the consultation day. This is an important finding, as people with an STI may also share the same risk of acquiring HIV, and untreated STI can increase the risk of HIV acquisition.31 However, our results showed that heterosexuals diagnosed with an STI on the consultation day had a significantly shorter time since the last HIV test than heterosexuals without an STI, suggesting although the proportion of ever tested for HIV was low, this group is more likely to have a recent HIV test before their STI diagnosis. A study of 2307 heterosexuals in the US reported that only half of high-risk heterosexuals (e.g. had sex with a partner with known HIV, exchanged sex for money) tested for HIV in the past 12 months, and 37% tested for HIV annually.32 The lack of integration of HIV testing among those who have an STI diagnosis is a known problem.33 We recommend that HIV and STI care services should be better integrated, so that any heterosexuals who are diagnosed with an STI should have an HIV test. Another concerning finding in our study was individuals who had recent condomless sex with casual partners, which could increase their risk of HIV acquisition, were less likely to have an HIV test. In our study, we did not collect data on the reasons for condom use, but we anticipated that the main reason for condom use in heterosexuals is to prevent pregnancy rather than to prevent HIV/STIs, as suggested elsewhere.34 Health education targeting heterosexuals on condomless sex and HIV transmission should be scaled up.
This study is subject to several limitations. First, this study was conducted in an urban sexual health clinic. Individuals attending a sexual health clinic may be more likely to be sexually active, and have better knowledge and awareness of HIV and sexual health; therefore, our data may not be generalisable to a wider heterosexual population in Australia and other settings. Second, recall bias and social desirability bias may have occurred, as the individuals were asked to self-report their sexual behaviours and the date of the last HIV test. However, we used computer-assisted self-interviewing to collect this sensitive information, which is more reliable than face-to-face interview data collection.35 Third, we did not collect data on the reason for the last HIV test. Some individuals might have tested for HIV, not because of their sexual risk, and this may include the requirement for certain Australian visas or occupations.36,37 Fourth, our study period included 1 year of the coronavirus disease 2019 (COVID-19) pandemic (i.e. 2020), which led to a significant decline in the number of heterosexuals clinic attendance in 2020.38 Past studies have shown that there was a significant reduction in the number of HIV tests in Australia during the COVID-19 pandemic, and this might partly be due to changes in sexual behaviours, such as the reduced number of casual sex partners, during the pandemic.39–41
To conclude, the declining trend in the proportion of heterosexuals who have ever tested for HIV in our study highlights the importance of scaling up HIV testing among heterosexuals to reduce HIV transmission in Australia. Existing campaigns, such as The Drama Downunder (https://www.thedramadownunder.info/) and Ending HIV,27 provide information about HIV testing and clinics offering HIV testing services, with the aim of optimising access to and increasing the uptake of HIV testing in Australia. However, these campaigns mainly target MSM population, which have coincided with a consistently increasing trend in HIV testing among this group.11,13 In contrast, HIV prevention interventions for heterosexuals have been neglected. HIV testing in heterosexuals is not specifically recommended unless they engage in sexual behaviours that increase their risk of acquiring HIV (e.g. new sexual partners, living in or travelling to areas of higher HIV prevalence in Australia or in other countries). Among those who face barriers in accessing healthcare services for HIV testing, including heterosexuals, HIV self-testing is highly feasible, and can provide privacy and convenience to users and, in turn, help in the scaling up of HIV testing.42,43 Since December 2021, HIV self-testing kits have been made available through Australian pharmacies, providing an opportunity to increase HIV testing uptake.44 Furthermore, novel approaches, such as using opt-out HIV testing,45 HIV self-testing vending machines,46,47 online HIV self-testing48 and using behavioural economics to improve engagement,49 could be investigated to scale up the uptake of HIV testing among heterosexuals, and ultimately reduce HIV transmission in Australia.
Data availability
The data that support this study cannot be publicly shared due to ethical or privacy reasons and may be shared upon reasonable request to the corresponding author if appropriate.
Conflicts of interest
JJO is the Editor-In-Chief, and EPFC is a Joint Editor of Sexual Health. To mitigate this potential conflict of interest they were blinded from the review process. All other authors declare that they have no conflicts of interest.
Declaration of funding
EPFC are JJO are supported by an Australian National Health and Medical Research Council (NHMRC) Emerging Leadership Investigator Grant (GNT1172873 for EPFC and GNT1104781 for JJO). CKF is supported by an Australian NHMRC Leadership Investigator Grant (GNT1172900). JT is supported by the Australian Government Research Training Program (RTP) Scholarship.
References
1 Joint United Nations Programme on HIV/AIDS (UNAIDS). Fact sheet: latest global and regional statistics on the status of the AIDS epidemic. 2021. Available at https://www.unaids.org/sites/default/files/media_asset/UNAIDS_FactSheet_en.pdf
2 Lim M, Devine A, Gray RT, Kwon JA, Hutchinson JL, Ong JJ. Lifetime cost of HIV management in Australia: an economic model. Sexual Health 2022; 19(6): 517-524.
| Crossref | Google Scholar |
3 Department of Health and Aged Care. Now more than ever, the fight against HIV must continue. Available at https://www.health.gov.au/ministers/the-hon-greg-hunt-mp/media/now-more-than-ever-the-fight-against-hiv-must-continue [accessd 12 July 2023]
4 Department of Health and Human Services Victoria. Guidelines for the use of antiretroviral agents in adults and adolescents with HIV: panel on antiretroviral guidelines for adults and adolescents. 2023. Available at https://clinicalinfo.hiv.gov/sites/default/files/guidelines/documents/adult-adolescent-arv/guidelines-adult-adolescent-arv.pdf
5 Grulich A, Bavinton B, Stoové M, Wright PE, Treloar C. Agenda 2025 ending HIV transmission in Australia. 2021. Available at https://www.afao.org.au/wp-content/uploads/2021/06/Agenda-25-Technical-Paper.pdf
7 Kirby institute and UNSW. HIV notification rates by year. 2022. Available at https://data.kirby.unsw.edu.au/hiv
8 Leidel S, McConigley R, Boldy D, Girdler S, Wilson S. Should Australia consider opt-out HIV testing? Australas Med J 2015; 8(1): 30-32 PMID:.
| Crossref | Google Scholar | PubMed |
9 Centers for Disease Control and Prevention. HIV testing. 2021. Available at https://www.cdc.gov/hiv/testing/index.html [accessed 20 December 2021].
10 Bond KT, Frye V, Taylor R, et al. Knowing is not enough: a qualitative report on HIV testing among heterosexual African-American men. AIDS Care 2015; 27(2): 182-188 PMID:.
| Crossref | Google Scholar | PubMed |
11 Lin A-C, Fairley CK, Dutt K, et al. Testing for HIV among men who have sex with men needs a paradigm shift in Australia, given the minimal increase between 2003 and 2013 in Melbourne, Australia. Sexual Health 2015; 12(5): 373 PMID:.
| Crossref | Google Scholar | PubMed |
12 MacGibbon J, Lea T, Ellard J, et al. Attitudes to biomedical HIV prevention among Australian gay and bisexual men: key findings from the PrEPARE Project 2019. Centre for Social Research in Health, UNSW Sydney; 2019. Available at http://unsworks.unsw.edu.au/fapi/datastream/unsworks:61623/bin7a4eb73c-e570-4882-8c69-c8a1a5de4d49?view=true&xy=012021
14 Grulich AE, de Visser RO, Badcock PB, et al. Knowledge about and experience of sexually transmissible infections in a representative sample of adults: the Second Australian Study of Health and Relationships. Sex Health 2014; 11(5): 481-494 PMID:.
| Crossref | Google Scholar | PubMed |
15 Australian Government Department of Health. The eight national HIV strategy 2018-2022. 2022. Available at https://www.health.gov.au/sites/default/files/documents/2022/06/eighth-national-hiv-strategy-2018-2022.pdf [accessed 19 May 2023].
18 Melbourne Sexual Health Centre. Annual report 2019 – services and consultations. 2019. Available at https://www.mshc.org.au/images/downloads/AnnualReports/MSHC_AnnualReport_2019.pdf [accessed 30 May 2023].
19 Chow EPF, Fehler G, Chen MY, et al. Testing commercial sex workers for sexually transmitted infections in Victoria, Australia: an evaluation of the impact of reducing the frequency of testing. PLoS ONE 2014; 9(7): e103081 PMID:.
| Crossref | Google Scholar | PubMed |
20 Australian Bureau of Statistics. Standard Australian Classification of Countries (SACC). 2016. Available at https://www.abs.gov.au/statistics/classifications/standard-australian-classification-countries-sacc/latest-release [accessed 22 December 2021].
21 Blackshaw LCD, Chow EPF, Varma R, et al. Characteristics of recently arrived Asian men who have sex with men diagnosed with HIV through sexual health services in Melbourne and Sydney. Aust N Z J Public Health 2019; 43(5): 424-428 PMID:.
| Crossref | Google Scholar | PubMed |
23 Lopez-Quintero C, Shtarkshall R, Neumark YD. Barriers to HIV-testing among Hispanics in the United States: analysis of the National Health Interview Survey, 2000. AIDS Patient Care STDS 2005; 19(10): 672-683 PMID:.
| Crossref | Google Scholar | PubMed |
24 Schwarcz S, Richards TA, Frank H, et al. Identifying barriers to HIV testing: personal and contextual factors associated with late HIV testing. AIDS Care 2011; 23(7): 892-900 PMID:.
| Crossref | Google Scholar | PubMed |
25 Ward EG, Disch WB, Schensul JJ, Levy JA. Understanding low-income, minority older adult self-perceptions of HIV risk. J Assoc Nurses AIDS Care 2011; 22(1): 26-37 PMID:.
| Crossref | Google Scholar | PubMed |
26 Brener L, Wilson H, Slavin S, de Wit J. The impact of living with HIV: differences in experiences of stigma for heterosexual and homosexual people living with HIV in Australia. Sexual Health 2013; 10(4): 316 PMID:.
| Crossref | Google Scholar | PubMed |
27 AIDS Council of NSW (ACON). Ending HIV: how I get tested for HIV for free. 2022. Available at https://endinghiv.org.au/ending-hiv/
28 Khin SO, Hone S, Lin C, Comulada WS, Detels R, Lee S-J. Factors associated with lifetime HIV testing among women in four Southeast Asian countries: evidence from the demographic and health surveys. Int J STD AIDS 2023; 34(7): 439-447 PMID:.
| Crossref | Google Scholar | PubMed |
29 Victorian Department of Health and Human Services. HIV quarterly surveillance report. Melbourne, Australia: State Government of Victoria; 2022. Available at https://www.health.vic.gov.au/infectious-diseases/hiv-quarterly-surveillance-report [accessed 21 April 2022].
30 Phillips TR, Medland N, Chow EPF, et al. Newly arrived Asian-born gay men in Australia: exploring men’s HIV knowledge, attitudes, prevention strategies and facilitators toward safer sexual practices. BMC Infect Dis 2022; 22(1): 209.
| Crossref | Google Scholar |
31 Barker EK, Malekinejad M, Merai R, et al. Risk of HIV acquisition among high-risk heterosexuals with nonviral sexually transmitted infections: a systematic review and meta-analysis. Sex Transm Dis 2022; 49(6): 383-397.
| Crossref | Google Scholar |
32 Gwadz M, Cleland CM, Kutnick A, et al. Factors associated with recent HIV testing among heterosexuals at high risk for HIV infection in New York City. Front Public Health 2016; 4: 76 PMID:.
| Crossref | Google Scholar | PubMed |
33 Saleem K, Ting EL, Loh AJW, et al. Missed opportunities for HIV testing among those who accessed sexually transmitted infection (STI) services, tested for STIs and diagnosed with STIs: a systematic review and meta-analysis. J Int AIDS Soc 2023; 26(4): e26049.
| Crossref | Google Scholar |
34 Anderson JE, Wilson R, Doll L, Jones TS, Barker P. Condom use and HIV risk behaviors among U.S. adults: data from a national survey. Fam Plan Perspect 1999; 31(1): 24-28 PMID:.
| Crossref | Google Scholar | PubMed |
35 Ghanem KG. Audio computer assisted self interview and face to face interview modes in assessing response bias among STD clinic patients. Sex Transm Infect 2005; 81(5): 421-425 PMID:.
| Crossref | Google Scholar | PubMed |
36 Australian Federation of AIDS organisation (AFAO). Applying for permanent residence in Australia Information for people with HIV and their advisors. 2011. Available at https://napwha.org.au/files/factsheet_0311_immigration.pdf [accessed 21 April 2022].
37 WA AIDS Council (WAAC). HIV and employment. 2023. Available at https://www.waac.com.au/learn/living-with-hiv/employment/ [accessed 21 April 2022].
38 Chow EPF, Hocking JS, Ong JJ, Phillips TR, Fairley CK. Sexually transmitted infection diagnoses and access to a sexual health service before and after the national lockdown for COVID-19 in Melbourne, Australia. Open Forum Infect Dis 2021; 8(1): ofaa275.
| Crossref | Google Scholar |
39 Chow EPF, Ong JJ, Donovan B, et al. Comparing HIV post-exposure prophylaxis, testing, and new diagnoses in two Australian cities with different lockdown measures during the COVID-19 pandemic. Int J Environ Res Public Health 2021; 18(20): 10814 PMID:.
| Crossref | Google Scholar | PubMed |
40 Chow EPF, Ong JJ, Denham I, Fairley CK. HIV testing and diagnoses during the COVID-19 pandemic in Melbourne, Australia. J Acquir Immune Defic Syndr 2021; 86(4): e114-e115 PMID:.
| Crossref | Google Scholar | PubMed |
41 Coombe J, Kong FYS, Bittleston H, et al. Love during lockdown: findings from an online survey examining the impact of COVID-19 on the sexual health of people living in Australia. Sex Transm Infect 2021; 97(5): 357-362 PMID:.
| Crossref | Google Scholar | PubMed |
42 Krause J, Subklew-Sehume F, Kenyon C, Colebunders R. Acceptability of HIV self-testing: a systematic literature review. BMC Public Health 2013; 13(1): 735.
| Crossref | Google Scholar |
43 Figueroa C, Johnson C, Verster A, Baggaley R. Attitudes and acceptability on HIV self-testing among key populations: a literature review. AIDS Behav 2015; 19(11): 1949-1965 PMID:.
| Crossref | Google Scholar | PubMed |
44 Attwooll J. HIV self-tests to be sold in pharmacies. 2021. Available at https://www1.racgp.org.au/newsgp/clinical/hiv-self-tests-to-be-sold-in-pharmacies [accessed 19 June 2023].
45 Soh QR, Oh LYJ, Chow EPF, Johnson CC, Jamil MS, Ong JJ. HIV testing uptake according to opt-in, opt-out or risk-based testing approaches: a systematic review and meta-analysis. Curr HIV/AIDS Rep 2022; 19: 375-383.
| Crossref | Google Scholar |
46 Queensland Positive People. Rapid: test for HIV at home. 2023. Available at https://www.rapid.org.au/vend
47 Vera JH, Suneeta S, Alex P, et al. Acceptability and feasibility of using digital vending machines to deliver HIV self-tests to men who have sex with men. Sex Transm Infect 2019; 95(8): 557.
| Crossref | Google Scholar |
48 Bell SFE, Lemoire J, Debattista J, et al. Online HIV self-testing (HIVST) dissemination by an Australian Community Peer HIV Organisation: a scalable way to increase access to testing, particularly for suboptimal testers. Int J Environ Res Public Health 2021; 18(21): 11252 PMID:.
| Crossref | Google Scholar | PubMed |
49 Aung ET, Fairley CK, Chow EPF, et al. Exploring the use of “nudges” to improve HIV and other sexually transmitted infection testing among men who have sex with men. Arch Sexual Behav 2022; 51: 2641-2650.
| Crossref | Google Scholar |