The effects of clipping frequency and nitrogen fertilisation on greenhouse gas emissions and net ecosystem exchange in an Australian temperate grassland
Zahra Padashbarmchi A * , Budiman Minasny A , Milad Bagheri Shirvan A , Luciano A. González A and Feike A. Dijkstra AA
Abstract
Grassland ecosystems store significant amounts of organic carbon (C) and have the potential to function as a source or sink of greenhouse gases (GHGs) under different environmental conditions and management practices. However, the effects of management (clipping frequency and N fertilisation) on the GHGs remain uncertain. In this study, a field-based experiment with automated-lid gas exchange chambers was conducted to simultaneously measure different GHG fluxes (CO2, N2O, CH4), their overall global warming potential (GWP-100) impact, and net ecosystem exchange (NEE) from a grassland. The experiment had two clipping frequencies (simulating moderate and high grazing intensity) and two nitrogen (N) fertiliser treatments (0 and 40 kg N ha−1 year−1). The measurements were conducted during two periods (each approximately 2 weeks long) of varied temperature and moisture in early autumn. High clipping frequency caused higher daily NEE emissions, higher GWP-100 impact and lower photosynthesis; however, it did not significantly affect these parameters. Nitrogen fertilisation effects were lower than the clipping frequency treatment, but the impact on N2O fluxes was likely to be dependent on the time of N application. Methane (CH4) was predominantly controlled by soil moisture, whereas nitrous oxide (N2O) was more strongly affected by temperature. N2O emissions increased significantly after the break-point temperature of 20°C. Our results have highlighted the sensitivity of CH4 uptake and N2O emissions to environmental conditions, particularly their increase under warmer temperatures. The main contributor of GWP-100 impact in this study was CO2 emissions and uptake. For the observation period, the grassland was a small C sink. For a comprehensive understanding, longer-term studies spanning over several years are needed to accurately assess the impact of different management practices on GHG emissions.
Keywords: global warming potential (GWP-100), grassland ecosystem, greenhouse gases (GHGs), soil moisture, soil temperature, clipping frequency, nitrogen fertilisation, net ecosystem exchange (NEE).
Introduction
Grasslands cover a significant portion of Australia’s land area, with 43.6% of land dedicated to grazing native vegetation, and 6.2% to grazing modified pastures (ABARES 2024). Extensive grassland ecosystems are important in regulating emissions of the three key greenhouse gases (GHG), namely, carbon dioxide (CO2), nitrous oxide (N2O), and methane (CH4) (Hoover et al. 2014; Dangal et al. 2020). These ecosystems, which span diverse climatic conditions across Australia, are essential for carbon (C) storage in the soil, and significantly contribute to the global C cycle. However, uncertainty remains regarding the extent to which grasslands can offset GHG emissions from grazing animals, with factors such as temperature, precipitation, grazing pressure (Koncz et al. 2017; Gourlez de la Motte et al. 2018; Wall et al. 2019) and N fertilisation (Wei et al. 2014; Zong et al. 2014; Zhu et al. 2015) playing significant roles.
The ecosystem-scale GHG balance is defined as a combination of CH4, N2O and CO2 net ecosystem exchange (NEE) (Soussana et al. 2007; Chang et al. 2015), calculated on the basis of their global warming potential (IPCC 2022). N2O, in particular, has a large global warming potential, which can significantly counteract the benefits of grassland CO2 uptake (Leahy et al. 2004). Therefore, understanding GHG fluxes from grasslands is crucial for developing effective GHG mitigation strategies.
Many studies have investigated the GHG exchange fluxes between soil and the atmosphere, but assessing long-term mitigation potential requires evaluating changes in soil organic carbon (SOC) stock. This usually requires long-term studies (Harmon et al. 2011; Wood et al. 2012), which are often impractical for quick decision-making. An alternative method, the total C balance or net ecosystem CO2-C exchange, can provide quicker insights by balancing C inputs (from photosynthesis) and outputs (mainly through ecosystem respiration) (Reichstein et al. 2005; Mäkiranta et al. 2010). Ecosystem respiration (Reco) refers to the CO2 released from an ecosystem to the atmosphere, resulting from both autotrophic (plant) and heterotrophic (microbial) activities (Davidson et al. 2006). The primary environmental factors influencing Reco are soil temperature and moisture (Lloyd and Taylor 1994; Gifford 2003). For example, reduced Reco in drier conditions is linked to lower plant and heterotrophic respiration caused by less C assimilation (through photosynthesis) and less microbial activity under low soil moisture conditions (Ciais et al. 2005).
The application of nitrogen (N) fertiliser in Australian grasslands varies depending on factors including soil type, grassland species, and regional climate. However, not all applied N is absorbed by plants; some N is used by soil microorganisms, producing N2O as a by-product, and the rest may leach into groundwater or volatilise into the atmosphere, increasing GHG emissions (Menegat et al. 2022). Therefore, effective soil N management is crucial to mitigate these environmental impacts.
As the balance of GHG emissions from grazed grasslands in Australia is still uncertain, we aimed to highlight whether grassland management including N fertilisation and clipping frequency (which simulates different grazing frequencies), and environmental controls such as soil moisture and temperature, could affect the total GHG balance (expressed as GWP-100) of a temperate grassland in south-eastern Australia. Subsequently, in this paper, we define the term ‘GWP-100’ as the combined relative global warming potential of GHG fluxes (CO2, N2O and CH4) in a 100-year time horizon expressed in CO2 equivalents. We investigated the temporal effects of high and low clipping frequency and N fertiliser on GHG fluxes, and the degree to which they are controlled by soil moisture and temperature. To achieve these objectives, we conducted continuous measurements of GHG fluxes, soil temperature, and moisture during two periods in early autumn 2021 in a grassland experiment (with dominant C4 species) that had no prior history of grazing or fertilisation, but had been regularly mowed before the experiment began in February 2021. The experiment included two N fertilisation treatments (0 and 40 kg N ha−1 year−1) and two clipping frequency treatments: ‘low’ (3 clipping events per year) and ‘high’ (6 clipping events per year) (see Supplementary Table S3).
Materials and methods
Design of experimental plots and treatments
The experiment was conducted over the following two periods: Period 1 from 25 February 2021 to 13 March 2021, and Period 2 from 28 March 2021 to 13 April 2021. This study was conducted during the autumn in the clipping and fertilisation experiment (CAFE) in a grassland at the University of Sydney in Camden, New South Wales (NSW), Australia (34°2′S, 150°39′E). We allowed approximately 2 weeks between the two periods to minimise chamber effects on soil environmental conditions, particularly to prevent soil moisture reduction by chambers (Yao et al. 2009). The site is 91 m above sea level, with an annual mean maximum and minimum temperatures of 23.8°C and 10.3°C and a mean yearly rainfall of 788.4 mm (Bureau of Meteorology 2024). The most dominant grassland species were the C4 grasses Paspalum dilatatum Poir and Sporobolus africanus (Poir.). Other species included the C4 grasses Chloris gayana Kunth, Cynodon dactylon (L.) Pers., Paspalum distichum L., Setaria gracilis Kunth and the C3 grasses Briza subaristata Lam., Bromus catharticus Vahl, Bromus hordeaceus L., Cotula australis (Sieber ex Spreng.) Hook.f., Microlaena stipoides, Salvia verbenaca L., and Sonchus oleraceus L. The relative ratio of C4 to C3 species was approximately 0.7–0.3 by number of species. The soil type was a Red Chromosol, according to the Australian soil classification system (Isbell 2002), which is equivalent to a Luvisol (World Reference Base 2022).
The experimental design was a full factorial of N fertilisation and clipping frequency treatments with four replicates of 16 plots in four blocks, with treatments randomly assigned to plots within each block. Two N fertiliser treatments were investigated, which were either no N application (control), or fertiliser N (40 kg N ha−1 year−1 as urea) applied ‘pre-summer’ in September (2018–2020, Table S3), (approximately 5 months prior to the start of the first measuring period).
The high-frequency clipping treatments were managed for 3 years before the experiment (2018–2021), with a clipping frequency approximately twice that of the low-frequency clipping treatments, (‘High’ was clipped every 2 months, ‘Low’ every 4 months). In the low-frequency clipping treatments, grasses were clipped once they reached optimal growth, maximising plant health and productivity, without becoming overmature or starting to senesce. The aboveground biomass was clipped to 10 mm above the soil surface 1 day before conducting the experiment inside the bases of the high-frequency clipping, whereas the low-frequency clipping treatment was clipped 2 weeks earlier (Table S3). The clipped total shoot dry mass for each chamber was weighed after oven-drying at 60°C for 48 h (Table S2).
GHG measurements
Eight dynamic automated chambers, made of clear acrylic with aluminium frames (dimensions of 39.5 cm width × 54.5 cm length × 60 cm height, and a volume of 129 L) were used for both sampling periods (two replicates for each treatment combination during the first period, and a further two replicates during the second period). The chambers were attached onto the polypropylene bases with four strong clips. The chamber bases were placed in the ground, with the bottom edge buried approximately 5 cm below the soil surface to ensure a secure seal for accurate measurements. Each automated chamber was equipped with an actuator for opening and closing, which was powered by batteries and solar panels. The concentration of GHGs was quantified by a Picarro gas analyser (G2508 CRDS Analyser, Picarro Inc., Santa Clara, CA, USA). A 16-port distribution manifold (A0311, Picarro Inc.), integrated with the Picarro gas analyser and software, was connected to automated chambers for continuous monitoring of GHG emissions. The analyser was fitted with an external pump, with chambers connected to the manifold through 10 m 1/8′ polytetrafluoroethylene (PTFE) tubing (Cole-Parmer, Kinesis, Australia) (Supplementary Fig. S1). A total of 90 min for each measurement cycle (from first to last chamber and then the gas cylinder) was configured such that each chamber was closed for 10 min during the measurement period and remained open for the remaining 80 min. This closure time for gas measurement was sufficiently short to avoid chamber headspace saturation effects (Pihlatie et al. 2013; Christiansen et al. 2015). In addition, the analyser measured the gas concentration after each cycle from an atmospheric gas cylinder (air-instrument grade, BOC Ltd, North Ryde, NSW, Australia) for 10 min to check the drift in measurements. To switch between the chambers, a chamber controller was connected to the analyser and manifold, which was programmed with Python (ver. 2.7) language to receive a data-stream from both the analyser and manifold.
Measurements were conducted for 34 days, split into two separate periods. After the first period, chambers were moved to different plots, with a ‘2-week period’ between measurements. We conducted calibration testing between each sampling period using low- and high-standard gases containing CO2, CH4 and N2O (BOC Ltd, North Ryde, NSW, Australia).
Soil moisture (measured volumetrically) and temperature were continuously recorded (every 5 min) on a datalogger using soil sensors inserted in the soil inside each chamber (TEROS11, datalogger: ZL6, METER Group, Inc., USA).
Data from each chamber of the first hundreds of the Picarro analyser were removed to ensure no gas from previous chambers remained within the sampling tubes. NEE, N2O and CH4 fluxes for each sequence of gas samples from different chambers were calculated using the following equation (de Klein et al. 2003; Imer et al. 2013):
where the Flux unit is mg m−2 h−1, dC/dt is the slope of linear regressions between gas concentration and time (mol mol−1 h−1), V is the volume of the chamber (m3), A is the base area of the chamber (m2), P is the atmospheric pressure (Pa), M is the molar weight of CO2, N2O or CH4 (g mol−1), R is the gas constant (8.3145 m3 Pa mol−1 K−1), and T is the air temperature (K). Soil temperature and volumetric soil moisture data were matched with the GHG data during the closure time of each chamber.
Estimation of ecosystem respiration, photosynthesis, GWP-100
For a better understanding of ecosystem C dynamics, it is important to partition NEE into its component fluxes, i.e. ecosystem respiration (Reco) and photosynthesis (P), by using the equation NEE = Reco − P (Reichstein et al. 2005; Heskel et al. 2013). Because transparent chambers were used, the CO2 concentration during the day was a measure of NEE, including both photosynthesis (C fixation) and ecosystem respiration. The CO2 concentration at night was used to represent the total ecosystem respiration. We first related nighttime respiration (Reco,night) with soil temperature and moisture via linear regression (Barford et al. 2001; Reichstein et al. 2005; Comeau et al. 2018). Then using daytime measurements of soil temperature and moisture, we estimated daytime ecosystem respiration (Reco,day). We then subtracted the estimated daytime ecosystem respiration from NEE to calculate photosynthesis rates. In this study, negative flux values are fluxes from the atmosphere to the ecosystem (uptake), meaning that the grassland ecosystem acts as a sink of attributed gases.
To quantify the total GHG impact of the ecosystem, we calculated GWP-100, which we defined as the combined relative global warming potential of GHG fluxes (CO2, N2O and CH4) in a 100-year time horizon, expressed in CO2 equivalents. This was calculated on the basis of the data from the Fifth Assessment Report of the Intergovernmental Panel on Climate Change (IPCC), where CH4 was considered 27 times and N2O was considered 273 times more potent than CO2 in warming the atmosphere (IPCC 2022).
Statistical analysis
All statistical analyses were conducted in R (ver. 4.0.5; R Development Core Team 2021). The entire data set was first tested for the ANOVA assumptions by conducting the residual analysis, Shapiro–Wilk’s test of normality distribution and Levene’s test for homogeneity of variances (Shapiro and Wilk 1965). Outliers detected after performing outlier analysis in R were removed. In addition, all the abnormal values for dynamic diurnal changes in the expected CO2 cycle (such as all the night-time negative CO2 values) were removed. We modelled variables with repeated measures (daily NEE, CH4 and N2O fluxes, photosynthesis, Reco,night, Reco,day, GWP-100) as response variables with a mixed-effect model, by using lme4 package (ver. 1.1-28) (Bates et al. 2015) in relation to both fixed effects (N treatment, clipping frequency treatment and sampling period) and sampling plot (nested within block) as random effects. Several models were developed with different possible interactions. We selected the most appropriate model that best estimated the parameters and had the lowest Akaike’s information criterion (AIC) value.
Tukey’s HSD was used for pairwise comparison of the effects of N fertiliser, clipping frequency and periods. We implemented the ordinary least-squares (OLS) regression method to explore the relationships between GHG efflux rates and soil temperature and moisture. The relationship between N2O and soil temperature, as well as the variation in Reco,night fluxes with soil moisture, displayed two distinct directional trends. To analyse these relationships, we employed the ‘segmented’ package (Muggeo 2003, 2021) in R software, to fit piecewise models and estimate the threshold (break-point) values for soil temperature and moisture.
Results
Soil temperature and moisture
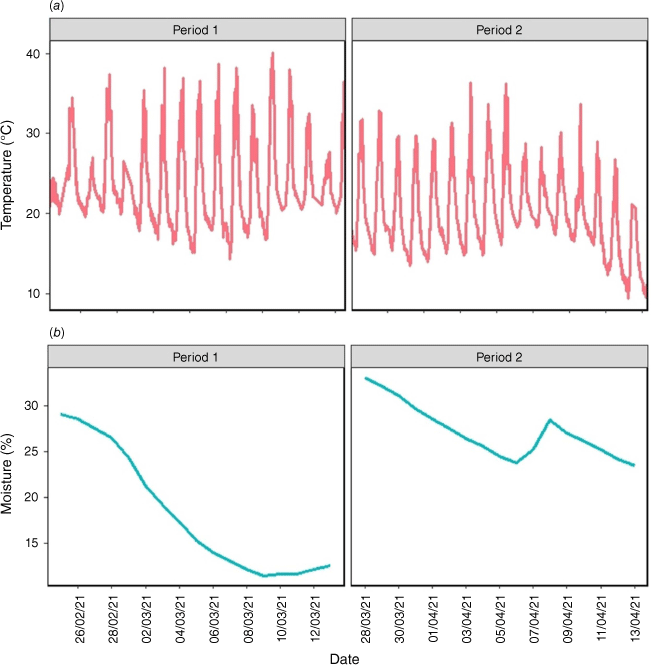
Soil temperature and moisture were significantly higher and dryer (P < 0.05) in Period 1 (average temperature and moisture of 23.7°C and 18.2% respectively) than in Period 2 (with average temperature and moisture of 19.9°C and 27.8% respectively) (Fig. 1a, b, Table S1). Soil temperature displayed diurnal variation, ranging from 10.0°C to 35.4°C, and soil moisture varied between 8.6% and 35.0% within the experimental period. The increase in soil moisture on 8 April during Period 2 (Fig. 1b) occurred because of a 6 mm rainfall event (Fig. S2). There were no significant differences in soil temperature and moisture among N and clipping frequency treatments (P > 0.05).
Respiration, photosynthesis, and NEE
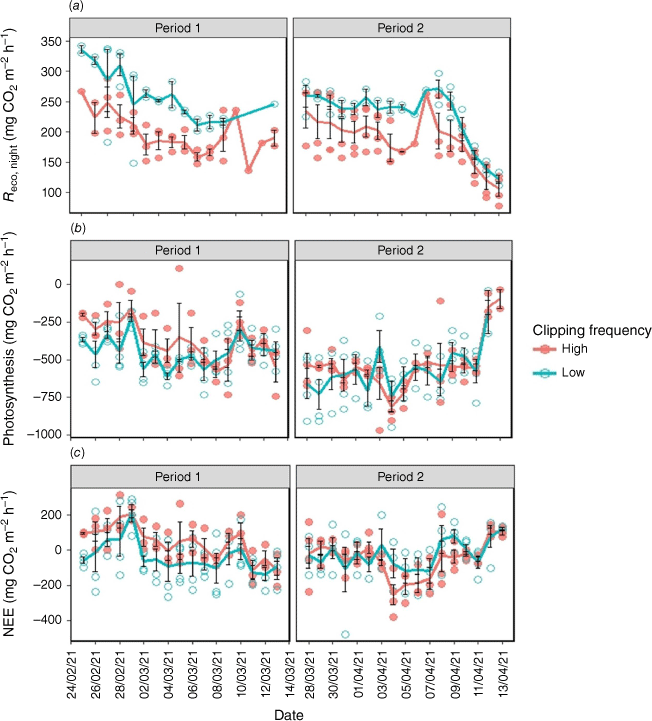
Reco,night was significantly higher under low clipping frequency than high frequency (P < 0.05 Table S1, Fig. 2a). Photosynthesis and NEE were not statistically affected by clipping frequency (P > 0.05, Table S1), although there was a trend of lower photosynthesis (less negative C flux) and larger NEE with high clipping frequency during Period 1 (Fig. 2b, c), likely owing to reduced aboveground biomass. In the high clipping frequency treatment, the vegetation was maintained at a more uniform and potentially less mature growth stage because of the frequent harvesting. In contrast, the low clipping treatment allowed for more extended growth periods between clippings, leading to potentially more mature and robust vegetation at the outset of the experiment. We also observed a significantly (P < 0.001) lower rate of photosynthesis in Period 1 than in Period 2 (Table S1, Fig. 2b). In contrast, Reco,night and NEE were not significantly affected by the period (Table S1, Fig. 2a, c).
(a) Temporal variation of respiration during the night (Reco,night), (b) photosynthesis, and (c) net ecosystem exchange (NEE) with low and high clipping frequency during the course of measurements. The circles represent the daily average fluxes of each chamber and solid lines denote the daily average fluxes of all chambers for the high (red) and low (green) clipping frequency. Error bars represent standard errors.
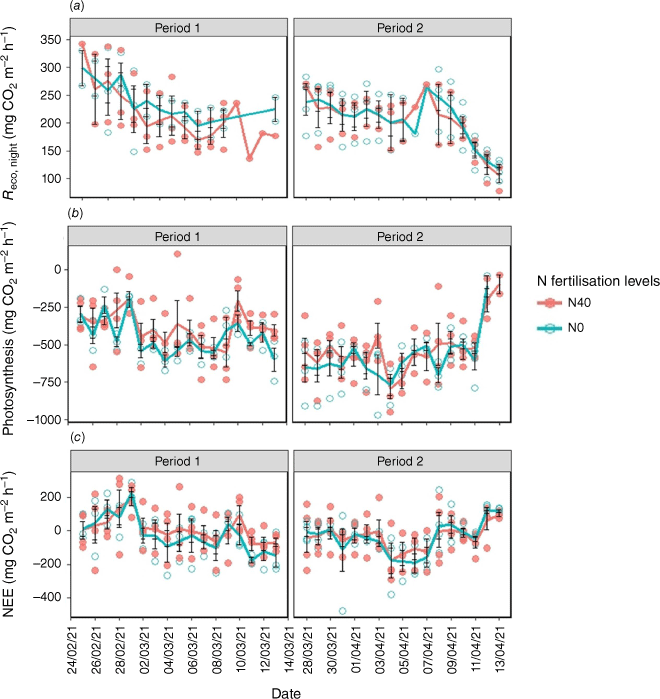
No significant (P > 0.05) effect of N fertilisation was found on the Reco,night, photosynthesis and NEE (Table S1, Fig. 3a–c). Reco,day was higher with increased clipping frequency, although it was not significantly (P > 0.05) affected by N application (Table S1), and plant shoot biomass was higher with the low clipping frequency (mean = 252 g m−2) compared to the high clipping frequency (mean = 116.25 g m−2) (Table S2).
(a) Temporal variation of respiration during the night (Reco,night), (b) photosynthesis, and (c) net ecosystem exchange (NEE) with N fertilisation during the course of measurements. The circles represent the daily average fluxes of each chamber and solid lines denote the daily average fluxes of all chambers for the 0 (green) and 40 (red) kg ha−1 N fertilisation levels. N0 and N40 represent N fertiliser application rates in kg ha−1. Error bars represent standard errors.
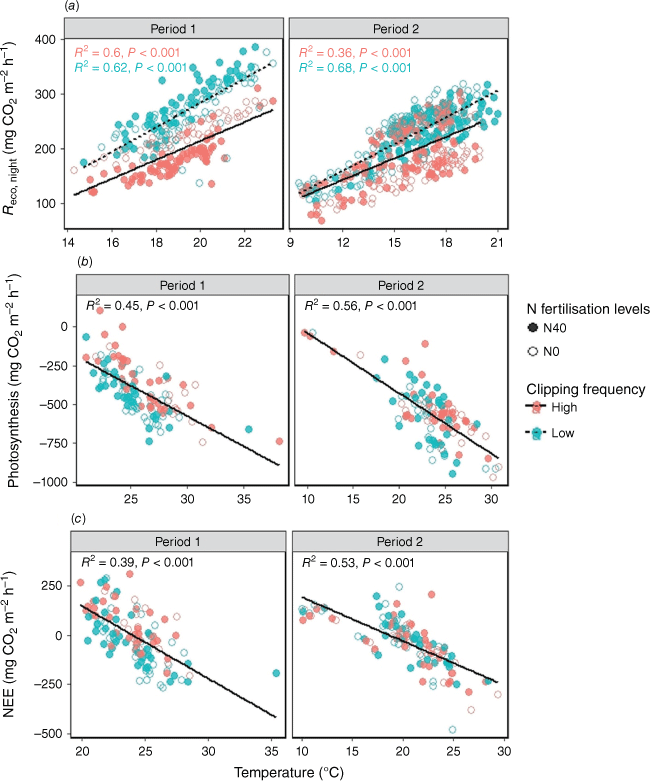
Reco,night was significantly (P < 0.001) related to soil temperature for both experimental periods (Fig. 4a). Moreover, the relationships with temperature differed between the two clipping frequencies in Period 1, where a higher Reco,night or greater C loss was observed with the low clipping frequency (Fig. 4a). Increasing soil temperature significantly increased Reco,night (P < 0.001) and photosynthesis (P < 0.001). However, net ecosystem exchange (NEE) transitioned from positive to negative with higher soil temperatures (P < 0.001) (Fig. 4).
(a) Relationship of respiration during the night (Reco,night), (b) photosynthesis, and (c) net ecosystem exchange (NEE) with soil temperature. The open and closed circles represent 0 and 40 kg ha−1 N fertilisation levels respectively. N0 and N40 represent N fertiliser application rates in kg ha−1. Green and red circles denote low and high clipping frequency groups respectively.
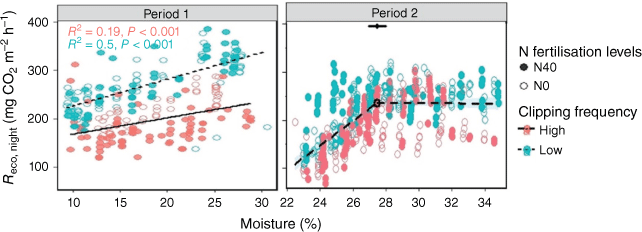
Reco,night also significantly (P < 0.001) increased with an increasing soil moisture, especially in Period 1 (Fig. 5). This relationship was considerably higher with low than with high clipping frequency. According to the stepwise linear regression in Period 2, Reco,night was optimal at 27% soil moisture, with soil moisture not significantly affecting the Reco,night above this threshold. Conversely, photosynthesis and NEE did not change significantly with soil moisture (Fig. S3).
Relationship of respiration during the night (Reco,night) with soil moisture. In Period 2, this relationship fits piecewise regression models (Reco,night = 25.49 Moisture − 0463.85 and Reco,night = −0.17 Moisture + 240.62, R2 = 0.41, adjusted R2 = 0.41, P < 0.001). The open and closed circles represent 0 and 40 kg ha−1 N fertilisation levels respectively. N0 and N40 represent N fertiliser application rates in kg ha−1. Green and red circles denote low and high clipping frequency groups respectively.
N2O flux
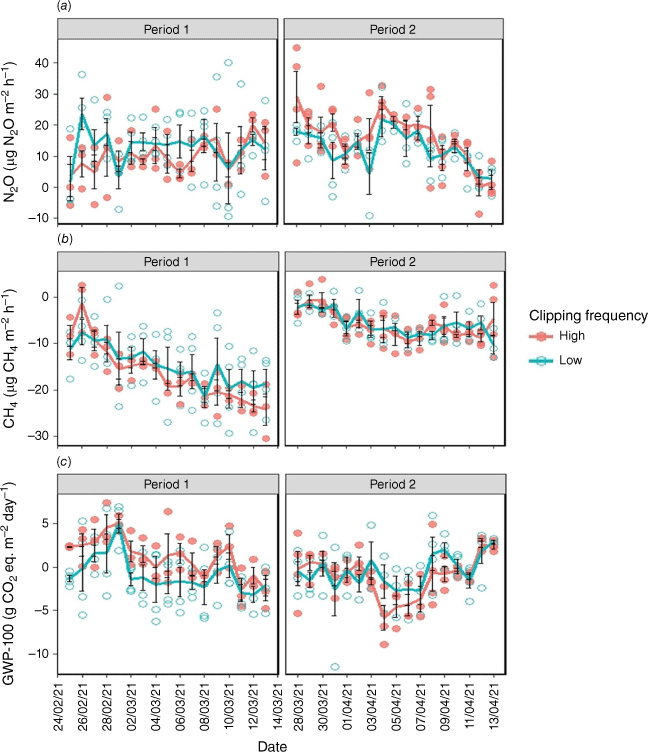
Neither clipping frequency nor N fertilisation significantly (P > 0.05) affected the N2O flux (Table S1, Fig. 6a, Fig. S4a), but their interaction on N2O flux was significant (P = 0.01). Unexpectedly, N fertilisation resulted in lower N2O fluxes in Period 1, but it had no effect in Period 2 (Table S1, Fig. S4a); possibly the fertiliser had been absorbed by plants, and increased photosynthesis, whereas without added fertiliser more C may have been available for denitrifiers, stimulating N2O emissions.
(a) Temporal variation of the nitrous oxide flux (N2O), (b) methane flux (CH4), and (c) global warming potential in a 100-year time horizon (GWP-100) with low and high clipping frequency during the course of measurements. The circles represent the daily average fluxes of each chamber and solid lines denote the daily average fluxes of all chambers for the high (red) and low (green) clipping frequency. Error bars represent standard errors.
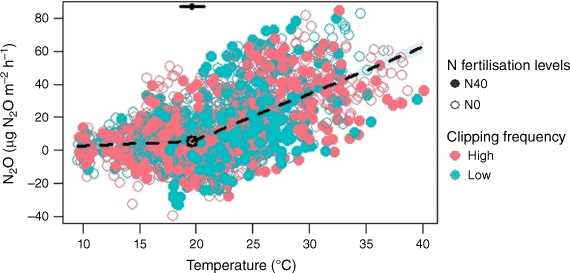
The N2O flux was significantly (P < 0.05) influenced by soil temperature (Fig. 7), being relatively stable up to a break-point temperature at 20°C, after which it increased significantly with increasing soil temperature. Clipping frequency and N fertilisation did not influence this relationship. The relationship between N2O emission and soil moisture level was insignificant (P > 0.05; Table S1, Fig. S5a).
Relationship between N2O fluxes and soil temperature. This relationship fits piecewise regression models (N2O = 0.29 Temperature − 0.13 and N2O = 2.8 Temperature − 49.37, R2 = 0.35, adjusted R2 = 0.34, P < 0.05). The open and closed circles represent 0 and 40 kg ha−1 N fertilisation levels respectively. N0 and N40 represent N fertiliser application rates in kg ha−1. Green and red circles denote low and high clipping frequency groups respectively. The black dot denotes the break-point temperature, with error bars representing standard errors.
CH4 flux
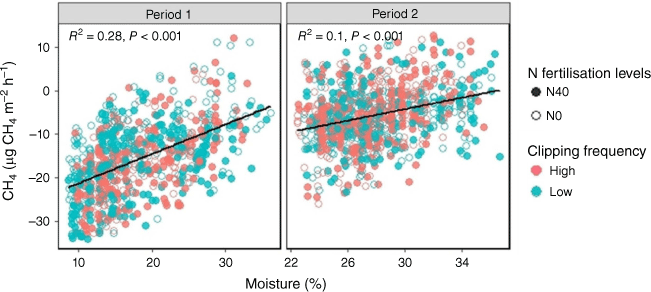
CH4 fluxes were mostly negative (i.e. CH4 uptake) and not significantly affected by clipping frequency (P > 0.05; Table S1, Fig. 6b) or N treatments (P > 0.05; Table S1, Fig. S4b). However, the soil CH4 flux was significantly (P < 0.0001) different between the two periods (Table S1), with CH4 uptake much lower in the second period. Soil CH4 was mostly controlled by soil moisture during both periods (Fig. 8). There was a significant (P < 0.001) positive relationship between CH4 flux and soil moisture, particularly during Period 1, suggesting greater CH4 uptake in drier soil (Fig. 8). Soil temperature did not affect the CH4 flux (Fig. S6).
Relationship between CH4 fluxes and soil moisture during the two periods. The open and closed circles represent 0 and 40 kg ha−1 N fertilisation levels respectively. N0 and N40 represent N fertiliser application rates in kg ha−1. Green and red circles denote low and high clipping frequency groups respectively.
Global warming potential (GWP-100)
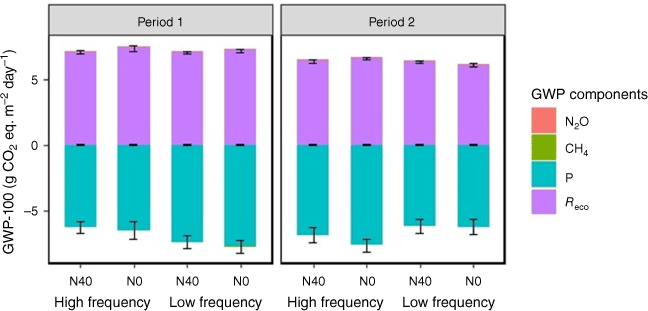
To obtain the overall contribution from CO2, N2O and CH4 to global warming, we converted all fluxes to ‘GWP-100’ by using the GWP-100 metrics. The GWP-100 was dominated by contributions from CO2 as Reco and photosynthesis (Fig. 9). N2O and CH4 flux were insignificant and the GWP-100 was mainly affected by CO2 fluxes from both soil and plant respiration.
Contribution of ecosystem respiration (Reco), photosynthesis (P), nitrous oxide (N2O) and methane (CH4) fluxes to global warming potential in a 100-year time horizon (GWP-100) in different treatment groups during two periods of the experiment. N0 and N40 represent N fertiliser application rates in kg ha−1. Error bars represent standard errors.
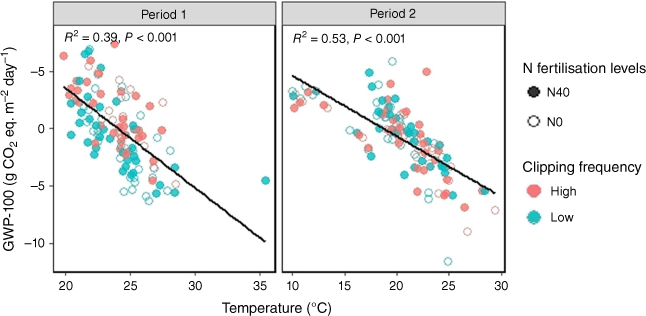
Although clipping frequency had no significant (P > 0.05) effect (Table S1), a slight trend was visible in Period 1, where higher GWP-100 emissions were observed with high than low clipping frequency on some days (Fig. 6c). Across the two periods, the GWP-100 was highest with high clipping frequency and N fertilisation in Period 1 (1.30 ± 0.48 g CO2 eq. m−2 day−1, Table S1), indicating a net emissions source on the basis of the GWP-100 metric. The GWP-100 decreased significantly (P < 0.001) with increased temperature during both periods (Fig. 10). In contrast, the relationship between GWP-100 and soil moisture was not significant (Fig. S5b).
Relationship between global warming potential in a 100-year time horizon (GWP-100) and soil temperature. The open and closed circles represent 0 and 40 kg ha−1 N fertilisation levels respectively. N0 and N40 represent N fertiliser application rates in kg ha−1. Green and red circles denote low and high clipping frequency groups respectively.
Discussion
Effect of clipping frequency and N fertilisation treatment
High clipping frequency reduced Reco,night, especially during the early stage of the experiment (Table S1). This reduction is likely to be due to decreased plant respiration caused by a lower leaf biomass in the high-frequency clipping treatment. Because plant respiration accounts for a significant portion of Reco, high clipping frequency is likely to lead to lower overall respiration (Janssens et al. 2001). In addition, frequent clipping reduces belowground biomass and the abundance of soil decomposing microorganisms (Cao et al. 2004), leading to slower soil organic carbon decomposition (Bicharanloo et al. 2022). The increased energy investment in shoot regeneration after clipping (Novick et al. 2004) also reduces belowground plant C allocation, leading to a lower root biomass (Bicharanloo et al. 2022), possibly further decreasing Reco,night. Conversely, lower clipping frequency allows for greater C allocation to roots and increased root respiration, which leads to increased Reco,day under higher clipping frequency (Table S1), and this could be attributed to increased microbial respiration, particularly when soil temperatures are higher during the day. Although other studies have linked higher soil respiration to increased grazing frequency (Dong et al. 2000; Frank et al. 2002; Patton et al. 2007), we did not observe differences in soil temperature between clipping frequencies; so, the exact mechanisms remain unclear (Cao et al. 2004; Wang et al. 2020; Wachiye et al. 2022).
Photosynthesis and NEE were generally unaffected by clipping frequency (Table S1). However, during the first period, high clipping frequency resulted in lower photosynthesis and higher NEE than low frequency (Fig. 2), likely due to reduced aboveground biomass. This is consistent with other research indicating that increased grazing and loss of standing biomass as a result of harvesting can reduce CO2 uptake in grasslands (Leahy et al. 2004).
Clipping frequency had no effect on N2O and CH4 fluxes (Table S1), with no significant differences observed in soil moisture between clipping frequencies to affect N2O and CH4 fluxes. The activity of methanotrophs and denitrifiers may not have been significantly different between clipping frequencies. However, a large C and N losses occurs from the grassland system under grazing (through the removal of the aboveground biomass); however, this is often not considered in quantifying grassland emissions (Soussana et al. 2007).
N fertiliser addition did not significantly affect Reco,night, photosynthesis or NEE rates (Table S1). Moreover, the elevated photosynthesis rate in Period 2 would offset the increase in Reco,day, resulting in unchanged NEE rates in either period. N2O emissions were higher without N fertilisation (Table S1), possibly because plants had absorbed most of the fertiliser before measurements began. N2O emissions typically peak shortly after fertilisation (McClain et al. 2003; Groffman et al. 2009; Wagner-Riddle et al. 2020), and higher photosynthesis (particularly during Period 1) without fertiliser might have increased root exudation (Wang et al. 2021), providing C for denitrifiers and thus stimulating N2O emissions. This suggests that N2O emissions were influenced by both soil N availability and the C supply for denitrification.
Temporal controls of GHG fluxes
No significant differences were recorded in soil temperature and moisture among N and clipping frequency treatments (Table S1). Soil temperature was a key environmental factor controlling Reco,night, photosynthesis and NEE (Fig. 4). The sensitivity of Reco,night to soil temperature varied with clipping frequency, being greater at low frequency, possibly owing to increased belowground C for bacterial decomposition and elevated root biomass (and therefore more root respiration) (Cao et al. 2004).
Previous studies have recorded a positive correlation between ecosystem respiration (Reco) and temperature (Reichstein et al. 2005; Hu et al. 2016; Liang and Wang 2020), because soil temperature affects both plant respiration and SOC decomposition. When soil moisture is sufficient, soil temperature largely determines soil respiration (Carbone et al. 2011), with higher temperatures enhancing both SOC decomposition (heterotrophic respiration) (Kirschbaum 2006) and plant growth (Smith et al. 2009), leading to increased respiration rates.
During the growing season in temperate grasslands, photosynthesis is the most significant or predominant process affecting GWP-100 impact, specifically because of its role in C fixation (Leahy et al. 2004). Our results demonstrated that both Reco,night and photosynthesis increased with temperature (Fig. 4), but the temperature effect on photosynthesis was stronger. As a result, higher temperatures reduced the NEE rate, leading to increased C fixation.
The measured N2O fluxes varied from −40 to 85 μg m−2 h−1 (Fig. 7), indicating that the soil occasionally functioned as a sink for N2O (negative fluxes). This N2O uptake can happen through N2O reduction to N2 or its absorption in soil water, influenced by three underlying pathways of denitrification, aerobic denitrification and nitrifier denitrification (Chapuis‐Lardy et al. 2007). Lower ammonium-N source (NH4) than the nitrate-N source (NO3−) can also reduce N2O emissions (Allard et al. 2007). However, we are unclear about the exact mechanisms behind N2O uptake at our site and further studies are needed.
We observed a stronger positive relationship between N2O production and soil temperature above 20°C (Fig. 7), suggesting that higher temperatures enhance soil microbial activity, potentially favouring denitrification and N2O emission. Below 20°C, other factors such as soil moisture might control N2O emissions (Horváth et al. 2010). N2O production correlates positively with temperature when there are no limitations from water-filled pore spaces or mineral N (Clayton et al. 1997).
In contrast, CH4 fluxes were primarily influenced by soil moisture rather than soil temperature. Increasing soil temperature may have reduced soil moisture, reducing CH4 diffusion and making methanotrophs less sensitive to temperature changes (Chen et al. 2011). Overall, the combined GHGs, when assessed for global warming potential over 100 years (GWP-100) impact, showed a significant negative relationship with soil temperature (Fig. 10). This is likely because during the growing season, photosynthesis outweighs decomposition.
Reco,night increased with soil moisture until a threshold soil moisture level of about 27%, after which Reco,night stabilised (Fig. 5). Intermediate soil moisture levels promote higher CO2 emissions (Schaufler et al. 2010), whereas CO2 emissions can decrease in wetter soils as a result of reduced diffusion of CO2 from the soil to the atmosphere (Hu et al. 2016). There was a stronger linear relationship between soil moisture and Reco,night with low rather than high clipping frequency, particularly during Period 1 (Fig. 5). This is because the greater plant biomass in low-frequency clipping (Table S2) can increase both soil SOC decomposition and plant respiration, both of which are sensitive to moisture and can lead to higher Reco,night at certain soil moisture levels.
Soil moisture levels did not significantly affect photosynthesis and NEE, as soil moisture was generally above 10% and did not reach levels that might affect stomatal conductance (Farquhar and Sharkey 1982; Field et al. 1992). Since photosynthesis was the main driver of NEE, soil moisture had no impact on NEE. Similarly, N2O fluxes were unaffected by soil moisture (ranging from 8.6% to 35%, roughly between 18% and 75% of soil water-holding capacity), which was possibly too low to affect N2O emissions or soil pore saturation. Liu et al. (2022) showed that significant N2O emissions typically occur only when soil moisture level exceeds 80% of the water-holding capacity, creating hypoxic conditions. N2O flux is influenced by both nitrification and denitrification processes, making it challenging to link directly with soil moisture (Curtis et al. 2006).
In contrast, CH4 fluxes were significantly affected by soil moisture. Soil moisture influences the balance between CH4 production and consumption by affecting methanotrophic and methanogenic activity (Le Mer and Roger 2001) through inducing physiological stress on these CH4-controlling bacteria (Konda et al. 2010) or changing CH4 diffusivity in the soil (Luo et al. 2013). Reduced soil moisture can enhance methanotroph populations and activity under aerobic conditions (Konda et al. 2010); however, if soil moisture becomes too low to support the normal functioning of soil microorganisms, it can lead to a decrease in methanotroph populations and activity (Chen et al. 2011; Dijkstra et al. 2011). Our study found that soil moisture was not low enough to directly affect methanotroph activity. Similar findings from other research have indicated higher CH4 oxidation rates under drier conditions (Chen et al. 2011; Liu et al. 2021).
The GHG balance
Net ecosystem GHG balance (total ecosystem flux) reflects the balance between GHG production and consumption in an ecosystem (Liu and Greaver 2009). During the observation periods, the grass consistently acted as a CO2e sink, with an average GWP-100 impact value of −0.07 g CO2 eq. m−2 day−1, aligning with findings that temperate grasslands are typically C neutral or weak C sinks (Jones and Donnelly 2004; Janssens et al. 2005). However, GWP-100 fluxes varied from 11 to −15 g CO2 eq. m−2 day−1, indicating that the grassland can switch between being a GHG source or sink, depending on different times and conditions.
Although N2O and CH4 emissions are important for determining the net GHG balance (Liu and Greaver 2009), and can potentially shift a grassland from a sink to a source of GHGs, our study found that photosynthesis and Reco were the primary contributors to the net GHG balance (49%). In contrast, CH4 and N2O emissions contributed little to the GWP-100 impact (<1%) (Fig. 9).
N fertilisation had a minimal impact on the GWP-100 impact, possibly owing to the fact that emissions are likely to be higher soon after application, and less evident at the time of measurement (several months after application), resulting in a low contribution of N2O to the GWP-100 impact. Although the clipping and N fertilisation exhibited marginal effects on the GWP-100 impact, soil moisture and temperature were the main factors influencing GHG contributions to the GWP-100 outcome. There was a significant negative relationship between GWP-100 and temperature, with GWP-100 shifting from positive to negative as temperature increased, primarily owing to the relationship between NEE and temperature.
Our study has highlighted the need for long-term and more extensive research, to determine effective simulated grazing management practices. Such studies require careful timing and management to provide meaningful insights, and interventions must be aligned with grazing seasons to effectively reduce GHGs and enhance C sequestration.
Conclusions
Our study has demonstrated how environmental factors and grassland management practices influence GHG fluxes, showing that grasslands can act as a net GHG sink with an average GWP-100 impact value of −0.07 g CO2 eq. m−2 day−1. CO2 efflux (Reco) was the main driver of GWP-100, whereas CH4 and N2O had minor impacts. GHG fluxes were highly variable over time, with soil moisture primarily affecting Reco,night and CH4 flux, and soil temperature affecting NEE, along with its main components (Reco,night and photosynthesis), N2O flux, and GWP-100. Higher temperatures significantly increased N2O flux but decreased NEE.
This research aimed to identify a method for quantifying GHG emission differences between grazing management treatments. Although our short-term study did not show significant effects of clipping frequency on GHG emissions, it is crucial to consider their potential long-term impacts on grassland C sequestration. Effective GHG reduction strategies can vary across different farming systems, underscoring the need for more extensive research. Year-round measurements of GHG fluxes are recommended to better understand how management practices affect the net GHG balance in grasslands and to develop strategies for long-term sustainability and climate resilience in agriculture.
Declaration of funding
This research is part of the postgraduate thesis (Soil Greenhouse Gas Balance of Australian Livestock Production) by the first author, funded by the philanthropic anonymous donations. We also thank the Postgraduate Research Scholarship and the Thomas Lawrance Pawlett Postgraduate Research Scholarship from Sydney Institute of Agriculture for financial support.
Acknowledgements
This research was funded by philanthropic anonymous donations. We also thank the Postgraduate Research Scholarship and the Thomas Lawrance Pawlett Postgraduate Research Scholarship from Sydney Institute of Agriculture for financial support.
References
Allard V, Soussana J-F, Falcimagne R, Berbigier P, Bonnefond J-M, Ceschia E, D’hour P, Hénault C, Laville P, Martin C (2007) The role of grazing management for the net biome productivity and greenhouse gas budget (CO2, N2O and CH4) of semi-natural grassland. Agriculture, Ecosystems & Environment 121(1–2), 47-58.
| Crossref | Google Scholar |
Barford CC, Wofsy SC, Goulden ML, Munger JW, Pyle EH, Urbanski SP, Hutyra L, Saleska SR, Fitzjarrald D, Moore K (2001) Factors controlling long-and short-term sequestration of atmospheric CO2 in a mid-latitude forest. Science 294(5547), 1688-1691.
| Crossref | Google Scholar | PubMed |
Bates D, Mächler M, Bolker B, Walker S (2015) Fitting Linear Mixed-Effects Models using lme4. Journal of Statistical Software 67(1), 1-48.
| Crossref | Google Scholar |
Bicharanloo B, Bagheri Shirvan M, Cavagnaro TR, Keitel C, Dijkstra FA (2022) Nitrogen addition and defoliation alter belowground carbon allocation with consequences for plant nitrogen uptake and soil organic carbon decomposition. Science of The Total Environment 846, 157430.
| Crossref | Google Scholar | PubMed |
Bureau of Meteorology (2024) Climate statistics for Australian locations. Available at http://www.bom.gov.au/climate/averages/tables/cw_068192.shtml [verified 12 December 2024]
Cao G, Tang Y, Mo W, Wang Y, Li Y, Zhao X (2004) Grazing intensity alters soil respiration in an alpine meadow on the Tibetan plateau. Soil Biology and Biochemistry 36(2), 237-243.
| Crossref | Google Scholar |
Carbone MS, Still CJ, Ambrose AR, Dawson TE, Williams AP, Boot CM, Schaeffer SM, Schimel JP (2011) Seasonal and episodic moisture controls on plant and microbial contributions to soil respiration. Oecologia 167(1), 265-278.
| Crossref | Google Scholar | PubMed |
Chang J, Ciais P, Viovy N, Vuichard N, Sultan B, Soussana JF (2015) The greenhouse gas balance of European grasslands. Global Change Biology 21(10), 3748-3761.
| Crossref | Google Scholar | PubMed |
Chapuis‐Lardy L, Wrage N, Metay A, CHOTTE JL, Bernoux M (2007) Soils, a sink for N2O? A review. Global Change Biology 13(1), 1-17.
| Crossref | Google Scholar |
Chen W, Wolf B, Zheng X, Yao Z, Butterbach-Bahl K, Brueggemann N, Liu C, Han S, Han X (2011) Annual methane uptake by temperate semiarid steppes as regulated by stocking rates, aboveground plant biomass and topsoil air permeability. Global Change Biology 17(9), 2803-2816.
| Crossref | Google Scholar |
Christiansen JR, Outhwaite J, Smukler SM (2015) Comparison of CO2, CH4 and N2O soil–atmosphere exchange measured in static chambers with cavity ring-down spectroscopy and gas chromatography. Agricultural and Forest Meteorology 211–212, 48-57.
| Crossref | Google Scholar |
Ciais P, Reichstein M, Viovy N, Granier A, Ogée J, Allard V, Aubinet M, Buchmann N, Bernhofer C, Carrara A, Chevallier F, De Noblet N, Friend AD, Friedlingstein P, Grünwald T, Heinesch B, Keronen P, Knohl A, Krinner G, Loustau D, Manca G, Matteucci G, Miglietta F, Ourcival JM, Papale D, Pilegaard K, Rambal S, Seufert G, Soussana JF, Sanz MJ, Schulze ED, Vesala T, Valentini R (2005) Europe-wide reduction in primary productivity caused by the heat and drought in 2003. Nature 437(7058), 529-533.
| Crossref | Google Scholar | PubMed |
Clayton H, McTaggart IP, Parker J, Swan L, Smith KA (1997) Nitrous oxide emissions from fertilised grassland: a 2-year study of the effects of N fertiliser form and environmental conditions. Biology and Fertility of Soils 25(3), 252-260.
| Crossref | Google Scholar |
Comeau LP, Lai DYF, Cui JJ, Farmer J (2018) Separation of soil respiration: a site-specific comparison of partition methods. Soil 4(2), 141-152.
| Crossref | Google Scholar |
Curtis CJ, Emmett BA, Reynolds B, Shilland J (2006) How important is N2O production in removing atmospherically deposited nitrogen from UK moorland catchments? Soil Biology and Biochemistry 38(8), 2081-2091.
| Crossref | Google Scholar |
Dangal SRS, Tian H, Pan S, Zhang L, Xu R (2020) Greenhouse gas balance in global pasturelands and rangelands. Environmental Research Letters 15, 104006.
| Crossref | Google Scholar |
Davidson EA, Janssens IA, Luo Y (2006) On the variability of respiration in terrestrial ecosystems: moving beyond Q10. Global Change Biology 12(2), 154-164.
| Crossref | Google Scholar |
de Klein CAM, Barton L, Sherlock RR, Li Z, Littlejohn RP (2003) Estimating a nitrous oxide emission factor for animal urine from some New Zealand pastoral soils. Soil Research 41(3), 381-399.
| Crossref | Google Scholar |
Dijkstra FA, Morgan JA, von , Fischer JC, Follett RF (2011) Elevated CO2 and warming effects on CH4 uptake in a semiarid grassland below optimum soil moisture. Journal of Geophysical Research: Biogeosciences 116(G1), G01007.
| Crossref | Google Scholar |
Dong Y, Zhang S, Qi Y, Chen Z, Geng Y (2000) Fluxes of CO2, N2O and CH4 from a typical temperate grassland in Inner Mongolia and its daily variation. Chinese Science Bulletin 45(17), 1590-1594.
| Crossref | Google Scholar |
Farquhar GD, Sharkey TD (1982) Stomatal conductance and photosynthesis. Annual Review of Plant Physiology 33(1), 317-345.
| Crossref | Google Scholar |
Field CB, Chapin FS, Matson PA, Mooney HA (1992) Responses of terrestrial ecosystems to the changing atmosphere: a resource-based approach. Annual Review of Ecology and Systematics 23, 201-235.
| Crossref | Google Scholar |
Frank A, Liebig M, Hanson J (2002) Soil carbon dioxide fluxes in northern semiarid grasslands. Soil Biology and Biochemistry 34(9), 1235-1241.
| Crossref | Google Scholar |
Gifford RM (2003) Plant respiration in productivity models: conceptualisation, representation and issues for global terrestrial carbon-cycle research. Functional Plant Biology 30(2), 171-186.
| Crossref | Google Scholar | PubMed |
Gourlez de la Motte L, Mamadou O, Beckers Y, Bodson B, Heinesch B, Aubinet M (2018) Rotational and continuous grazing does not affect the total net ecosystem exchange of a pasture grazed by cattle but modifies CO2 exchange dynamics. Agriculture, Ecosystems & Environment 253, 157-165.
| Crossref | Google Scholar |
Groffman PM, Butterbach-Bahl K, Fulweiler RW, Gold AJ, Morse JL, Stander EK, Tague C, Tonitto C, Vidon P (2009) Challenges to incorporating spatially and temporally explicit phenomena (hotspots and hot moments) in denitrification models. Biogeochemistry 93(1), 49-77.
| Crossref | Google Scholar |
Harmon ME, Bond-Lamberty B, Tang J, Vargas R (2011) Heterotrophic respiration in disturbed forests: a review with examples from North America. Journal of Geophysical Research: Biogeosciences 116(G4), G00K04.
| Crossref | Google Scholar |
Heskel MA, Atkin OK, Turnbull MH, Griffin KL (2013) Bringing the Kok effect to light: a review on the integration of daytime respiration and net ecosystem exchange. Ecosphere 4(8), art98.
| Crossref | Google Scholar |
Hoover DL, Knapp AK, Smith MD (2014) Resistance and resilience of a grassland ecosystem to climate extremes. Ecology 95(9), 2646-2656.
| Crossref | Google Scholar |
Horváth L, Grosz B, Machon A, Tuba Z, Nagy Z, Czóbel SZ, Balogh J, Péli E, Fóti SZ, Weidinger T, Pintér K, Führer E (2010) Estimation of nitrous oxide emission from Hungarian semi-arid sandy and loess grasslands; effect of soil parameters, grazing, irrigation and use of fertilizer. Agriculture, Ecosystems & Environment 139(1), 255-263.
| Crossref | Google Scholar |
Hu Y, Jiang L, Wang S, Zhang Z, Luo C, Bao X, Niu H, Xu G, Duan J, Zhu X, Cui S, Du M (2016) The temperature sensitivity of ecosystem respiration to climate change in an alpine meadow on the Tibet plateau: a reciprocal translocation experiment. Agricultural and Forest Meteorology 216, 93-104.
| Crossref | Google Scholar |
Imer D, Merbold L, Eugster W, Buchmann N (2013) Temporal and spatial variations of soil CO2, CH4 and N2O fluxes at three differently managed grasslands. Biogeosciences 10(9), 5931-5945.
| Crossref | Google Scholar |
IPCC (2022) Climate Change 2022: Mitigation of Climate Change. In ‘Contribution of Working Group III to the Sixth Assessment Report of the Intergovernmental Panel on Climate Change’. Ch 7. (Eds PR Shukla, J Skea, R Slade, A Al Khourdajie, R van Diemen, D McCollum, M Pathak, S Some, P Vyas, R Fradera, M Belkacemi, A Hasija, G Lisboa, S Luz, J Malley) pp. 747–831. (Cambridge University Press: Cambridge, UK; and New York, NY, USA)
Janssens I, Lankreijer H, Matteucci G, Kowalski A, Buchmann N, Epron D, Pilegaard K, Kutsch W, Longdoz B, Grünwald T (2001) Productivity overshadows temperature in determining soil and ecosystem respiration across European forests. Global Change Biology 7(3), 269-278.
| Crossref | Google Scholar |
Janssens I, Freibauer A, Schlamadinger B, Ceulemans R, Ciais P, Dolman A, Heimann M, Nabuurs G-J, Smith P, Valentini R (2005) The carbon budget of terrestrial ecosystems at country-scale: a European case study. Biogeosciences 2(1), 15-26.
| Crossref | Google Scholar |
Jones MB, Donnelly A (2004) Carbon sequestration in temperate grassland ecosystems and the influence of management, climate and elevated CO2. New Phytologist 164(3), 423-439.
| Crossref | Google Scholar |
Kirschbaum MUF (2006) The temperature dependence of organic-matter decomposition: still a topic of debate. Soil Biology and Biochemistry 38(9), 2510-2518.
| Crossref | Google Scholar |
Koncz P, Pintér K, Balogh J, Papp M, Hidy D, Csintalan Z, Molnár E, Szaniszló A, Kampfl G, Horváth L, Nagy Z (2017) Extensive grazing in contrast to mowing is climate-friendly based on the farm-scale greenhouse gas balance. Agriculture, Ecosystems & Environment 240, 121-134.
| Crossref | Google Scholar |
Konda R, Ohta S, Ishizuka S, Heriyanto J, Wicaksono A (2010) Seasonal changes in the spatial structures of N2O, CO2, and CH4 fluxes from Acacia mangium plantation soils in Indonesia. Soil Biology and Biochemistry 42(9), 1512-1522.
| Crossref | Google Scholar |
Leahy P, Kiely G, Scanlon TM (2004) Managed grasslands: a greenhouse gas sink or source? Geophysical Research Letters 31(20), L20507.
| Crossref | Google Scholar |
Le Mer J, Roger P (2001) Production, oxidation, emission and consumption of methane by soils: a review. European Journal of Soil Biology 37(1), 25-50.
| Crossref | Google Scholar |
Liu L, Greaver TL (2009) A review of nitrogen enrichment effects on three biogenic GHGs: the CO2 sink may be largely offset by stimulated N2O and CH4 emission. Ecology Letters 12(10), 1103-1117.
| Crossref | Google Scholar | PubMed |
Liu Z, Li H, Wang T, Huang N, Huang Z, Luo Y, Yan W, Baoyin T (2021) Grassland restoration measures alter soil methane uptake by changing community phylogenetic structure and soil properties. Ecological Indicators 133, 108368.
| Crossref | Google Scholar |
Liu H, Zheng X, Li Y, Yu J, Ding H, Sveen TR, Zhang Y (2022) Soil moisture determines nitrous oxide emission and uptake. Science of The Total Environment 822, 153566.
| Crossref | Google Scholar | PubMed |
Lloyd J, Taylor J (1994) On the temperature dependence of soil respiration. Functional Ecology 315-323.
| Crossref | Google Scholar |
Luo GJ, Kiese R, Wolf B, Butterbach-Bahl K (2013) Effects of soil temperature and moisture on methane uptake and nitrous oxide emissions across three different ecosystem types. Biogeosciences 10(5), 3205-3219.
| Crossref | Google Scholar |
Mäkiranta P, Riutta T, Penttilä T, Minkkinen K (2010) Dynamics of net ecosystem CO2 exchange and heterotrophic soil respiration following clearfelling in a drained peatland forest. Agricultural and Forest Meteorology 150(12), 1585-1596.
| Crossref | Google Scholar |
McClain ME, Boyer EW, Dent CL, Gergel SE, Grimm NB, Groffman PM, Hart SC, Harvey JW, Johnston CA, Mayorga E (2003) Biogeochemical hot spots and hot moments at the interface of terrestrial and aquatic ecosystems. Ecosystems 6, 301-312.
| Crossref | Google Scholar |
Menegat S, Ledo A, Tirado R (2022) Greenhouse gas emissions from global production and use of nitrogen synthetic fertilisers in agriculture. Scientific Reports 12(1), 14490.
| Crossref | Google Scholar | PubMed |
Muggeo VMR (2003) Estimating regression models with unknown break-points. Statistics in Medicine 22(19), 3055-3071.
| Crossref | Google Scholar | PubMed |
Muggeo VMR (2021) Package ‘segmented’: segmented relationships in regression models with breakpoints/changepoints estimation, Version (1.3-4). 10.32614/CRAN.package.segmented
Novick KA, Stoy PC, Katul GG, Ellsworth DS, Siqueira MBS, Juang J, Oren R (2004) Carbon dioxide and water vapor exchange in a warm temperate grassland. Oecologia 138(2), 259-274.
| Crossref | Google Scholar | PubMed |
Patton BD, Dong X, Nyren PE, Nyren A (2007) Effects of grazing intensity, precipitation, and temperature on forage production. Rangeland Ecology & Management 60(6), 656-665.
| Crossref | Google Scholar |
Pihlatie MK, Christiansen JR, Aaltonen H, Korhonen JFJ, Nordbo A, Rasilo T, Benanti G, Giebels M, Helmy M, Sheehy J, Jones S, Juszczak R, Klefoth R, Lobo-do-Vale R, Rosa AP, Schreiber P, Serça D, Vicca S, Wolf B, Pumpanen J (2013) Comparison of static chambers to measure CH4 emissions from soils. Agricultural and Forest Meteorology 171–172, 124-136.
| Crossref | Google Scholar |
R Development Core Team (2021) R: A Language and Environment for Statistical Computing. R Foundation for Statistical Computing, Vienna, Austria. URL: https://www.R-project.org/
Reichstein M, Falge E, Baldocchi D, Papale D, Aubinet M, Berbigier P, Bernhofer C, Buchmann N, Gilmanov T, Granier A, Grünwald T, Havránková K, Ilvesniemi H, Janous D, Knohl A, Laurila T, Lohila A, Loustau D, Matteucci G, Meyers T, Miglietta F, Ourcival J-M, Pumpanen J, Rambal S, Rotenberg E, Sanz M, Tenhunen J, Seufert G, Vaccari F, Vesala T, Yakir D, Valentini R (2005) On the separation of net ecosystem exchange into assimilation and ecosystem respiration: review and improved algorithm. Global Change Biology 11(9), 1424-1439.
| Crossref | Google Scholar |
Schaufler G, Kitzler B, Schindlbacher A, Skiba U, Sutton MA, Zechmeister-Boltenstern S (2010) Greenhouse gas emissions from European soils under different land use: effects of soil moisture and temperature. European Journal of Soil Science 61(5), 683-696.
| Crossref | Google Scholar |
Shapiro SS, Wilk MB (1965) An analysis of variance test for normality (Complete Samples). Biometrika 52(3/4), 591-611.
| Crossref | Google Scholar |
Smith WN, Grant BB, Desjardins RL, Qian B, Hutchinson J, Gameda S (2009) Potential impact of climate change on carbon in agricultural soils in Canada 2000–2099. Climatic Change 93(3), 319-333.
| Crossref | Google Scholar |
Soussana J, Allard V, Pilegaard K, Ambus P, Amman C, Campbell C, Ceschia E, Clifton-Brown J, Czóbel S, Domingues R, Fléchard C, Fuhrer J, Hensen A, Horváth L, Jones M, Kasper G, Martin C, Nagy Z, Neftel A, Raschi A, Baronti S, Rees R, Skiba U, Stefani P, Manca G, Sutton M, Tuba Z, Valentini R (2007) Full accounting of the greenhouse gas (CO2, N2O, CH4) budget of nine European grassland sites. Agriculture, Ecosystems & Environment 121, 121-134.
| Crossref | Google Scholar |
Wachiye S, Pellikka P, Rinne J, Heiskanen J, Abwanda S, Merbold L (2022) Effects of livestock and wildlife grazing intensity on soil carbon dioxide flux in the savanna grassland of Kenya. Agriculture, Ecosystems & Environment 325, 107713.
| Crossref | Google Scholar |
Wagner-Riddle C, Baggs EM, Clough TJ, Fuchs K, Petersen SO (2020) Mitigation of nitrous oxide emissions in the context of nitrogen loss reduction from agroecosystems: managing hot spots and hot moments. Current Opinion in Environmental Sustainability 47, 46-53.
| Crossref | Google Scholar |
Wall AM, Campbell DI, Mudge PL, Rutledge S, Schipper LA (2019) Carbon budget of an intensively grazed temperate grassland with large quantities of imported supplemental feed. Agriculture, Ecosystems & Environment 281, 1-15.
| Crossref | Google Scholar |
Wang Z, Wan X, Tian M, Wang X, Chen J, Chen X, Chang S, Hou F (2020) Grazing season alters soil respiration in a semiarid grassland on the Loess Plateau. Nutrient Cycling in Agroecosystems 118(2), 177-191.
| Crossref | Google Scholar |
Wang R, Cavagnaro TR, Jiang Y, Keitel C, Dijkstra FA (2021) Carbon allocation to the rhizosphere is affected by drought and nitrogen addition. Journal of Ecology 109(10), 3699-3709.
| Crossref | Google Scholar |
Wei D, Xu R, Liu Y, Wang Y, Wang Y (2014) Three-year study of CO2 efflux and CH4/N2O fluxes at an alpine steppe site on the central Tibetan Plateau and their responses to simulated N deposition. Geoderma 232–234, 88-96.
| Crossref | Google Scholar |
Wood TE, Cavaleri MA, Reed SC (2012) Tropical forest carbon balance in a warmer world: a critical review spanning microbial- to ecosystem-scale processes. Biological Reviews of the Cambridge Philosophical Society 87(4), 912-927.
| Crossref | Google Scholar | PubMed |
Yao Z, Zheng X, Xie B, Liu C, Mei B, Dong H, Butterbach-Bahl K, Zhu J (2009) Comparison of manual and automated chambers for field measurements of N2O, CH4, CO2 fluxes from cultivated land. Atmospheric Environment 43(11), 1888-1896.
| Crossref | Google Scholar |
Zhu X, Luo C, Wang S, Zhang Z, Cui S, Bao X, Jiang L, Li Y, Li X, Wang Q, Zhou Y (2015) Effects of warming, grazing/cutting and nitrogen fertilization on greenhouse gas fluxes during growing seasons in an alpine meadow on the Tibetan Plateau. Agricultural and Forest Meteorology 214–215, 506-514.
| Crossref | Google Scholar |
Zong N, Song M, Shi P, Jiang J, Zhang X, Shen Z (2014) Timing patterns of nitrogen application alter plant production and CO2 efflux in an alpine meadow on the Tibetan Plateau, China. Pedobiologia 57(4), 263-269.
| Crossref | Google Scholar |


