

Phylogeography of the freshwater glassfishes (Ambassidae) of eastern Australia: cryptic species and hybrid zones
Peter J. Unmack A * , Michael P. Hammer B , Rachael K. Remington C , Jerald B. Johnson D and Mark Adams E F
A
B
C
D
E
F
Abstract
We examined freshwater representatives from the family Ambassidae from across eastern Australia to test species boundaries and investigate biogeographic patterns.
To determine whether existing species boundaries are accurate, characterise introgression, and identify and contrast phylogeographic patterns.
Samples were obtained from 115 sites across the range of Ambassis agassizii, including representatives from other Ambassis spp. from river basins to the west and north. Data were obtained from three independent genetic approaches, allozymes (146 individuals), single nucleotide polymorphisms (239 individuals) and mitochondrial DNA (101 individuals).
Four groups of populations were identified as likely candidate species. The most widespread taxon, A. agassizii, had four phylogroups. Complex patterns of introgression were found in narrow contact zones, especially in the Burdekin Basin where all four candidate taxa occur.
Freshwater glassfishes have a complex evolutionary history in eastern Australia, with biogeographic patterns that are clearly different from those of the majority of other co-occurring species.
We provide clarification on the likely taxonomic diversity of the group in eastern Australia, thus providing a basis for more accurate understanding of biodiversity patterns and a solid basis on which to undertake taxonomic revisions and consider conservation issues across these taxa.
Keywords: allozymes, Ambassis, biogeography, cryptic species, freshwater fishes, introgression, mtDNA, SNPs.
Introduction
The Australian freshwater fish fauna has long been considered depauperate when compared with that of other landmasses of comparable size and latitudinal position (Allen 1989; Lundberg et al. 2000). Although traditional accounts for this low species diversity have mostly focussed on geomorphic, hydrological, climatic, and biogeographic factors, recent comprehensive genetic or genomic studies have strongly favoured a key additional explanation, namely a comparative lack of taxonomic effort (Lundberg et al. 2000; Hammer et al. 2013; Adams et al. 2023). Such studies have typically shown undescribed candidate species in almost every genus surveyed thus far (Table 1), with most widespread and some restricted-range ‘species’ proving to be species complexes.
| Genus | CS | Genetic and genomic datasets | |
|---|---|---|---|
| Amniataba | 4 (0) | Shelley et al. (2018) | |
| Cairnsichthys | 1 (1) | Hammer et al. (2018) | |
| Gadopsis | 5 (0) | Hammer et al. (2014) and Unmack et al. (2017) | |
| Galaxias | 20A (14) | Adams et al. (2014) and Jense et al. (2024) | |
| Galaxiella | 1 (1) | Unmack et al. (2012) | |
| Glossamia | 4 (0) | Cook et al. (2017) | |
| Glossogobius | 2 (2) | Hammer et al. (2021a) | |
| Hypseleotris | 9 (6) | Unmack et al. (2019), Thacker et al. (2022) and Unmack et al. (2023) | |
| Melanotaenia | 4 (2) | Hammer et al. (2019a) and Tims et al. (2024) | |
| Mogurnda | 8 (0) | Adams et al. (2013) and S. Amini, P. J. Unmack and M. Adams, unpubl. data | |
| Nannoperca | 3B (0) | Unmack et al. (2011), Unmack et al. (2013) and Buckley et al. (2018) | |
| Philypnodon | 8 (0) | Hammer et al. (2019b) | |
| Pseudogobius | 2 (2) | Hammer et al. (2021b) | |
| Retropinna | 3 (0) | Hammer et al. (2007) and Unmack et al. (2022) | |
| Syncomistes | 5 (5) | Shelley et al. (2018) | |
| Tandanus | 2 (2) | Jerry (2008) | |
| 81 (35) |
The number in parentheses indicates how many of these species have since been formally described.
Further reflecting Australia’s dearth of fish taxonomists (Leis et al. 2007), many of these candidate species are yet to be formally described (Table 1). Nevertheless, the availability of distributionally intensive, multi-gene molecular datasets (i.e. not just single gene barcoding) creates a solid foundation for any future taxonomic revision of the ‘species’ concerned by (a) providing genetic or genomic profiling of actual or companion voucher specimens, (b) detailing the comparative distributional patterns of candidate species, (c) detecting any putative zones of admixture, and (d) identifying the distributional gaps to target in future collecting efforts (Unmack et al. 2022). Such information is particularly pertinent when applied to widespread ‘species’ with abutting or overlapping ranges, a confusing taxonomic history, and which include threatened subpopulations. Here, we consider Australia’s freshwater glassfishes, a poorly understood taxonomic group that meets each of these criteria.
The family Ambassidae (Glassfishes) consists of 55 described species from across the Indo Pacific region, from the vicinity of Japan to South Africa and Australia, where they occur in marine environments, plus freshwater habitats in South-east Asia and Australia–New Guinea (Fricke et al. 2024). The genus Ambassis contains 22 currently described species, with several widespread marine species plus a freshwater radiation in Australia–New Guinea. Their common name of glassfish is due to the quite translucent appearance of many of the representative taxa.
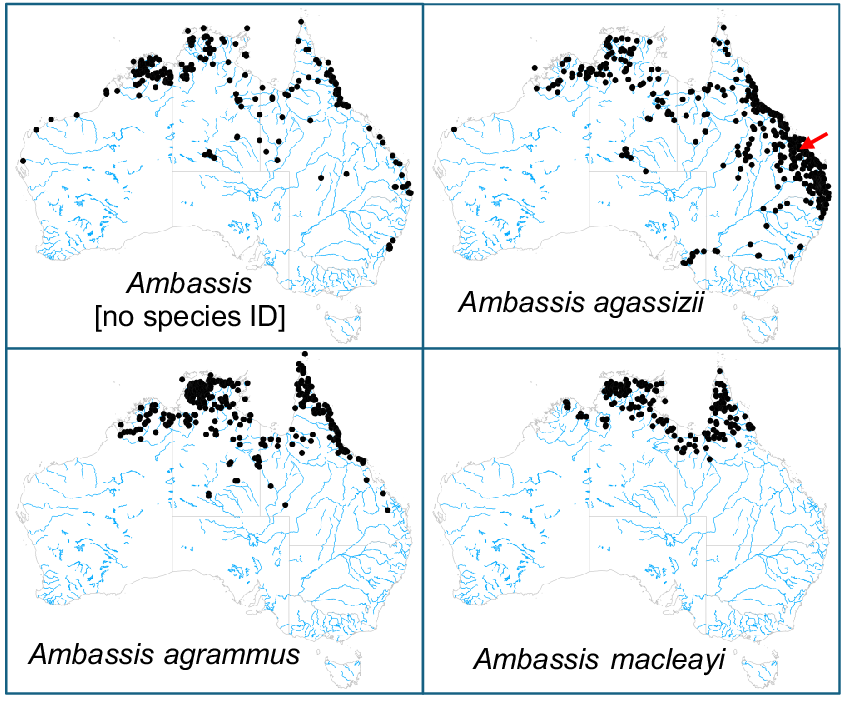
One of the more widespread and well-studied species is A. agassizii, which was re-characterised as an eastern Australian species during a review of freshwater Ambassis in Australia (Allen and Burgess 1990). Prior to this review, taxonomic confusion was common, with at least four different Ambassis species (A. agassizii, A. agrammus, A. castelnaui (synonymised) and A. nigripinnis (synonymised)) being recognised within the range of A. agassizii that was initially thought to encompass south-eastern, north-eastern and north-western Australia (Merrick and Schmida 1984). Allen and Burgess (1990) defined the range of A. agassizii as eastern coastal drainages from Mowbray River just north of Cairns (although their northern limits are not clear), Queensland to Lake Hiawatha, just south of the Clarence River in New South Wales, as well as historically occurring throughout the Murray–Darling Basin, with the type locality being the Fitzroy River, coastal Queensland (Fig. 1). In addition to A. agassizii, they recognised (1) a closely related north-western species (distributed from the Kimberley, Top End, Gulf of Carpentaria and inland drainages of central Australia), elevating the name Ambassis mulleri = muelleri, but which ultimately proved to be unavailable once correct type data were confirmed (Allen et al. 2002); the northern species currently remains undescribed and is often listed as Ambassis sp. north-west (NW): Pusey et al. 2017), and (2) A. agrammus from the north-east (distributed on Cape York and streams of the Top End). To add to the confusion, some authors have subsequently identified A. agrammus from the Wet Tropics region within the range of A. agassizii (detailed in Pusey et al. 2004; see also Fig. 1); indeed, there remains considerable uncertainty even as to how many species of freshwater Ambassis there are, both in eastern Australia (Pusey et al. 2004) and beyond (Allen et al. 2002; Pusey et al. 2017). The depth of this uncertainty is clearly evident in the distributional maps currently displayed for museum voucher specimens of the three most similar species (Fig. 1), which not only do not reflect the revision of Allen and Burgess (1990), but also infer that these three species co-occur across much of northern and eastern Australia.
Distribution maps for museum voucher specimens of the three freshwater Ambassis species most often confounded in museum collections. Also included is a map for specimens without a species identifier. Source data are from the Atlas of Living Australia (see https://www.ala.org.au, accessed 28 August 2024). Arrow depicts the approximate location of the type locality for A. agassizii.
Ambassis agassizii is typically common and widespread across its range, except for populations in the Murray–Darling Basin, which have undergone a major decline across most of the Basin (Lintermans 2007). The species occurs in most aquatic habitats from the lower freshwater reaches to headwater streams, provided there are no higher gradient stream reaches. Individuals typically have a strong preference for instream cover, especially aquatic vegetation (Pusey et al. 2004), although sometimes they can be abundant in turbid open water environments with low species richness (more typically in arid parts of their range). The species is small bodied, reaching a maximum size of 60–80 mm and is likely having a maximum life span of 3–4 years in the wild, and displays an extended spawning period through the warmer months, with a peak in late spring–early summer. Total annual fecundity is unknown, but ova counts vary from several hundred in smaller individuals up to ~10,000 in larger ones. Fish mature in 1 year (Milton and Arthington 1985; Llewellyn 2008).
Only three studies have examined phylogeographic patterns in Australian Ambassis species, with two using mitochondrial DNA (mtDNA) and microsatellites. One focused on A. macleayi (Huey et al. 2010) in the southern Gulf of Carpentaria (Queensland), another on an undescribed taxon (Huey et al. 2011) in the Queensland portions of the Lake Eyre Basin and southern Gulf of Carpentaria. Even though both studies found high levels of genetic structure between different river basins, it was not possible to determine whether this substructure solely reflects within-taxon heterogeneity or is due to the presence of more than one taxon. The third study examined mtDNA in two marine Ambassis species (A. jacksoniensis and A. marianus) and found no geographic structure (Mills et al. 2008).
To help resolve this ambiguity, we herein present a comprehensive genetic and genomic overview of the most common freshwater Ambassis species found in eastern Australia, focussing on populations referable to A. agassizii but also including exemplars of A. agrammus and Ambassis populations from inland river basins. A follow-up publication will then incorporate these results into a companion study of all other surveyed sites across the continent, incorporating the remaining members of the genus and including the other two obligate freshwater species in eastern Australia (A. elongata and A. macleayi). Both studies employ allozymes, single nucleotide polymorphisms (SNPs), and the mitochondrial DNA (mtDNA) gene cytochrome b (cytb). Our primary goals are to document broad genetic and phylogeographic structure within A. agassizii (as defined by Allen and Burgess 1990), to assess whether the current taxonomy accurately reflects species boundaries in this region of the continent, and to explore biogeographic patterns among and within any candidate taxa identified.
Materials and methods
Sample collection
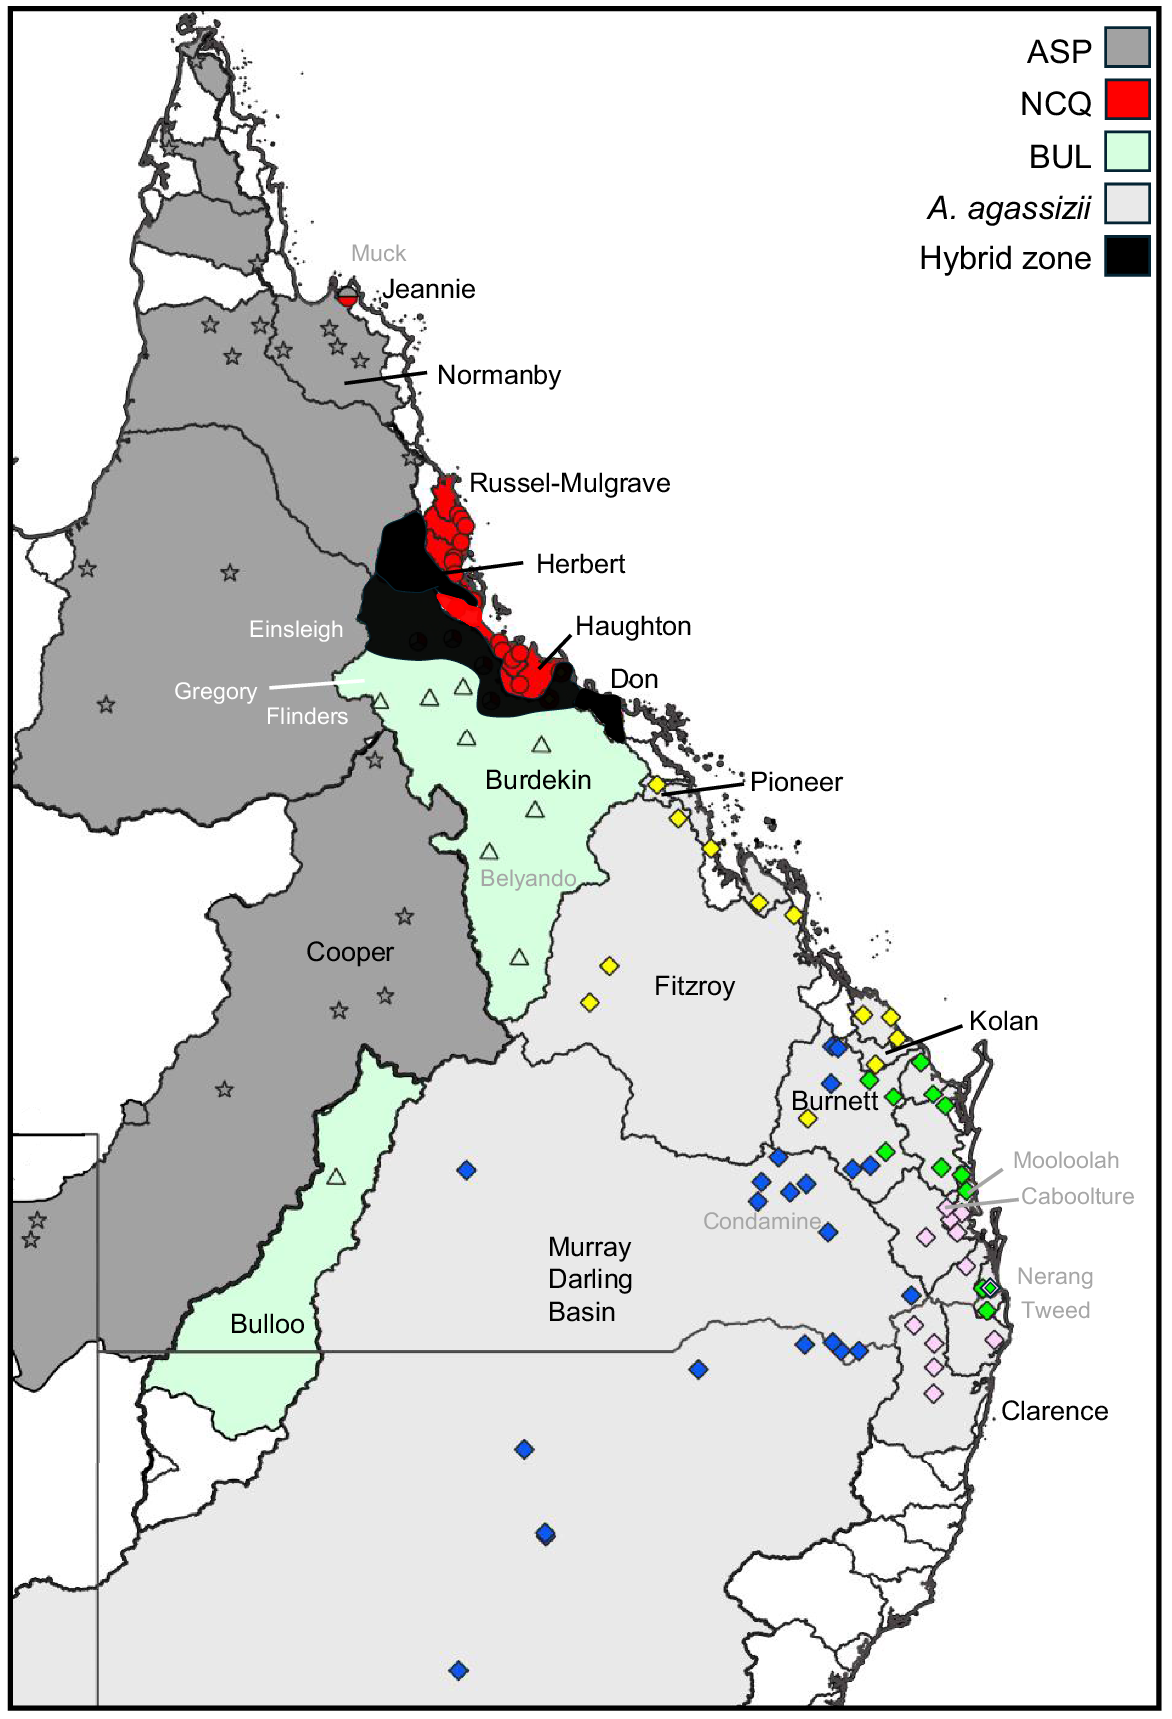
All collections were obtained under permit from Queensland and New South Wales Fisheries and research was conducted under approval from the University of Canberra Institutional Animal Care and Use Committee (approvals: CEAE 13-06, CEAE 14-17, CEAE 15-05, IACUC 0447, IACUC 9371). Snap-frozen (liquid nitrogen) or ethanol-fixed tissues were deposited in the South Australian Museum’s Australian Biological Tissues Collection. We sampled A. agassizii across its range, except for populations north of the Mulgrave River, which we were unable to obtain. We also included fish from the Bulloo River (Lake Eyre Basin). These have never been formally identified but are clearly genetically related to the lineage containing A. agassizii on the basis of our broader unpublished data. We also sampled other Ambassis populations from all adjacent river basins to the west of the main study area and further north through Cape York. Sample sizes per site were usually low (typically two individuals per population, range: n = 1–10), as is appropriate for studies that primarily focus on species boundaries and broader phylogeography (Adams et al. 2014). Although each molecular dataset employed a different number of populations and individuals, there was considerable site overlap between marker types, thus ensuring that all key lineages were always included. In total, 115 sites (Fig. 2) were surveyed for at least one dataset, including 239 individuals for SNPs, 146 for allozymes and 101 for mtDNA (Table 2).
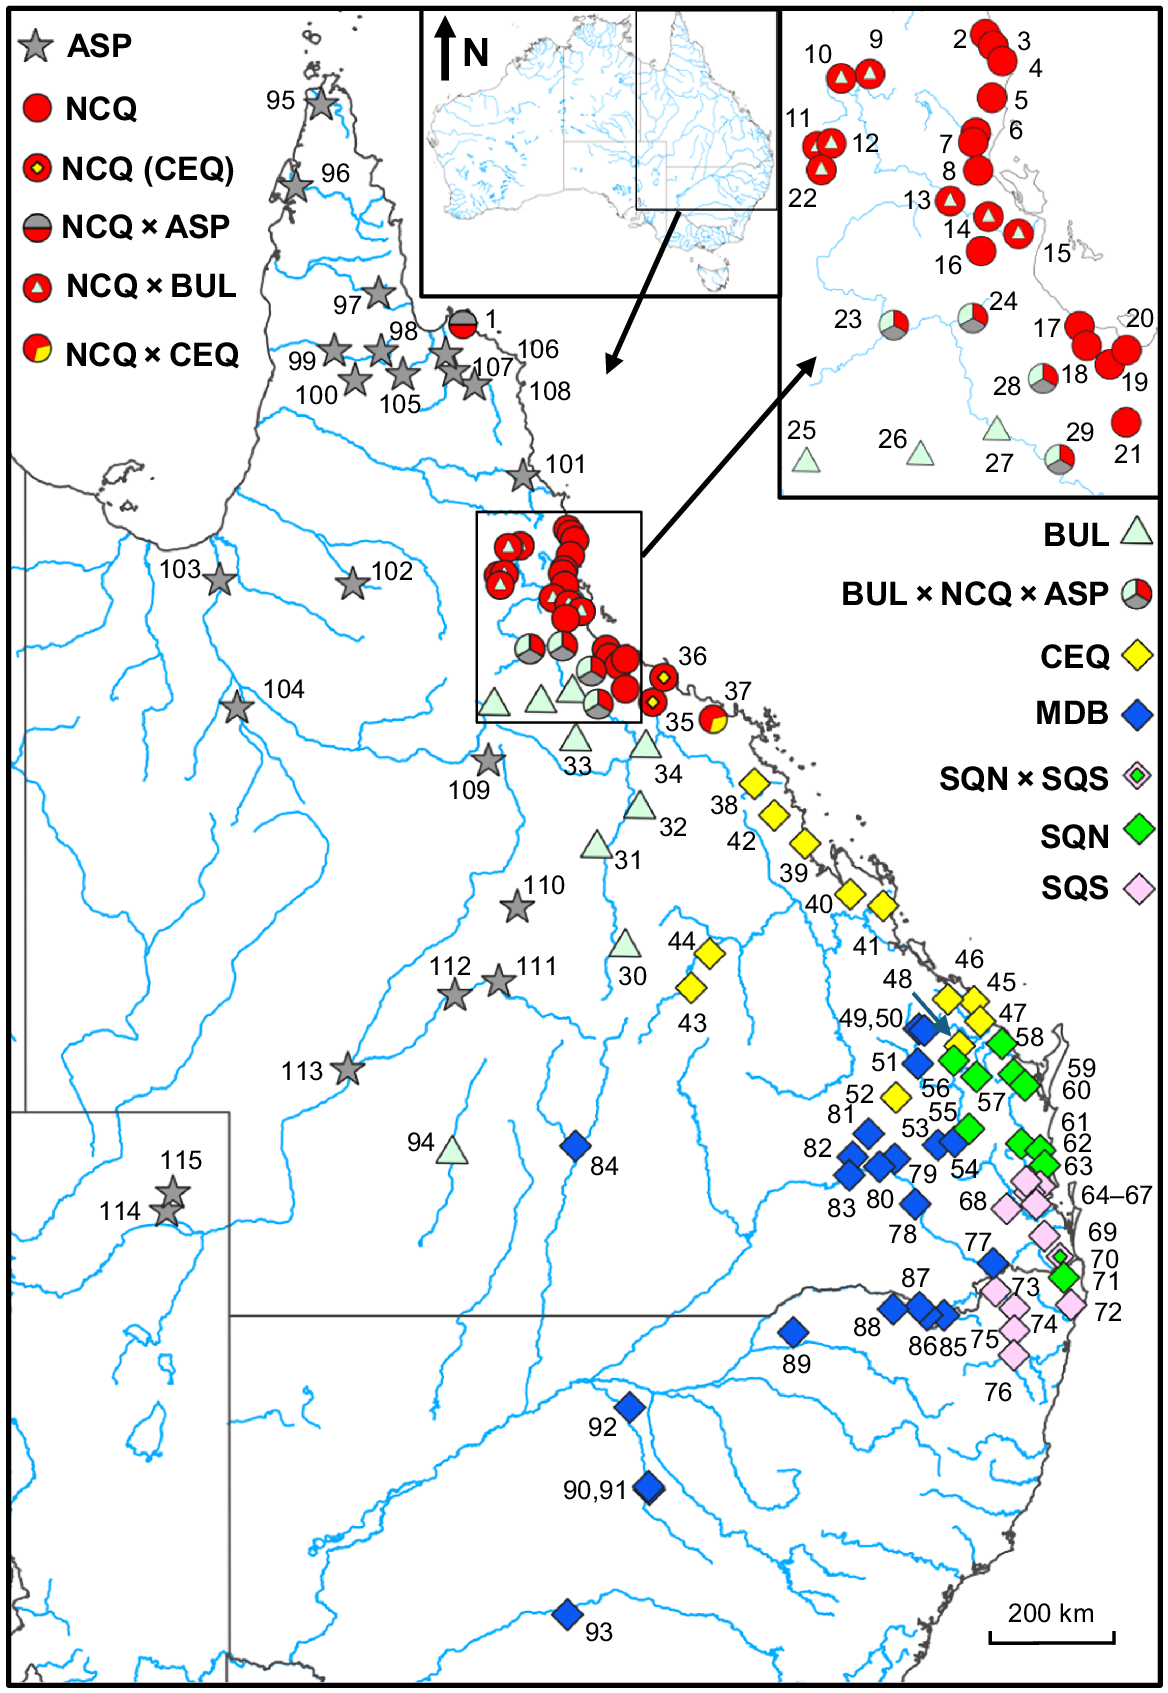
Map showing the geographic location of all sites and their final taxon designation by using the symbols provided. Sites numbers follow those used in Table 2.
| Site | Taxon | River system | Locality | Site codes | Latitude | Longitude | Alz | SNPs | cytb | |
|---|---|---|---|---|---|---|---|---|---|---|
| 1 | NCQ × ASP | Jeannie | Muck Ck | BC-Jean | −14.3909 | 144.4407 | 1 | 1 | ||
| 2 | NCQ | Russell–Mulgrave | Eubanangee Swamp | BC-Eub | −17.4087 | 145.9816 | 2 | 2 | ||
| 3 | NCQ | Johnstone | Polly Ck | PU15-74 | −17.4786 | 146.0299 | 2 | 2 | ||
| 4 | NCQ | Johnstone | Etty Bay | PU97-81 | −17.5712 | 146.0853 | 3 | 2 | 3 | |
| 5 | NCQ | Johnstone | Stagnant Ck | BC-Stag | −17.7925 | 146.0228 | 1 | |||
| 6 | NCQ | Tully | Weiss Ck | PU15-76 | −18.0048 | 145.926 | 2 | 2 | ||
| 7 | NCQ | Tully | Lagoon Ck | PU01-42 | −18.0624 | 145.9089 | 2 | 2 | 2 | |
| 8 | NCQ | Murray | Meunga Ck | PU15-79 | −18.2334 | 145.9393 | 1 | 1 | ||
| 9 | NCQxBUL | Herbert | Wild R | PU15-68 | −17.6492 | 145.2834 | 2 | |||
| 10 | NCQ × BUL | Herbert | Return Ck | PU97-97 | −17.6754 | 145.1102 | 2 | 2 | 2 | |
| 11 | NCQ × BUL | Herbert | Rudd Ck | PU16-80 | −18.0877 | 144.9652 | 2 | |||
| 12 | NCQ × BUL | Herbert | Gunnawarra Ck | PU16-79 | −18.0694 | 145.0498 | 2 | |||
| 13 | NCQ × BUL | Herbert | Girrigun | PU15-26 | −18.4192 | 145.7697 | 2 | |||
| 14 | NCQ × BUL | Herbert | Abergowie Bridge | BCXX-m05 | −18.5132 | 146.0009 | 2 | 2 | 2 | |
| 15 | NCQ × BUL | Herbert | Gairloch | PU15-25 | −18.6169 | 146.1831 | 2 | |||
| 16 | NCQ | Herbert | Stone R | PU15-50 | −18.7221 | 145.9569 | 2 | |||
| 17 | NCQ | Black | Bluewater Ck | PU15-30 | −19.1763 | 146.5528 | 2 | |||
| 18 | NCQ | Black | Cedar Ck | PU22-11 | −19.2953 | 146.596 | 5 | |||
| 19 | NCQ | Ross | Ross R | PU15-29 | −19.4086 | 146.7363 | 2 | 2 | ||
| 20 | NCQ | Ross | Stuarts Ck | PU15-28 | −19.3221 | 146.8372 | 2 | |||
| 21 | NCQ | Haughton | Reid R | PU22-61 | −19.7592 | 146.8347 | 5 | |||
| 22 | NCQ × BUL | Burdekin | Meadowbank Station | PU16-78 | −18.2301 | 144.9898 | 2 | |||
| 23 | BUL × NCQ × ASP | Burdekin | Blue Range crossing | PU15-45 | −19.1701 | 145.4284 | 2 | |||
| 24 | BUL × NCQ × ASP | Burdekin | Running R lower | PU15-47 | −19.1275 | 145.9069 | 2 | |||
| 25 | BUL | Burdekin | Basalt R | PU15-40 | −20.0081 | 144.8991 | 2 | 2 | ||
| 26 | BUL | Burdekin | Toomba Ck | PU15-38 | −19.9664 | 145.5898 | 2 | |||
| 27 | BUL | Burdekin | Fletcher Ck | PU15-36 | −19.8168 | 146.0519 | 2 | |||
| 28 | BUL × NCQ × ASP | Burdekin | Keelbottom R | BCXX-m07 | −19.4941 | 146.332 | 2 | 2 | 2 | |
| 29 | BUL × NCQ × ASP | Burdekin | Macrossan | PU22-52 | −19.9832 | 146.4331 | 5 | |||
| 30 | BUL | Burdekin | Bakoolama Waterhole | PU14-35: PU22-63 | −23.5658 | 146.8283 | 2 | 7 | ||
| 31 | BUL | Burdekin | Cabbage Tree Ck | PU-Carm | −22.1068 | 146.4139 | 5 | |||
| 32 | BUL | Burdekin | Suttor R | PU22-49 | −21.5274 | 147.0456 | 5 | |||
| 33 | BUL | Burdekin | Campaspe R | PU22-47 | −20.5341 | 146.1026 | 5 | |||
| 34 | BUL | Burdekin | Dalrymple Dam | PU22-53 | −20.6315 | 147.1333 | 5 | |||
| 35 | NCQ (CEQ) | Burdekin | Landers Ck | PU97-110: PU22-54 | −19.9551 | 147.2367 | 3 | 7 | 2 | |
| 36 | NCQ (CEQ) | Burdekin | Plantation Ck | PU22-55 | −19.5902 | 147.3993 | 5 | |||
| 37 | NCQ × CEQ | Don | Menilden Ck | PU22-09 | −20.2057 | 148.1263 | 5 | |||
| 38 | CEQ | Pioneer | Cattle Ck | BCXX-m15 | −21.1564 | 148.7335 | 1 | 1 | 1 | |
| 39 | CEQ | Plane | Flaggy Rock Ck | JG88-m27 | −22.0381 | 149.4789 | 2 | 1 | 2 | |
| 40 | CEQ | Shoalwater | Herbert Ck | PU97-76 | −22.7858 | 150.145 | 2 | 2 | 2 | |
| 41 | CEQ | Fitzroy, Qld | Maryvale Ck | PU02-49 | −22.9555 | 150.6293 | 1 | 2 | 2 | |
| 42 | CEQ | Fitzroy, Qld | Prospect Ck | PU97-106 | −21.6218 | 149.0265 | 2 | 2 | 2 | |
| 43 | CEQ | Fitzroy, Qld | Vandyke Ck | PU01-52 | −24.1636 | 147.8025 | 1 | 1 | 1 | |
| 44 | CEQ | Fitzroy, Qld | Fairbairn Dam | PU01-53 | −23.6596 | 148.0743 | 2 | 1 | 2 | |
| 45 | CEQ | Baffle | Deepwater R | PU01-56 | −24.3656 | 151.9659 | 2 | 2 | 1 | |
| 46 | CEQ | Baffle | House Ck | PU97-61 | −24.334 | 151.5848 | 2 | 2 | 2 | |
| 47 | CEQ | Baffle | Mullet Ck | PU01-57 | −24.6588 | 152.0586 | 2 | 2 | 2 | |
| 48 | CEQ | Kolan | Reedy Ck | PU99-57 | −25.0197 | 151.7546 | 2 | 2 | 2 | |
| 49 | MDB | Burnett | Monal Ck | PU19-65 | −24.7678 | 151.1563 | 2 | |||
| 50 | MDB | Burnett | Splinter Ck | PU19-66 | −24.7916 | 151.2365 | 2 | |||
| 51 | MDB | Burnett | Ceratodus | PU02-51 | −25.2825 | 151.1398 | 1 | 2 | 2 | |
| 52 | CEQ | Burnett | Auburn R | PU14-46 | −25.7805 | 150.8188 | 2 | 2 | ||
| 53 | MDB | Burnett | Boyne R | PU14-41 | −26.4808 | 151.4376 | 2 | 2 | ||
| 54 | MDB | Burnett | Reedy Ck | PU14-44 | −26.4313 | 151.6825 | 2 | |||
| 55 | SQN | Burnett | Barambah Ck | PU17-41 | −26.2416 | 151.8942 | 2 | |||
| 56 | SQN | Burnett | Sunday Ck | PU99-01 | −25.2353 | 151.6689 | 2 | 1 | 2 | |
| 57 | SQN | Burnett | Degilbo Ck | PU19-68 | −25.4746 | 152.0037 | 2 | |||
| 58 | SQN | Burrum | Elliott R | PU02-38 | −24.9875 | 152.3791 | 1 | 2 | 2 | |
| 59 | SQN | Burrum | Lenthall Dam | PU02-36 | −25.4361 | 152.5514 | 1 | 1 | 2 | |
| 60 | SQN | Mary Qld | Jumpo Ck | BCXX-m06 | −25.6029 | 152.7179 | 2 | |||
| 61 | SQN | Mary Qld | Yabba Ck | PU97-53 | −26.4597 | 152.6632 | 2 | 2 | 2 | |
| 62 | SQN | Maroochy | Maroochy R | PU09-101 | −26.5604 | 152.9438 | 2 | 2 | 2 | |
| 63 | SQN | Ewen Maddock Dam | PU09-104 | −26.7791 | 153.0089 | 2 | 2 | |||
| 64 | SQS | Pine | Caboolture R | PU09-97 | −27.0878 | 152.9431 | 1 | 1 | 1 | |
| 65 | SQS | Pine | Laceys Ck | PU09-87 | −27.1791 | 152.7841 | 2 | 2 | ||
| 66 | SQS | Pine | South Pine R | PU09-85 | −27.3554 | 152.8823 | 2 | 2 | 2 | |
| 67 | SQS | Brisbane | Delaney Ck | PU97-71 | −27.0146 | 152.7372 | 2 | 2 | 2 | |
| 68 | SQS | Brisbane | Atkinson Dam | PU09-92 | −27.4207 | 152.4487 | 2 | 2 | ||
| 69 | SQS | Logan-Albert | Logan R | PU09-79 | −27.8191 | 153.0044 | 2 | 2 | 2 | |
| 70 | SQN × SQS | South Coast | Nerang R | PU02-23 | −28.1246 | 153.2342 | 2 | 2 | 1 | |
| 71 | SQN | Tweed | Tweed R | PU14-49 | −28.433 | 153.2911 | 2 | 2 | ||
| 72 | SQS | Richmond | Richmond R | PU02-18 | −28.8351 | 153.3956 | 2 | 2 | 1 | |
| 73 | SQS | Clarence | Maryvale R | PU14-143 | −28.6335 | 152.2861 | 2 | 2 | ||
| 74 | SQS | Clarence | Tabulam | PU99-43 | −28.8858 | 152.5648 | 3 | 2 | 2 | |
| 75 | SQS | Clarence | Baryugil | PU14-149 | −29.2155 | 152.5626 | 2 | 2 | ||
| 76 | SQS | Clarence | Mann R | PU14-52 | −29.5775 | 152.5557 | 2 | 2 | ||
| 77 | MDB | Condamine MDB | Emu Ck | PU17-35 | −28.2249 | 152.2488 | 2 | |||
| 78 | MDB | Condamine MDB | Lake Broadwater | PU99-50 | −27.3501 | 151.1003 | 3 | 2 | 2 | |
| 79 | MDB | Condamine MDB | Charleys Ck | PU14-40 | −26.684 | 150.8007 | 2 | 2 | ||
| 80 | MDB | Condamine MDB | Chinchilla | GR91-m01 | −26.8001 | 150.5754 | 2 | 2 | ||
| 81 | MDB | Condamine MDB | near Dogwood Ck | PU15-11 | −26.3142 | 150.4147 | 2 | 2 | ||
| 82 | MDB | Condamine MDB | Miles | PU15-06 | −26.6561 | 150.1808 | 2 | 2 | ||
| 83 | MDB | Condamine MDB | Condamine | PU15-07 | −26.9263 | 150.1306 | 2 | 2 | ||
| 84 | MDB | Warrego MDB | Ward R | PU97-145 | −26.4944 | 146.0989 | 1 | 1 | 1 | |
| 85 | MDB | Border Rivers MDB | Dumaresq R, Mingoola | PU14-120 | −28.9885 | 151.5249 | 2 | 2 | ||
| 86 | MDB | Border Rivers MDB | Dumaresq R, Bonshaw Weir | PU14-141 | −28.9858 | 151.2759 | 1 | 1 | ||
| 87 | MDB | Border Rivers MDB | Dumaresq R, Texas | PU97-39 | −28.8711 | 151.164 | 2 | 2 | 2 | |
| 88 | MDB | Border Rivers MDB | McIntyre R | PU14-140 | −28.8996 | 150.7782 | 2 | 2 | ||
| 89 | MDB | Gwydir MDB | Gingham Waterhole | PU16-38 | −29.2432 | 149.3055 | 4 | 2 | ||
| 90 | MDB | Bogan MDB | Bogan R, Nyngan | PU14-129: PU16-23 | −31.5572 | 147.1852 | 5 | 3 | ||
| 91 | MDB | Bogan MDB | Bogan R near Nyngan | AMS44316-002 | −31.5119 | 147.1744 | 1 | |||
| 92 | MDB | Bogan MDB | Bogan R, Gongolgon | PU14-128 | −30.3471 | 146.8977 | 2 | 2 | ||
| 93 | MDB | Lachlan MDB | Lachlan R | PU16-09 | −33.4011 | 145.9802 | 5 | 2 | 5 | |
| 94 | BUL | Bulloo | Bulloo R | PU97-147: PU99-62 | −26.6119 | 144.2814 | 4 | 10 | 3 | |
| 95 | ASP | Jardine | Jardine R | PU97-87 | −11.1518 | 142.3554 | 3 | 2 | 3 | |
| 96 | ASP | Wenlock | Tentpole Ck | PU97-89 | −12.3617 | 141.9812 | 2 | 2 | ||
| 97 | ASP | Archer | Coen R | PU97-91 | −13.936 | 143.2 | 2 | 2 | 2 | |
| 98 | ASP | Coleman | Barwan Lagoon | BC-Bar | −14.791 | 143.236 | 1 | 1 | ||
| 99 | ASP | Edward | Edward R | MH15-35 | −14.7807 | 142.5473 | 1 | |||
| 100 | ASP | Mitchell | Crosbie Ck | MH15-43 | −15.2176 | 142.8535 | 2 | |||
| 101 | ASP | Mitchell | Hunters Ck | PU97-95 | −16.6321 | 145.3253 | 2 | 2 | ||
| 102 | ASP | Gilbert | Venture Ck | JG88-m17 | −18.2197 | 142.819 | 2 | 2 | 3 | |
| 103 | ASP | Flinders | Flinders R | PU-FRC | −18.1617 | 140.856 | 1 | |||
| 104 | ASP | Flinders | Cloncurry R | PU15-24 | −20.0393 | 141.1146 | 2 | |||
| 105 | ASP | Normanby | Morehead R | MH15-30 | −15.1319 | 143.5563 | 2 | |||
| 106 | ASP | Normanby | Horseshoe Lagoon | BC-Hors | −15.2842 | 144.6118 | 2 | |||
| 107 | ASP | Normanby | Catfish hole | BC-Cat | −15.0816 | 144.3008 | 2 | |||
| 108 | ASP | Normanby | Red Lilly Lagoon | BC-Red | −14.8316 | 144.1871 | 2 | |||
| 109 | ASP | Cooper | Bullock Ck | PU97-100 | −20.8223 | 144.8168 | 1 | 2 | 2 | |
| 110 | ASP | Cooper | Aramac Ck | PU90-m04 | −22.9782 | 145.2426 | 2 | 2 | 2 | |
| 111 | ASP | Cooper | Barcoo R | PU15-04 | −24.0748 | 144.9708 | 2 | |||
| 112 | ASP | Cooper | Little Oma Waterhole | PU16-22A | −24.2771 | 144.3222 | 2 | |||
| 113 | ASP | Cooper | Currareva Waterhole | PU14-27 | −25.37 | 142.7446 | 2 | |||
| 114 | ASP | Cooper | Narie Waterhole | BP93-m17 | −27.4588 | 140.0772 | 1 | 2 | ||
| 115 | ASP | Cooper | Ella Ck | AF02-11 | −27.1882 | 140.17 | 1 | 2 | ||
| 146 | 239 | 101 |
Sample sizes are shown for each molecular dataset in the last three columns. Alz, allozymes; Ck, creek; R, river; MDB, Murray–Darling Basin.
Allozyme analyses
Because this study was initiated before low-cost genomic screening became routinely available, our initial genetic assessment involved a comprehensive allozyme screen of 146 individuals from 72 sites, with these encompassing the entire geographic range for which frozen tissues were available prior to 2017. Allozyme electrophoresis of muscle homogenates was conducted on cellulose acetate gels as detailed by Richardson et al. (1986). All laboratory protocols, enzyme details and the methodological procedures for undertaking principal co-ordinates analysis (PCA) and calculating genetic distances or fixed differences have been published previously (Richardson et al. 1986; Hammer et al. 2007; Adams et al. 2014).
SNP genotyping and filtering
Considering the allozyme and cytb results, 239 individuals (from 103 sites) were ultimately selected for SNP genotyping (Table 2). DNA was extracted and sequenced by diversity arrays technology (DArT Pty Ltd, Canberra, ACT, Australia; see www.diversityarrays.com) on the basis of a combination of complexity reduction by using two restriction enzymes (PstI, recognition sequence 5′-CTGCA|G-3′, and SphI, 5′-GCATG|C-3′), implicit fragment size selection, and next-generation sequencing (Kilian et al. 2012). All other details of the sequencing methods are presented in Georges et al. (2018).
The SNP data and associated metadata were read into the package dartR (ver. 2.9.4, see https://cran.r-project.org/package=dartR; Gruber et al. 2018) as a genlight object (sensu adegenet, ver. 2.1.10, see https://cran.r-project.org/package=adegenet; Jombart 2008) for subsequent processing with dartR. As detailed elsewhere (Unmack et al. 2023), preliminary analyses to identify individuals that had either excessive missing data (likely owing to poor quality DNA) or excessively high heterozygosity (likely reflecting some tissue or DNA cross-contamination) resulted in the removal of four individuals from eastern coast basins (high heterozygosity counts). We then generated the ‘primary’ dataset (32,010 SNPs for n = 239 fish) by filtering for reproducibility ≥0.99 and removing any monomorphic loci (this latter filter being applied at every level of data reduction). This ‘primary’ dataset was then further filtered to create two initial working datasets, namely (a) the ‘PCA’ dataset (4057 SNPs and 3.71% missing data after filtering for a per-locus missing data threshold ≥0.9 and removing secondaries using the ‘best’ option) for the analyses most sensitive to the presence of missing data and linked loci (PCA and fixed difference calculations), and (b) the ‘Phylo’ dataset (204 individuals, 14,209 SNPs and 12.42% missing data after filtering by locus ≥0.7 and removing individuals that were considered highly introgressed) for the tree-based analyses. We also repeated each relevant filtering step with the same thresholds for any subset of individuals derived from the working ‘PCA’ and ‘Phylo’ datasets.
Detecting admixture
Given that the inclusion of even a few admixed individuals can distort phylogenetic trees and confound assessments of diagnosability (Unmack et al. 2022, 2023), we followed our standard analytical framework to distinguish primary lineages from admixed individuals and sites. As detailed in Unmack et al. (2022), primary lineages can be distinguished from ‘hybrid’ individuals, sites or subpopulations by differences in their genetic profiles when subjected to the combined application of stepwise ordination by PCA, observed heterozygosity counts for both groups and individuals (using the primary SNP dataset), phylogenetic trees, and assessments of diagnosability based on pairwise fixed differences (FDs). Support for the presence of any putative sites or zone of admixture was then further assessed by comparing their geographic location with those of their putative parent lineages.
We also used STRUCTURE (ver. 2.3.4, see https://web.stanford.edu/group/pritchardlab/structure.html; Pritchard et al. 2000) to offer an independent perspective on lineage diagnosability and the extent and nature of admixture among all relevant lineages. On the basis of stepwise PCA and the phylogenetic trees, two subsets of the ‘PCA’ dataset were assembled, the first for all individuals referable to A. agassizii and the second for all other primary lineages plus the ‘CEQ’ phylogroup of A. agassizii (implicated by PCA as a source lineage for some northern admixed sites) plus all putatively admixed fish. Each of these subsets was further filtered using a per-locus missing data threshold of ≥0.98, read depth range of 8–50, and global per-locus minor allele frequencies of <0.015 (gl.filter.maf(gl,threshold = 0.015)), and then converted to a STRUCTURE input file in dartR. STRUCTURE was run using the following parameters: 5 replicates each for K = 1–7, admixture model, correlated allele frequencies, burn-in = 50,000, and iterations = 200,000. We then used KFinder (ver. 1, see https://www.zsl.org/about-zsl/resources/software/kfinder; Wang 2019) to provide estimates of the optimum K by using both the ΔK method (Evanno et al. 2005) and Wang’s parsimony method. Barplots for various values of K were created using CLUMPP (ver. 1.1.2, see https://rosenberglab.stanford.edu/clumpp.html; Jakobsson and Rosenberg 2007).
Ordination of SNPs
Ordination was achieved using PCA, with individuals as entities and loci as attributes as implemented by the gl.pcoa and gl.pcoa.plot functions of dartR. Follow-up PCAs were performed on various major groups and subgroups on reduced and re-filtered datasets by using the same protocols.
Phylogenetic trees
Genomic sequences were constructed by concatenating only the variable bases from each SNP locus into a single partition for each individual. Loci for which a SNP was not called were designated as an ‘N’ to maintain sequence alignment. Phylogenetic analyses were conducted by maximum likelihood (ML) using IQ-TREE (ver. 1.6.12, see http://www.iqtree.org/; Minh et al. 2020) run on the CIPRES server (Miller et al. 2010), incorporating IQ-TREE’s model selection procedure (-m TEST; Kalyaanamoorthy et al. 2017), resulting in the selection of the TVM + F + G4 model followed by 10,000 replicates of ultrafast bootstrapping with the SH-like approximate likelihood-ratio test (-aLRT 1000; Hoang et al. 2018).
Fixed difference analyses for SNPs
The diagnosability of primary lineages or phylogroups and any putative admixed populations was assessed on the ‘PCA’ dataset by counting the pairwise number of SNPs displaying fixed or nearly fixed allelic differences (Unmack et al. 2022). This was achieved using the gl.fixed.diff function in dartR (t = 0 for an absolute difference and t = 0.025 or t = 0.05 to allow either 5 or 10% tolerance for shared alleles at a locus). We routinely use nearly fixed differences in recognition of the fact that low levels of hybridisation are very common among sister species of freshwater fishes (Verspoor and Hammart 1991) and to echo the widespread use of partially diagnostic characters in morphological taxonomy (and indeed for Ambassis in particular; Allen and Burgess 1990).
mtDNA genotyping and analyses
We ultimately sequenced 101 individuals from 53 sites for the mitochondrial cytb gene following the polymerase chain reaction (PCR) protocols in Hammer et al. (2014), except for the following primer details. Most samples were amplified for the entire gene by using the primers Glu31 TGRCTTGAAAAACCACCGTTGT and AM.Thr.28 CCGTAACTGGATTACAAGACCG or AM.Thr.32 CCTTCGACATTCGGCTTACAAG. When amplification was insufficient, the gene was amplified in two halves by using Glu31 and HD.Hyps GGGTTGTTGGAGCCSGTTTCGT and PP.505 TCAGTAGACAACGCCACCCT and AM.Thr.28 or AM.Thr.32. Sequences were edited using Chromas (ver. 2.6.5, Technelysium, Tewantin, Qld, Australia, see https://technelysium.com.au/wp/chromas/) and imported into BioEdit (ver. 7.2.5, see https://bioedit.software.informer.com/; Hall 1999). Sequences were aligned by eye and checked by amino acid coding in MEGA (ver. 11.0.13, see https://www.megasoftware.net) to test for unexpected frame shift errors or stop codons. Data were analysed phylogenetically by using IQ-TREE (ver. 1.6.12) as per the SNP analysis, by using the model HKY + F + G4.
Results
Lineage, taxon and phylogroup nomenclature
Individuals, groups and lineages are designated throughout by a unique symbol matching their final operational taxonomic unit (OTU) membership, matched with an informal nomenclature, whereby each primary lineage or phylogroup is designated a three-letter code and putative admixed groups by a combination of the codes for their putative parents. Thus, for A. agassizii we delineate four primary phylogroups: central-eastern Queensland encompassing the type locality (CEQ), southern Queensland ‘northern phylogroup’ (SQN), southern Queensland ’southern phylogroup’ (SQS), and Murray–Darling Basin (MDB), plus one admixed site, SQN × SQS. The remaining primary lineages (all genetically distinct from A. agassizii) were Bulloo and Burdekin basins (BUL), northern coastal Queensland (NCQ), and Cape York and Cooper Creek (ASP), with each found to be involved in admixture events involving one or more of the abovementioned OTUs.
Allozyme dataset
We were able to assign allozyme profiles at 57 putative loci for the 146 fish screened. Allozyme profiles for all key OTUs and admixed groups are presented in Supplementary Table S1. An initial PCA (Fig. 3a) showed a complicated pattern of genetic affinities among the sites sampled, with much but not all reflecting the geographic arrangement of sites (Fig. 2, Table 2). Sites south, west and south-west of Site 37 fell into one of three broad but discrete clusters, namely a widespread A. agassizii cluster, a cluster of three inland sites (25, 30 and 94) spanning ~900 km from the western edge of Burdekin Basin into the Bulloo Basin (lineage BUL), and a cluster that included widely dispersed sites from west and north of the Bulloo (lineage ASP) plus a number of coastal sites from the Ross Basin northward (Sites 3–8, and 19, lineage NCQ). There was also qualitative evidence of admixture between the BUL and ASP–NCQ clusters, with six individuals placed as intermediate between these two clusters. Three additional individuals from Site 35, ultimately shown by their SNP profiles to be admixed, were placed in the position consistent with their final taxon allocation (NCQ(CEQ)).
Scatterplots of PCA scores in the first two dimensions for the allozyme dataset (relative contribution of each dimension in parentheses). (a) Initial PCA on all 146 individuals. (b) Follow-up PCA on the 99 individuals referable to A. agassizii. (c) Follow-up PCA on the 33 individuals belonging to either NCQ or ASP. Symbols and taxon labels are as given in Fig. 1.
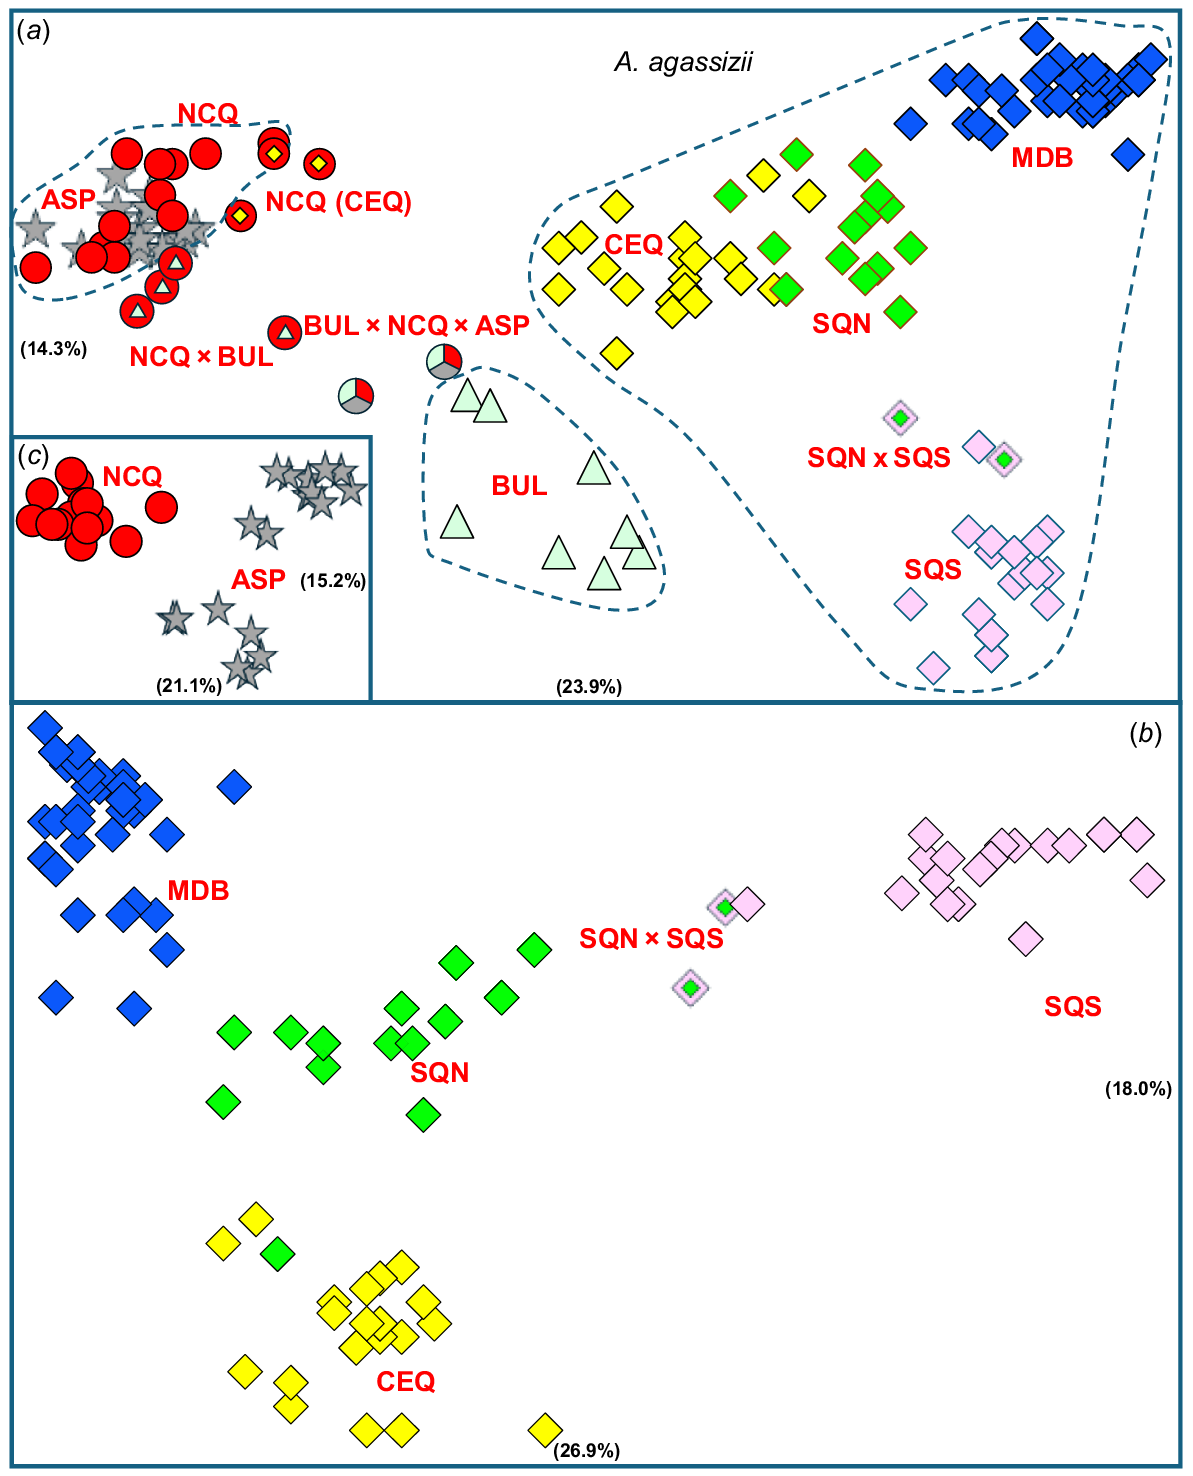
Given that all but five of the allozyme sites were also included in the SNP dataset (Table 2), we conducted only two additional explorations of genetic structure in deeper PCA dimensions. Surprisingly, even though a follow-up PCA restricted to the A. agassizii cluster (Fig. 3b) largely supported the presence of four geographically based phylogroups (CEQ, SQN, SQS and MDB) plus limited admixture between phylogroups SQN and SQS (at Site 70), it also inferred that the primary phylogeographic dichotomy in this species involves phylogroup SQS (occupying just ~10% of its geographic range) v. CEQ–SQN–MDB combined. This primary dichotomy is also diagnosable by two fixed differences (Table S2). The other follow-up PCA on the ASP–NCQ cluster (Fig. 3c) found modest support for distinguishing these two lineages (which are also diagnosable by 1 FD; Table S2) and further inferred a phylogeographic split in ASP between the three most-northerly sites (95–97) v. those from Site 101 south.
Ordination of SNP dataset
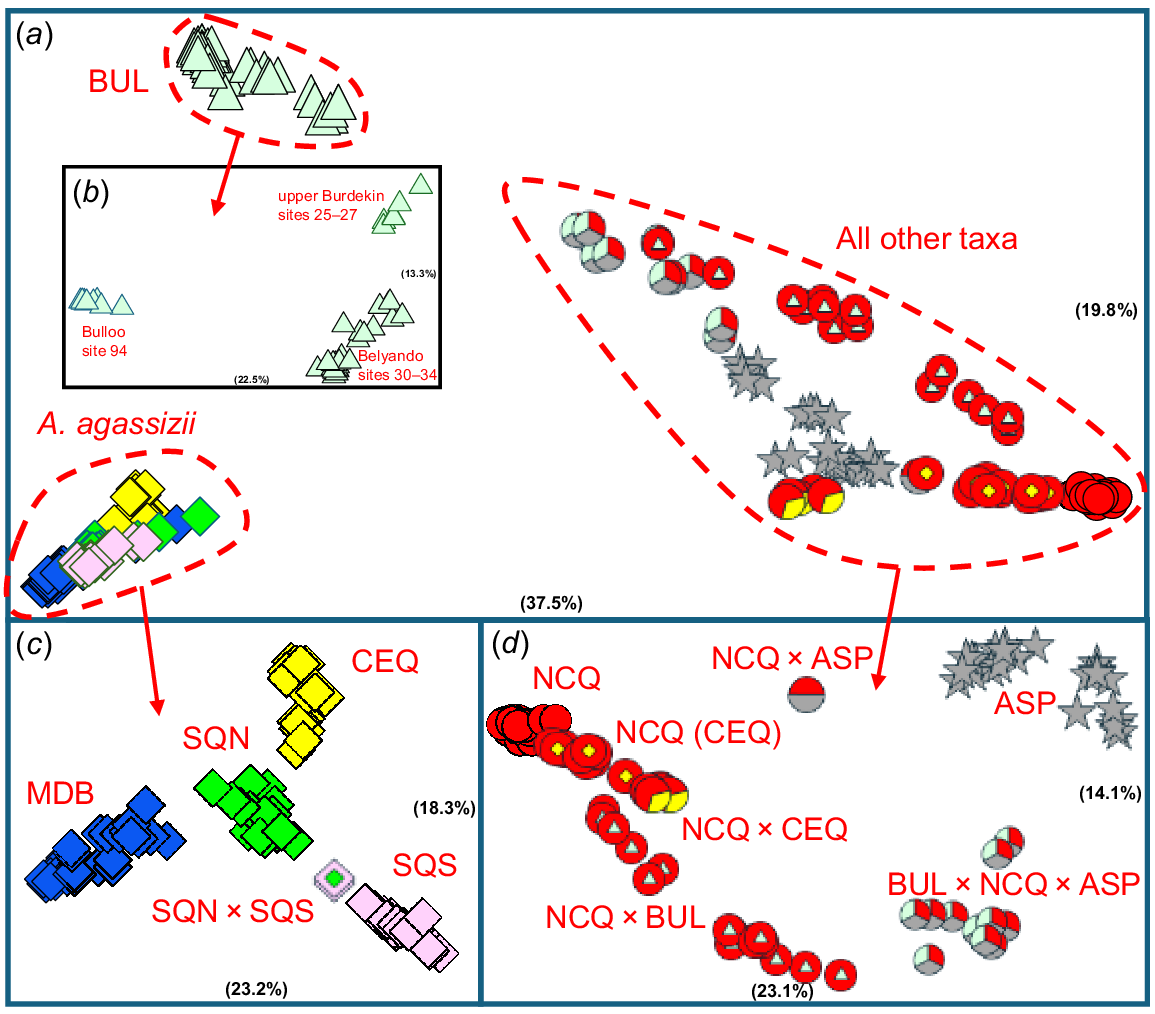
While numerous targeted PCAs were ultimately undertaken to identify the putative parental lineages for all admixed OTUs, their main outcomes can be summarised by the four presented herein (Fig. 4a–d). The initial PCA of all 239 fish (Fig. 4a) unequivocally found the same three primary clusters inferred for the allozyme dataset, i.e. A. agassizii, the inland taxon BUL, and a ‘composite’ cluster of all other sites to the west or north. Within taxon BUL, a primary phylogeographic break was evident between the Bulloo and Burdekin sites in the first dimension (Fig. 4b), with additional structure detected within the Burdekin (Belyando v. upper Burdekin).
Scatterplots of PCA scores in the first two dimensions for the SNP dataset (relative contribution of each dimension in parentheses). (a) Initial PCA on all 239 individuals. (b) Follow-up PCA on taxon BUL (43 fish, 1760 SNPs, 1.92% missing data). (c) Follow-up PCA on A. agassizii (98 fish, 1544 SNPs, 4.3% missing data). (d) Follow-up PCA after removing A. agassizii and BUL (98 fish, 3335 SNPs, 4.2% missing data). Symbols and taxon labels are as given in Fig. 1.
Stepwise PCA on the A. agassizii cluster (Fig. 3c) again supported the allozyme results, namely four distinct phylogroups (CEQ, MDB, SQN and SQS) plus a single admixed SQN × SQS site, but was less emphatic about a primary split between SQS and the other three phylogroups. Interestingly, while most river catchments contained a single phylogroup (Table 2), the Burnett harboured three (all except SQS), including a geographic-outlier population of CEQ (Site 52).
Last, a follow-up PCA on the composite cluster (Fig. 4d) confirmed the taxa ASP and NCQ as the two most distinctive groups in the first dimension and displayed a diverse assortment of other geographically intermediate clusters in both dimensions. The putative parental affiliations of all these likely admixed OTUs were initially assigned by comparing their scatterplot positions in both the initial and follow-up PCAs with the PCA-placement of their parental lineages. Ultimately, we postulated five likely admixed OTUs in this composite cluster, two from a single site (ASP × NCQ and NCQ × CEQ) and three across multiple sites (BUL × NCQ × ASP at four sites, NCQ × BUL from eight sites, and NCQ(CEQ) from two sites).
Distinguishing primary lineages from admixed OTUs
Reflecting both nuclear genetic datasets, ordination resulted in a working hypothesis of seven pure lineages or phylogroups, nested within four candidate taxa, and six putatively admixed OTUs for the Ambassis sites surveyed herein (summarised in Table 3). Several additional lines of evidence support this primary taxonomic scaffold. First, diagnosability assessments among all OTUs show the presence of numerous fixed and nearly fixed differences among all four candidate taxa (e.g. range 77–463 for SNPs allowing 10% tolerance; Table 4), including some involving allozyme loci (Table S2). This contrasts markedly with the comparatively low number of FDs distinguishing the two admixed OTUs with sufficient sample sizes (sites > 3 and N > 10; BUL × NCQ × ASP, NCQ × BUL) to provide reasonably robust FD comparisons with their parental taxa (range 0–28 across all tolerance levels; Table 4). Second, admixed OTUs mostly displayed considerably higher heterozygosity counts than those found for every parental lineage (Tables 3 and S1 for SNPs and allozymes respectively), the one exception being SQN × SQS, which had higher levels of heterozygosity for allozymes but not for SNPs than did lineage SQN. Third, the geographic placement of every admixed OTU is broadly consistent with the presence of a ‘hybrid’ zone between its putative parental lineages (Fig. 2). Fourth, individuals assigned to these admixed OTUs all occupied early branching positions in the preliminary ML tree constructed from the primary SNP dataset (Supplementary Fig. S1). Finally, these same SNP-based diagnosability assessments did offer some additional support for a primary split within A. agassizii between lineage SQS v. the rest (Table 4), as flagged by the allozyme analyses.
| OTU | Candidate taxon | Sites | N | Polymorphic SNPs | SNPs HO ± s.e. | |
|---|---|---|---|---|---|---|
| CEQ | A. agassizii | 12 | 20 | 7496 | 0.0169 ± 0.0129 | |
| MDB | A. agassizii | 20 | 39 | 7673 | 0.0159 ± 0.0089 | |
| SQN | A. agassizii | 9 | 16 | 6912 | 0.0227 ± 0.0191 | |
| SQS | A. agassizii | 11 | 21 | 6566 | 0.0096 ± 0.0102 | |
| ASP | ASP | 13 | 24 | 14,764 | 0.0386 ± 0.0177 | |
| BUL | BUL | 9 | 43 | 12,277 | 0.0225 ± 0.0088 | |
| NCQ | NCQ | 12 | 29 | 10,734 | 0.0306 ± 0.0154 | |
| SQN × SQS | A. agassizii | 1 | 2 | 7906 | 0.0212 ± 0.0992 | |
| ASP × NCQ | Admixed site | 1 | 1 | 13,879 | 0.0655 ± 0.2474 | |
| BUL × NCQ × ASP | Admixture zone | 4 | 11 | 11,583 | 0.0861 ± 0.0524 | |
| NCQ × BUL | Admixture zone | 8 | 16 | 10,769 | 0.0657 ± 0.0351 | |
| NCQ (CEQ) | Admixture zone | 2 | 12 | 12,024 | 0.0557 ± 0.0362 | |
| NCQ × CEQ | Admixed site | 1 | 5 | 10,099 | 0.0681 ± 0.0755 |
| Taxon | A. agassizii | BUL | ASP | NCQ | BUL × NCQ × ASP | NCQ × BUL | |
|---|---|---|---|---|---|---|---|
| A. agassizii | – | 139/219 | 214/265 | 401/450 | 65/78 | 80/109 | |
| BUL | 50 | – | 100/213 | 269/463 | 0/0 | 8/27 | |
| ASP | 105 | 11 | – | 55/77 | 2/6 | 5/18 | |
| NCQ | 259 | 69 | 36 | – | 12/28 | 1/2 | |
| BUL × NCQ × ASP | 39 | 0 | 2 | 7 | – | 0/0 | |
| NCQ × BUL | 51 | 3 | 4 | 1 | 0 | – | |
| (within A. agassizii) | CEQ | MDB | SQN | SQS | CEQ–SQN–MDB | ||
| CEQ | – | 1/7 | 0/0 | 17/25 | |||
| MDB | 0 | – | 0/0 | 13/28 | |||
| SQN | 0 | 0 | – | 7/9 | |||
| SQS | 7 | 5 | 5 | – | 7/11 | ||
| CEQ–SQN–MDB | 2 | – |
Lower matrix, FD counts for number of absolute FDs; upper matrix, FDs with tolerance of 5% for shared alleles or tolerance of 10% for shared alleles.
Exploring further instances of admixture between lineages and phylogroups
The results of the STRUCTURE analyses on A. agassizii are presented in Fig. 5a for K = 4. Given the disparity between the optimum value of K suggested by the ΔK and parsimony methods (3 v. 6), we chose K = 4 to match the number of primary groups shown by ordination. In addition to correctly classifying the two SQN × SQS individuals as an ~50:50 mix of its two parental phylogroups, there was evidence of modest to moderate admixture between all abutting phylogroups. With one exception, the sites involved were geographically close to their nominated ‘donor’ phylogroup (Fig. 2, 5a), with the most prominent examples being CEQ Sites 45–48 (close to and admixed with SQN), SQN Sites 56–58 (adjacent to CEQ, close to MDB, and admixed with both), SQS Sites 64–69 (surrounded by and modestly admixed with SQN), plus MDB Sites 49–51, 53, 54, 81 and 82 (modestly admixed with and close to CEQ or SQN). Even the single exception, MDB Site 84 in the Warrego, was plausibly located much closer to its CEQ admixture parent than to any other phylogroup.
STRUCTURE plots of K = 4 for each of two subsets of the Ambassis SNP dataset. Taxon names, symbols and lineage colours match those used in Fig. 1. Each individual in the STRUCTURE plot is labelled by site number (following Table 2, Fig. 1). (a) Plot for all A. agassizii (98 individuals, 384 SNPs after stringent filtering). (b) Plot for individuals referable to lineages BUL (excluding Site 94 in the Bulloo Basin), CEQ (excluding Site 52), ASP, NCQ and their putative admixed sites (149 fish, 1011 SNPs).
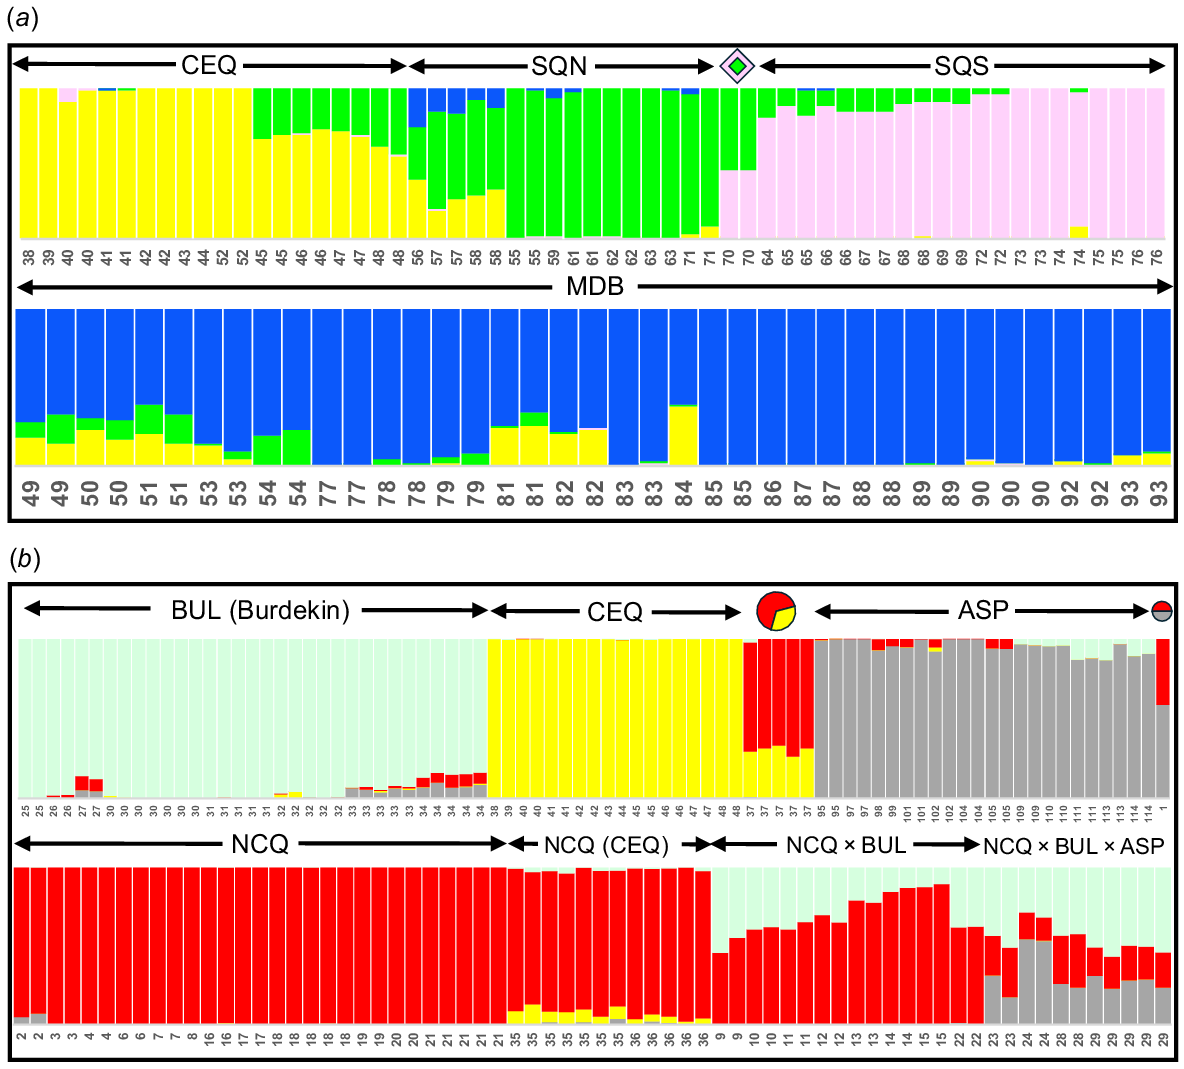
Fig. 5b presents the STRUCTURE plot for K = 4, focusing on the other primary Ambassis lineages plus CEQ. This value of K matches the number of lineages shown by ordination and was also the lower optimum value for the ΔK and parsimony methods (4 v. 5). Note that to better focus on the geographic region where all the targeted taxonomic complexity occurs, we excluded the genetically divergent BUL population from outside the region (Site 94, Fig. 2, 4b). As predicted by other analyses, the five admixed OTUs NCQ × CEQ, NCQ × ASP, NCQ (CEQ), NCQ × BUL, and NCQ × BUL × ASP were each successfully classified consistent with their expected parental lineages. Of the four primary candidate taxa, all except NCQ showed modest evidence of admixture at some sites with other taxa in the region. Generally, the sites involved (particularly BUL Sites 27, 33 and 34 plus ASP Sites 111 and 114) were either geographically proximate or located in adjacent river catchments, thus further reinforcing the notion that the Ambassis species of eastern Australia are likely to have semi-permeable species boundaries.
Phylogenetic affinities of primary lineages and phylogroups
The removal of individuals initially classified as belonging to admixed OTUs followed by refiltering produced a final ‘phylo’ dataset of 204 individuals and 14,209 SNPs. ML recovered one tree with a –ln score of −263471.385 (Fig. 6; full tree for all 239 individuals in Fig. S1). Support across most of the deeper nodes of the tree was strong, with A. agassizii being the sister group to BUL and NCQ being the sister group to ASP, with these two pairs being deeper sister groups. As would be expected from their broad distribution, A. agassizii displayed deep phylogeographic structure. However, none of its four PCA phylogroups was resolved as a monophyletic lineage, a result that is consistent with the high degree of among-phylogroup admixture observed in the STRUCTURE analysis (23 of 53 sites displayed >15% admixture involving two or more phylogroups; Fig. 5a). Phylogenetic relationships within A. agassizii appeared particularly confounded by the presence of admixed populations primarily centred on the Burnett Basin and the rivers immediately north (Site 48) and south (Site 58). As such high levels of reticulate evolution are known to effectively render such datasets unsuitable for producing bifurcating trees (Morrison 2016; Unmack et al. 2023), we generated a second ML tree for the 55 individual A. agassizii (from 30 sites) that were classified by STRUCTURE as ‘pure’ for one of the four phylogroups. However, even this restricted tree (Fig. 6b) supported monophyly for only two of the four ‘phylogroups’ (MDB and SQS).
Phylogenetic trees for the SNP dataset. Individuals are labelled by site code + River Basin (as per Table 2) + unique fish number. Bootstrap proportions of 100% are indicated by an asterisk for the earlier-branching nodes. (a) Final ML tree, rooted at the midpoint, for 204 Ambassis individuals following removal of the 35 fish identified as obviously admixed (Fig. 4, 5). (b) ML tree for the 55 A. agassizii individuals classified by STRUCTURE as ‘pure’ for one of the four phylogroups (represented by the symbols used in Fig. 2).
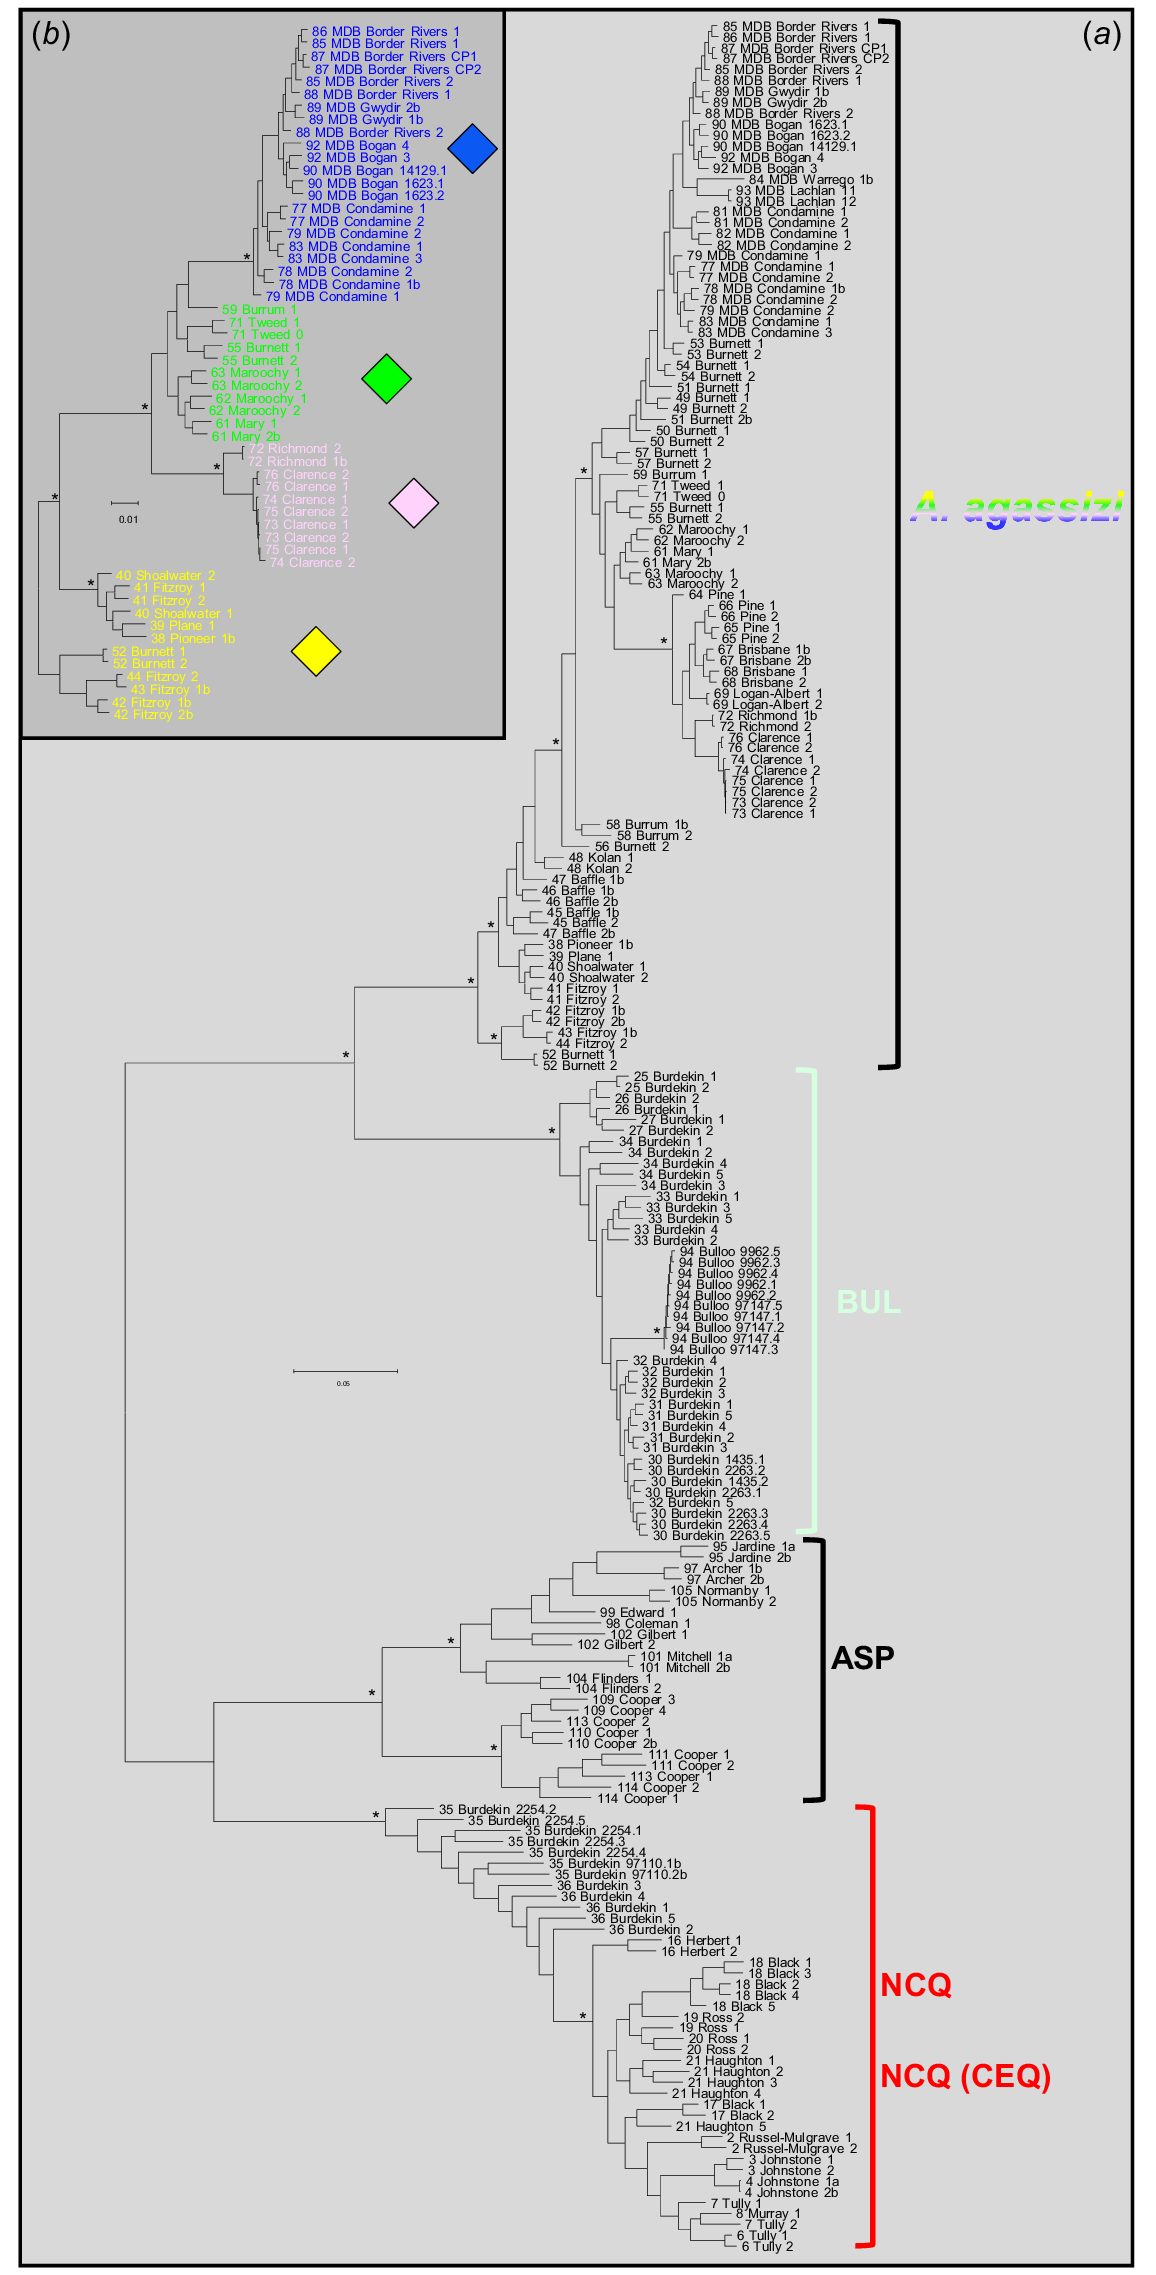
As for A. agassizii, the presence of numerous admixed individuals in the ML tree precludes any detailed assessment of the admittedly shallow phylogeographic structure within both BUL and NCQ. By contrast, taxon ASP displayed a well-supported phylogeographic dichotomy between the Cooper sites and those in more-northerly catchments and a clear geographically aligned pattern of genetic relatedness in the latter phylogroup.
Phylogenetic analysis of mtDNA
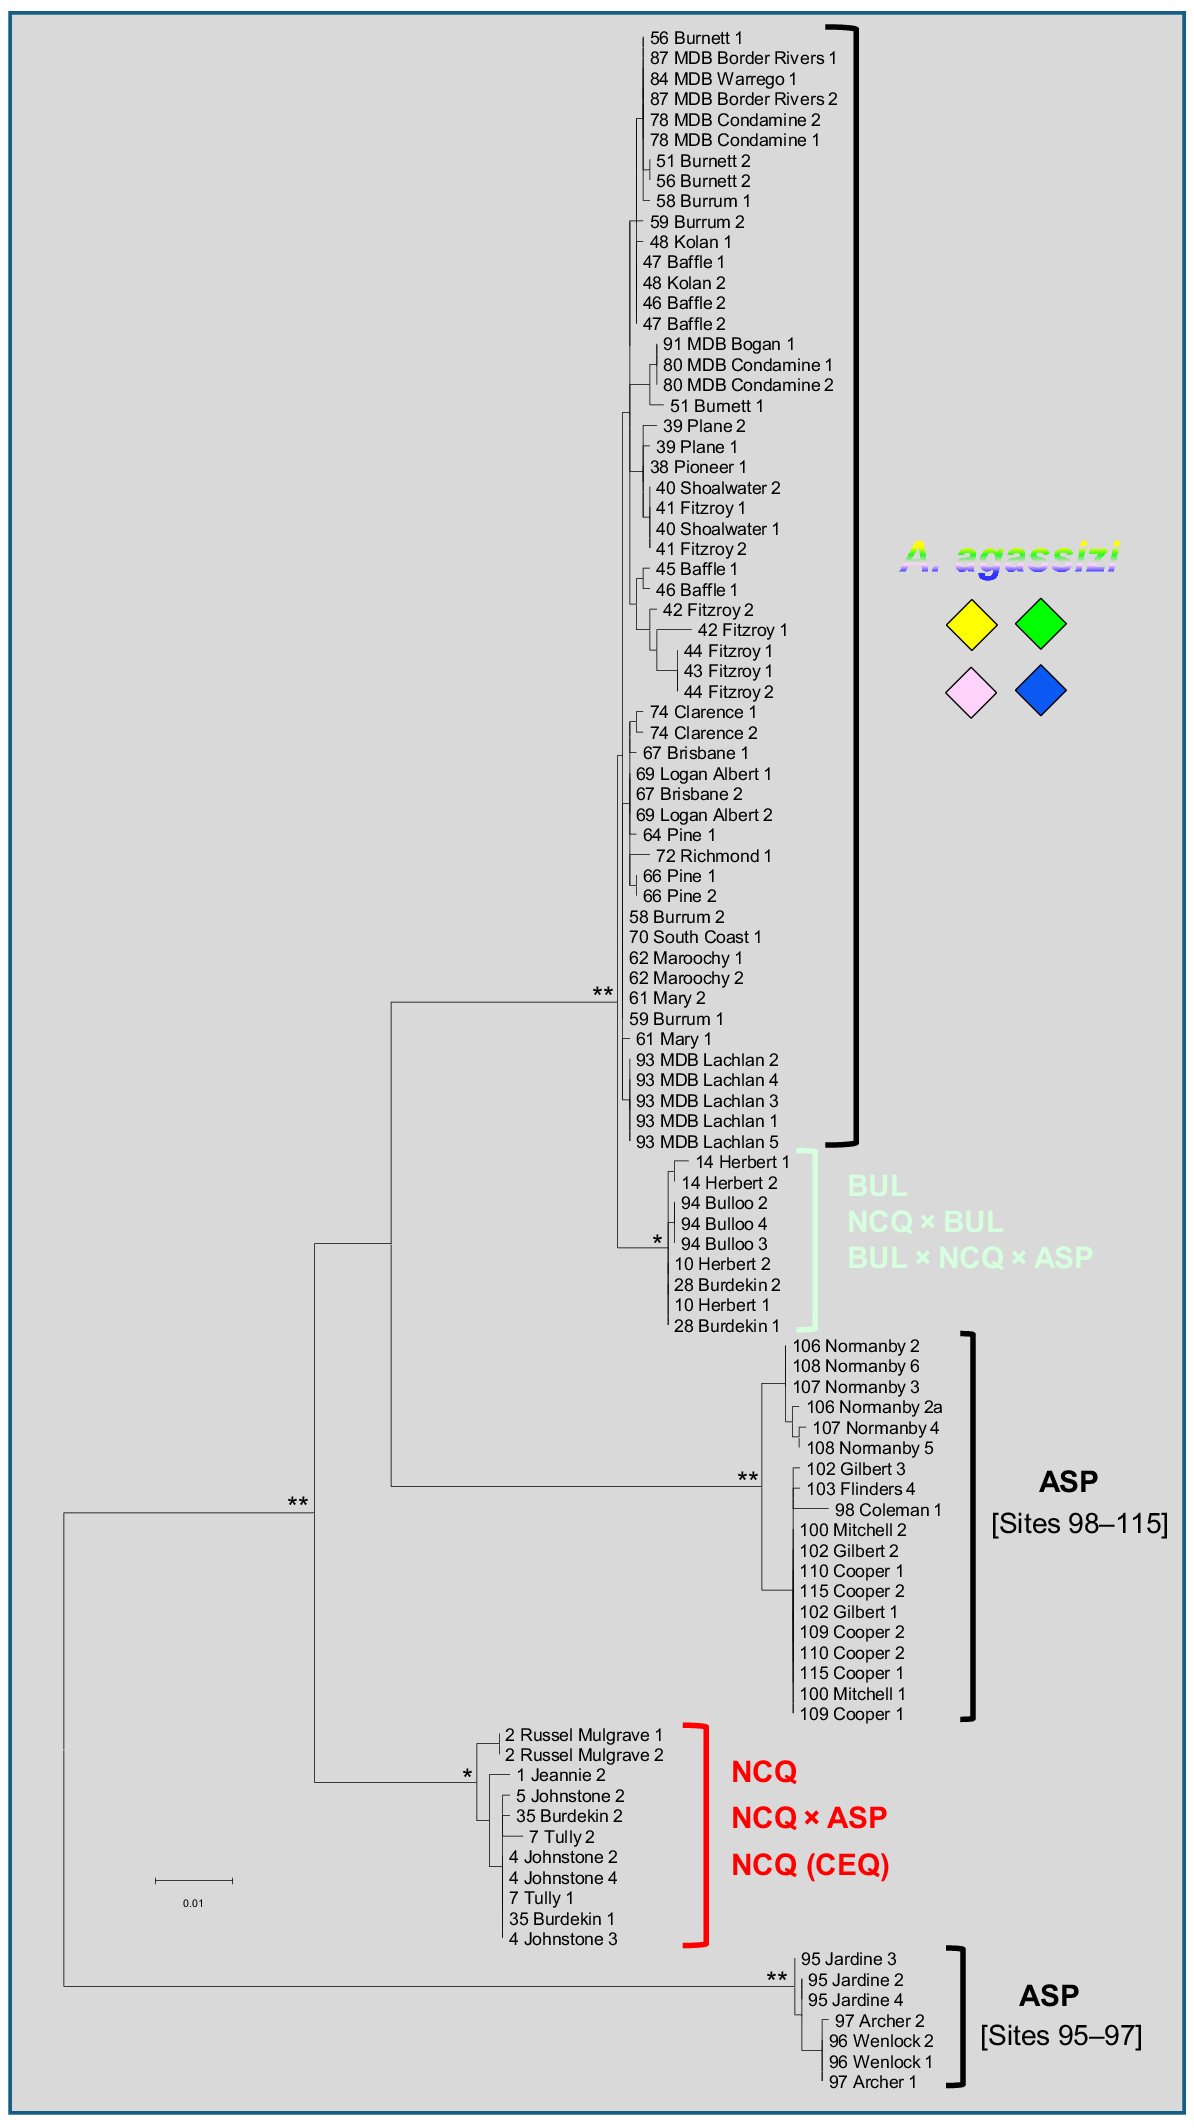
The cytb dataset contained a smaller subset of 101 individuals for 1141 base pairs. ML recovered one tree with a -ln score of −3119.278 (Fig. 7). The cytb dataset presented quite a different topology from and lower support at deeper nodes than the SNP and allozyme perspectives. The first branching lineage consisted of a subset of ASP from populations on the northern portion of Cape York (Sites 95–97 from the Archer River north). The next sequential branching lineage was NCQ, followed by a second distinctive ASP lineage, representing all other sites sampled. The remaining two taxa, A. agassizii and BUL, were sisters, although only separated by very short branch lengths. Apart from the presence of two distinctive paraphyletic mtDNA lineages with ASP, representing a major north–south phylogeographic dichotomy based between Sites 97 and 98, there was minimal clear genetic structure present within any other taxon.
Maximum likelihood tree for the 101 cytb sequences of eastern Australian Ambassis. The tree was rooted using A. elongata as an outgroup (GenBank sequences KF414820.1 and KF414813.1). Individuals are labelled as in Fig. 6. Bootstrap proportions are indicated for the earlier-branching nodes by asterisks (**100%, *98–99%).
Discussion
Despite the recent taxonomic revision by Allen and Burgess (1990), considerable confusion remains in the literature and among museum vouchers as to the distribution and distinctiveness of most of the common and widespread freshwater Ambassis species in eastern and northern Australia (Allen et al. 2002; Pusey et al. 2004; Fig. 1). Here, we present the first of two molecular studies that together provide a comprehensive molecular genetic assessment of species boundaries in Australia’s glassfishes. Acknowledging the taxonomic complexity and multiple instances of introgression evident in our expanded datasets, we have restricted the first study to the freshwater taxa most often confounded in eastern Australia, with a special focus on A. agassizii, the only species of conservation concern in parts of its range (Lintermans 2007). We reiterate that this first study excludes A. macleayi and A. elongata, both of which represent morphologically unambiguous and genetically distinctive lineages (P. J. Unmack, M. Adams and M. P. Hammer, unpubl. data).
Candidate species
Both nuclear datasets were broadly concordant in delineating four primary Ambassis taxa across the 115 sites sampled in eastern Australia. The great majority of sites (n = 99; Table 1) appeared to harbour only non-introgressed populations of one of these four taxa, each genetically diagnosable from its congeners by numerous absolute fixed differences for SNPs (range = 37–265; Table 4) plus supported by fixed allozyme differences (Table S2). Such levels of diagnosability compare favourably with the total number (~10) of morphological characters available for the taxonomic revision of Allen and Burgess (1990), particularly given that few of these characters were shown to be unequivocally diagnostic for members of the A. ‘agrammus’ complex. Non-introgressed populations of each taxon occupied allopatric distributions (Fig. 8), with geographic ranges varying from widespread and broad (A. agassizii and ASP), to widespread and narrow (BUL), to restricted (NCQ). However, disrupting this simple taxonomic framework was our finding of obvious among-taxon admixture involving various combinations of either two or three taxa at 15 sites, all occupying geographically intermediate positions between their primary parental taxa. Three putative hybrid zones were evident, one between A. agassizii and NCQ, a second between BUL and NCQ, and a third involving BUL, NCQ and ASP. In addition, a single F1 hybrid between NCQ and ASP was detected at a site broadly consistent with being in an overlap zone between these two taxa.
Map depicting the distribution by river catchment of non-introgressed populations for each of the four taxa, plus the general location of all hybrid zones. Also shown are the names of the river basins (black text) and individual rivers (grey or white text) referred to in the Discussion.
Prior to the ready availability of genomic data, it was widely believed that hybridisation and introgression were rare phenomena in most animal groups (Dowling and Secor 1997; Taylor and Larson 2019), although even then fish were regarded as one of the vertebrate groups most likely to display between-species hybridisation (Verspoor and Hammart 1991; Scribner et al. 2000). However, it now well established that reticulate evolution is pervasive in most animal groups to the point where many have argued that species boundaries ought to be considered semi-permeable and that speciation can occur even in the presence of ongoing gene flow (Edwards et al. 2016; Harrison and Larson 2016; Mallet et al. 2016; Campbell et al. 2018; Taylor and Larson 2019; Bangs et al. 2020; Walker et al. 2024), particularly when habitats have undergone rapid alteration as a result of anthropogenic modification or climate change (Scribner et al. 2000; Banerjee et al. 2023; Brauer et al. 2023; Zbinden et al. 2023).
Acceptance of these realities does of course not remove the key dilemma confronting those attempting to construct taxonomic frameworks for a group of related organisms. Put simply, how do we distinguish gene flow between distinctive phylogroups within a single species from between-species hybridisation accompanied by levels of introgression that remain under the threshold required to maintain species boundaries? Clearly, both alternate scenarios are potentially in play for the Ambassis taxa studied herein and neither can be unequivocally chosen without more detailed biological investigations assessing the morphological and genomic integrity of both primary parental lineages and admixed individuals in and around these hybrid zones. Numerous studies of hybrid zones have demonstrated that, outside of and even within their zone(s) of hybridisation, parental species can maintain their morphological and genomic integrity, provided ‘differential’ introgression occurs, i.e. some key regions of the genome remain immune from reticulate evolution (Harrison and Larson 2016). The persistence of such ‘islands of genomic divergence’, despite the occurrence of widespread introgression involving other genomic regions, has been observed in fish (e.g. Souissi et al. 2018; Sotola et al. 2019; Du et al. 2024) as well as in many other animal and plant groups (e.g. Harrison and Larson 2014; Walsh et al. 2016; Yang et al. 2020; Hagberg et al. 2022; Bruni et al. 2023).
Although we hesitate to conclude herein that all four Ambassis taxa are definitely valid candidate species, several observations based on the available molecular data do support their recognition as likely candidates. In addition to being readily diagnosable at numerous independent genomic markers, the combined geographic distribution of the four primary taxa vastly overshadows the total area occupied by all observed hybrid zones (>97 v. <3%; Fig. 8). Second, two of the four taxa are directly (A. agassizii and A. agrammus = ASP) referable to an existing described species, although the perceived ranges of the following two warrant a reappraisal of their morphological distinctiveness on the basis of the updated geographic ranges presented here (BUL may or may not represent Ambassis sp. NW, and there would be no available name for NEQ). Third, all four taxa were characterised by distinct matrilineal clades (two paraphyletic clades for ASP and one per taxon for the others). Moreover, all admixed sites displayed only the single cytb clade expected for the dominant parental ancestor, suggesting that hybridisation is non-random with respect to maternal ancestry, as is often found for species that only partially introgress (Toews and Brelsford 2012). Under these perspectives, we suggest that the hypothesis of four candidate species is a sensible starting point for all future phylogenetic and morphological assessments.
Patterns of introgression
Most of the introgression found occurred in the Burdekin Basin and adjacent basins to the north and south (see Fig. 8 for all references to catchment and river names). This region represents the intersection among three candidate taxa, which are likely to have a complex history of exchanges. The Herbert Basin was dominated by NCQ, but with differing admixture levels of BUL present at all sites except Stone River (Site 16), a lowland tributary (Fig. 3, 4, 6). Three patterns of introgression are present in the Burdekin Basin (Fig. 3, 4, 6). Meadowbank Station (Site 16) is immediately adjacent to Herbert Basin and had a similar genetic signature of admixture between NCQ and BUL. Sites in or close to the mainstem Burdekin River above Burdekin Falls were primarily admixed between BUL and ASP, but with some NCQ influence as well. Upper Burdekin River tributary sites and those near to Dalrymple Dam (Site 34, where the Burdekin and Belyando rivers meet) were primarily BUL, but with low levels of introgression from ASP and NCQ. Locations in the Belyando River (Sites 30, 31) were ‘pure’ BUL. The two populations from the lower Burdekin Basin below Burdekin Falls were primarily NCQ, with some influence from CEQ. This influence extended south of the Burdekin Basin, at least to the Don Basin (Site 37). Given the large gap in our sampling between the Don and Pioneer basins, it is unclear how far south this introgression extends. No introgression was evident immediately north of the Burdekin Basin in the Haughton Basin (Site 21).
Our sampling on the northern range limits of NCQ was extremely limited, but the one fish genotyped from Jeannie catchment (Site 1) appeared to be an F1 hybrid between NCQ and ASP (Fig. 4, 6). Further sampling is necessary to better understand what the patterns might occur in that region.
One perplexing finding was an outlier population of SQN geographically nested within the distribution of SQS (Fig. 3, 4, 6). Tweed River (Site 71) was ‘pure’ SQN, whereas the next population sampled to the north, the Nerang River (Site 70) was well admixed between SQN and SQS (Fig. 6). Further sampling is required to determine the extent of SQN in this region and what the broader patterns of introgression are. It is unclear whether this is a natural pattern or the result of translocations. Unfortunately, we lack mtDNA data for Site 71, but the one fish genotyped from Site 70 was identical to one of the SQN haplotypes (Fig. 7).
It cannot be determined here whether the regions with introgression are stable or changing over longer time frames. Glacial-scale climatic changes result in different degrees of aridity for inland populations, or higher potential connectivity for coastal populations during periods of lowered sea levels (Unmack 2001), which allow populations to mix to a greater extent than today. Although it is clear that these zones of introgression are limited to the close proximity of adjacent taxa or lineages, our data cannot determine what drives the lack of gene flow beyond these narrow contact zones. One possibility is that there are a sufficient number of adaptive genetic differences among these taxa to provide definite selective advantages for each taxon in its own unique climatic region, similar to those proposed for rainbowfishes (Attard et al. 2022; Gates et al. 2023). It is important to note that qualitatively none of the introgressed populations appears to be less abundant than their non-introgressed counterparts.
Biogeography
The Ambassis populations in this study present an eclectic mix of biogeographic patterns, some of which are difficult to explain and are often idiosyncratic relative to other species in the same region.
The most unusual biogeographic pattern is the disjunct population of BUL in the Bulloo Basin. The easiest way for fish to be exchanged between Bulloo and Burdekin basins is via Cooper Creek. Several fish species as well as eastern short-necked turtle (Emydura macquarii) have a close relationship indicative of recent exchanges between Cooper Creek and Burdekin Basin (Unmack 2013; Georges et al. 2018). However, Cooper Creek has a different Ambassis lineage present (taxon ASP), which has presumably replaced BUL within that system, with no evidence of introgression. Given the generally low divergence between BUL populations in the Bulloo and Burdekin basins (e.g. 1 base pair of 1141 for cytb), this replacement is likely to be recent (perhaps in the past few hundred thousand years). Disjunct populations such as this in widespread genera are uncommon in Australian freshwater fishes (and other aquatic organisms). One species, the softspine catfish (Neosilurus mollespiculum), likely shows the same biogeographic pattern. Although its primary distribution is the Burdekin Basin, specimens of this catfish, or one closely related to it, were also recorded from Bulloo River (I.27071-001, Australian Museum Sydney), but have never been found in Cooper Creek.
Most evidence for disjunct patterns at the river basin scale come from genetic studies. It is also important to note that in some cases species may show only a disjunct pattern with their mitochondrial DNA, but not their nuclear DNA. Examples in other groups include patterns based on mtDNA for three Craterocephalus lineages (Unmack and Dowling 2010) within the ‘Disjunct’ group, Lentigenosus clade from north-western Australia, with a sister relationship to Dalhousie clade from central Australia and the ‘Atherton’ clade present in north-eastern Queensland. In addition, there are disjunct populations of Craterocephalus fulvus and Melanotaenia duboulayi in the Fitzroy Basin in eastern Queensland. In rainbowfishes the mitochondrial lineage within M. splendida separates monophyletic western and eastern rainbowfish species such as M. australis and M. eachamensis, resulting in a major disjunction between drainages to the west of Darwin and eastern Australia (McGuigan et al. 2000; Unmack et al. 2013).
Although speculative, we suggest that BUL may have some advantage over the other Ambassis taxa in the more arid parts of the Burdekin Basin above Burdekin Falls, given its broad persistence there, especially in the southern Belyando River, which has no evidence of introgression despite a lack of any clear physical barriers to gene flow. BUL has experienced introgression with NCQ and ASP in parts of the Burdekin River. There is evidence for exchanges between the upper Burdekin and Herbert rivers, given that BUL has introgressed into Herbert Basin populations of NCQ and NCQ has introgressed into BUL in the Burdekin Basin (Fig. 2), with at least one exchange being quite recent. For instance, Wyoming Creek (Site 22) in the upper Burdekin River has clear stronger affinities with other Herbert Basin populations (Fig. 2, 5). This is adjacent to an area with a very low drainage divide, which could allow exchanges between basins during overland flow events. No doubt exchanges are likely to have occurred between these two basins over a considerable period of time, given the general geological stability of the region and a flat topography in some parts of the drainage divide. Also likely recent is an invasion by ASP from western drainages into the mid-Burdekin River, which has spread downstream, being typically found in the main Burdekin channel and the lower reaches of some tributaries (Fig. 2). We have previously found evidence of such an exchange in purple spotted gudgeons (Mogurnda spp.) from either the Flinders or Einsleigh River into Gregory River, a mid-tributary of the Burdekin River (S. Amini, P. J. Unmack and M. Adams, unpubl. data). It is unclear where this exchange is likely to have occurred, although there are numerous swamps and small lakes very close to the drainage divide in this region (e.g. Barkers Swamp, Agnes Lake). It is possible that Ambassis entered the system by the same pathway, a supposition that would need to be confirmed by genotyping Ambassis from Gregory River. Despite these other taxa dispersing into the Burdekin Basin, they have not overwhelmed BUL genotypes, unlike the hypothesised situation in Cooper Creek with ASP replacing BUL. However, it is also possible that ASP have only recently invaded the Burdekin Basin and may replace BUL over time.
There is a lack of any clear physical explanations for the broad geographic boundary between the deep phylogenetic separation of A. agassizii and NCQ, which occurs from the lower Burdekin River (below Burdekin Falls, Sites 35 and 36) south to at least the Don River (Site 37, Fig. 2). Molecular data for two other freshwater fishes show a phylogeographic boundary in the same general region, namely purple spotted gudgeon (Mogurnda spp., nuclear DNA, Adams et al. 2013; S. Amini, P. J. Unmack and M. Adams, unpubl. data) and Pacific blue-eye (Pseudomugil signifer) for mtDNA (Wong et al. 2004). Clearly, some gene flow is ongoing at the boundary, but it cannot be determined whether A. agassizii is expanding north, NCQ is expanding south, or the boundary is stable. Gene flow at the boundary of NCQ and admixed populations may be quite recent, given that introgression is widespread in the lower Burdekin but absent from the Haughton River (site 21) immediately north, which is only minimally separated from the Burdekin, especially during recent lowered sea levels. The northern range limits of NCQ are unclear owing to a lack of samples north of the Russell–Mulgrave Basin (Site 2), with the introgressed population from Muck River (Site 1) being based on a single sample involving a distance of ~330 km separating these two locations. This population occurs immediately east of Normanby Basin, which contains non-introgressed ASP (Fig. 2).
Populations of A. agassizii separated into the following four phylogroups: SQS from the Clarence River (Site 76) north to the Caboolture River (Site 64), SQN from the Mooloolah River (Site 63) north to the lower portion of the Burnett River (Site 55), CEQ from the Kolan River north (Site 48) and MDB from the Murray–Darling Basin and upper portion of the Burnett River. A central melting pot for three of these groups is the Burnett River. Biotic exchanges between the Burnett and the Murray–Darling Basin (Condamine River specifically) are common and include a number of fishes such as carp gudgeons (genus Hypseleotris, Thacker et al. 2007; Unmack et al. 2023), purple spotted gudgeons (genus Mogurnda, Sasaki et al. 2016), flathead gudgeons (genus Philypnodon, Thacker et al. 2008; Hammer et al. 2019b), and hardyheads (genus Craterocephalus, Unmack and Dowling 2010). In most cases, exchanges have been recent (probably within the past 200,000 years) between the Burnett and Murray–Darling Basin (on the basis of very small genetic divergences). It has been hypothesised these exchanges have occurred in both directions across shallow drainage divides (Unmack 2013).
An examination based on mitochondrial sequence data for 33 freshwater species in south-eastern Queensland (from the Mary River south, Page and Hughes 2014) found that a number of species displayed deep divergences between the Brisbane and Mary basins. However, there was considerable variation in where exactly the separation occurred relative to the smaller river basins that separate the Brisbane and Mary. Coastal populations of A. agassizii separated between the Caboolture and Mooloolah rivers, which matched one smaller divergence in Page and Hughes (2014), but other than this divergence it showed low levels of geographic structure across their study area. The partial biogeographic break between the Burnett and Kolan basins (rendered incomplete by the finding a single CEQ outlier in the Burnett at Site 52) also appears to be different from other freshwater fish species examined in this region (e.g. Unmack and Dowling 2010; Sasaki et al. 2016; Hammer et al. 2019b; Unmack et al. 2023).
Conclusions
Our comprehensive molecular data of the A. ‘agrammus’ complex in eastern Australia have demonstrated the likely presence of four candidate species, one referable to A. agassizii, one to A. sp (sensuAllen et al. 2002), one that may represent A. agrammus, and one putative sp. nov. Given that both A. sp and A. agrammus as currently described (Allen and Burgess 1990) are widespread outside of eastern Australia, any detailed assessment of the likely taxonomic affinities of candidate species BUL and ASP will be deferred to a future companion study of the other glassfish populations and species of central, northern and western Australia.
All four candidate species appear to readily hybridise in regions where their distributions abut, although the area occupied by these zones of admixture are a tiny proportion of the total range sampled for ‘pure’ exemplars of the four taxa. Intriguing questions such as the age of these hybrid zones, how far the observed admixture bleeds into parental taxa, whether there is assortative mating, etc. will require considerably more detailed geographic sampling for both morphological and genomic markers. Nevertheless, the systematic, biogeographic and phylogeographic framework outlined here for all candidate species will serve as the ideal scaffold for any such future explorations of this intriguing group.
Data availability
The raw SNP, allozyme and aligned cytb data are available from the authors on request. All cytb sequences have also been deposited in GenBank (Accession numbers KF414742–KF414911).
Conflicts of interest
Peter Unmack is an Associate Editor of Marine and Freshwater Research but was not involved in the peer review or decision-making process for this paper. The authors have no further conflicts of interest to declare.
Declaration of funding
This work was funded in part by Sigma Xi Grants-in-Aid of Research, Sigma Xi Arizona State University chapter, Associated Students of Arizona State University GPSA Research Grant, NSW Environmental Trust (Environmental Research Grant 2015/RD/0102 to P. J. Unmack, M. Adams and D. Gilligan) and Sunwater (Queensland) as part of the Burdekin Falls Dam Raising Project. Supporting sources had no such involvement in the preparation of the data or paper or the decision to submit for publication.
Acknowledgements
We thank the many people who assisted with fieldwork, especially M. Baltzly, G. Briggs, C. Brumley, B. Cook, R. Francis, B. Hansen, A. Mather, K. Moy, T. Page, R. Pulverenti, T. Raadik, J. Wager and R. Wager. These individuals provided one or more of the following: field assistance, accommodation, and made their vehicles and homes available. Several also shared expenses. Thanks go to Christina Howley for help sorting out some sample locality data. We also gratefully acknowledge the South Australian Museum for access to their tissue collection.
References
Adams M, Page TJ, Hurwood DA, Hughes JM (2013) A molecular assessment of species boundaries and phylogenetic affinities in Mogurnda (Eleotridae): a case study of cryptic biodiversity in the Australian freshwater fishes. Marine and Freshwater Research 64, 920-931.
| Crossref | Google Scholar |
Adams M, Raadik TA, Burridge CP, Georges A (2014) Global biodiversity assessment and hyper-cryptic species complexes: more than one species of elephant in the room? Systematic Biology 63, 518-533.
| Crossref | Google Scholar |
Adams M, Hammer MP, Unmack PJ, Raadik TA, Jense C, Burridge CP (2023) Multi-gene insights into the taxonomy and conservation of Tasmania’s galaxiid fishes. Marine and Freshwater Research 74, 1113-1128.
| Crossref | Google Scholar |
Allen GR, Burgess WE (1990) A review of the glassfishes (Chandidae) of Australia and New Guinea. Records of the Western Australian Museum Supplement 34, 139-206.
| Google Scholar |
Attard CRM, Sandoval-Castillo J, Brauer CJ, Unmack PJ, Schmarr D, Bernatchez L, Beheregaray LB (2022) Fish out of water: genomic insights into persistence of rainbowfish populations in the desert. Evolution 76, 171-183.
| Crossref | Google Scholar |
Banerjee SM, Powell DL, Moran BM, Ramírez-Duarte WF, Langdon QK, Gunn TR, Vazquez G, Rochman C, Schumer M (2023) Complex hybridization between deeply diverged fish species in a disturbed ecosystem. Evolution 77, 995-1005.
| Crossref | Google Scholar |
Bangs MR, Douglas MR, Brunner PC, Douglas ME (2020) Reticulate evolution as a management challenge: patterns of admixture with phylogenetic distance in endemic fishes of western North America. Evolutionary Applications 13, 1400-1419.
| Crossref | Google Scholar |
Brauer CJ, Sandoval-Castillo J, Gates K, Hammer MP, Unmack PJ, Bernatchez L, Beheregaray LB (2023) Natural hybridization reduces vulnerability to climate change. Nature Climate Change 13, 282-289.
| Crossref | Google Scholar |
Bruni G, Chiocchio A, Nascetti G, Cimmaruta R (2023) Different patterns of introgression in a three species hybrid zone among European cave salamanders. Ecology and Evolution 13, e10437.
| Crossref | Google Scholar |
Buckley SJ, Domingos FMCB, Attard CRM, Brauer CJ, Sandoval-Castillo J, Lodge R, Unmack PJ, Beheregaray LB (2018) Phylogenomic history of enigmatic pygmy perches: implications for biogeography, taxonomy and conservation. Royal Society Open Science 5, 172125.
| Crossref | Google Scholar |
Campbell CR, Poelstra JW, Yoder AD (2018) What is speciation genomics? The roles of ecology, gene flow, and genomic architecture in the formation of species. Biological Journal of the Linnean Society 124, 561-583.
| Crossref | Google Scholar |
Cook BD, Adams M, Unmack PJ, Burrows D, Pusey BJ, Perna C, Hughes JM (2017) Phylogeography of the mouth-brooding freshwater fish Glossamia aprion (Apogonidae) in northern and eastern Australia: historical biogeography and allopatric speciation. Biological Journal of the Linnean Society 121(4), 833-848.
| Crossref | Google Scholar |
Dowling TE, Secor CL (1997) The role of hybridization and introgression in the diversification of animals. Annual Review of Ecology and Systematics 28, 593-619.
| Crossref | Google Scholar |
Du K, Ricci JMB, Lu Y, Garcia-Olazabal M, Walter RB, Warren WC, Dodge TO, Schumer M, Park H, Meyer A, Schartl M (2024) Phylogenomic analyses of all species of swordtail fishes (genus Xiphophorus) show that hybridization preceded speciation. Nature Communications 15, 6609.
| Crossref | Google Scholar |
Edwards SV, Potter S, Schmitt CJ, Bragg JG, Moritz C (2016) Reticulation, divergence, and the phylogeography–phylogenetics continuum. Proceedings of the National Academy of Sciences of the United States of America 113, 8025-8032.
| Crossref | Google Scholar |
Evanno G, Regnaut S, Goudet J (2005) Detecting the number of clusters of individuals using the software structure: a simulation study. Molecular Ecology 14, 2611-2620.
| Crossref | Google Scholar |
Fricke R, Eschmeyer WN, Van der Laan R (Eds) (2024) Eschmeyer’s Catalog of Fishes. Electronic version. (California Academy of Sciences) Available at http://researcharchive.calacademy.org/research/ichthyology/catalog/fishcatmain.asp [Verified 12 October 2024]
Gates K, Sandoval-Castillo J, Brauer CJ, Unmack PJ, Laporte M, Bernatchez L, Beheregaray LB (2023) Environmental selection, rather than neutral processes, best explain regional patterns of diversity in a tropical rainforest fish. Heredity 130, 368-380.
| Crossref | Google Scholar |
Georges A, Gruber B, Pauly GB, White D, Adams M, Young MJ, Kilian A, Zhang X, Shaffer HB, Unmack PJ (2018) Genomewide SNP markers breathe new life into phylogeography and species delimitation for the problematic short-necked turtles (Chelidae: Emydura) of eastern Australia. Molecular Ecology 27, 5195-5213.
| Crossref | Google Scholar |
Gruber B, Unmack PJ, Berry OF, Georges A (2018) dartR: an R package to facilitate analysis of SNP data generated from reduced representation genome sequencing. Molecular Ecology Resources 18, 691-699.
| Crossref | Google Scholar |
Hagberg L, Celemín E, Irisarri I, Hawlitschek O, Bella JL, Mott T, Pereira RJ (2022) Extensive introgression at late stages of species formation: insights from grasshopper hybrid zones. Molecular Ecology 31, 2384-2399.
| Crossref | Google Scholar |
Hall TA (1999) BioEdit: a user-friendly biological sequence alignment editor and analysis program for Windows 95/98/NT. Nucleic Acids Symposium Series 41, 95-98.
| Google Scholar |
Hammer MP, Adams M, Unmack PJ, Walker KF (2007) A rethink on Retropinna: conservation implications of new taxa and significant genetic sub-structure in Australian smelts (Pisces: Retropinnidae). Marine and Freshwater Research 58, 327-341.
| Crossref | Google Scholar |
Hammer MP, Unmack PJ, Adams M, Raadik TA, Johnson JB (2014) A multigene molecular assessment of cryptic biodiversity in the iconic freshwater blackfishes (Teleostei: Percichthyidae: Gadopsis) of south-eastern Australia. Biological Journal of the Linnean Society 111, 521-540.
| Crossref | Google Scholar |
Hammer MP, Allen GR, Martin KC, Adams M, Ebner BC, Raadik TA, Unmack PJ (2018) Revision of the Australian Wet Tropics endemic rainbowfish genus Cairnsichthys (Atheriniformes: Melanotaeniidae), with description of a new species. Zootaxa 4413, 271-294.
| Crossref | Google Scholar |
Hammer MP, Allen GR, Martin KC, Adams M, Unmack PJ (2019a) Two new species of dwarf rainbowfishes (Atheriniformes: Melanotaeniidae) from northern Australia and southern New Guinea. Zootaxa 4701, 201-234.
| Crossref | Google Scholar |
Hammer MP, Adams M, Thacker CE, Johnson JB, Unmack PJ (2019b) Comparison of genetic structure in co-occurring freshwater eleotrids (Actinopterygii: Philypnodon) reveals cryptic species, likely translocation and regional conservation hotspots. Molecular Phylogenetics and Evolution 139, 106556.
| Crossref | Google Scholar |
Hammer MP, Taillebois L, King AJ, Crook DA, Wedd D, Adams M, Unmack PJ, Hoese DF, Bertozzi T (2021a) Unravelling the taxonomy and identification of a problematic group of benthic fishes from tropical rivers (Gobiidae: Glossogobius). Journal of Fish Biology 99, 87-100.
| Crossref | Google Scholar |
Hammer MP, Adams M, Unmack PJ, Hassell KL, Bertozzi T (2021b) Surprising Pseudogobius: molecular systematics of benthic gobies reveals new insights into estuarine biodiversity (Teleostei: Gobiiformes). Molecular Phylogenetics and Evolution 160, 107140.
| Crossref | Google Scholar |
Harrison RG, Larson EL (2014) Hybridization, introgression, and the nature of species boundaries. Journal of Heredity 105, 795-809.
| Crossref | Google Scholar |
Harrison RG, Larson EL (2016) Heterogeneous genome divergence, differential introgression, and the origin and structure of hybrid zones. Molecular Ecology 25, 2454-2466.
| Crossref | Google Scholar |
Hoang DT, Chernomor O, von Haeseler A, Minh BQ, Vinh LS (2018) UFBoot2: improving the ultrafast bootstrap approximation. Molecular Biology and Evolution 35(2), 518-522.
| Crossref | Google Scholar |
Huey JA, Baker AM, Hughes JM (2010) High levels of genetic structure in the Australian freshwater fish, Ambassis macleayi. Journal of the North American Benthological Society 29, 1148-1160.
| Crossref | Google Scholar |
Huey JA, Baker AM, Hughes JM (2011) Evidence for multiple historical colonizations of an endoreic drainage basin by an Australian freshwater fish. Journal of Fish Biology 79, 1047-1067.
| Crossref | Google Scholar |
Jakobsson M, Rosenberg NA (2007) CLUMPP: a cluster matching and permutation program for dealing with label switching and multimodality in analysis of population structure. Bioinformatics 23, 1801-1806.
| Crossref | Google Scholar |
Jense C, Adams M, Raadik TA, Waters JM, Morgan DL, Barmuta LA, Hardie SA, Deagle BE, Burridge CP (2024) Cryptic diversity within two widespread diadromous freshwater fishes. Ecology and Evolution 14, e11201.
| Crossref | Google Scholar |
Jerry DR (2008) Phylogeography of the freshwater catfish Tandanus tandanus (Plotosidae): a model species to understand evolution of the eastern Australian freshwater fish fauna. Marine and Freshwater Research 59, 351-360.
| Crossref | Google Scholar |
Jombart T (2008) adegenet: a R package for the multivariate analysis of genetic markers. Bioinformatics 24, 1403-1405.
| Crossref | Google Scholar |
Kalyaanamoorthy S, Minh BQ, Wong TKF, von Haeseler A, Jermiin LS (2017) ModelFinder: fast model selection for accurate phylogenetic estimates. Nature Methods 14(6), 587-589.
| Crossref | Google Scholar |
Kilian A, Wenzl P, Huttner E, Carling J, Xia L, Blois H, Caig V, Heller-Uszynska K, Jaccoud D, Hopper C, Aschenbrenner-Kilian M, Evers M, Peng K, Cayla C, Hok P, Uszynski G (2012) Diversity Arrays Technology: a generic genome profiling technology on open platforms. In ‘Data production and analysis in population genomics: methods and protocols’. Eds (F Pompanon, A Bonin) pp. 67–89. (Humana Press: Totowa, NJ, USA)
Leis JM, Gomon MF, Larson HK (2007) Australian fish taxonomists – an endangered species. ASFB Bulletin 176, 32-33.
| Google Scholar |
Llewellyn L (2008) Observations on the breeding biology of Ambassis agassizii Steindachner, 1867 (Teleostei: Ambassidae) from the Murray Darling Basin in New South Wales. Australian Zoologist 34, 476-498.
| Crossref | Google Scholar |
Lundberg JG, Kottelat M, Smith GR, Stiassny MLJ, Gill AC (2000) So many fishes, so little time: an overview of recent ichthyological discovery in continental waters. Annals of the Missouri Botanical Garden 87, 26-62.
| Crossref | Google Scholar |
Mallet J, Besansky N, Hahn MW (2016) How reticulated are species? BioEssays 38, 140-149.
| Crossref | Google Scholar |
McGuigan K, Zhu D, Allen GR, Moritz C (2000) Phylogenetic relationships and historical biogeography of melanotaeniid fishes in Australia and New Guinea. Marine and Freshwater Research 51, 713-723.
| Crossref | Google Scholar |
Miller MA, Pfeiffer W, Schwartz T (2010) Creating the CIPRES Science Gateway for inference of large phylogenetic trees. In ‘2010 Gateway Computing Environments Workshop’, 14 November 2010, New Orleans, LA, USA. INSPEC Accession Number 11705685. (GCE) doi:10.1109/GCE.2010.5676129
Mills CE, Hadwen WL, Hughes JM (2008) Looking through glassfish: marine genetic structure in an estuarine species. Marine and Freshwater Research 59, 627-637.
| Crossref | Google Scholar |
Milton DA, Arthington AH (1985) Reproductive strategy and growth of the Australian smelt, Retropinna semoni (Weber) (Pisces: Retropinnidae), and the olive perchlet, Ambassis nigripinnis (De Vis) (Pisces: Ambassidae), in Brisbane, south-eastern Queensland. Marine and Freshwater Research 36, 329-341.
| Crossref | Google Scholar |
Minh BQ, Schmidt HA, Chernomor O, Schrempf D, Woodhams MD, von Haeseler A, Lanfear R (2020) IQ-TREE 2: new models and efficient methods for phylogenetic inference in the genomic era. Molecular Biology and Evolution 37, 1530-1534.
| Crossref | Google Scholar |
Morrison DA (2016) Genealogies: pedigrees and phylogenies are reticulating networks not just divergent trees. Evolutionary Biology 43, 456-473.
| Crossref | Google Scholar |
Page TJ, Hughes JM (2014) Contrasting insights provided by single and multispecies data in a regional comparative phylogeographic study. Biological Journal of the Linnean Society 111, 554-569.
| Crossref | Google Scholar |
Pritchard JK, Stephens M, Donnelly P (2000) Inference of population structure using multilocus genotype data. Genetics 155, 945-959.
| Crossref | Google Scholar |
Pusey BJ, Burrows DW, Kennard MJ, Perna CN, Unmack PJ, Allsop Q, Hammer MP (2017) Freshwater fishes of northern Australia. Zootaxa 4253, 1-104.
| Crossref | Google Scholar |
Sasaki M, Hammer MP, Unmack PJ, Adams M, Beheregaray LB (2016) Population genetics of a widely distributed small freshwater fish with varying conservation concerns: the southern purple-spotted gudgeon, Mogurnda adspersa. Conservation Genetics 17, 875-889.
| Crossref | Google Scholar |
Scribner KT, Page KS, Bartron ML (2000) Hybridization in freshwater fishes: a review of case studies and cytonuclear methods of biological inference. Reviews in Fish Biology and Fisheries 10, 293-323.
| Crossref | Google Scholar |
Shelley JJ, Swearer SE, Adams M, Dempster T, Le Feuvre MC, Hammer MP, Unmack PJ (2018) Cryptic biodiversity in the freshwater fishes of the Kimberley endemism hotspot, northwestern Australia. Molecular Phylogenetics and Evolution 127, 843-858.
| Crossref | Google Scholar |
Sotola VA, Ruppel DS, Bonner TH, Nice CC, Martin NH (2019) Asymmetric introgression between fishes in the Red River basin of Texas is associated with variation in water quality. Ecology and Evolution 9, 2083-2095.
| Crossref | Google Scholar |
Souissi A, Bonhomme F, Manchado M, Bahri-Sfar L, Gagnaire P-A (2018) Genomic and geographic footprints of differential introgression between two divergent fish species (Solea spp.). Heredity 121, 579-593.
| Crossref | Google Scholar |
Taylor SA, Larson EL (2019) Insights from genomes into the evolutionary importance and prevalence of hybridization in nature. Nature Ecology & Evolution 3, 170-177.
| Crossref | Google Scholar | PubMed |
Thacker CE, Unmack PJ, Matsui L, Rifenbark N (2007) Comparative phylogeography of five sympatric Hypseleotris species (Teleostei: Eleotridae) in south-eastern Australia reveals a complex pattern of drainage basin exchanges with little congruence across species. Journal of Biogeography 34, 1518-1533.
| Crossref | Google Scholar |
Thacker CE, Unmack PJ, Matsui L, Duong P, Huang E (2008) Phylogeography of Philypnodon species (Teleostei: Eleotridae) across south-eastern Australia: testing patterns of connectivity across drainage divides and among coastal rivers. Biological Journal of the Linnean Society 95, 175-192.
| Crossref | Google Scholar |
Thacker CE, Geiger DL, Unmack PJ (2022) Species delineation and systematics of a hemiclonal hybrid complex in Australian freshwaters (Gobiiformes: Gobioidei: Eleotridae: Hypseleotris). Royal Society Open Science 9, 220201.
| Crossref | Google Scholar |
Tims AR, Unmack PJ, Hammer MP, Brown C, Adams M, McGee MD (2024) Museum genomics reveals the hybrid origin of an extinct crater lake endemic. Systematic Biology 73, 506-520.
| Crossref | Google Scholar |
Toews DPL, Brelsford A (2012) The biogeography of mitochondrial and nuclear discordance in animals. Molecular Ecology 21, 3907-3930.
| Crossref | Google Scholar |
Unmack PJ (2001) Biogeography of Australian freshwater fishes. Journal of Biogeography 28, 1053-1089.
| Crossref | Google Scholar |
Unmack PJ, Dowling TE (2010) Biogeography of the genus Craterocephalus (Teleostei: Atherinidae) in Australia. Molecular Phylogenetics and Evolution 55, 968-984.
| Crossref | Google Scholar |
Unmack PJ, Hammer MP, Adams M, Dowling TE (2011) A phylogenetic analysis of pygmy perches (Teleostei: Percichthyidae) with an assessment of the major historical influences on aquatic biogeography in southern Australia. Systematic Biology 60, 797-812.
| Crossref | Google Scholar |
Unmack PJ, Bagley JC, Adams M, Hammer MP, Johnson JB (2012) Molecular phylogeny and phylogeography of the Australian freshwater fish genus Galaxiella, with an emphasis on Dwarf Galaxias (G. pusilla). PLoS ONE 7, e38433.
| Crossref | Google Scholar |
Unmack PJ, Hammer MP, Adams M, Johnson JB, Dowling TE (2013) The role of continental shelf width in determining freshwater phylogeographic patterns in south-eastern Australian pygmy perches (Teleostei: Percichthyidae). Molecular Ecology 22, 1683-1699.
| Crossref | Google Scholar |
Unmack PJ, Sandoval-Castillo J, Hammer MP, Adams M, Raadik TA, Beheregaray LB (2017) Genome-wide SNPs resolve a key conflict between sequence and allozyme data to confirm another threatened candidate species of river blackfishes (Teleostei: Percichthyidae: Gadopsis). Molecular Phylogenetics and Evolution 109, 415-420.
| Crossref | Google Scholar |
Unmack PJ, Adams M, Bylemans J, Hardy CM, Hammer MP, Georges A (2019) Perspectives on the clonal persistence of presumed ‘ghost’ genomes in unisexual or allopolyploid taxa arising via hybridization. Scientific Reports 9, 4730.
| Crossref | Google Scholar |
Unmack PJ, Adams M, Hammer MP, Johnson JB, Gruber B, Gilles A, Young M, Georges A (2022) Plotting for change: an analytical framework to aid decisions on which lineages are candidate species in phylogenomic species discovery. Biological Journal of the Linnean Society 135, 117-137.
| Crossref | Google Scholar |
Unmack PJ, Cook BD, Johnson JB, Hammer MP, Adams M (2023) Phylogeography of a widespread Australian freshwater fish, western carp gudgeon (Eleotridae: Hypseleotris klunzingeri): cryptic species, hybrid zones, and strong intra-specific divergences. Ecology and Evolution 13, e10682.
| Crossref | Google Scholar |
Verspoor E, Hammart J (1991) Introgressive hybridization in fishes: the biochemical evidence. Journal of Fish Biology 39(sA), 309-334.
| Crossref | Google Scholar |
Walker JM, van der Heijden ESM, Maulana A, Rueda-M N, Näsvall K, Salazar PA, Meyer M, Meier JI (2024) Common misconceptions of speciation. Evolutionary Journal of the Linnean Society 3, kzae029.
| Crossref | Google Scholar |
Walsh J, Shriver WG, Olsen BJ, Kovach AI (2016) Differential introgression and the maintenance of species boundaries in an advanced generation avian hybrid zone. BMC Evolutionary Biology 16, 65.
| Crossref | Google Scholar |
Wang J (2019) A parsimony estimator of the number of populations from a STRUCTURE-like analysis. Molecular Ecology Resources 19, 970-981.
| Crossref | Google Scholar |
Wong BBM, Keogh JS, McGlashan DJ (2004) Current and historical patterns of drainage connectivity in eastern Australia inferred from population genetic structuring in a widespread freshwater fish Pseudomugil signifer (Pseudomugilidae). Molecular Ecology 13, 391-401.
| Crossref | Google Scholar |
Yang W, Feiner N, Laakkonen H, Sacchi R, Zuffi MAL, Scali S, While GM, Uller T (2020) Spatial variation in gene flow across a hybrid zone reveals causes of reproductive isolation and asymmetric introgression in wall lizards. Evolution 74, 1289-1300.
| Crossref | Google Scholar |
Zbinden ZD, Douglas MR, Chafin TK, Douglas ME (2023) A community genomics approach to natural hybridization. Proceedings of the Royal Society of London – B. Biological Sciences 290, 20230768.
| Crossref | Google Scholar |