

Developing geospatial tools to identify refuges from alien trout invasion in Australia to assist freshwater conservation
Hugh Allan A * , Richard P. Duncan B , Peter Unmack A , Duanne White A and Mark Lintermans A
A
B
Abstract
Introduced fish have caused significant range reductions for many native fish, with many threatened species now found in headwater refuges, protected by in-stream barriers such as waterfalls, weirs and culverts. Owing to the remoteness of such refuges, distribution of many native species is poorly understood despite the urgency of determining their distribution because of threats posed by the spread of introduced fish into these refuges.
We investigated the application of emerging remote-sensing technology (LiDAR) to improve our ability to locate potential invasion barriers and identify headwater refuges.
We used LiDAR-derived digital elevation models to find likely barriers, and conducted fish surveys to determine introduced trout passability and distribution in tributary headwaters.
Trout were rarely observed upstream of waterfalls with a gradient of >0.82, whereas native galaxiids were found only in the absence of trout. Of 17 trout barriers surveyed, 9 supported a population of galaxiids upstream, whereas 8 were fishless.
LiDAR-based analysis is an effective tool for preliminary site selection and prioritisation for freshwater fish conservation. Discovery of three new populations of galaxiids in this study demonstrates the potential of this technique to locate additional trout-free headwater streams, important for threatened galaxiids and other trout-sensitive aquatic species.
Keywords: biogeography, conservation, ecology, fish, freshwater, galaxias, introduced species, protected areas.
Introduction
Freshwater fishes are among the most highly threatened groups in the world, with modified flow regimes, habitat modification and loss, and alien species responsible for the decline and loss of many native species and populations across a variety of environments (Dudgeon et al. 2006; Su et al. 2021; Lynch et al. 2023). Introduced predators are one of the major causes of decline, especially for small-bodied fishes, with predation being a significant threat (Franco et al. 2021; Leal et al. 2021; Murphy et al. 2021). Brown trout (Salmo trutta) and rainbow trout (Oncorhynchus mykiss) are a significant threat, and their introduction into cool temperate parts of the southern hemisphere has led to the decline and loss of many small-bodied native species (McDowall 2006; Young et al. 2010; Raadik 2014; Jones and Closs 2017; Cussac et al. 2020). Their effectiveness as predators and ability to disperse widely throughout stream networks means that they have adapted to the cool water environments of the southern hemisphere extremely well and many self-sustaining populations are now established.
Since the introduction of trout, many native species now exhibit highly fragmented distributions, with small, isolated populations remaining only in refuge habitats such as stream headwaters where threats of predation or competition are absent (Shelton et al. 2015; Lintermans et al. 2020; Jones et al. 2021). Despite often representing the extremes of a species’ historical range rather than preferred habitat, headwater environments are important refuge habitats for many species, with protection from introduced species offered by in-stream barriers such as waterfalls, weirs and culverts (Lintermans 2000; Diebel et al. 2015; Colvin et al. 2019; Atkinson et al. 2020; Allan and Lintermans 2021; Minett et al. 2023). Owing to their highly fragmented nature and their location at extremities of landscapes and stream networks, headwater refuges and the species that inhabit them are more susceptible to many threats and therefore at an increased risk of extinction (Brauer and Beheregaray 2020; Costea et al. 2021; Hossack et al. 2023). Headwater environments are particularly susceptible to changes in water and habitat quality because of their small stream size and catchment area (Matono et al. 2014; Kirk et al. 2022). Climate change and increased temperatures, risk of drought and extreme events leave headwater streams more susceptible to cessation of flow and other threats such as bushfire (Gido et al. 2019; Jager et al. 2021; Milano et al. 2021), whereas the effects of riparian and in-stream damage caused by introduced ungulates is exacerbated in small headwater streams (Driscoll et al. 2019; Scanes et al. 2021; Lintermans and Allan 2022). Additionally, alien species incursion can be catastrophic for fish in headwater streams (Hulme 2007; Lavery et al. 2022), and can lead to the elimination of populations of threatened fishes in headwater streams in as little as 6–18 months (Raadik et al. 2010).
Given that many threatened fishes now only occur in remnant populations of a once much wider distribution, the establishment of additional populations through conservation translocations is a priority management action for many species (Lintermans et al. 2015; Allan et al. 2018, 2022; Zukowski et al. 2021; Garnett et al. 2022; Gaywood et al. 2022). Establishment of additional populations means risks of extinction are reduced, and the localised effects of bushfire, predator incursion or stream drying are offset at the population level by increased geographical coverage, while also increasing overall population size of these threatened species (Ellender and Weyl 2015; Gaywood et al. 2022; Pennock et al. 2024). The challenge for management of threatened species is prioritising often-limited funding and resources allocated towards their recovery (Kearney et al. 2023; Lintermans et al. 2024). Current techniques of locating headwater refuge habitats and potential translocation sites involve manual inspection of topographic maps and aerial imagery to find streams most likely to contain barriers such as waterfalls, while also being able to support fish (Ayres et al. 2012a, 2012b; Allan and Lintermans 2021; Raadik and Lintermans 2022). Whereas this approach can be useful to find some refuge sites, it relies on experienced researchers, is limited to larger waterfalls, is difficult to replicate effectively and requires on-ground work to measure and inspect barriers. Owing to the remote nature of these headwater refuge habitats, they are often isolated from research centres and towns and may have limited vehicle access, making site visits time-consuming, expensive and potentially inefficient (Castañeda et al. 2020; Allan et al. 2021). Additionally, smaller barriers (e.g. waterfalls with less vertical height, or cascades with more gradual slope) can be more common in the landscape and can still function as effective barriers to upstream fish passage, but are more difficult to find using conventional approaches.
Current techniques of locating barriers to fish passage in headwater streams will benefit from a revision to increase efficiency, allow replication across large spatial scales, and facilitate initial cost-efficient classification and prioritisation of potential sampling sites to save time and money (Hedger et al. 2020). The growing array of remote-sensing technology lends itself very well to freshwater fish research, and several recent studies have described the benefits of various remote-sensing technologies in this field (Sundt et al. 2022; Kuiper et al. 2023). Airborne light detection and ranging (LiDAR) sensors measure distance to objects by using light signals, and when coupled with spatially oriented data loggers affixed to aircraft or drones, can create three-dimensional representations of landscapes, or digital elevation models (DEMs) (Erol et al. 2020; Chai et al. 2022). A wide range of tools are available for DEM interrogation, including many designed specifically for stream network analysis, which can extract stream channels, watershed boundaries, elevation profiles, and calculate catchment area and channel slope (Lindsay 2016; Aziz et al. 2020; Datta et al. 2022; David et al. 2023). LiDAR has already been used to study large fish passage barriers such as dam walls, weirs, road crossings and culverts by using resolutions between 1- and 50-m pixel size (Hedger et al. 2020; Buchanan et al. 2022; Arsenault et al. 2023). Naturally, as resolution and accuracy of this technology increases, smaller features can be identified from DEMs, which means structures such as small waterfalls and cascades will become more easily detected (Vaze et al. 2010; Muhadi et al. 2020). This technology has the potential to increase the efficiency and add significant value to current methods of locating and characterising barriers in headwater streams.
This study investigated and outlined the suitability and uses for remote-sensing technology to aid in finding and characterising remote barriers to fish passage and resulting refuge sites, by focusing on quantifying important characteristics of barriers to introduced fishes in a LiDAR-derived landscape model. It also investigated characteristics of headwater streams, which may indicate their suitability and likelihood of containing existing but previously unknown populations of threatened species, or their potential as a conservation translocation site. The hypothesis being tested is that waterfall slopes exceeding 0.80 exclude trout from native fish refuges and LiDAR is a reliable tool to identify such barriers. Additionally, using this approach, the study aimed to identify potential refuge areas for native fishes (Galaxias spp.) in tributaries in an upland catchment. This study aimed to provide critical information to assist the development of informed conservation management priorities and actions for range-restricted small-bodied species confined to headwater refuge environments.
Materials and methods
Study site
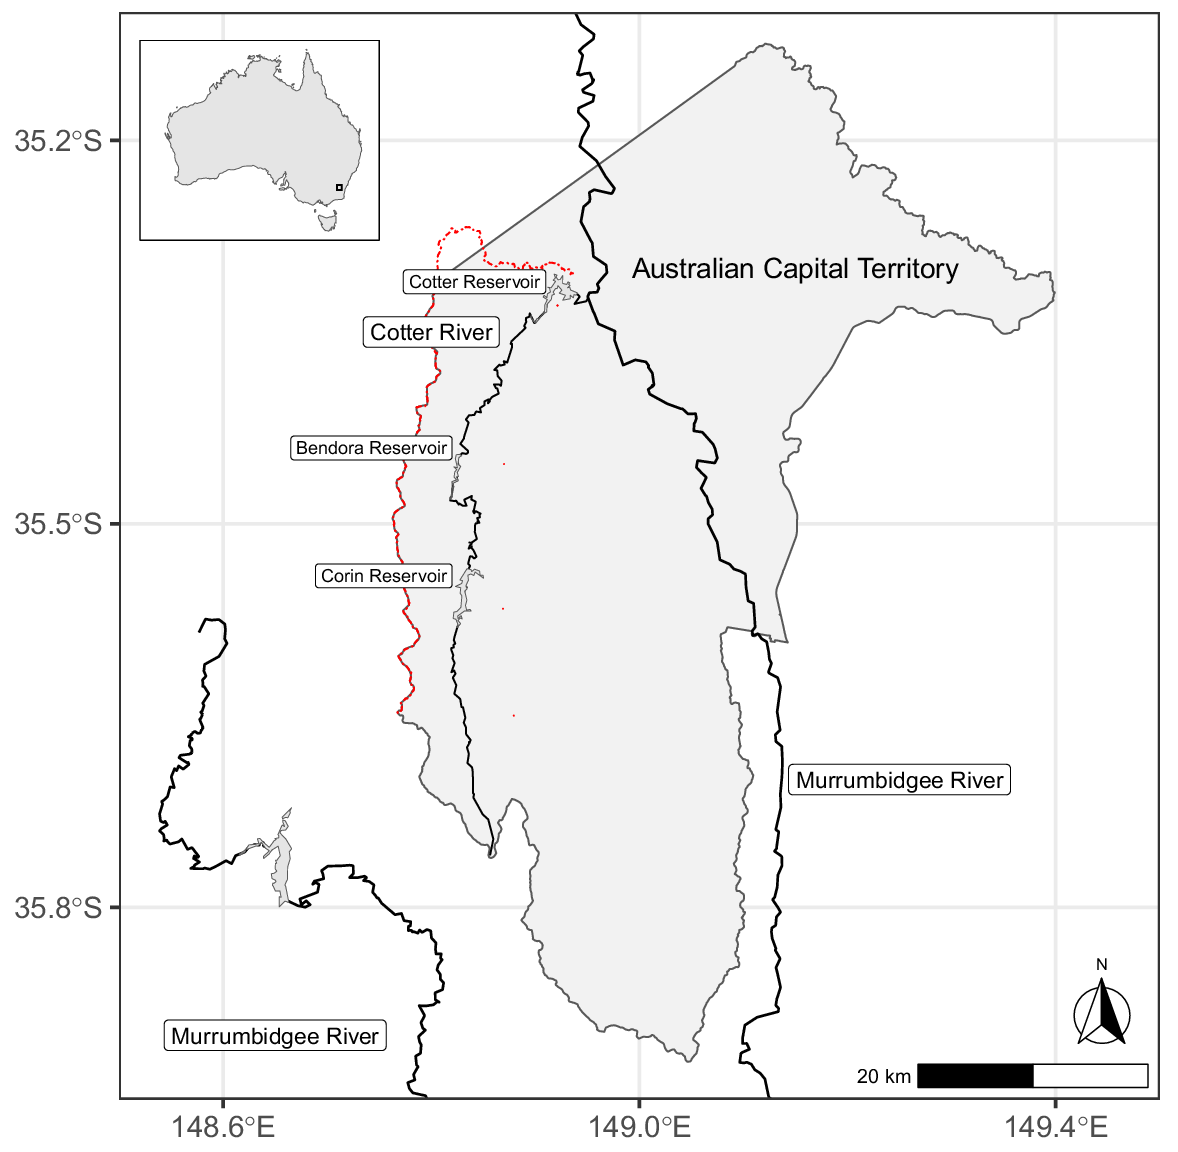
The Cotter River catchment in the Australian Capital Territory (ACT) was used as a case study to investigate the application of remote-sensing and LiDAR-derived data in determining characteristics of barriers to upstream fish passage (Fig. 1, 2). Brown trout and rainbow trout were introduced into the Canberra district in 1888 and 1894 respectively, and are now widespread throughout the ~480-km2 Cotter River catchment (Clements 1988; Jarvis et al. 2019). Although three large dams on the Cotter River provide obvious barriers to upstream movement, rainbow trout has been introduced upstream of all dams and has colonised upstream, limited only by barriers, whereas brown trout is found only downstream of Bendora Dam (Fig. 2, Lintermans 2002). Their ability to disperse and colonise different habitats means both species are found in the reservoirs, mainstem river and small tributaries throughout the catchment. Native mountain galaxias (Galaxias olidus) is also found in the Cotter catchment, with almost all records from tributary headwaters where trout is absent. In-stream barriers such as natural waterfalls, weirs and culverts prevent upstream colonisation by trout, and protect native galaxiid populations in these places. As a result, the presence of galaxiids almost always indicates that trout is absent from a particular stream reach in the Cotter catchment. Prior to the introduction of trout, G. olidus would have been found throughout the entire Cotter catchment, including reservoirs, mainstem river and tributaries (Lintermans 2002). The forested catchment in Namadgi National Park means that water temperatures are generally cold and water quality is good, especially in high-elevation areas of the catchment (Nichols et al. 2006). This catchment was chosen for this case study because the authors believe that the distribution of trout species here is primarily determined by physical barriers, rather than poor water quality or thermal tolerances.
Location of Cotter River catchment within Australia (top left inset) and within the Australian Capital Territory. The Cotter River catchment is the area bound by the dashed red line in the main map, which also forms the western boundary of the Australian Capital Territory. The mainstem of the Cotter River and Cotter, Bendora and Corin Reservoirs are also shown.
LiDAR processing
LiDAR-derived digital elevation models (DEMs) were used to detect waterfalls in the landscape that could be potential barriers to trout. Publicly available DEMs with 1-m pixel resolution were downloaded from the ‘Elvis Elevation and Depth’ spatial portal (see https://elevation.fsdf.org.au/), which were generated from data commissioned by the ACT Government in 2020 (date: February–May 2020; device: Riegl VQ780i; flying height: 1250 AGL; INS/IMU: Applanix POS AV/LV/MV various, 12 ppm). These elevation models were processed using WhiteboxTools software (ver. 2.4.0, J. Lindsay, see https://www.whiteboxgeo.com/) in R (ver. 4.4.1, R Foundation for Statistical Computing, Vienna, Austria, see https://www.r-project.org/) and QGIS (ver. 3.20.3, see https://github.com/qgis/QGIS). This software was used as it is open source and has been developed specifically for geospatial analysis and includes a range of efficient functions for processing elevation models and hydrological analysis.
Processing workflow using WhiteBoxTools functions in QGIS included the following: depressions in the elevation model were breached (BreachDepressionsLeastCost), single cell pits were filled (FillSingleCellPits), D8 pointer (D8Pointer) and flow accumulation (D8FlowAccumulation) grids were constructed, and then stream paths were determined on the basis of the D8FlowAccumulation grid (ExtractStreams). A threshold of 800,000 m2 was used to determine the beginning of stream headwaters in ExtractStreams; this means cells needed a minimum catchment area of 800,000 m2 to be included in the stream network. Stream networks based on this threshold sufficiently aligned with stream networks on topographic maps and authors’ field knowledge of the catchment. Once streams were found, stream elevation profiles were developed using the elevation values of cells in the DEM, which intersected stream networks, and by calculating horizontal distance between the centres of these cells; gradient between cells was then calculated. Channel gradient was calculated using the original unfilled and unbreached DEMs using R. Maps were then generated to interrogate for survey site selection, showing stream gradient and highlighting steep sections. Digital elevation models were aggregated using WhiteboxTools in R and QGIS, and the same process was completed for resolutions of 2, 3, 4, 5, 6, 7, 8, 9 and 10 m to investigate the differences in stream gradient among elevation models with various pixel size.
Catchment area of survey sites was determined using the ‘Watershed’ tool from WhiteboxTools, which finds the area upstream of designated ‘pour points’. Stream length upstream of each survey site was calculated as the total length of stream inside the catchment area of the survey site, including tributaries. Stream length and catchment areas were calculated only for 1-m resolution rather than all resolutions, as differences in these parameters are negligible at this scale (Das et al. 2016).
Fish surveys
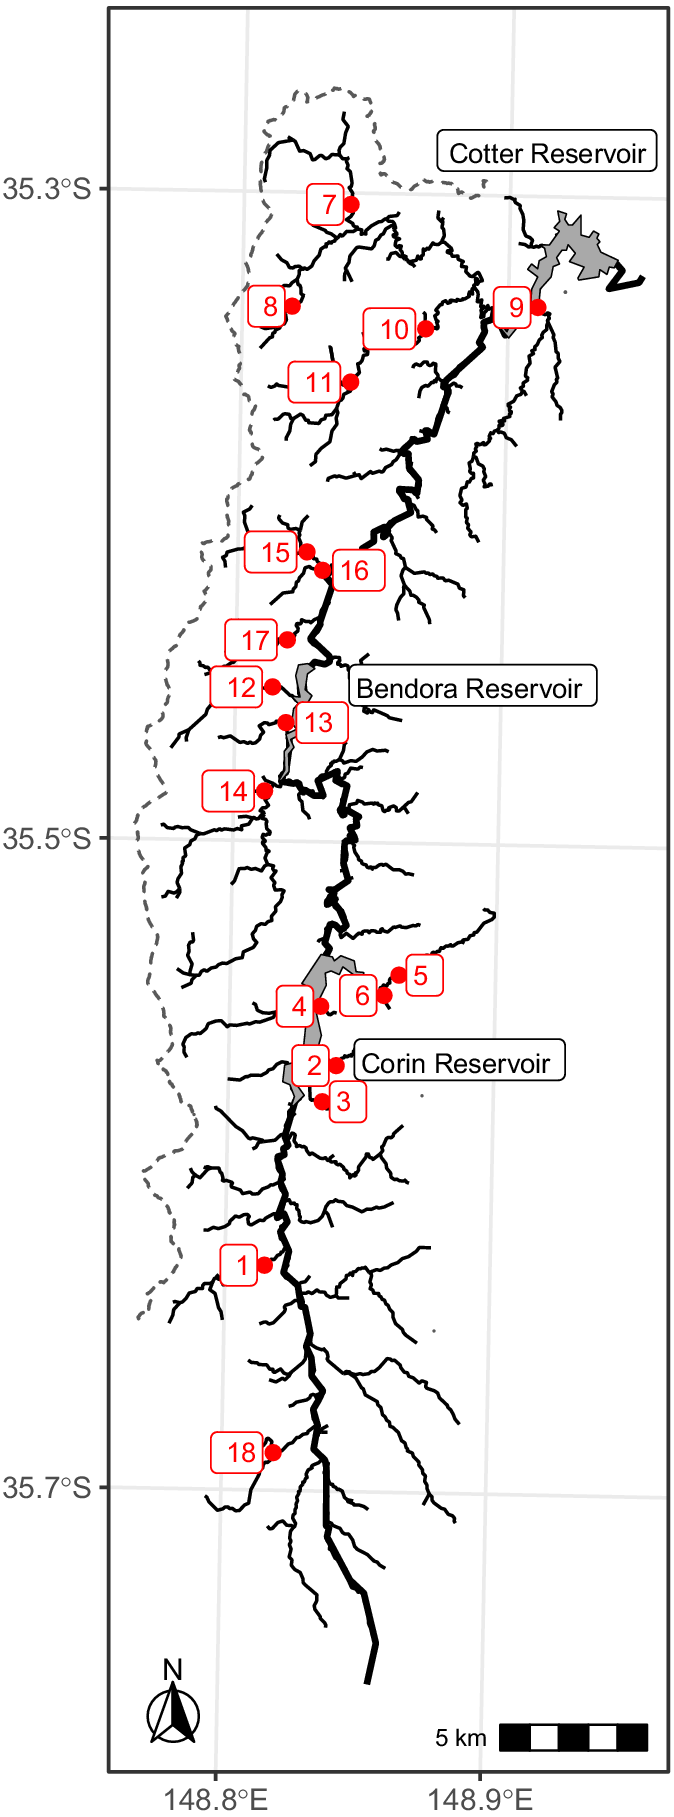
Survey streams were chosen by selecting streams with previous galaxiid records in the headwaters (Lintermans and Rutzou 1990; M. Lintermans, unpubl. data; ACT Government, unpubl. data). As trout is found throughout the Cotter River mainstem and its reservoirs, the combination of trout and galaxiids in the same stream, but in different reaches indicates that a barrier is likely to be present somewhere along the stream. Additionally, streams that did not have fish records but showed promising waterfalls or other steep sections identified from LiDAR-derived DEMs were also selected for survey; on the basis of a previous pilot study, streams where gradient exceeded 0.80 at one or more points were chosen (Allan and Lintermans 2021). Where a stream was selected for survey as described above, the potential barrier and initial location of fish surveys was determined as the most downstream point on that tributary with gradient equal to or exceeding 0.80; these points are hereafter referred to as ‘steep points’.
Fish surveys were conducted using backpack electrofishing with two operators during March 2022 and April–September 2023. A Smith-Root Model LR-24 backpack electrofishing machine was used, with settings being typically 900 V, 60 Hz, 25% duty cycle. Surveys involved electrofishing 30 m of stream both immediately downstream and immediately upstream of the steep point of interest. First, electrofishing was conducted immediately downstream of the steep point to determine what species of fish were present. If trout individuals were caught downstream of the steep point, it was deemed that trout had colonised that reach of stream downstream of the steep point. Next, electrofishing was conducted on the upstream side of the steep point. If five or more galaxiids and zero trout were caught upstream of a steep point, that steep point was deemed impassable by, and therefore a barrier to, trout. If less than five galaxiids were caught in 30 m of electrofishing upstream of a barrier, a further 30 m was surveyed until either five galaxiids were caught in a single 30-m operation, or three operations (totalling 90 m) were completed. If no fish were captured or seen in 90 m, then that upstream reach of the steep point was deemed to be fishless, and, importantly, therefore the steep point was deemed a barrier to trout. If one or more trout individuals were caught upstream of a steep point, that steep point was deemed to be passable by trout and therefore not a barrier. The next steep point with gradient equal to or exceeding 0.80 upstream was selected as the next survey site, and the same procedure was undertaken. If trout were not found in electrofishing surveys immediately downstream of the next steep point, it was determined that a barrier must be located downstream, at a point with gradient less than 0.80. The point with the steepest gradient between these two steep points was the next survey site. The procedure was repeated until a barrier to trout was found.
Steep points where trout was found immediately downstream but not upstream were considered barriers to trout movement. All points (and their associated gradients) from the same tributary downstream of where trout was found were therefore considered passable by trout. An additional barrier site at the Lees Creek weir (Site 11; Fig. 2) did not have trout immediately downstream at the time of this study (2023), but was a known barrier to trout movement for ~20 years, and it was included in the barrier data set (Lintermans 2000). No data pertaining to barrier characteristics such as height or gradient were collected in the field during fish surveys, rather the LiDAR-derived characteristics were used for all analyses.
This study was conducted under ACT Scientific License (LT202125 & FS20213) and University of Canberra Animal Ethics (10398).
Data analysis
One point trout had breached was removed from the dataset. Trout had breached a potential barrier on Collins Creek (Site 17; Fig. 2); here, the gradient in the DEM represented a steep waterfall, but on field inspection, an alternate side channel with shallower gradient was present around the waterfall. Therefore, the stream gradient trout had seemingly breached at this site was likely to be overestimated and unsuitable for analysis.
Generalised linear models (glm(.., family = binomial) function in R) were used to investigate the relationship of stream length and catchment area to fishless and galaxiid sites, and to compare the gradient of barriers and non-barriers for the same resolution. The relationship between stream length and catchment was investigated using linear regression (lm() function in R). Gradients of barriers and non-barriers were compared across different resolutions using pairwise Wilcoxon rank sum tests (pairwise.wilcox.test() in R).
So as to compare efficacy of different LiDAR resolutions, quantiles were calculated for barrier gradients of each resolution. The quantile equivalent to the maximum gradient trout had breached was then determined for each resolution, with higher values representing resolutions that were less effective at distinguishing barriers from non-barriers. The number of barriers with gradients greater than the maximum trout gradient was also determined for each resolution. Significance of pixel resolution v. quantile, resolution v. number of barriers greater than the trout maximum was tested using linear regression (lm() function in R).
Results
Survey sites
In total, 31 separate streams were identified in the Cotter catchment potentially containing a trout barrier on the basis of the presence of either previous galaxiid records, or a gradient of >0.80 and thus a potential trout barrier. This included 13 streams with galaxiid records in the headwaters, and an additional 18 streams where there were no trout records upstream of a steep point equal to or exceeding 0.80 gradient. Fish survey was undertaken on 17 of the 31 separate streams as part of this study, including seven sites with previous galaxiid records, and 10 sites without records upstream of steep points; the remaining 14 sites were not surveyed because of prolonged road closures (bushfire and rain damage to roads) and time constraints.
Trout barriers were found on all 17 streams surveyed; 9 sites had a population of galaxiids upstream of the barrier, whereas the remaining 8 streams were fishless. Three of the nine populations of galaxiids were new populations without previous galaxiid records at that site. With the addition of the historical Lees Creek weir barrier, the total number of trout barriers in the dataset was 18. Galaxiids and trout were never detected together in the same reach of stream; there was always a barrier between them.
Trout barriers
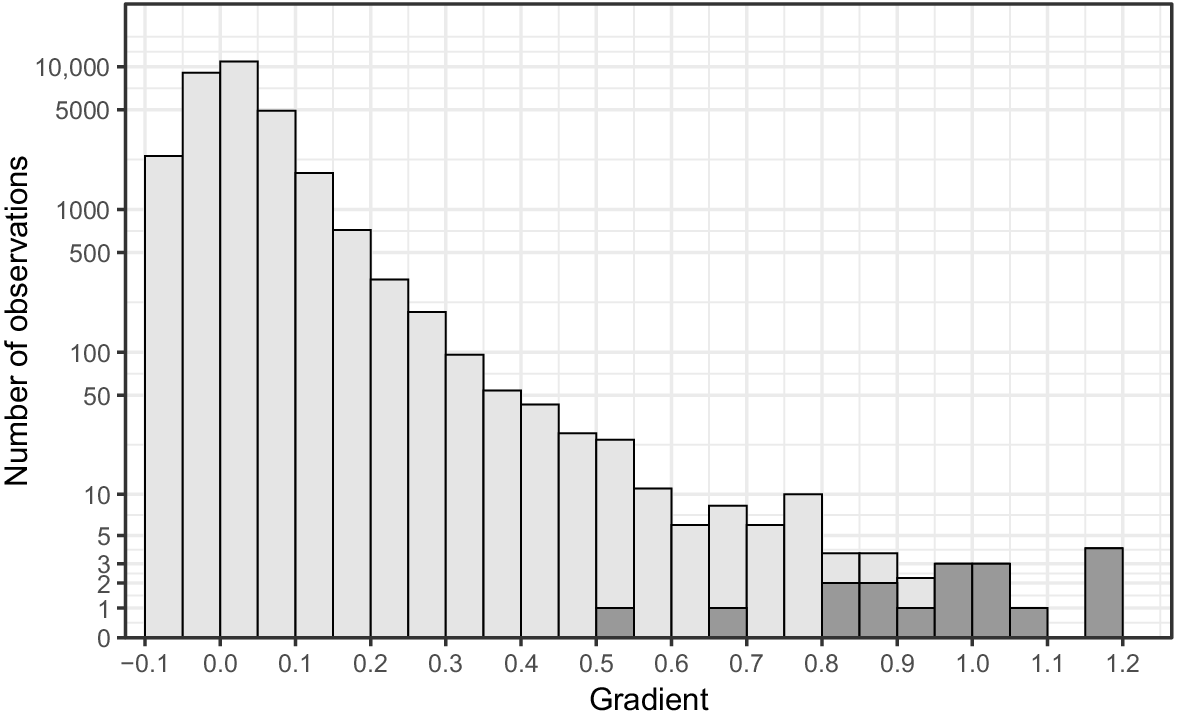
Steep points acting as barriers to trout had gradients ranging from 0.54 to 1.19 (0.97 ± 0.18; mean ± s.d.). The two barriers with the lowest gradient values had much smaller gradients than did the rest, with gradients of 0.54 and 0.69, which were 0.28 and 0.13 smaller than that of the third-steepest barrier, which had a gradient of 0.82 (Fig. 3). The steepest point trout had breached had a gradient of 0.93. Trout had breached 46 points greater than the 0.54 gradient (barrier with lowest gradient value), 22 points greater than 0.69 (barrier with second-lowest gradient value), and only three points greater than 0.82 (barrier with third-lowest gradient value; Fig. 3). Gradient values that trout had breached were significantly (P < 0.01) smaller than those that were found to be barriers.
Fishless streams
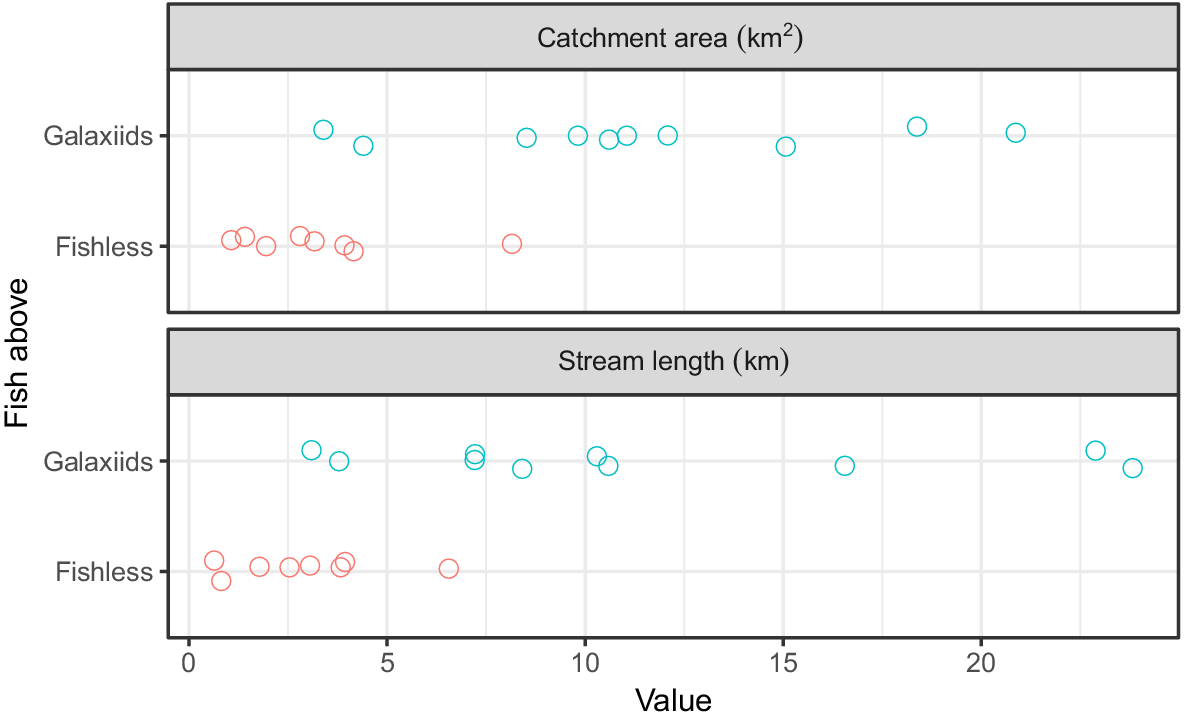
For sites where trout barriers were found, those with a population of galaxiids had significantly larger catchment areas than did those that were fishless (P = 0.02), with catchment areas ranging between 3.39 and 20.9 km2 (11.4 ± 5.55 km2, mean ± s.d.; n = 10) for galaxiid sites and from 1.06 to 8.15 km2 (3.33 ± 2.25 km2, mean ± s.d.; n = 8) for fishless sites (Fig. 4). Similarly, stream length was significantly longer in sites where galaxiids were found than in those that were fishless (P = 0.04); fishless sites had 0.636–6.56 km (2.90 ± 1.94 km, mean ± s.d.; n = 8) of stream above, and sites with galaxiids had 3.09–23.8 km (11.4 ± 7.34 km, mean ± s.d.; n = 10) of stream upstream of the barrier. Stream length was positively correlated with catchment area across all 18 trout barrier sites (r2 = 0.95, P < 0.01). Although there was considerable overlap in the range of both metrics for fishless and galaxiid sites, all but one catchment area and stream length for fishless sites was considerably smaller than the largest (Fig. 4).
LiDAR resolutions
Lower-resolution DEMs tend to produce lower average gradients for the same-sized barrier, because they tend to incorporate flatter portions of river; for example, a vertical step of 1 m in an otherwise flat stream would provide a gradient of 1.00 at 1-m resolution, but a gradient of 0.50 at 2-m resolution. Thus, the measured stream gradient that produced a trout barrier also varied with resolution (P < 0.001, Fig. 5). Gradient of barriers with 1-m resolution were significantly steeper than those from resolution of 2 m (P < 0.05) and all other resolutions (P < 0.001), whereas barriers of all resolutions 2 m and larger were not significantly (P > 0.05) different from each other. Gradients of points trout had breached of 1- and 2-m resolution were not significantly (P = 0.10) different from each other, but they were significantly (P < 0.01) steeper than the remaining points from resolutions greater than 2 m. There was no significant (P > 0.5) difference between gradients of points trout had breached from all resolutions 3 m and greater.
Histogram of simulated gradient values of different DEM resolutions that were a barrier to trout (dark grey), and those downstream of where trout was observed, and assumed to be passable by trout (light grey). Number in grey panel above each plot indicates DEM resolution in metres. Note only values greater than −0.1 are shown in this figure, which encompasses every barrier value (dark grey).
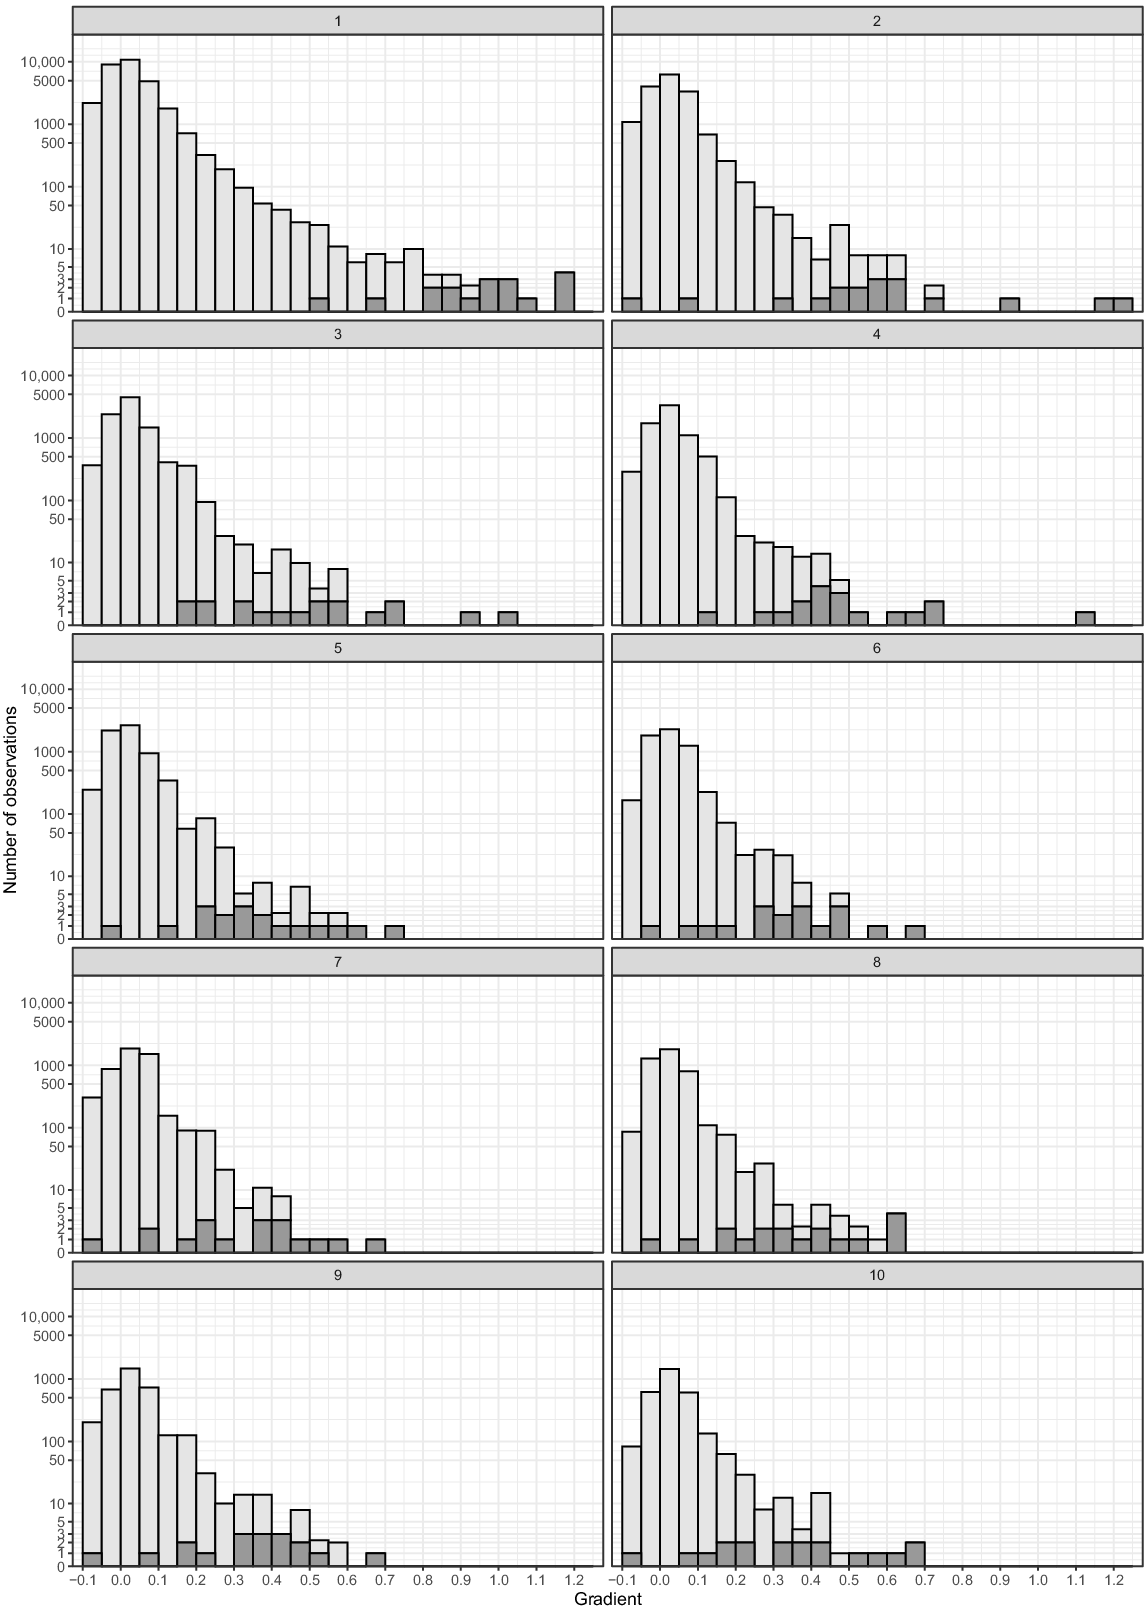
For all 10 resolutions, between 1 and 11 barriers had gradients greater than that of the maximum gradient trout had breached (4.3 ± 2.8, mean ± s.d.; n = 10) (Table 1), and quantiles of maximum trout breaching ranged from 0.39 to 0.94 (0.76 ± 0.16, mean ± s.d.; n = 10). Although the most barriers and the lowest quantile value was found with 1 m resolution, and the least barriers and the highest quantile value was from 9-m resolution, there was no significant relationship between resolution and quantile values or number of barriers greater than the maximum trout gradient (P = 0.13).
| Res | Max. m | Q1 | n | Min. barrier | Max. barrier | |
|---|---|---|---|---|---|---|
| 1 | 0.93 | 0.39 | 11 | 0.54 | 1.19 | |
| 2 | 0.72 | 0.83 | 3 | −0.05 | 1.21 | |
| 3 | 0.60 | 0.72 | 5 | 0.18 | 1.03 | |
| 4 | 0.50 | 0.67 | 6 | 0.14 | 1.12 | |
| 5 | 0.60 | 0.89 | 2 | −0.03 | 0.71 | |
| 6 | 0.49 | 0.89 | 2 | −0.02 | 0.69 | |
| 7 | 0.45 | 0.78 | 4 | −0.09 | 0.68 | |
| 8 | 0.57 | 0.78 | 4 | −0.04 | 0.63 | |
| 9 | 0.60 | 0.94 | 1 | −0.07 | 0.68 | |
| 10 | 0.48 | 0.72 | 5 | −0.05 | 0.70 |
‘Res’ is DEM resolution (m), ‘Max. m’ is the maximum gradient trout had breached, ‘Q1’ is the equivalent quantile of ‘Max. m’ in the barrier dataset, ‘n’ is the number of barriers with gradient greater than ‘Max. m’, ‘Min. barrier’ is the gradient value of the smallest barrier, and ‘Max. barrier’ is the gradient value of the largest barrier.
Discussion
This study has clearly demonstrated the utility of LiDAR-derived elevation models as a useful tool for locating potential barriers to fish passage. LiDAR-derived spatial characteristics of streams and waterfalls were able to partition native and alien species distributions throughout stream networks. LiDAR-derived barrier gradient was a consistent determinant of trout exclusion, and stream length and catchment area separated galaxiid presence or absence from trout-free streams. Galaxiids were rarely recorded without a waterfall with a gradient at least 0.82 downstream, whereas trout were never recorded upstream of a waterfall with a gradient 0.93 or greater. Unsurprisingly, elevation models with the highest resolution (1 m) were the best at differentiating points that were impassable by trout. Importantly, by basing fish survey site selection on this new technique rather than conventional topographic maps and aerial imagery, or sites with easy road access, several new refuge areas without trout were discovered as part of this study, including eight fishless streams and three new populations of galaxiids.
Barrier gradient was the LiDAR-derived metric investigated because it can be consistently calculated along the length of a stream, while being suitable for comparison between streams or watersheds. Owing to the emerging nature of the LiDAR technology (especially high-resolution data used in this study), and the novel process outlined in this study of extracting stream profile and gradient, the gradient-based analysis reported is not always comparable to other studies. Whereas a few recent studies have focused on remote-sensing technologies and gradient-based barriers (Enqvist 2019; Hedger et al. 2020; Arsenault et al. 2023), many studies prior to these have described barriers in terms of vertical height, a metric more easily measured in the field (Lintermans 2000; Ayres et al. 2012b; Charters 2013). Intuitively, vertical height is an important characteristic in barrier design, although it can be challenging to characterise when barriers are of a slope or chute formation, or have multiple barriers with steps in between, rather than a vertical drop (e.g. Ovidio et al. 2009; Chanson and Uys 2016; Penaluna et al. 2022). Additionally, vertical barrier height can be difficult to define from remote sensing-type data even of such ‘high resolution’ as 1-m pixel size, unless a structure is known to be perfectly vertical. Nonetheless, studies that have reported gradient-based barriers are reflective of what was found in this study; Enqvist (2019) reported that barriers to brown trout can be as small as a gradient of 0.50, whereas Ovidio et al. (2009) reported brown trout passage through barriers with up to 0.74 gradient. A pilot study undertaken prior to this work that used high-resolution DEMs derived from drone orthophotography reported that a gradient of 0.86 can be a barrier to brown and rainbow trout (Allan et al. 2021). Although vertical height of barriers was not specifically recorded as part of this assessment, those that were of a vertical nature were anecdotally noted as having vertical heights approximating those reported from other studies (e.g. 1–1.5 m from Franklin et al. 2018; 1.5 m from Charters 2013; ~1.8 m from Ovidio et al. 2007; 2.0 m from Ayres et al. 2012b). Although gradients derived from LiDAR may not always perfectly align with true on-ground gradient because of pixel alignment and overhead vegetation cover, among other factors; anecdotally, sites with higher gradient values were often noted as those with taller vertical heights too; as an example, one barrier from this study with gradient 1.05 was reported as 1.75 m high by Lintermans (2000). At present, high-resolution LiDAR as used in this study is not available in all regions and all countries, highlighting not only the importance of understanding how metrics used to describe barriers differ among technologies, but also the benefits of employing and promoting new approaches where it is not yet available.
Of course, many complex factors play an important role in determining the passability of a barrier for fish other than vertical height or channel gradient, although these can be challenging to quantify using remote-sensing data. Plunge pool depth is an important factor when considering the jumping ability of fish, and therefore barrier passability (Brandt et al. 2005; Kondratieff and Myrick 2006; Blackburn et al. 2021), but this is difficult to measure with airborne LiDAR because of problems with water penetration (Irwin et al. 2017; Schumacher and Christiansen 2020). Similarly, jumping ability is correlated with fish length, but even for the deepest plunge pool and optimum-sized fish, there is nonetheless a limit as to how high fish can jump; Kondratieff and Myrick (2006) reported that even with the deepest plunge pools of 40 cm and largest fish of 20 cm and greater, the highest waterfall breached by brook trout in a laboratory was just over 73 cm. Plunge pool depth may therefore be more important for determining the passability of smaller barriers, with heights below a maximum jumping threshold. Although plunge pool depth was not measured as part of this study, shallow plunge pools and reduced jumping ability of fish would be a likely explanation for the barriers with the two lowest gradient values in this study; findings suggest this is most important for barriers with a gradient between 0.54 (smallest barrier) and 0.93 (steepest point trout had breached). Given that trout was never found upstream of waterfalls with gradient exceeding 0.93, we propose that passability of waterfalls with this gradient are largely independent of plunge pool depth. Given that this study was conducted in small headwater streams where most trout individuals were small, these gradient values may require refinement in other streams with larger trout and therefore increased jumping ability.
Minimum catchment size and stream length for supporting fish in upland headwater environments are not particularly well reported in the literature and will differ substantially among regions and among different species, but the use of spatial data tools in this study means these metrics are readily available. The correlation of catchment size and stream length is unsurprising, at least for streams in the same area that share similar geology, catchment use and climatic conditions. Publications specifically regarding minimum stream sizes for galaxiids are scarce, although some studies have reported stream length at sample sites (Chakona et al. 2018), or suggestions for prioritising sampling sites (Raadik and Lintermans 2022). Determining the upper limits of trout species in headwaters has received some research attention (Penaluna et al. 2022, 2023), although these studies are aided by large data sets and situations where species do not have a downstream limit such as a waterfall close by. The inclusion of these LiDAR-derived metrics in this study helped contribute to the knowledge gap between the limited available data and hypothetical limits with some evidence-based recommendations. Along with stream length, stream order is often used to characterise streams (Hughes et al. 2011); the issue with both of these metrics is that they are scale-dependent, and challenges can arise when trying to compare among studies or across different data sources, map types and of course spatial scales (Das et al. 2016; Colvin et al. 2019). Rather, catchment area remains a more consistent metric across various spatial scales (Das et al. 2016). Just as other factors such as plunge pool depth are important in determining barrier passage for small barriers in small streams, area alone may not be the most important metric to consider when catchments are small. Especially in the face of climate change, smaller catchments are more susceptible to external factors such as sedimentation following fires, desiccation during drought or ephemerality because of local hydrology and weather (Lyon and O’Connor 2008; Hossack et al. 2023; Whiterod et al. 2023), which is a likely explanation for the fishless status in some of these small headwaters. Water quality, habitat quality and availability, any existing fish community and the ability of fish to colonise or recolonise a reach are also critical in determining suitability for fish in headwater streams (Sanders et al. 2020; Costea et al. 2021; Paredes del Puerto et al. 2022). Even so, the pattern observed in catchment area compared with the presence of galaxiids in trout-free sites in this study showed that even small streams with small catchments can support populations of fish, albeit with a higher risk of population loss. This information assists to inform management in this and similar areas, as well as demonstrate the utility of the catchment size metric for other studies.
As remote-sensing technologies continue to advance, it is important to understand the differences and benefits of various data sources and approaches (Das et al. 2016). We simulated various resolutions of LiDAR to reflect older (lower resolution) and more recently (high resolution) available data sets. Unsurprisingly the data with the best resolution (1-m pixel size) showed the best results (Pollett and Fentie 2021); stream networks were more accurate (Hedger et al. 2020) and barrier characteristics were more easily distinguished from points trout had breached on the basis of gradient. Interestingly, no statistically significant differences were observed among resolutions once pixel size was ~2–3 m or greater, suggesting that data with resolution greater than 3 m may not be particularly useful for this type of analysis. This was surprising, because intuitively most studies have demonstrated the ability to detect smaller structures such as dams, weirs and road crossings with increased pixel resolution (Steel et al. 2004; Vaze and Teng 2007; Lawson et al. 2010; Muhadi et al. 2020; Allan et al. 2021). This could be reflective of a small sample size or the particular study area; elevation model-derived landscape characteristics will vary between areas with relatively flat, shallow gradients such as floodplains, and mountainous areas with considerable vertical relief (O’Brien et al. 2016). Just because barriers were harder to distinguish from points trout had breached does not necessarily mean the barriers were not detected, it may mean more points trout had breached were being detected as well. Nonetheless, this does not negate the need to understand differences among data sets of varying resolutions. Parameters such as gradient of maximum trout breaching and the number of barriers steeper than this were different among resolutions, and naturally the integration of knowledge from more study sites and future research will inform critical guidelines for management and the dynamic development of future research plans. For example, most LiDAR data sets publicly available in Australia are either 1-, 2-, 5- or 10-m pixel size, with the smallest pixel resolution generally coming from more recent data sets. Where coarse data sets are updated in the future, it would be beneficial to acquire data with pixels 1–2 m rather than larger, and initially target areas of higher conservation concern. The combination of data with various pixel size now and moving forward highlights the need to be able to interpret and utilise a variety of different data resolutions.
Knowledge of distribution of existing alien species is critical when predicting the likelihood of a site to contain a threatened species, or when evaluating its suitability as a potential reintroduction site. Although this study has detailed an effective method to characterise and locate barriers to fish passage, a barrier is largely ineffective if alien species have been introduced upstream. Where uncontrolled and often undocumented stocking or release of alien species has occurred, as has been the case for trout species in the past (Lintermans 2004; Fausch 2007; Raadik et al. 2015; García-Díaz et al. 2018; Berrebi et al. 2020), historical stocking of alien fish upstream of a barrier can render a site unsuitable for native threatened species reintroduction. Understanding where barriers are in a stream network is, nonetheless, valuable knowledge because they still provide a barrier to upstream movement. This can help explain genetic differences in fish populations, as well as demonstrate areas where fish may be unable to recolonise if they were ever extirpated either naturally or intentionally (Lintermans 2000; Ayres et al. 2012a; Brunson 2020). In the case of threatened species recovery, the removal of alien species from a stream may be greatly assisted by the knowledge of barrier locations that could provide natural ‘fences’, separating a stream into more manageable reaches for ongoing removal (Pennock et al. 2024). The same processes that threaten headwater streams and threatened fish that inhabit them may also contribute to the ‘natural’ loss of stocked alien species following bushfire, prolonged drought or changes to water quality with climate change. It is therefore important to understand where barriers are in the landscape, because they may greatly assist removal programs, or provide alien-free reintroduction sites following catastrophic events and localised loss.
Conclusions
LiDAR-based elevation models offer a wide scale and often readily accessible form of data that may be used to locate barriers to fish passage, and distribution of native and alien fish species. This study has presented a method by which streams may be assessed for their likelihood of invasion by alien species from downstream, or their suitability as headwater refuge sites for native and threatened species. Traditionally a time-consuming and expensive process of field surveys, this desktop-based approach significantly reduces search area and field survey time when looking for and assessing headwater refuges for monitoring of threatened species, or locating potential translocation sites for existing species. We recommend that waterfalls with gradients exceeding 0.93 are likely to be excellent barriers to trout, those exceeding 0.82 are likely to be good barriers and those greater than 0.54 have potential to be barriers and are worthy of on-ground investigation. It is important that any potential barrier identified from desktop analysis must be investigated in the field to ascertain what species of fish are present and if it is acting as a barrier, although findings from this study will greatly increase the likelihood of finding an effective barrier when coupled with conventional techniques. This study was limited to a single watershed in south-eastern Australia, and further research to investigate how these findings relate to other parts of Australia and the world, including studies on other species, will be valuable in placing this study in an international context. Although LiDAR-derived stream gradient was able to distinguish barriers from sections of stream that trout were able to breach, greater understanding of the relationship between LiDAR-derived metrics and more conventional metrics such as barrier height and structure will also be beneficial for future research.
Data availability
The data that support this study will be shared upon reasonable request to the corresponding author. This study was undertaken as part of a Doctor of Philosophy degree by Hugh Allan at the University of Canberra and was conducted at the Centre for Applied Water Science (CAWS) Institute for Applied Ecology (IAE).
Conflicts of interest
Peter Unmack is an Associate Editor of Marine and Freshwater Research but did not at any stage have editor-level access to this manuscript while in peer review, as is the standard practice when handling manuscripts submitted by an editor to this journal. Marine and Freshwater Research encourages its editors to publish in the journal and they are kept totally separate from the decision-making processes for their manuscripts. The authors declare that they have no other conflicts of interest.
Declaration of funding
Funding was provided by the Australian Society for Fish Biology Threatened Fishes Committee Threatened Fishes Grant, which helped fund the pilot study that preceded this larger study, and additional funds came from CAWS/IAE student research funding (to Hugh Allen and Mark Lintermans).
Acknowledgements
The authors are outstandingly grateful for the assistance and support of volunteers in the field, particularly Liam Allan, Glenn Allan, Kieran Allan, Ben Broadhurst, Harvey Broadhurst, Rhian Clear and Ugyen Lhendup. We also thank Kari Soennichsen for organising the IAE Jindabyne writing retreat in 2022, where parts of this paper were prepared.
References
Allan H, Lintermans M (2021) Investigating the utility of drones to identify potential fish refugia. Report to the Australian Society for Fish Biology Threatened Fishes Committee. Available at https://www.researchgate.net/profile/Hugh-Allan/publication/352814978_Investigating_the_utility_of_drones_to_identify_potential_fish_refugia/links/6122f7d9169a1a01031c6d16/Investigating-the-utility-of-drones-to-identify-potential-fish-refugia.pdf
Allan H, Unmack P, Duncan RP, Lintermans M (2018) Potential impacts of PIT tagging on a critically endangered small-bodied fish: a trial on the surrogate mountain galaxias. Transactions of the American Fisheries Society 147, 1078-1084.
| Crossref | Google Scholar |
Allan H, Duncan RP, Unmack P, White D, Lintermans M (2021) Reproductive ecology of a critically endangered alpine galaxiid. Journal of Fish Biology 98, 622-633.
| Crossref | Google Scholar | PubMed |
Allan H, Duncan RP, Unmack P, White D, Lintermans M (2022) PIT POP! Bursting the bubble on home-range bias with fine-scale PIT telemetry. Marine and Freshwater Research 73, 1297-1309.
| Crossref | Google Scholar |
Arsenault M, O’Sullivan AM, Ogilvie J, Gillis C-A, Linnansaari T, Curry RA (2023) Remote sensing framework details riverscape connectivity fragmentation and fish passability in a forested landscape. Journal of Ecohydraulics 8, 121-132.
| Crossref | Google Scholar |
Atkinson S, Bruen M, O’ Sullivan JJ, Turner JN, Ball B, Carlsson J, Bullock C, Casserly CM, Kelly-Quinn M (2020) An inspection-based assessment of obstacles to salmon, trout, eel and lamprey migration and river channel connectivity in Ireland. Science of The Total Environment 719, 137215.
| Crossref | Google Scholar |
Ayres RM, Nicol M, Raadik T (2012a) Establishing new populations for fire-affected Barred Galaxias (Galaxias fuscus): Site selection, trial translocation and population genetics. Black Saturday Victoria 2009 – natural values fire recovery program. Department of Sustainability and Environment, Melbourne, Vic., Australia.
Aziz NA, Abdulrazzaq ZT, Mansur MN (2020) GIS-based watershed morphometric analysis using DEM data in Diyala River, Iraq. Iraqi Geological Journal 53, 36-49.
| Crossref | Google Scholar |
Berrebi P, Marić S, Snoj A, Hasegawa K (2020) Brown trout in Japan – introduction history, distribution and genetic structure. Knowledge & Management of Aquatic Ecosystems 421, 18.
| Crossref | Google Scholar |
Brandt MM, Holloway JP, Myrick CA, Kondratieff MC (2005) Effects of waterfall dimensions and light intensity on age-0 brook trout jumping performance. Transactions of the American Fisheries Society 134, 496-502.
| Crossref | Google Scholar |
Brauer CJ, Beheregaray LB (2020) Recent and rapid anthropogenic habitat fragmentation increases extinction risk for freshwater biodiversity. Evolutionary Applications 13, 2857-2869.
| Crossref | Google Scholar | PubMed |
Brunson C (2020) Evaluating the effect of the removal of non-native trout in two high elevation tributary streams in the intermountain west. MNR thesis, Utah State University, Logan, UT, USA. Available at https://digitalcommons.usu.edu/gradreports/1471
Buchanan BP, Sethi SA, Cuppett S, Lung M, Jackman G, Zarri L, Duvall E, Dietrich J, Sullivan P, Dominitz A, Archibald JA, Flecker A, Rahm BG (2022) A machine learning approach to identify barriers in stream networks demonstrates high prevalence of unmapped riverine dams. Journal of Environmental Management 302, 113952.
| Crossref | Google Scholar |
Castañeda RA, Van Nynatten A, Crookes S, Ellender BR, Heath DD, MacIsaac HJ, Mandrak NE, Weyl OLF (2020) Detecting native freshwater fishes using novel non-invasive methods. Frontiers in Environmental Science 8, 29.
| Crossref | Google Scholar |
Chai LT, Wong CJ, James D, Loh HY, Liew JJF, Wong WVC, Phua MH (2022) Vertical accuracy comparison of multi-source Digital Elevation Model (DEM) with Airborne Light Detection and Ranging (LiDAR). IOP Conference Series: Earth and Environmental Science 1053, 012025.
| Crossref | Google Scholar |
Chakona G, Swartz ER, Chakona A (2018) The status and distribution of a newly identified endemic galaxiid in the eastern Cape Fold Ecoregion, of South Africa. Aquatic Conservation: Marine and Freshwater Ecosystems 28, 55-67.
| Crossref | Google Scholar |
Charters F (2013) Waterway barrier design for protection of native aquatic values. (University of Canterbury for Department of Conservation: Christchurch, New Zealand) Available at https://hdl.handle.net/10092/101522
Colvin SAR, Sullivan SMP, Shirey PD, Colvin RW, Winemiller KO, Hughes RM, Fausch KD, Infante DM, Olden JD, Bestgen KR, Danehy RJ, Eby L (2019) Headwater streams and wetlands are critical for sustaining fish, fisheries, and ecosystem services. Fisheries 44, 73-91.
| Crossref | Google Scholar |
Costea G, Pusch MT, Bănăduc D, Cosmoiu D, Curtean-Bănăduc A (2021) A review of hydropower plants in Romania: distribution, current knowledge, and their effects on fish in headwater streams. Renewable and Sustainable Energy Reviews 145, 111003.
| Crossref | Google Scholar |
Cussac VE, Barrantes ME, Boy CC, Górski K, Habit E, Lattuca ME, Rojo JH (2020) New insights into the distribution, physiology and life histories of south American galaxiid fishes, and potential threats to this unique fauna. Diversity 12, 178.
| Crossref | Google Scholar |
Das S, Patel PP, Sengupta S (2016) Evaluation of different digital elevation models for analyzing drainage morphometric parameters in a mountainous terrain: a case study of the Supin–Upper Tons Basin, Indian Himalayas. SpringerPlus 5, 1544.
| Crossref | Google Scholar |
Datta S, Karmakar S, Mezbahuddin S, Hossain MM, Chaudhary BS, Hoque ME, Abdullah Al Mamun MM, Baul TK (2022) The limits of watershed delineation: implications of different DEMs, DEM resolutions, and area threshold values. Hydrology Research 53, 1047-1062.
| Crossref | Google Scholar |
David SR, Murphy BP, Czuba JA, Ahammad M, Belmont P (2023) USUAL watershed tools: a new geospatial toolkit for hydro-geomorphic delineation. Environmental Modelling & Software 159, 105576.
| Crossref | Google Scholar |
Diebel MW, Fedora M, Cogswell S, O’Hanley JR (2015) Effects of road crossings on habitat connectivity for stream-resident fish. River Research and Applications 31, 1251-1261.
| Crossref | Google Scholar |
Driscoll DA, Worboys GL, Allan H, Banks SC, Beeton NJ, Cherubin RC, Doherty TS, Finlayson CM, Green K, Hartley R, Hope G, Johnson CN, Lintermans M, Mackey B, Paull DJ, Pittock J, Porfirio LL, Ritchie EG, Sato CF, Scheele BC, Slattery DA, Venn S, Watson D, Watson M, Williams RM (2019) Impacts of feral horses in the Australian Alps and evidence-based solutions. Ecological Management & Restoration 20, 63-72.
| Crossref | Google Scholar |
Dudgeon D, Arthington AH, Gessner MO, Kawabata Z-I, Knowler DJ, Lévêque C, Naiman RJ, Prieur-Richard A-H, Soto D, Stiassny MLJ, Sullivan CA (2006) Freshwater biodiversity: importance, threats, status and conservation challenges. Biological Reviews 81, 163-182.
| Crossref | Google Scholar | PubMed |
Ellender BR, Weyl OLF (2015) Resilience of imperilled headwater stream fish to an unpredictable high-magnitude flood. Koedoe: African Protected Area Conservation and Science 57, 1-8.
| Crossref | Google Scholar |
Enqvist M (2019) Chasing waterfalls; a method to detect natural barriers to salmon and trout migration. MSc thesis, Department of Biology, University of Bergen, Bergen, Norway. Available at https://bora.uib.no/bora-xmlui/bitstream/handle/1956/21413/Master_martin_enqvist.pdf?sequence=1
Erol S, Özögel E, Kuçak RA, Erol B (2020) Utilizing airborne LiDAR and UAV photogrammetry techniques in local geoid model determination and validation. ISPRS International Journal of Geo-Information 9, 528.
| Crossref | Google Scholar |
Fausch KD (2007) Introduction, establishment and effects of non-native salmonids: considering the risk of rainbow trout invasion in the United Kingdom. Journal of Fish Biology 71, 1-32.
| Crossref | Google Scholar |
Franco ACS, García-Berthou E, Santos LN (2021) Ecological impacts of an invasive top predator fish across South America. Science of The Total Environment 761, 143296.
| Crossref | Google Scholar |
Franklin P, Gee E, Baker C, Bowie S (2018) New Zealand fish passage guidelines. Version 1.1. Prepared for MBIE. NIWA report 2018019HN. (National Institute of Water & Atmospheric Research: Hamilton, New Zealand) Available at https://environment.govt.nz/assets/publications/Files/New-Zealand-fish-passage-guidelines-for-structures-up-to-four-metres.pdf
García-Díaz P, Kerezsy A, Unmack PJ, Lintermans M, Beatty SJ, Butler GL, Freeman R, Hammer MP, Hardie S, Kennard MJ, Morgan DL, Pusey BJ, Raadik TA, Thiem JD, Whiterod NS, Cassey P, Duncan RP (2018) Transport pathways shape the biogeography of alien freshwater fishes in Australia. Diversity and Distributions 24, 1405-1415.
| Crossref | Google Scholar |
Garnett ST, Hayward-Brown BK, Kopf RK, Woinarski JCZ, Cameron KA, Chapple DG, Copley P, Fisher A, Gillespie G, Latch P, Legge S, Lintermans M, Moorrees A, Page M, Renwick J, Birrell J, Kelly D, Geyle HM (2022) Australia’s most imperilled vertebrates. Biological Conservation 270, 109561.
| Crossref | Google Scholar |
Gido KB, Propst DL, Whitney JE, Hedden SC, Turner TF, Pilger TJ (2019) Pockets of resistance: response of arid-land fish communities to climate, hydrology, and wildfire. Freshwater Biology 64, 761-777.
| Crossref | Google Scholar |
Hedger RD, Blumentrath S, Bergan MA, Eloranta AP (2020) Mapping natural and artificial migration hindrances for fish using LiDAR remote sensing. NINA Report 1833. (Norsk Institutt for Naturforskning: Trondheim, Norway) Available at https://hdl.handle.net/11250/2653641 [In English with title in English and abstract in English and Norwegian]
Hossack BR, LeMoine MT, Oja EB, Eby LA (2023) Cryptic declines of small, cold-water specialists highlight potential vulnerabilities of headwater streams as climate refugia. Biological Conservation 277, 109868.
| Crossref | Google Scholar |
Hughes RM, Kaufmann PR, Weber MH (2011) National and regional comparisons between Strahler order and stream size. Journal of the North American Benthological Society 30, 103-121.
| Crossref | Google Scholar |
Irwin K, Beaulne D, Braun A, Fotopoulos G (2017) Fusion of SAR, optical imagery and airborne LiDAR for surface water detection. Remote Sensing 9, 890.
| Crossref | Google Scholar |
Jager HI, Long JW, Malison RL, Murphy BP, Rust A, Silva LGM, Sollmann R, Steel ZL, Bowen MD, Dunham JB, Ebersole JL, Flitcroft RL (2021) Resilience of terrestrial and aquatic fauna to historical and future wildfire regimes in western North America. Ecology and Evolution 11, 12259-12284.
| Crossref | Google Scholar | PubMed |
Jarvis M, Closs G, Dedual M, Dorsey L, Fulton W, Gabrielsson R, Lintermans M, Trotter M (2019) The introduced trout and char of Australia and New Zealand. In ‘Trout and char of the world’. (Eds JL Kershner, JE Williams, RE Gresswell, J Lóbon-Cerviá) pp. 573–604. (American Fisheries Society: Bethesda, MD, USA) doi:10.47886/9781934874547.ch17
Jones PE, Tummers JS, Galib SM, Woodford DJ, Hume JB, Silva LGM, Braga RR, Garcia de Leaniz C, Vitule JRS, Herder JE, Lucas MC (2021) The use of barriers to limit the spread of aquatic invasive animal species: a global review. Frontiers in Ecology and Evolution 9, 611631.
| Crossref | Google Scholar |
Kearney SG, Watson JEM, Reside AE, Fisher DO, Maron M, Doherty TS, Legge SM, Woinarski JCZ, Garnett ST, Wintle BA, Ritchie EG, Driscoll DA, Lindenmayer D, Adams VM, Ward MS, Carwardine J (2023) Threat-abatement framework confirms habitat retention and invasive species management are critical to conserve Australia’s threatened species. Biological Conservation 277, 109833.
| Crossref | Google Scholar |
Kirk MA, Hazlett MA, Shaffer CL, Wissinger SA (2022) Forested watersheds mitigate the thermal degradation of headwater fish assemblages under future climate change. Ecology of Freshwater Fish 31, 559-570.
| Crossref | Google Scholar |
Kondratieff MC, Myrick CA (2006) How high can brook trout jump? A laboratory evaluation of brook trout jumping performance. Transactions of the American Fisheries Society 135, 361-370.
| Crossref | Google Scholar |
Kuiper SD, Coops NC, Hinch SG, White JC (2023) Advances in remote sensing of freshwater fish habitat: a systematic review to identify current approaches, strengths and challenges. Fish and Fisheries 24, 829-847.
| Crossref | Google Scholar |
Lavery TH, Lindenmayer DB, Allan H, Southwell D, Woinarski JCZ, Lintermans M (2022) Monitoring populations and threats to range-restricted freshwater fishes: a case study of the Stocky Galaxias (Galaxias tantangara). Ecological Management & Restoration 23, 166-174.
| Crossref | Google Scholar |
Leal LB, Hoeinghaus DJ, Compson ZG, Agostinho AA, Fernandes R, Pelicice FM (2021) Changes in ecosystem functions generated by fish populations after the introduction of a non-native predator (Cichla kelberi) (Perciformes: Cichlidae). Neotropical Ichthyology 19, e210041.
| Crossref | Google Scholar |
Lindsay JB (2016) Whitebox GAT: a case study in geomorphometric analysis. Computers & Geosciences 95, 75-84.
| Crossref | Google Scholar |
Lintermans M (2000) Recolonization by the mountain galaxias Galaxias olidus of a montane stream after the eradication of rainbow trout Oncorhynchus mykiss. Marine and Freshwater Research 51, 799-804.
| Crossref | Google Scholar |
Lintermans M (2004) Human-assisted dispersal of alien freshwater fish in Australia. New Zealand Journal of Marine and Freshwater Research 38, 481-501.
| Crossref | Google Scholar |
Lintermans M, Lyon JP, Hammer MP, Ellis I, Ebner BC (2015) Underwater, out of sight: Lessons from threatened freshwater fish translocations in Australia. In ‘Advances in reintroduction biology of Australian and New Zealand fauna’. (Eds DP Armstrong, MW Hayward, D Moro, PJ Seddon) pp. 237–253. (CSIRO Publishing: Melbourne, Vic., Australia)
Lintermans M, Geyle HM, Beatty S, Brown C, Ebner BC, Freeman R, Hammer MP, Humphreys WF, Kennard MJ, Kern P, Martin K, Morgan DL, Raadik TA, Unmack PJ, Wager R, Woinarski JCZ, Garnett ST (2020) Big trouble for little fish: identifying Australian freshwater fishes in imminent risk of extinction. Pacific Conservation Biology 26, 365-377.
| Crossref | Google Scholar |
Lintermans M, Lutz M, Whiterod NS, Gruber B, Hammer MP, Kennard MJ, Morgan DL, Raadik TA, Unmack P, Brooks S, Ebner BC, Gilligan D, Butler GL, Moore G, Brown C, Freeman R, Kerezsy A, Bice CM, Le Feuvre MC, Beatty S, Arthington AH, Koehn J, Larson HK, Coleman R, Mathwin R, Pearce L, Tonkin Z, Bruce A, Espinoza T, Kern P, Lieschke JA, Martin K, Sparks J, Stoessel DJ, Wedderburn SD, Allan H, Clunie P, Cockayne B, Ellis I, Hardie S, Koster W, Moy K, Roberts D, Schmarr D, Sharley J, Sternberg D, Zukowski S, Walsh C, Zampatti B, Shelley JJ, Sayer C, Chapple DG (2024) Troubled waters in the land down under: pervasive threats and high extinction risks demand urgent conservation actions to protect Australia’s freshwater fishes. Biological Conservation 300, 110843.
| Crossref | Google Scholar |
Lynch AJ, Cooke SJ, Arthington AH, Baigun C, Bossenbroek L, Dickens C, Harrison I, Kimirei I, Langhans SD, Murchie KJ, Olden JD, Ormerod SJ, Owuor M, Raghavan R, Samways MJ, Schinegger R, Sharma S, Tachamo-Shah R-D, Tickner D, Tweddle D, Young N, Jähnig SC (2023) People need freshwater biodiversity. WIREs Water 10, e1633.
| Crossref | Google Scholar |
Lyon JP, O’Connor JP (2008) Smoke on the water: can riverine fish populations recover following a catastrophic fire-related sediment slug? Austral Ecology 33, 794-806.
| Crossref | Google Scholar |
Matono P, Bernardo JM, Costa AM, Ilhéu M (2014) Fish response to anthropogenic pressures in temporary streams: the importance of environmental drivers. River Research and Applications 30, 1281-1295.
| Crossref | Google Scholar |
McDowall RM (2006) Crying wolf, crying foul, or crying shame: alien salmonids and a biodiversity crisis in the southern cool-temperate galaxioid fishes? Reviews in Fish Biology and Fisheries 16, 233-422.
| Crossref | Google Scholar |
Milano D, Rechencq M, Lippolt GE, Vigliano PH (2021) The effect of climate change on Galaxias maculatus thermal habitat availability in northern Andean Patagonian lakes. Freshwater Biology 66, 2210-2222.
| Crossref | Google Scholar |
Minett JF, Fowler DM, Jones JAH, Brickle P, Crossin GT, Consuegra S, Garcia de Leaniz C (2023) Conservation of endangered galaxiid fishes in the Falkland Islands requires urgent action on invasive brown trout. Biological Invasions 25, 1023-1033.
| Crossref | Google Scholar |
Muhadi NA, Abdullah AF, Bejo SK, Mahadi MR, Mijic A (2020) The use of LiDAR-derived DEM in flood applications: a review. Remote Sensing 12, 2308.
| Crossref | Google Scholar |
Murphy CA, Romer JD, Stertz K, Arismendi I, Emig R, Monzyk F, Johnson SL (2021) Damming salmon fry: evidence for predation by non-native warmwater fishes in reservoirs. Ecosphere 12, e03757.
| Crossref | Google Scholar |
Nichols S, Norris R, Maher W, Thoms M (2006) Ecological effects of serial impoundment on the Cotter River, Australia. Hydrobiologia 572, 255-273.
| Crossref | Google Scholar |
Ovidio M, Capra H, Philippart J-C (2007) Field protocol for assessing small obstacles to migration of brown trout Salmo trutta, and European grayling Thymallus thymallus: a contribution to the management of free movement in rivers. Fisheries Management and Ecology 14, 41-50.
| Crossref | Google Scholar |
Ovidio M, Detaille A, Bontinck C, Philippart J-C (2009) Movement behaviour of the small benthic Rhine sculpin Cottus rhenanus (Freyhof, Kottelat & Nolte, 2005) as revealed by radio-telemetry and pit-tagging. Hydrobiologia 636, 119-128.
| Crossref | Google Scholar |
O’Brien A, Marsden T, Peterken C, Draper I (2016) Risk management of waterways: impact determination of barrier works for fish passage in Queensland. In ‘11th International Symposium on Ecohydraulics (ISE 2016)’, 7–12 February 2016, Melbourne, Vic., Australia. pp. 187–194. (Engineers Australia: Barton, ACT, Australia) Available at https://ausfishpassage.com/wp-content/uploads/2021/10/2015-WWBW-Mapping-Paper-.pdf
Paredes del Puerto JM, García ID, Maiztegui T, Paracampo AH, Rodrigues Capítulo L, Garcia de Souza JR, Maroñas ME, Colautti DC (2022) Impacts of land use and hydrological alterations on water quality and fish assemblage structure in headwater Pampean streams (Argentina). Aquatic Sciences 84, 6.
| Crossref | Google Scholar |
Penaluna BE, Burnett JD, Christiansen K, Arismendi I, Johnson SL, Griswold K, Holycross B, Kolstoe SH (2022) UPRLIMET: Upstream Regional LiDAR model for extent of trout in stream networks. Scientific Reports 12, 20266.
| Crossref | Google Scholar |
Penaluna BE, Cronn R, Hauck LL, Weitemier KA, Garcia TS (2023) Uncovering the hidden biodiversity of streams at the upper distribution limit of fish. Journal of Biogeography 50, 1151-1162.
| Crossref | Google Scholar |
Pennock CA, Healy BD, Bogaard MR, McKinstry MC, Gido KB, Cathcart CN, Hines B (2024) Translocation in a fragmented river provides demographic benefits for imperiled fishes. Ecosphere 15, e4874.
| Crossref | Google Scholar |
Pollett A, Fentie B (2021) Use of high-resolution DEM for improving stream slope estimates and its effect on modelled fine sediment loads. In ‘MODSIM2021, 24th international congress on modelling and simulation’, 5–10 December 2021, Sydney, NSW, Australia. (Eds RW Vervoort, AA Voinov, JP Evans, L Marshall) pp. 722–728 (Modelling and Simulation Society of Australia and New Zealand) Available at https://doi.org/10.36334/modsim.2021.L4.pollett
Raadik TA (2014) Fifteen from one: a revision of the Galaxias olidus Günther, 1866 complex (Teleostei, Galaxiidae) in south-eastern Australia recognises three previously described taxa and describes 12 new species. Zootaxa 3898, 1-198.
| Crossref | Google Scholar | PubMed |
Sanders KE, Smiley PC, Jr., Gillespie RB, King KW, Smith DR, Pappas EA (2020) Conservation implications of fish-habitat relationships in channelized agricultural headwater streams. Journal of Environmental Quality 49, 1585-1598.
| Crossref | Google Scholar | PubMed |
Scanes PR, McSorley A, Dickson A (2021) Feral horses (Equus caballus) increase suspended sediment in subalpine streams. Marine and Freshwater Research 72, 1290-1302.
| Crossref | Google Scholar |
Shelton JM, Samways MJ, Day JA (2015) Predatory impact of non-native rainbow trout on endemic fish populations in headwater streams in the Cape Floristic Region of South Africa. Biological Invasions 17, 365-379.
| Crossref | Google Scholar |
Steel EA, Feist BE, Jensen DW, Pess GR, Sheer MB, Brauner JB, Bilby RE (2004) Landscape models to understand steelhead (Oncorhynchus mykiss) distribution and help prioritize barrier removals in the Willamette basin, Oregon, USA. Canadian Journal of Fisheries and Aquatic Sciences 61, 999-1011.
| Crossref | Google Scholar |
Su G, Logez M, Xu J, Tao S, Villéger S, Brosse S (2021) Human impacts on global freshwater fish biodiversity. Science 371, 835-838.
| Crossref | Google Scholar | PubMed |
Sundt H, Alfredsen K, Museth J, Forseth T (2022) Combining green LiDAR bathymetry, aerial images and telemetry data to derive mesoscale habitat characteristics for European grayling and brown trout in a Norwegian river. Hydrobiologia 849, 509-525.
| Crossref | Google Scholar |
Vaze J, Teng J (2007) Impact of DEM resolution on topographic indices and hydrological modelling results. In ‘MODSIM 2007 International Congress on Modelling and Simulation: Land, Water & Environmental Management: Integrated Systems for Sustainability’, 10–13 December 2007, Christchurch, New Zealand. (Eds L Oxley, D Kulasiri) pp. 706–712. (Modelling and Simulation Society of Australia and New Zealand) Available at https://www.mssanz.org.au/MODSIM07/papers/12_s27/ImpactofDEM_s27_Vaze_.pdf
Vaze J, Teng J, Spencer G (2010) Impact of DEM accuracy and resolution on topographic indices. Environmental Modelling & Software 25, 1086-1098.
| Crossref | Google Scholar |
Whiterod NS, Lintermans M, Cramp RL, Franklin CE, Kennard MJ, McCormack R, Pearce L, Raadik TA, Ward M, Zukowski S (2023) The impact of the 2019-20 Australian wildfires on aquatic systems. In ‘Australia’s megafires: biodiversity impacts and lessons from 2019–2020’. (Eds L Rumpff, SM Legge, S Leeuwen, BA Wintle, JCZ Woinarski) pp. 59–77. (CSIRO Publishing)
Young KA, Dunham JB, Stephenson JF, Terreau A, Thailly AF, Gajardo G, Garcia de Leaniz C (2010) A trial of two trouts: comparing the impacts of rainbow and brown trout on a native galaxiid. Animal Conservation 13, 399-410.
| Crossref | Google Scholar |