

Changes in the fish assemblages along the Busselton Jetty, and a comparison with natural habitats
Madeleine S. Scanlon A * , Euan S. Harvey A , Jack R. C. Parker A , Isabella M. Mullins A , Sophie A. Teede B and Benjamin J. Saunders A
A
B
Abstract
In Western Australia, the heritage-listed Busselton Jetty is a popular tourism, fishing and diving destination renowned for its unique marine communities.
This research describes and quantifies the fish assemblages (mean number of individuals, species diversity and biomass) at the Busselton Jetty, and makes comparisons with natural habitats in Geographe Bay.
Diver-operated stereo-video systems filmed 25-m transects along the length of the jetty, and a remotely operated vehicle stereo-video filmed 25-m transects in nearby reef, seagrass and sand habitats. Fish at all habitats were counted, identified and measured.
Fish assemblages at the defined inshore, mid-shore and offshore zones of the jetty differed significantly, whereas the number of fish, species diversity and biomass increased with distance from shore. There was no measurable effect of protection within the small sanctuary zone at the end of the jetty. Fish assemblages at the jetty differed from those in all three natural habitats, and the number of fish, species diversity and biomass were highest at the natural reef, followed by the jetty, the seagrass and the sand habitats.
The Busselton Jetty supports a distinctive fish assemblage, high species diversity and a variety of benthic communities. Changes in the fish assemblages were attributed to differences in habitat type, complexity, depth and distance from shore.
The ecological and social benefits of future man-made marine structures can be optimised by incorporating design features that promote habitat diversity and complexity.
Keywords: artificial reef, Busselton, fish assemblages, Geographe Bay, habitat comparison, habitat complexity, jetty, pier, stereo-DOV, stereo-ROV.
Introduction
An increasing proportion of the world’s coastline is being modified as a result of ocean sprawl (Duarte et al. 2013). This involves the construction and deployment of man-made marine structures (MMSs) such as, but not limited to, jetties, piers, groynes, marinas, wharves, pipelines, oil and gas infrastructure, offshore wind and wave farms, and artificial reefs (Dafforn et al. 2015; Lemasson et al. 2021). These structures are typically placed in soft sediment habitats and can modify physical, chemical and biotic environments of an area, which can cumulatively drive ecological shifts in the benthic invertebrate and fish assemblages (Clynick et al. 2008; Layman and Allgeier 2020). Regardless of the purpose of a structure (commercial, recreational or for coastal protection), all MMSs functionally act as artificial reefs (ARs), because they emulate some characteristics of natural reefs (Seaman 2000; Baine 2001; Perkol-Finkel et al. 2006). These structures provide attachment surfaces for algae and epibenthos, thus providing habitat, spawning and feeding grounds for many fish species, which can increase overall species diversity and abundance in comparison to soft sediment habitats (Perkol-Finkel et al. 2006; Clynick et al. 2008; Lemoine et al. 2019; Layman and Allgeier 2020; Madgett et al. 2023). However, these ecological shifts are not necessarily positive. The deployment of MMSs can result in the establishment of non-indigenous and invasive species, the displacement of vulnerable species, and they may become ecological traps (Perkol-Finkel et al. 2006; Airoldi et al. 2015; Komyakova et al. 2021). Without increases in production, the attraction and aggregation of high abundances of target fish from surrounding habitats can lead to over-exploitation from fishing (Baine 2001; Perkol-Finkel et al. 2006; Lemoine et al. 2019; Layman and Allgeier 2020; Paxton et al. 2020). The ecological effects of ARs and MMSs are varied, with differences attributed to their design, age, size, distance from natural reefs and their geographical location (Carr and Hixon 1997; Baine 2001; Simon et al. 2013). Improving our knowledge about the types of fish assemblages that associate with different features of artificial structures, including the number of fish, fish biomass and species diversity, will assist managers and engineers to design MMSs that optimise environmental outcomes (Baine 2001; Chan et al. 2006; Cvitanovic et al. 2021). This will contribute to developing ‘green designs’ that will help minimise the environmental damage of ocean sprawl, while maximising the ecological benefits (Dafforn et al. 2015).
Following the deployment of artificial structures, benthos and fish assemblages undergo periods of change for up to 10 years before forming stable communities (Neves dos Santos and Zalmon 2015; Becker et al. 2022). Although MMSs, such as jetties, often differ from natural habitats in their orientation, vertical relief, complexity and material, they have been shown to attract many species of fish that are also common to nearby natural reefs (Clynick et al. 2008). Comparison of fish assemblages associated with MMSs and those associated with a nearby natural reef provides information on the function of MMSs in the context of the broader environment (Strelcheck et al. 2005; Perkol-Finkel et al. 2006; Arena et al. 2007; Layman and Allgeier 2020). Although some studies have found that ARs can display fish assemblages comparable to those on nearby natural reefs (Ambrose and Swarbrick 1989; Fowler and Booth 2013), most studies investigating jetties have found that even though they supported species similar to those found on natural reefs, the assemblage composition differed between the natural and artificial habitats (Duffy-Anderson et al. 2003; Clynick et al. 2008; Munsch et al. 2014; Pereira et al. 2017). In some cases, fish diversity, number of fish and biomass values at jetties were comparable to, or higher than, those at nearby natural habitats (Rilov and Benayahu 2000; Pereira et al. 2017), whereas in others, the natural habitats recorded higher values (Duffy-Anderson et al. 2003; Clynick et al. 2008; Munsch et al. 2014).
Although the rate of installation of artificial reefs has been increasing over the past 20 years, the lack of well-defined goals associated with their installation is often a limiting factor in their design, monitoring and management (Becker et al. 2018). Given that the construction and management of MMSs such as jetties is primarily driven from social and economic standpoints, there is little research discussing their ecological effects, even though they can support rich and diverse communities (Dafforn et al. 2015; Elrick-Barr et al. 2022). An understanding of how structural, spatial and habitat factors influence the presence and abundance of species is integral to assessing the extent of ecosystem functions of a jetty, and guiding potential areas of future improvement in design and management (Komyakova et al. 2019). Combining ecological principles with the social and economic outcomes can create a multifunctional structure (Elrick-Barr et al. 2022). Easily accessible MMSs that support high biodiversity, such as jetties, can receive greater visitation rates than do natural sites for snorkelling, diving and recreational fishing, adding socio-economic value to these structures (Kirkbride-Smith et al. 2016; Belhassen et al. 2017; Elrick-Barr et al. 2022).
The capacity of MMSs to support a high diversity, biomass and abundance of species renders them capable of providing marine conservation value equivalent to, or greater than, that of a natural habitat if managed correctly (Claudet and Pelletier 2004). Marine protected areas (MPAs) are used to protect an area from loss of biodiversity and ecosystem disruptions that result from human interactions (Grorud-Colvert et al. 2021). In some countries, the prohibition of recreational and commercial fishing around offshore MMSs, such as wind farms and oil and gas platforms, has led them to act as surrogate MPAs that effectively create refugia for benthos, fish and marine mammals (Ashley et al. 2014; Hammar et al. 2016). Conversely, unprotected inshore MMSs such as jetties can attract high recreational fishing activity, because the ease of access and aggregation of species to a confined area lead to increases in catch rates (Mills et al. 2017; Florisson et al. 2018). Because jetties may not support production to the same extent as does a purpose-designed artificial reef, the MMS may have an increased risk of over-exploitation if fishing levels are not managed rigorously (Grossman et al. 1997). Protection of a frequently-fished inshore structure through the implementation of an MPA or sanctuary zone could improve the health and resilience of its fish assemblage, and bring an increase in visitation rates through diving, snorkelling and general recreation, which conversely could counteract the loss of the value offered from fishing (Edgar and Stuart-Smith 2009; Grorud-Colvert et al. 2021).
The goal of this research was to quantify and describe the fish assemblages at the heritage-listed Busselton Jetty in Geographe Bay, Western Australia, and to compare and contrast them with fish assemblages in natural habitats nearby. The Busselton Jetty is an old MMS that not only has established fish communities and a no-fishing protected area, but is also a well-renowned tourism destination. Therefore, it can provide information on the ecological effects of MMSs and the efficacy of certain management strategies, while helping inform the design and management of future jetties and MMSs to optimise their ecological and social outputs. The study aimed to (1) assess how the environmental variables of habitat, distance from shore and depth influenced fish assemblages along the Busselton Jetty, (2) assess how fish assemblages differed between the fishing and non-fishing sanctuary zones at the Busselton Jetty, and (3) determine whether fish assemblages at the Busselton Jetty differed from those in surrounding natural reef, sand and seagrass habitats.
Materials and methods
Study area
Geographe Bay is a large, shallow (<30 m), protected embayment that curves from Cape Naturaliste to Bunbury in the south-west of Western Australia, covering an area of ~290 nautical miles2 (~1000 km2) (Bellchambers et al. 2006), with the southern half falling within the Ngari Capes Marine Park (Department of Environment and Conservation 2013). Geographe Bay is north-facing, and Cape Naturaliste protects it from the prevailing south-westerly swells (Fahner and Pattiaratchi 1994). The region is microtidal and, whereas summer and autumn are dominated by light to moderate winds from the south, winter is associated with stronger south-westerly to north-westerly winds (Fahner and Pattiaratchi 1994). Seagrass beds are the key benthic habitat, which cover 70% of the bay and aid in the attenuation of wave and current energy (McMahon et al. 1997). These are interspersed with sand patches and a low-profile reef ridge, ~20 m deep, that runs parallel to the shore (Westera et al. 2009). These waters serve as a transition zone for tropical and temperate species because of the seasonal influence of the south-flowing Leeuwin Current, which brings warm, oligotrophic waters in winter, and the north-flowing coastal Capes Current, which brings cool water and localised upwellings in summer (Pearce and Pattiaratchi 1999; Westera et al. 2009).
The Busselton Jetty, which was constructed in 1865 (although extensions have since been added), is a timber piled pier that extends 1.84 km into Geographe Bay from central Busselton (Storrie et al. 2003). It was closed as a shipping port in 1972 and now serves primarily as a cultural and recreational resource (Busselton Jetty Inc. 2023). An underwater observatory was constructed at the end of the jetty in 2003, to provide access to the underwater environment for the general public (Busselton Jetty Inc. 2023). A no-fishing sanctuary area has been placed around the observatory since 2004 (Busselton Jetty Inc. 2023).
All experiments were performed according to the Australian Code of Practice for the care and use of animals for scientific purposes. This research was conducted with approval from the Curtin Animal Ethics Committee (ARE2018-20).
Survey equipment
Transect-based stereo-video techniques such as diver-operated stereo-video (DOV) and remotely operated vehicle (ROV) fitted with a stereo-video, are survey methods that can sample a large range of fish species while obtaining accurate length measurements (Baker et al. 2016; Sward et al. 2019; Schramm et al. 2020a, 2020b; Jessop et al. 2022). The stereo-DOV and stereo-ROV survey techniques are comparable methods that produce similar data (Baker et al. 2016; Sward et al. 2019; Schramm et al. 2020a, 2020b; Jessop et al. 2022). Our study used stereo-DOV for surveying under the jetty and stereo-ROV for the broader habitat surveys on the basis of time–depth limitations, health and safety considerations and cost effectiveness.
Busselton Jetty stereo-DOV sampling was conducted on 11 March 2022 (Fig. 1). DOV sampling was conducted by two scuba divers, as per the procedures outlined in Goetze et al. (2019). The stereo-DOV systems used two Sony FDR-X3000 cameras set at 1080p recording 60 frames s−1 to reduce motion blur, with medium field of view (FOV) to minimise motion parallax. The cameras had 800-mm separation with an inward convergence of 5°. Two divers swam the DOV transects simultaneously, one filming from above the seafloor and one following just behind filming mid-water, at approximately half the total depth of the jetty. Sampling began on the eastern side of the offshore section, where divers swam the DOVs north to the end of the jetty, then returned down the western side swimming south. Given this section is over twice the width of the rest of the jetty, transects could be collected from the eastern and western side, with no crossover. Once the jetty narrowed in the mid-shore and inshore sections, the divers swam down the centre of the jetty until depth became too shallow to continue (~2 m). In total, 37 transects of 25-m length were measured post hoc by using the site map, given the gap between each pile is 5 m.
Location of the Busselton Jetty and the natural reef, seagrass and sand sites in Geographe Bay, Western Australia, as well as the Ngari Capes Marine Park and the Commonwealth habitat-protection zone. The insert shows the defined inshore, mid-shore, and offshore zones at the jetty, as well as the sanctuary zone.
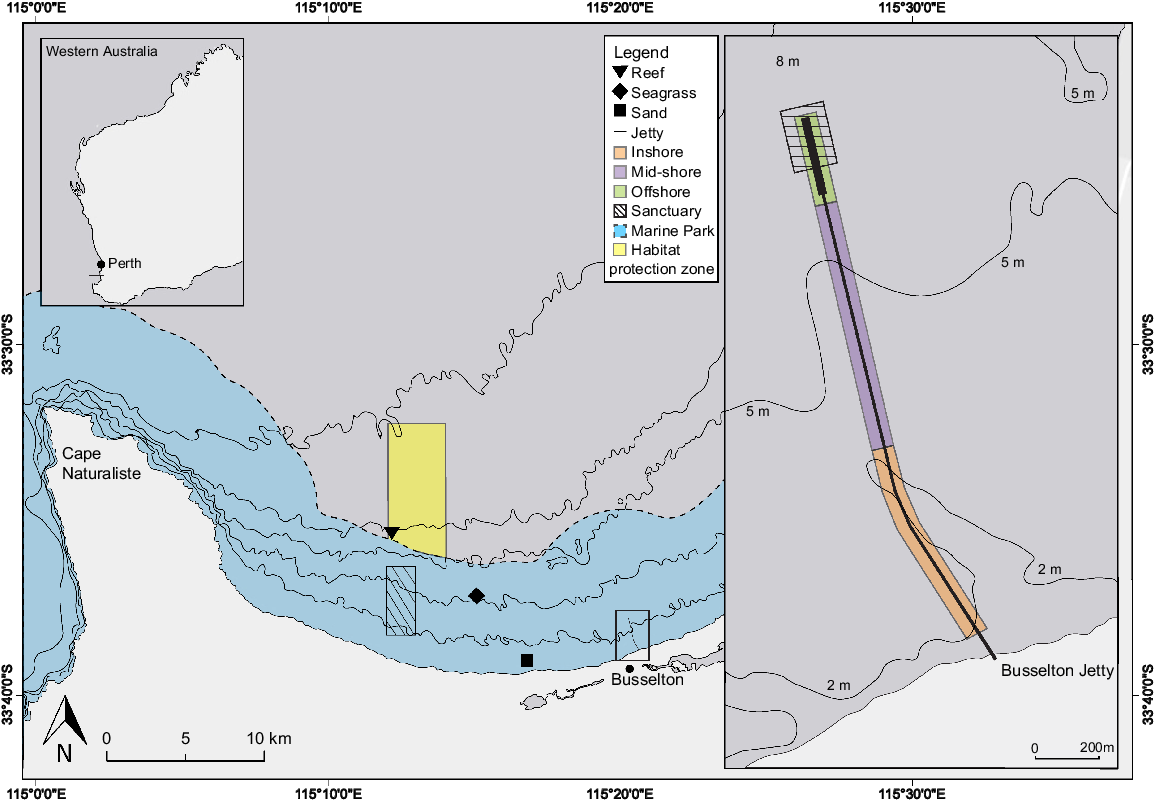
Stereo-ROV sampling was conducted within Geographe Bay on 29 April 2022 (Fig. 1). Surveys targeted the three prominent benthic habitats, namely, natural reef, seagrass and sand. All sampling was conducted between 0800 and 1500 hours to minimise diurnal variation in fish assemblages (Myers et al. 2016). ROV surveys were conducted using a Oceanbotics SRV-8 equipped with stereo-video system using two Sony FDR-X3000 cameras (set at 1080p, 60 frames s−1, medium FOV, 600-mm separation, 5° inward convergence) mounted to the vehicle (Harvey et al. 2010). A Seatrac Ultra Short Baseline positioning system (Seatrac X150 USBL and X010 Modem) was used for navigation and determining transect length. The USBL system had a range resolution of ±0.1 m and angular resolution of ~2% of the acoustic range (~1 m in this case). The USBL allowed the vessel skipper to idle ~50 m behind the ROV to minimise fish disturbance from the vessel. All sites except the natural reef fell within the general use zone of the Ngari Capes Marine Park, and the natural reef falls within a Commonwealth habitat-protection zone. Recreational fishing and boating activities and commercial fishing and boating activities, plus commercial fishing with an approval, are permitted inside both zones (Department of Environment and Conservation 2013; Director of National Parks 2018).
Each stereo-video system was calibrated before and after fieldwork by using the software CAL (ver. 4.10, SeaGIS, see https://www.seagis.com.au/bundle.html), following procedures outlined by Harvey and Shortis (1998). Identifications, counts and length measurements of fish were made using the software EventMeasure (ver. 6.23, SeaGIS, see https://www.seagis.com.au/event.html). Observed fish were counted and identified to the lowest taxonomic group possible. Measurements of fish length were limited to individuals within 8 m of the stereo-video system to ensure acceptable levels of accuracy and precision (Harvey et al. 2010). If an individual could not be measured, for example, owing to partial obscuration or angle facing the cameras, the mean length of the species at that habitat type was applied to the individual. Length measurements enabled the calculation of fish biomass from documented length–weight relationships (Wilson et al. 2018).
Habitat composition and complexity at the jetty were analysed using the software TransectMeasure (ver. 4.10, see https://www.seagis.com.au/transect.html). The habitat under the jetty was recorded at five points along each transect, by using a method similar to that outlined in Saunders et al. (2014) and Parker et al. (2019). These points were selected at ~5-m intervals, with the exact frame that was classified chosen when the forward-facing field of view was unobstructed. In this way, the classification of habitat was performed over a field of view of ~5-m depth, and avoided an overlap with the next frame to be classified. For each frame, 20 points were overlaid onto the portion of the frame that contained seabed. Under each point, the benthos was classified into the following broad substrate and morphology categories: consolidated or unconsolidated, sand, rock, boulder, cobbles, pebbles, jetty pile fallen, jetty pile standing and other man-made structure (derived from the CATAMI guide; Althaus et al. 2015). Benthic biota was defined as absent, or the broad groups of macroalgae, ascidian, sponge, seagrasses or turf mat. In determining the habitat complexity, each point was assigned a relief value by using a categorical scale from 0 to 5, where 0 was flat substrate, 1 had some relief features over mostly flat substrate, 2 had relief features among some flat substrate that might include single fallen jetty piles over sand, 3 had good relief structure that may include standing jetty piles or multiple fallen jetty piles, 4 had high structural complexity creating overhangs and caves that might include overlapping fallen or standing jetty piles, and 5 had exceptional structural complexity, including many caves and overhangs or multiple overlapping fallen and standing jetty piles over reef and rocks. Distance from shore and depth were determined using Navionics+ chart (see https://www.navionics.com/aus/navionics-plus-australia-west-7.html).
Experimental design
The jetty was divided post hoc into three sections, including inshore (depth ~3 m; 13 transects), mid-shore (depth ~5 m; 12 transects) and offshore (widest section of the jetty, depth ~7 m; 12 transects), on the basis of differences in distance from shore and habitat data (see the section above for detail on collection of these data). By using the permutational analysis of variance (PERMANOVA) approach, it is not necessary to have equal transect numbers as long as there are sufficient permutations (Anderson et al. 2008). A PERMANOVA (9999 permutations) on a Euclidian distance resemblance matrix confirmed that the habitats of the three sections were all significantly different from one another (PERMANOVA, MS = 30,425, pseudo-F(2,36) = 12.029, P < 0.001, P(pairwise) all < 0.001). A single-factor design of jetty section (fixed, three levels: inshore, mid-shore, offshore) enabled analysis of the changes of fish assemblages along the jetty. To determine the difference between sanctuary and non-sanctuary zones, a two-factor design was used. This design included status (fixed, two levels: sanctuary, non-sanctuary) and position in water column (fixed, two levels: mid-water, seafloor), with habitat as a fixed covariate.
The survey footage collected at each habitat was separated post hoc into 25- × 5-m transects with 10-m gaps between transects. This gave a total of 36 transects in reef and seagrass habitat, 37 transects at the jetty and 33 on sand. We used a one-factor PERMANOVA design to test for differences in the fish assemblages among habitats (fixed, four levels: jetty (benthic), reef, seagrass, sand).
Statistical analysis
Data analysis was performed using the Primer 7 software (ver. 7.0.21, see https://www.primer-e.com/software; Clarke and Gorley 2015) with the PERMANOVA+ add on (Anderson et al. 2008). Permutational analysis of multivariate dispersions (PERMDISP) showed that the raw data did not meet homogeneity of variance assumptions. A square-root transformation was applied to the datasets for each design, to sufficiently down-weight the influence of highly abundant species without transforming the data too severely.
To examine how assemblages changed along the length of the jetty, a PERMANOVA (9999 permutations) was performed on a Bray–Curtis similarity matrix of the square-root-transformed benthic jetty fish data with a dummy variable (+1) to account for transects where no fish were recorded (Clarke et al. 2006). Post hoc pairwise comparisons were used to confirm where significant differences existed. A distance-based linear regression model (DistLM) (Anderson and Robinson 2003) was used to test for the variation in fish assemblages explained by the habitat variables and distance along the jetty, by using the best selection procedure and the corrected Akaike information criterion (AICc) selection criteria (Sugiura 1978). A draftsman plot was used to examine whether any correlation among variables existed in the environmental covariates. There was a strong correlation between depth and distance along the jetty (0.943), so the variable depth was excluded from the analysis. The variables selected in the most parsimonious model were plotted using a distance-based redundancy analysis (dbRDA) (Anderson 2006).
Mid-water and benthic fish assemblage data were analysed to determine the difference in fish composition between the sanctuary and non-sanctuary zones at the jetty, given that many target species are pelagic in nature. To minimise the confounding effect of differences in habitat along the jetty, a cluster analysis identified four transects in the non-sanctuary zone most similar in habitat to those in the sanctuary zone. This was confirmed with a PERMANOVA (MS = 2197.3, pseudo-F(1,11) = 0.902, P = 0.333) that showed no significant difference in habitat between the chosen fishing and sanctuary sites. A PERMANOVA (9999 permutations) was performed on the fish assemblages of the selected sites, and where significant (P < 0.05) main effects occurred, pairwise tests were run. A non-metric multidimensional scaling (nMDS) plot enabled unconstrained data ordination and a canonical analysis of principal coordinates (CAP) enabled constrained ordination, both illustrating patterns and supporting the PERMANOVA results.
To test for differences in benthic fish composition between the jetty and natural habitats, a PERMANOVA (9999 permutations) on a Bray–Curtis similarity matrix with a + 1 dummy variable was constructed from square-root-transformed benthic jetty, reef, seagrass and sand fish data. A nMDS and CAP plot were used to illustrate the results. A SIMPER analysis was used to identify the species that best represented each habitat and the top species contributing to group differences were overlaid on the CAP plot.
For each research question, univariate analyses were conducted on the number of species, number of fish and biomass by using PERMANOVA on square-root-transformed Euclidean distance resemblance matrices. Where significant differences existed, post hoc pairwise tests were run, and means plots were created to illustrate the direction and magnitude of any differences.
Results
How do environmental variables such as habitat, distance from shore and depth influence fish assemblages along the jetty?
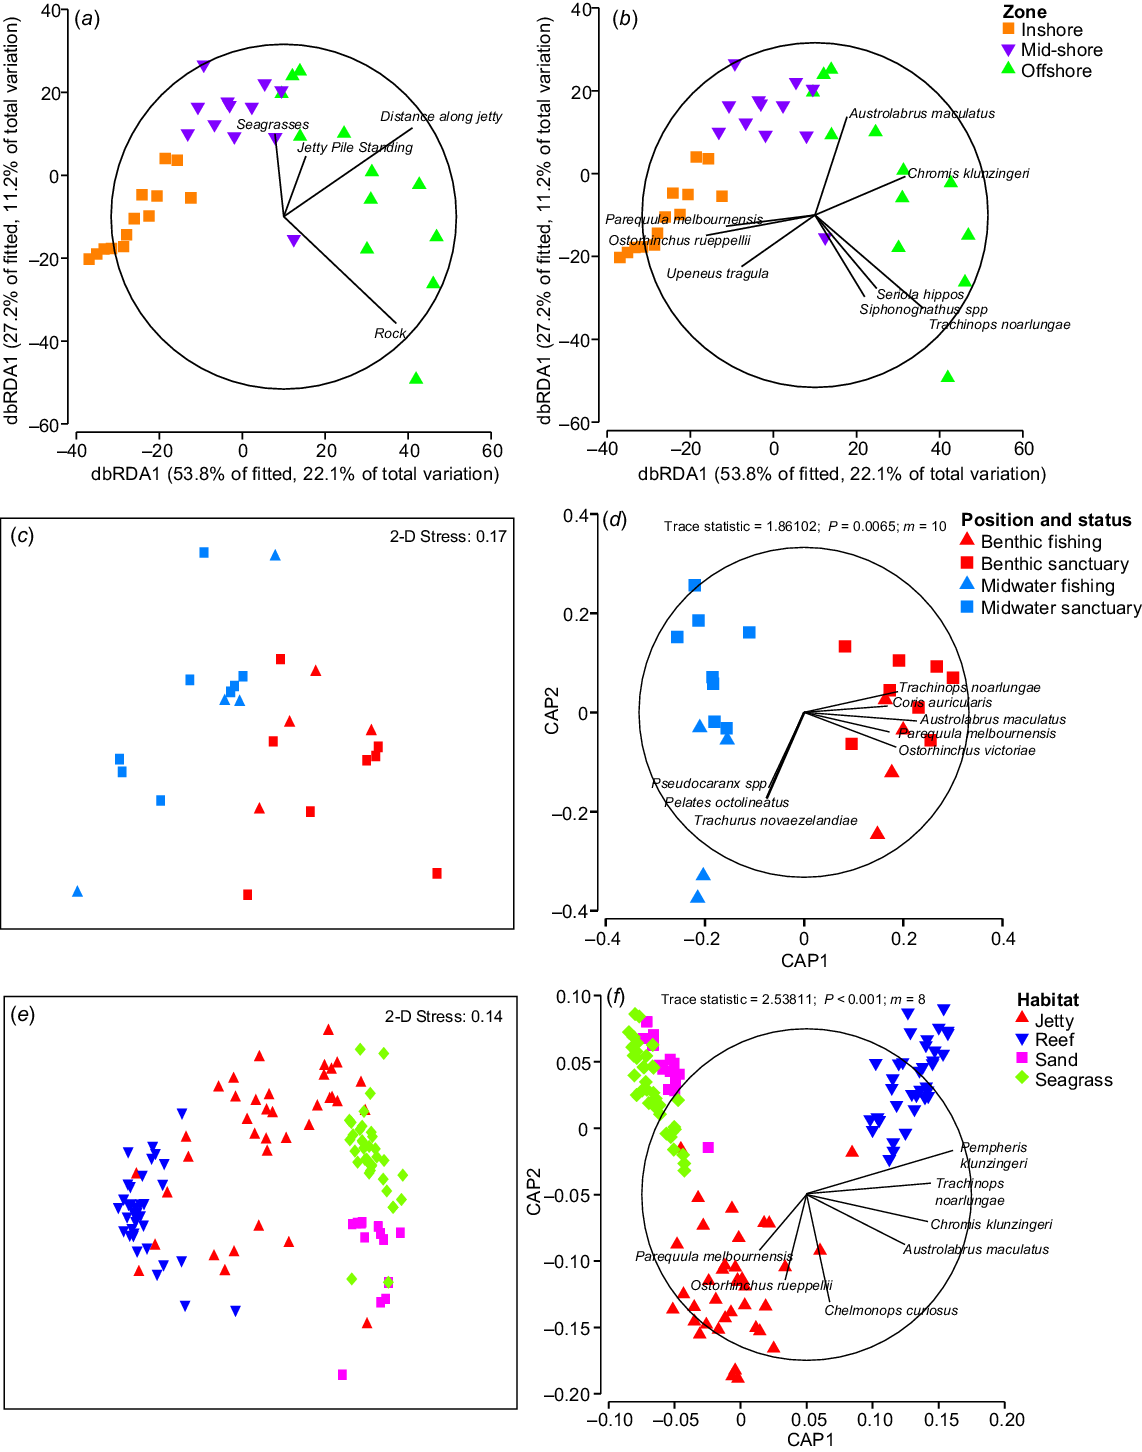
In total, 3498 fish from 50 species were identified across the 36 benthic jetty transects, and the total biomass of fish was 62.1 kg. Fish assemblages at the jetty differed among the defined inshore, mid-shore and offshore zones (PERMANOVA, MS = 15,169, pseudo-F(2,36) = 7.479, P < 0.001), with post hoc pairwise tests indicating that all zones were statistically different from each other (P < 0.01). The DistLM procedure identified the most parsimonious model to explain variation in the fish assemblage by using the predictor variables jetty pile (standing), rock, seagrass and distance along jetty (R2 = 0.411, AICc = 284.42). Each of these variables was significant (Table 1), explaining 7.37, 18.08, 6.98 and 21.04% of the variation in the fish assemblage respectively. Both the PERMANOVA and the DistLM indicated that distance along the jetty was a key driver of fish assemblage changes. The presence of rock and more standing piles distinguished the habitat at the end of the jetty, and seagrass was correlated with the mid-shore zone (Fig. 2a). Yellowhead hulafish (Trachinops noarlungae), samsonfish (Seriola hippos), weed whiting (Siphonognathus spp.), blackhead puller (Chromis klunzingeri) and blackspotted wrasse (Austrolabrus maculatus) were associated with the end of the jetty (Fig. 2b), and silverbelly (Parequula melbournensis), western gobbleguts (Ostorhinchus rueppellii) and bartail goatfish (Upeneus tragula) were associated with the inshore zone (Fig. 2b).
| Variable | SS (trace) | Pseudo-F | P | Proportion | |
|---|---|---|---|---|---|
| Standard deviation relief | 16,450 | 6.950 | <0.001 | 0.166 | |
| Boulder | 12,962 | 5.255 | <0.001 | 0.131 | |
| Cobbles | 12,071 | 4.844 | <0.001 | 0.122 | |
| Jetty pile fallen | 8423.1 | 3.244 | 0.004 | 0.085 | |
| Jetty pile standing | 7319.1 | 2.785 | 0.009 | 0.074 | |
| Man-made structure | 3212.9 | 1.170 | 0.283 | 0.032 | |
| Rock | 17,954 | 7.726 | <0.001 | 0.181 | |
| Sand and mud (coarse sand) | 5696.3 | 2.130 | 0.033 | 0.057 | |
| Sand and mud (fine sand) | 13,664 | 5.585 | <0.001 | 0.138 | |
| Ascidians | 6268.6 | 2.359 | 0.016 | 0.063 | |
| Macroalgae | 4185.5 | 1.540 | 0.126 | 0.042 | |
| Seagrasses | 6926.1 | 2.625 | 0.014 | 0.070 | |
| Sponges | 6834.6 | 2.587 | 0.010 | 0.069 | |
| Turf mat | 10,220 | 4.016 | <0.001 | 0.103 | |
| Distance along jetty | 20,898 | 9.330 | <0.001 | 0.210 |
Variables in bold were selected using best selection procedure and AICc selection criteria to best distinguish the fish assemblages.
(a, b) dbRDA ordinations of the jetty fish assemblage on the basis of the most parsimonious DistLM, using Bray–Curtis dissimilarity matrix on square-root-transformed data. (c–f) nMDS and CAP plots for the observed fish assemblages, using Bray–Curtis dissimilarity matrix on square-root transformed data, as assessed by (c, d) position (mid-water and benthic) and status (sanctuary and fishing) at the jetty (m = 10), and (e, f) habitat (jetty, reef, seagrass, sand) (m = 8). The overlaid vectors represent (a) the environmental explanatory variables selected by the model, (b, d) fish species with Pearson’s correlation of >0.5, and (f) focal fish species chosen by SIMPER analysis.
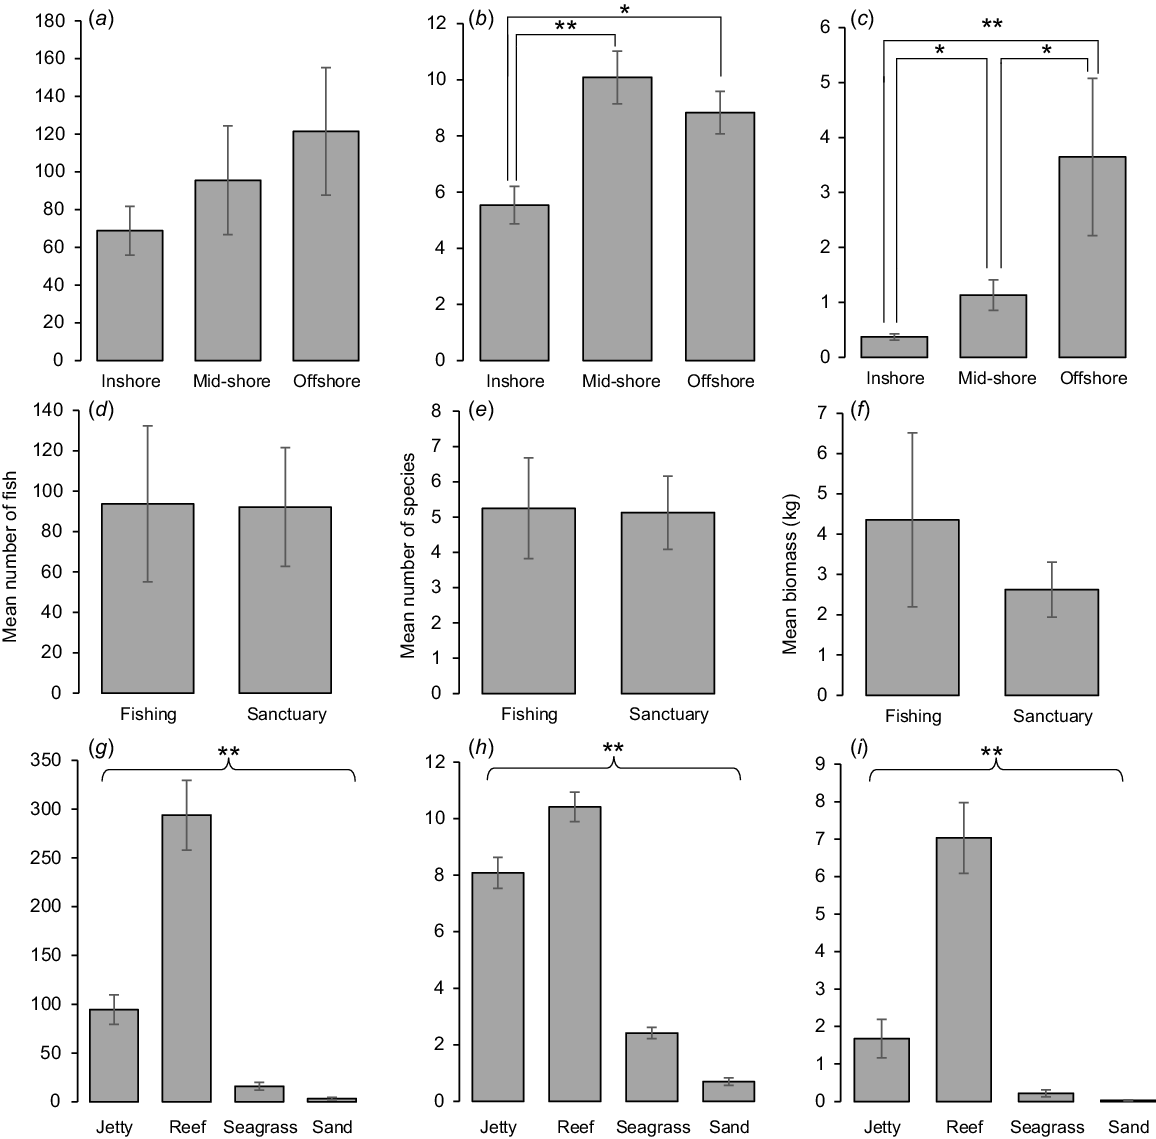
There was no significant difference in the number of fish among zones (PERMANOVA, MS = 11.604, pseudo-F(2,36) = 0.619, P = 0.547); however, means plots indicated that the number of fish trended upwards with distance from shore (Fig. 3a). The number of species (PERMANOVA, MS = 2.515, pseudo-F(2,36) = 9.67, P < 0.001) and biomass (PERMANOVA, MS = 3.681, pseudo-F = 9.44(2,36), P < 0.001) were significantly different among zones. Mid-shore and offshore zones recorded a similar number of species, both being greater than in the inshore zone (Fig. 3b), whereas biomass was greatest in the offshore zone, decreasing towards the shore (Fig. 3c).
Mean (±1 s.e.) number of fish (Column 1), number of species (Column 2), and biomass of fish (kg) (Column 3) per transect (25 × 5 m, 250 m2) for (a–c) distance along jetty (inshore, mid-shore, offshore), (d–f) jetty sanctuary status (fishing, sanctuary) and (g–i) artificial- and natural-habitat comparison (jetty, reef, seagrass, sand). Probabilities are significant (post hoc PERMANOVA pairwise tests) at: *, P < 0.05; **, P < 0.001. Brackets indicate that all sites are significantly different from each other.
How do fish assemblages differ between the sanctuary zone and non-sanctuary area at the jetty?
There was no significant interaction effect between sanctuary status and position in the water column (P = 0.591), and no difference in the fish assemblage composition between the sanctuary and fished zones (P = 0.409). However, there was a significant difference in the pelagic and benthic fish assemblages (PERMANOVA, MS = 10,591, pseudo-F(1,23) = 4.235, P < 0.001; Fig. 2c, d). A leave-one-out allocation success test confirmed the lack of difference between the sanctuary and fishing zones, with only 45.83% of transects being correctly identified. Schooling species such as trevally (Pseudocaranx spp.), western striped grunter (Helotes octolineatus) and yellowtail scad (Trachurus novaezelandiae) showed strong associations with the mid-water habitat and were correlated more towards the fishing transects (Fig. 2d). Reef-associated species such as T. noarlungae, western king wrasse (Coris auricularis), A. maculatus, P. melbournensis and western striped cardinalfish (Ostorhinchus victoriae) were strongly associated with the habitat across both the fishing and sanctuary zones (Fig. 2d).
There was no statistically significant difference in the number of fish (Fig. 3d), number of species (Fig. 3e) or biomass (Fig. 3f) between the sanctuary and non-sanctuary sites (PERMANOVA, MS = 3.527, pseudo-F(1,23) = 0.108, P = 0.747; PERMANOVA, MS = 0.056, pseudo-F(1,23) = 0.257, P = 0.620; PERMANOVA, MS = 440, pseudo-F(1,23) = 0.372, P = 0.553 respectively).
How do fish assemblages at the jetty compare with those in surrounding natural reef, sand and seagrass habitats?
In total, 14,755 fish were identified across all four habitats, with 70 different species being identified, and a total biomass of 324.0 kg. In total, 50 different species were identified at the jetty, 46 at the reef, 11 at the seagrass and 6 at the sand (Table A1). Across all habitats, 17 species were found only at the jetty, 17 found only at the reef and 1 found only at the seagrass (Table 2). All species identified were native to the region. Benthic fish assemblages differed among the jetty, natural reef, seagrass and sand (PERMANOVA, MS = 74,049, pseudo-F(3,141) = 53.15, P < 0.001), and post hoc pairwise tests indicated that all habitats were statistically different from each other (P < 0.001). A leave-one-out allocation success test confirmed these differences, allocating 96.48% of transects to the correct habitat. Of the four habitats, the jetty had the most misclassifications, with transects being allocated to reef and sand once respectively, and two transects being allocated to seagrass habitat. In both the CAP and the nMDS, the reef habitat was the most spatially distinct and there was similarity between the sand and seagrass habitats (Fig. 2e, f). In the unconstrained nMDS, the jetty samples visually overlapped with all three natural habitats (Fig. 2e).
| Jetty | Reef | Seagrass | |
|---|---|---|---|
| Aracana aurita | Bodianus frenchii | Sphyraena novaehollandiae | |
| Arripis georgianus | Centroberyx gerrardi | ||
| Cheilodactylus gibbosus | Centroberyx lineatus | ||
| Diodon nicthemerus | Dactylophora nigricans | ||
| Dotalabrus aurantiacus | Epinephelides armatus | ||
| Hypoplectrodes nigroruber | Eubalichthys cyanoura | ||
| Microcanthus strigatus | Meuschenia flavolineata | ||
| Neoodax balteatus | Meuschenia hippocrepis | ||
| Omegophora armilla | Neatypus obliquus | ||
| Parapercis haackei | Nemadactylus valenciennesi | ||
| Helotes octolineatus | Omegophora cyanopunctata | ||
| Pentapodus vitta | Othos dentex | ||
| Rhabdosargus sarba | Paraplesiops meleagris | ||
| Scobinichthys spp. | Parapriacanthus elongatus | ||
| Sillaginodes punctatus | Parma victoriae | ||
| Siphonognathus spp. | Pseudolabrus biserialis | ||
| Upeneus tragula | Tilodon sexfasciatus |
There were no species unique to sand habitat.
SIMPER analysis identified species with the highest contribution to the dissimilarity among habitats (Table 3). When these selected species were overlaid on the CAP, it became evident that species differentiating the seagrass and sand habitats (P. melbournensis and O. rueppellii respectively) were also strongly associated with the jetty (Fig. 2f, Table 3). Species such as T. noarlungae, C. klunzingeri and A. maculatus had strong positive correlations towards both jetty and reef habitats (Fig. 2f, Table 3), and were found in high abundances at both habitats. Rough bullseye (Pempheris klunzingeri) was most strongly associated with the natural reef (Fig. 2f, Table 3) and was in high abundance there.
| Habitat | Average similarity | Species | Average abundance | Average similarity | Similarity/standard deviation | Contribution percentage | |
|---|---|---|---|---|---|---|---|
| Jetty | 28.00 | Ostorhinchus rueppellii | 3.43 | 9.85 | 0.76 | 35.17 | |
| Chromis klunzingeri | 2.07 | 4.53 | 0.69 | 16.17 | |||
| Parequula melbournensis | 1.46 | 3.82 | 0.76 | 13.63 | |||
| Austrolabrus maculatus | 0.81 | 1.77 | 0.58 | 6.32 | |||
| Reef | 55.71 | Trachinops noarlungae | 11.6 | 21.75 | 1.58 | 39.03 | |
| Pempheris klunzingeri | 6.79 | 14.9 | 3.05 | 26.74 | |||
| Chromis klunzingeri | 4.11 | 6.82 | 1.24 | 12.25 | |||
| Sand | 13.95 | Parequula melbournensis | 0.76 | 13.23 | 0.5 | 94.89 | |
| Seagrass | 47.00 | Ostorhinchus rueppellii | 2.41 | 37.28 | 1.84 | 79.33 |
The number of fish, number of species and biomass all differed among habitats (PERMANOVAMS = 1582.4, pseudo-F(3,141) = 108.5, P < 0.001; PERMANOVA(3,141), MS = 49.32, pseudo-F = 167.4, P < 0.001; PERMANOVA, MS = 40.70, pseudo-F(3,141) = 96.7, P < 0 .001 respectively). The pattern was consistent across all habitats and measures. Reef habitat had the greatest number of fish, number of species and mean biomass, followed by the jetty, seagrass and sand habitats (Fig. 3g, i).
Discussion
Hobbs et al. (2006) proposed that human-induced changes to marine environments can create novel ecosystems, whereby species occur in combinations and abundances unique from equivalent undisturbed environments. The fish assemblage of the Busselton Jetty differed from that of the surrounding natural habitats, which aligns with jetty and pier research across different ecosystems and regions (Duffy-Anderson et al. 2003; Clynick et al. 2008; Munsch et al. 2014; Pereira et al. 2017; Bonnici et al. 2018). This pattern also aligns with broader artificial reef research, where fish assemblages on oil and gas infrastructure (Love et al. 2019; Schramm et al. 2021; Madgett et al. 2023), breakwaters (Burt et al. 2011, 2013), shipwrecks (Arena et al. 2007) and purpose-designed artificial reefs (Carr and Hixon 1997; Thanner et al. 2006; Granneman and Steele 2015; Folpp et al. 2020) have been shown to differ from those in nearby natural habitats. Although the mean number of individual fish, biomass of fish and mean number of species were all lower at the jetty than at the natural reef, they were higher than in both the seagrass and the sand, and the jetty overall recorded the highest number of different species, supporting the notion that this structure supports a distinctive and biodiverse ecosystem. The key drivers in the differences between the artificial and natural habitats are the direct and indirect effects of habitat complexity, shading, vertical relief, distance from shore and depth.
Structural complexity is a key determinant of fish community composition (Perkol-Finkel et al. 2006; Granneman and Steele 2015; Richardson et al. 2017; Ferrari et al. 2018) and has been linked to increases in fish abundance, biomass, species richness and diversity (Harman et al. 2003; Hall and Kingsford 2021). The natural reef wall, although being similar to the jetty in its linearity, had more complex and varied habitat structures, offering crevices, caves and overhangs in a variety of sizes, which created shelter for a diversity of prey species and juvenile fish (Gratwicke and Speight 2005; Komyakova et al. 2013; Hall and Kingsford 2021). Although the jetty had some low-complexity rocky reef and reef-like attributes such as overlapping fallen piles, creating cave-like structures and fallen piles and standing piles, creating vertical relief, this form of structural complexity offers fewer microhabitats and niches (Chapman and Underwood 2011). This influences the presence and abundance of species dependent on these habitat types for shelter (Clynick et al. 2008). This was exemplified by the presence of ledge- and cave-associated species at the reef, such as southern blue devil (Paraplesiops meleagris), foxfish (Bodianus frenchii) and harlequin fish (Othos dentex), that were not found at the jetty. The reef also had higher abundances of reef-associated planktivores (e.g. P. klunzingeri and C. klunzingeri), whose conversion of planktonic energy is a key process for fish production (Pinnegar et al. 2007; Champion et al. 2015). Gratwicke and Speight (2005) identified that a heterogeneous environment with a variety of living growth forms, such as corals, invertebrates and seagrasses, supports greater fish diversity. The sand, seagrass and reef-like habitats found under the jetty have a variety of growth forms and provide niches for different fish species and life stages (Guidetti 2000; Gillanders et al. 2003; Hall and Kingsford 2021). This explains the jetty’s high species diversity and the overlap between the jetty’s fish assemblage and all three nearby natural habitats. Additionally, the jetty piles provide hard substrate for the growth of high abundances of sessile epibiota, including bryozoans, sponges and ascidians, whereas shading under the jetty limits the growth of macroalgae, which is dominant on rocky reefs (Kay and Keough 1981; Glasby 1999a, 1999b). This unique combination of epifauna influences primary production, food availability and, subsequently, the abundances of certain fishes (Gili and Coma 1998). Additionally, epibiota growing on piles can sustain more fish through the entire water column (Harman et al. 2003; Fabi et al. 2004; Wilhelmsson et al. 2006). Intense, consistent shading at wide jetties has been shown to impede the foraging of visually-feeding fish, thus limiting their presence (Able et al. 2013; Munsch et al. 2014; Grothues et al. 2016). However, the narrowness of the Busselton Jetty (maximum ~14 m wide), and its north–south orientation, mean that no one area is permanently shaded. Therefore, it is unlikely that shading had any limiting effect on the presence of visually-feeding fish species.
In addition to differences in habitat structure and complexity, differences in the recorded fish assemblage between the natural reef habitat and jetty may have been driven by depth and distance from shore. Across areas of similar substrate and habitat complexity, Bach et al. (2019) identified that fish assemblages changed with depth among shallow temperate reef lines (depth range of 3–23 m), with increases in species richness and abundance further offshore. Trophic status and biology can determine the presence of species at different depths as resources can change across depth gradients (Bell 1983; Bach et al. 2019). It is possible that some species found only at the natural reef site (~20-m depth) have a niche preference for deeper water, and thus the jetty (maximum ~8-m depth) would prove too shallow even if its habitat were suitable, and vice versa. The accessibility and closeness to shore of the jetty are also likely to result in a higher fishing pressure than in the natural reef, which can directly affect the abundance and biomass of targeted fishing species (Langlois et al. 2012). Targeted demersal species such as the baldchin groper (Choerodon rubescens) were in much larger abundances at the natural reef than at the jetty, even within the sanctuary zone. Geographe Bay is generally protected from strong wave and current energy, particularly in autumn when the data were collected, but given the jetty traverses the water column and is further inshore than the natural sites, it is inherently more exposed to wave energy and wind-driven surface currents. Whereas this increased water movement may have contributed to the jetty’s lower species abundance and diversity (Layman 2000; Watt-Pringle and Strydom 2003), research still suggests that habitat is a much more influential driver (Borland et al. 2017).
Fish assemblages also varied along the length of the Busselton Jetty. To our knowledge, this is the first study that has identified changes in fish assemblages along the length of a jetty, although Butler and Connolly (1999) identified significant differences in sessile marine invertebrate assemblages at sites along a jetty. The increase in distance from shore, and the subsequent increase in depth, would primarily mediate habitat and epibenthos at this scale (Bach et al. 2019). Consequently, habitat type, and the inherent changes in the associated structural complexity, were the most important driver of assemblage changes. Habitat changed from sand and patchy seagrass at the inshore zone, to more consistent seagrass beds and fallen piles at the mid-shore zone, to rocky reef with fallen and standing piles at the offshore zone. Sand, seagrass and rocky reef differ in their complexity and the types of species and life stages to which they offer food and shelter, so that as these habitats changed under the jetty, so too did the fish assemblages (Guidetti 2000). More complex habitats increase the availability of food and refuge sites (Hackradt et al. 2011; Komyakova et al. 2013), explaining the trend of increasing number and biomass of fish with distance along the jetty (Komyakova et al. 2013; Richardson et al. 2017; Ferrari et al. 2018). The presence of rock served as the biggest differentiating factor of the offshore zone, and in combination with fallen and standing piles, it provided the highest structural complexity and available hard substrate for epibenthic attachment across the defined zones. As a result, the offshore zone supported a higher number, diversity and biomass of fish. The mid-shore zone, which served as the transition between seagrass and reef, offered a variety of habitat types that supported high species diversity (Harman et al. 2003; Gratwicke and Speight 2005). Although the close proximity of spatially small, but distinct, habitats may limit the capacity of the jetty to support very high abundances of fish species, it does serve to increase overall heterogeneity and connectivity of the fish assemblages (Olds et al. 2016; Rees et al. 2018). Both juvenile and adult forms of many species were present at the jetty, including C. auricularis, redband wrasse (Pseudolabrus biserialis) and McCulloch’s scalyfin (Parma mccullochi), suggesting that some fish may actively recruit to the jetty as juveniles, whereas others may move there as adults from nearby natural habitats. Given that many fish utilise different habitats during different life stages (Gillanders et al. 2003), the high connectivity among habitats under the jetty may facilitate important life-history functions and contribute to the overall productivity and resilience of the jetty (Sheaves 2009; Olds et al. 2016).
The sanctuary zone at the end of the jetty had no significant effect on its overall fish assemblages, biomass, number of fish or number of species. The zone has been established for 20 years; therefore, any impact of protection on target fishing species would be expected to be apparent in the overall comparison with the fished area (Edgar and Stuart-Smith 2009; Grorud-Colvert et al. 2021). Despite the high level of protection it offers, which typically promotes more successful ecological outcomes, it is likely that the small size of the zone and its proximity to frequently fished waters limited its overall capacity to protect the target fishing species (Grorud-Colvert et al. 2021). MPA effectiveness is dependent on the establishment of realistic goals (Claudet and Pelletier 2004). The no-fishing zone was placed around the end of the jetty to protect its social values, because the underwater observatory is located there and majority of scuba diving occurs in this area, and the zone is successful in achieving this. Small sanctuary zones do not provide consistent protection for large-bodied target species with broad home ranges (McLaren et al. 2015). Given the sanctuary zone is adjacent to one of the most popular inshore fishing spots in the south-western region, it is highly likely that target species will cross the boundary of the sanctuary zone into the fishing-permitted area of the jetty. Because the greatest abundances of high-risk fished species in south-western Australia are found in deeper water (Langlois et al. 2012), a bigger sanctuary zone at the offshore reef may prove more effective for these types of species (Claudet et al. 2008). However, the jetty sanctuary may be more effective at protecting smaller-bodied species with smaller home ranges (McLaren et al. 2015; Di Franco et al. 2018), many of which inhabit the jetty and contribute to the social value in the underwater observatory. Although there was no measurable effect of protection of this small sanctuary zone, it is possible that fully protected jetties could provide important marine conservation value.
This study has highlighted the potential of jetties, piers and other MMSs to contribute to the ecology of a system. The configuration of jetties makes it unlikely that their fish assemblages will ever emulate those of a nearby natural reef. However, there are strategies that may help maximise their ecological output and mitigate any potential negative effects (Chapman and Underwood 2011). The design and placement of MMSs should take material, size, complexity and spatial configurations into consideration in a region-specific context (Morris et al. 2018; Lemoine et al. 2019). Engineered structures that provide holes, crevices, overhangs and caves to increase structural complexity and provide additional hard substrate for epibenthic attachment can support increased fish diversity, abundance and biomass at otherwise topographically simple MMSs (Hunter and Sayer 2009; Champion et al. 2015). Because boat access is heavily regulated and limited at the Busselton Jetty, this management approach may also facilitate positive outcomes for MMSs aiming to improve their ecological value (Whitfield and Becker 2014). Yet, not all environments will respond in the same way to the installation of artificial structures (Chapman and Underwood 2011), so ongoing monitoring and adaptive management are essential to ensure that the outcomes of the structure align with its initial ecological goals (Baine 2001; Morris et al. 2018).
Conclusions
The Busselton Jetty is a prime example of how, when managed with a multifaceted approach, MMSs can provide socioeconomic value beyond that of its initial purpose for construction. We have illustrated that it supports a distinctive fish assemblage, high species diversity and variety of benthic communities. Together these values have made it a renowned tourism destination for recreational activities such as snorkelling, scuba-diving and fishing, and the underwater observatory increases accessibility to these distinct marine assemblages.
Data availability
The data used in this study can be made available upon request to the corresponding author.
Declaration of funding
This research was funded through a fieldwork support scholarship to M. S. Scanlon from the Busselton Jetty Environment Foundation.
Acknowledgements
We acknowledge the Wardandi people, traditional custodians of the area in which this study took place.
References
Able KW, Grothues TM, Kemp IM (2013) Fine-scale distribution of pelagic fishes relative to a large urban pier. Marine Ecology Progress Series 476, 185-198.
| Crossref | Google Scholar |
Airoldi L, Turon X, Perkol-Finkel S, Rius M (2015) Corridors for aliens but not for natives: effects of marine urban sprawl at a regional scale. Diversity and Distributions 21, 755-768.
| Crossref | Google Scholar |
Althaus F, Hill N, Ferrari R, Edwards L, Przeslawski R, Schönberg CHL, Stuart-Smith R, Barrett N, Edgar G, Colquhoun J, Tran M, Jordan A, Rees T, Gowlett-Holmes K (2015) A standardised vocabulary for identifying benthic biota and substrata from underwater imagery: the CATAMI classification scheme. PLoS ONE 10, e0141039.
| Crossref | Google Scholar |
Ambrose RF, Swarbrick SL (1989) Comparison of fish assemblages on artificial and natural reefs off the coast of southern California. Bulletin of Marine Science 44, 718-733.
| Google Scholar |
Anderson MJ (2006) Distance-based tests for homogeneity of multivariate dispersions. Biometrics 62, 245-253.
| Crossref | Google Scholar | PubMed |
Anderson MJ, Robinson J (2003) Generalized discriminant analysis based on distances. Australian & New Zealand Journal of Statistics 45, 301-318.
| Crossref | Google Scholar |
Arena PT, Jordan LKB, Spieler RE (2007) Fish assemblages on sunken vessels and natural reefs in southeast Florida, USA. Hydrobiologia 580, 157-171.
| Crossref | Google Scholar |
Ashley MC, Mangi SC, Rodwell LD (2014) The potential of offshore windfarms to act as marine protected areas – a systematic review of current evidence. Marine Policy 45, 301-309.
| Crossref | Google Scholar |
Bach LL, Saunders BJ, Newman SJ, Holmes TH, Harvey ES (2019) Cross and long-shore variations in reef fish assemblage structure and implications for biodiversity management. Estuarine, Coastal and Shelf Science 218, 246-257.
| Crossref | Google Scholar |
Baine M (2001) Artificial reefs: a review of their design, application, management and performance. Ocean & Coastal Management 44, 241-259.
| Crossref | Google Scholar |
Baker DGL, Eddy TD, McIver R, Schmidt AL, Thériault M-H, Boudreau M, Courtenay SC, Lotze HK (2016) Comparative analysis of different survey methods for monitoring fish assemblages in coastal habitats. PeerJ 4, e1832.
| Crossref | Google Scholar |
Becker A, Taylor MD, Folpp H, Lowry MB (2018) Managing the development of artificial reef systems: the need for quantitative goals. Fish and Fisheries 19, 740-752.
| Crossref | Google Scholar |
Becker A, Taylor M, Folpp H, Lowry M (2022) Revisiting an artificial reef after 10 years: what has changed and what remains the same? Fisheries Research 249, 106261.
| Crossref | Google Scholar |
Belhassen Y, Rousseau M, Tynyakov J, Shashar N (2017) Evaluating the attractiveness and effectiveness of artificial coral reefs as a recreational ecosystem service. Journal of Environmental Management 203, 448-456.
| Crossref | Google Scholar |
Bell JD (1983) Effects of depth and marine reserve fishing restrictions on the structure of a rocky reef fish assemblage in the north-western Mediterranean Sea. Journal of Applied Ecology 20, 357-369.
| Crossref | Google Scholar |
Bellchambers LM, Smith KD, Harris D (2006) An assessment of the blue swimmer crab fishery in Geographe Bay. Fisheries research report number 158. (Department of Fisheries, Perth, Western Australia: Perth, WA, Australia) Available at https://www.fish.wa.gov.au/documents/research_reports/frr158.pdf
Bonnici L, Borg JA, Evans J, Lanfranco S, Schembri PJ (2018) Of rocks and hard places: comparing biotic assemblages on concrete jetties versus natural rock along a microtidal Mediterranean shore. Journal of Coastal Research 345, 1136-1148.
| Crossref | Google Scholar |
Borland HP, Schlacher TA, Gilby BL, Connolly RM, Yabsley NA, Olds AD (2017) Habitat type and beach exposure shape fish assemblages in the surf zones of ocean beaches. Marine Ecology Progress Series 570, 203-211.
| Crossref | Google Scholar |
Burt J, Bartholomew A, Sale PF (2011) Benthic development on large-scale engineered reefs: a comparison of communities among breakwaters of different age and natural reefs. Ecological Engineering 37, 191-198.
| Crossref | Google Scholar |
Burt JA, Feary DA, Cavalcante G, Bauman AG, Usseglio P (2013) Urban breakwaters as reef fish habitat in the Persian Gulf. Marine Pollution Bulletin 72, 342-350.
| Crossref | Google Scholar |
Busselton Jetty Inc. (2023) The Jetty – timeline. Available at https://www.busseltonjetty.com.au/jetty-history/jetty-timeline/
Butler AJ, Connolly RM (1999) Assemblages of sessile marine invertebrates: still changing after all these years? Marine Ecology Progress Series 182, 109-118.
| Crossref | Google Scholar |
Carr MH, Hixon MA (1997) Artificial reefs: the importance of comparisons with natural reefs. Fisheries 22, 28-33.
| Crossref | Google Scholar |
Champion C, Suthers IM, Smith JA (2015) Zooplanktivory is a key process for fish production on a coastal artificial reef. Marine Ecology Progress Series 541, 1-14.
| Crossref | Google Scholar |
Chan KMA, Shaw MR, Cameron DR, Underwood EC, Daily GC (2006) Conservation planning for ecosystem services. PLoS Biology 4, e379.
| Crossref | Google Scholar | PubMed |
Chapman MG, Underwood AJ (2011) Evaluation of ecological engineering of ‘armoured’ shorelines to improve their value as habitat. Journal of Experimental Marine Biology and Ecology 400, 302-313.
| Crossref | Google Scholar |
Clarke KR, Somerfield PJ, Chapman MG (2006) On resemblance measures for ecological studies, including taxonomic dissimilarities and a zero-adjusted Bray–Curtis coefficient for denuded assemblages. Journal of Experimental Marine Biology and Ecology 330, 55-80.
| Crossref | Google Scholar |
Claudet J, Pelletier D (2004) Marine protected areas and artificial reefs: a review of the interactions between management and scientific studies. Aquatic Living Resources 17, 129-138.
| Crossref | Google Scholar |
Claudet J, Osenberg CW, Benedetti-Cecchi L, Domenici P, García-Charton J-A, Pérez-Ruzafa Á, Badalamenti F, Bayle-Sempere J, Brito A, Bulleri F, Culioli J-M, Dimech M, Falcón JM, Guala I, Milazzo M, Sánchez-Meca J, Somerfield PJ, Stobart B, Vandeperre F, Valle C, Planes S (2008) Marine reserves: size and age do matter. Ecology Letters 11, 481-489.
| Crossref | Google Scholar |
Clynick BG, Chapman MG, Underwood AJ (2008) Fish assemblages associated with urban structures and natural reefs in Sydney, Australia. Austral Ecology 33, 140-150.
| Crossref | Google Scholar |
Cvitanovic C, Mackay M, Kelly R, Wilson SK, Waples K, Nash KL, van Putten EI, Field S, Botterill-James T, Austin BJ, Beckley LE, Boschetti F, Depczynski M, Dobbs RJ, Evans RD, Feng M, Goater RK, Halford AR, Kendrick A, Kendrick GA, Lincoln GDB, Ludgerus LJ, Lowe RJ, McMahon K, Munro JK, Newman SJ, Nutt C, Pearson L, O’Leary MJ, Richards ZT, Robbins WD, Rogers DI, Salgado Kent CP, Schoepf V, Travers MJ, Thums M, Tucker AD, Underwood JN, Whiting S, Mathews D (2021) Thirty critical research needs for managing an ecologically and culturally unique remote marine environment: the Kimberley region of Western Australia. Ocean & Coastal Management 212, 105771.
| Crossref | Google Scholar |
Dafforn KA, Glasby TM, Airoldi L, Rivero NK, Mayer-Pinto M, Johnston EL (2015) Marine urbanization: an ecological framework for designing multifunctional artificial structures. Frontiers in Ecology and the Environment 13, 82-90.
| Crossref | Google Scholar |
Department of Environment and Conservation (2013) Ngari Capes management plan 2013–2023, Management plan number 74. (Department of Environment and Conservation: Perth, WA, Australia) Available at https://www.dbca.wa.gov.au/management/plans/ngari-capes-marine-park
Di Franco A, Plass-Johnson JG, Di Lorenzo M, Meola B, Claudet J, Gaines SD, García-Charton JA, Giakoumi S, Grorud-Colvert K, Hackradt CW, Micheli F, Guidetti P (2018) Linking home ranges to protected area size: the case study of the Mediterranean Sea. Biological Conservation 221, 175-181.
| Crossref | Google Scholar |
Director of National Parks (2018) South-west Marine Parks network management plan 2018. (Director of National Parks: Canberra, ACT, Australia) Available at https://parksaustralia.gov.au/marine/parks/south-west/plans/
Duarte CM, Pitt KA, Lucas CH, Purcell JE, Uye S-I, Robinson K, Brotz L, Decker MB, Sutherland KR, Malej A, Madin L, Mianzan H, Gili J-M, Fuentes V, Atienza D, Pagés F, Breitburg D, Malek J, Graham WM, Condon RH (2013) Is global ocean sprawl a cause of jellyfish blooms? Frontiers in Ecology and the Environment 11, 91-97.
| Crossref | Google Scholar |
Duffy-Anderson JT, Manderson JP, Able KW (2003) A characterization of juvenile fish assemblages around man-made structures in the New York–New Jersey Harbor estuary, USA. Bulletin of Marine Science 72, 877-889.
| Google Scholar |
Edgar GJ, Stuart-Smith RD (2009) Ecological effects of marine protected areas on rocky reef communities – a continental-scale analysis. Marine Ecology Progress Series 388, 51-62.
| Crossref | Google Scholar |
Elrick-Barr CE, Zimmerhackel JS, Hill G, Clifton J, Ackermann F, Burton M, Harvey ES (2022) Man-made structures in the marine environment: a review of stakeholders’ social and economic values and perceptions. Environmental Science & Policy 129, 12-18.
| Crossref | Google Scholar |
Fabi G, Grati F, Puletti M, Scarcella G (2004) Effects on fish community induced by installation of two gas platforms in the Adriatic Sea. Marine Ecology Progress Series 273, 187-197.
| Crossref | Google Scholar |
Ferrari R, Malcolm HA, Byrne M, Friedman A, Williams SB, Schultz A, Jordan AR, Figueira WF (2018) Habitat structural complexity metrics improve predictions of fish abundance and distribution. Ecography 41, 1077-1091.
| Crossref | Google Scholar |
Florisson JH, Tweedley JR, Walker THE, Chaplin JA (2018) Reef vision: a citizen science program for monitoring the fish faunas of artificial reefs. Fisheries Research 206, 296-308.
| Crossref | Google Scholar |
Folpp HR, Schilling HT, Clark GF, Lowry MB, Maslen B, Gregson M, Suthers IM (2020) Artificial reefs increase fish abundance in habitat-limited estuaries. Journal of Applied Ecology 57, 1752-1761.
| Crossref | Google Scholar |
Fowler AM, Booth DJ (2013) Seasonal dynamics of fish assemblages on breakwaters and natural rocky reefs in a temperate estuary: consistent assemblage differences driven by sub-adults. PLoS ONE 8, e75790.
| Crossref | Google Scholar |
Gili J-M, Coma R (1998) Benthic suspension feeders: their paramount role in littoral marine food webs. Trends in Ecology & Evolution 13, 316-321.
| Crossref | Google Scholar |
Gillanders BM, Able KW, Brown JA, Eggleston DB, Sheridan PF (2003) Evidence of connectivity between juvenile and adult habitats for mobile marine fauna: an important component of nurseries. Marine Ecology Progress Series 247, 281-295.
| Crossref | Google Scholar |
Glasby TM (1999a) Differences between subtidal epibiota on pier pilings and rocky reefs at marinas in Sydney, Australia. Estuarine, Coastal and Shelf Science 48, 281-290.
| Crossref | Google Scholar |
Glasby TM (1999b) Effects of shading on subtidal epibiotic assemblages. Journal of Experimental Marine Biology and Ecology 234, 275-290.
| Crossref | Google Scholar |
Goetze JS, Bond T, McLean DL, Saunders BJ, Langlois TJ, Lindfield S, Fullwood LAF, Driessen D, Shedrawi G, Harvey ES (2019) A field and video analysis guide for diver operated stereo-video. Methods in Ecology and Evolution 10, 1083-1090.
| Crossref | Google Scholar |
Granneman JE, Steele MA (2015) Effects of reef attributes on fish assemblage similarity between artificial and natural reefs. ICES Journal of Marine Science 72, 2385-2397.
| Crossref | Google Scholar |
Gratwicke B, Speight MR (2005) The relationship between fish species richness, abundance and habitat complexity in a range of shallow tropical marine habitats. Journal of Fish Biology 66, 650-667.
| Crossref | Google Scholar |
Grorud-Colvert K, Sullivan-Stack J, Roberts C, Constant V, Horta E Costa B, Pike EP, Kingston N, Laffoley D, Sala E, Claudet J, Friedlander AM, Gill DA, Lester SE, Day JC, Gonçalves EJ, Ahmadia GN, Rand M, Villagomez A, Ban NC, Gurney GG, Spalding AK, Bennett NJ, Briggs J, Morgan LE, Moffitt R, Deguignet M, Pikitch EK, Darling ES, Jessen S, Hameed SO, Di Carlo G, Guidetti P, Harris JM, Torre J, Kizilkaya Z, Agardy T, Cury P, Shah NJ, Sack K, Cao L, Fernandez M, Lubchenco J (2021) The MPA guide: a framework to achieve global goals for the ocean. Science 373, eabf0861.
| Crossref | Google Scholar |
Grossman GD, Jones GP, Seaman WJ (1997) Do artificial reefs increase regional fish production? A review of existing data. Fisheries 22, 17-23.
| Crossref | Google Scholar |
Grothues TM, Rackovan JL, Able KW (2016) Modification of nektonic fish distribution by piers and pile fields in an urban estuary. Journal of Experimental Marine Biology and Ecology 485, 47-56.
| Crossref | Google Scholar |
Guidetti P (2000) Differences among fish assemblages associated with nearshore Posidonia oceanica seagrass beds, rocky–algal reefs and unvegetated sand habitats in the Adriatic Sea. Estuarine, Coastal and Shelf Science 50, 515-529.
| Crossref | Google Scholar |
Hackradt CW, Félix-Hackradt FC, García-Charton JA (2011) Influence of habitat structure on fish assemblage of an artificial reef in southern Brazil. Marine Environmental Research 72, 235-247.
| Crossref | Google Scholar |
Hall AE, Kingsford MJ (2021) Habitat type and complexity drive fish assemblages in a tropical seascape. Journal of Fish Biology 99(4), 1364-1379.
| Crossref | Google Scholar |
Hammar L, Perry D, Gullström M (2016) Offshore wind power for marine conservation. Open Journal of Marine Science 06, 66-78.
| Crossref | Google Scholar |
Harman N, Harvey ES, Kendrick GA (2003) Differences in fish assemblages from different reef habitats at Hamelin Bay, south-western Australia. Marine and Freshwater Research 54, 177-184.
| Crossref | Google Scholar |
Harvey ES, Shortis MR (1998) Calibration stability of an underwater stereo-video system: implications for measurement accuracy and precision. Marine Technology Society Journal 32, 3-17.
| Google Scholar |
Harvey ES, Goetze J, McLaren B, Langlois T, Shortis MR (2010) Influence of range, angle of view, image resolution and image compression on underwater stereo-video measurements: high-definition and broadcast-resolution video cameras compared. Marine Technology Society Journal 44, 75-85.
| Crossref | Google Scholar |
Hobbs RJ, Arico S, Aronson J, Baron JS, Bridgewater P, Cramer VA, Epstein PR, Ewel JJ, Klink CA, Lugo AE, Norton D, Ojima D, Richardson DM, Sanderson EW, Valladares F, Vilà M, Zamora R, Zobel M (2006) Novel ecosystems: theoretical and management aspects of the new ecological world order. Global Ecology and Biogeography 15, 1-7.
| Crossref | Google Scholar |
Hunter WR, Sayer MDJ (2009) The comparative effects of habitat complexity on faunal assemblages of northern temperate artificial and natural reefs. ICES Journal of Marine Science: Journal du Conseil 66, 691-698.
| Crossref | Google Scholar |
Jessop SA, Saunders BJ, Goetze JS, Harvey ES (2022) A comparison of underwater visual census, baited, diver operated and remotely operated stereo-video for sampling shallow water reef fishes. Estuarine, Coastal and Shelf Science 276, 108017.
| Crossref | Google Scholar |
Kay AM, Keough MJ (1981) Occupation of patches in the epifaunal communities on pier pilings and the bivalve Pinna bicolor at Edithburgh, South Australia. Oecologia 48, 123-130.
| Crossref | Google Scholar |
Kirkbride-Smith AE, Wheeler PM, Johnson ML (2016) Artificial reefs and marine protected areas: a study in willingness to pay to access Folkestone Marine Reserve, Barbados, West Indies. PeerJ 4, e2175.
| Crossref | Google Scholar |
Komyakova V, Munday PL, Jones GP (2013) Relative importance of coral cover, habitat complexity and diversity in determining the structure of reef fish communities. PLoS ONE 8, e83178.
| Crossref | Google Scholar |
Komyakova V, Chamberlain D, Jones GP, Swearer SE (2019) Assessing the performance of artificial reefs as substitute habitat for temperate reef fishes: implications for reef design and placement. Science of The Total Environment 668, 139-152.
| Crossref | Google Scholar |
Komyakova V, Chamberlain D, Swearer SE (2021) A multi-species assessment of artificial reefs as ecological traps. Ecological Engineering 171, 106394.
| Crossref | Google Scholar |
Langlois TJ, Harvey ES, Meeuwig JJ (2012) Strong direct and inconsistent indirect effects of fishing found using stereo-video: testing indicators from fisheries closures. Ecological Indicators 23, 524-534.
| Crossref | Google Scholar |
Layman CA (2000) Fish assemblage structure of the shallow ocean surf-zone on the eastern shore of Virginia Barrier Islands. Estuarine, Coastal and Shelf Science 51, 201-213.
| Crossref | Google Scholar |
Layman CA, Allgeier JE (2020) An ecosystem ecology perspective on artificial reef production. Journal of Applied Ecology 57, 2139-2148.
| Crossref | Google Scholar |
Lemasson AJ, Knights AM, Thompson M, Lessin G, Beaumont N, Pascoe C, Queirós AM, McNeill L, Schratzberger M, Somerfield PJ (2021) Evidence for the effects of decommissioning man-made structures on marine ecosystems globally: a systematic map protocol. Environmental Evidence 10, 4.
| Crossref | Google Scholar |
Lemoine HR, Paxton AB, Anisfeld SC, Rosemond RC, Peterson CH (2019) Selecting the optimal artificial reefs to achieve fish habitat enhancement goals. Biological Conservation 238, 108200.
| Crossref | Google Scholar |
Love MS, Claisse JT, Roeper A (2019) An analysis of the fish assemblages around 23 oil and gas platforms off California with comparisons with natural habitats. Bulletin of Marine Science 95, 477-514.
| Crossref | Google Scholar |
McLaren BW, Langlois TJ, Harvey ES, Shortland-Jones H, Stevens R (2015) A small no-take marine sanctuary provides consistent protection for small-bodied by-catch species, but not for large-bodied, high-risk species. Journal of Experimental Marine Biology and Ecology 471, 153-163.
| Crossref | Google Scholar |
McMahon K, Young E, Montgomery S, Cosgrove J, Wilshaw J, Walker DI (1997) Status of a shallow seagrass system, Geographe Bay, south-western Australia. Journal of the Royal Society of Western Australia 80, 255-262.
| Google Scholar |
Madgett AS, Elsdon TS, Marnane MJ, Schramm KD, Harvey ES (2023) The functional diversity of fish assemblages in the vicinity of oil and gas pipelines compared to nearby natural reef and soft sediment habitats. Marine Environmental Research 187, 105931.
| Crossref | Google Scholar |
Mills KA, Hamer PA, Quinn GP (2017) Artificial reefs create distinct fish assemblages. Marine Ecology Progress Series 585, 155-173.
| Crossref | Google Scholar |
Morris RL, Porter AG, Figueira WF, Coleman RA, Fobert EK, Ferrari R (2018) Fish-smart seawalls: a decision tool for adaptive management of marine infrastructure. Frontiers in Ecology and the Environment 16, 278-287.
| Crossref | Google Scholar |
Munsch SH, Cordell JR, Toft JD, Morgan EE (2014) Effects of seawalls and piers on fish assemblages and juvenile salmon feeding behavior. North American Journal of Fisheries Management 34, 814-827.
| Crossref | Google Scholar |
Myers EMV, Harvey ES, Saunders BJ, Travers MJ (2016) Fine-scale patterns in the day, night and crepuscular composition of a temperate reef fish assemblage. Marine Ecology 37, 668-678.
| Crossref | Google Scholar |
Neves dos Santos L, Zalmon IR (2015) Long-term changes of fish assemblages associated with artificial reefs off the northern coast of Rio de Janeiro, Brazil. Journal of Applied Ichthyology 31, 15-23.
| Crossref | Google Scholar |
Olds AD, Connolly RM, Pitt KA, Pittman SJ, Maxwell PS, Huijbers CM, Moore BR, Albert S, Rissik D, Babcock RC, Schlacher TA (2016) Quantifying the conservation value of seascape connectivity: a global synthesis. Global Ecology and Biogeography: a Journal of Macroecology 25, 3-15.
| Crossref | Google Scholar |
Parker JRC, Saunders BJ, Bennett S, DiBattista JD, Shalders TC, Harvey ES (2019) Shifts in Labridae geographical distribution along a unique and dynamic coastline. Diversity and Distributions 25, 1787-1799.
| Crossref | Google Scholar |
Paxton AB, Shertzer KW, Bacheler NM, Kellison GT, Riley KL, Taylor JC (2020) Meta-analysis reveals artificial reefs can be effective tools for fish community enhancement but are not one-size-fits-all. Frontiers in Marine Science 7, 282.
| Crossref | Google Scholar |
Pearce A, Pattiaratchi C (1999) The capes current: a summer countercurrent flowing past Cape Leeuwin and Cape Naturaliste, Western Australia. Continental Shelf Research 19, 401-420.
| Crossref | Google Scholar |
Pereira PHC, dos Santos MVB, Lippi DL, Silva PHP, Barros B (2017) Difference in the trophic structure of fish communities between artificial and natural habitats in a tropical estuary. Marine and Freshwater Research 68, 473-483.
| Crossref | Google Scholar |
Perkol-Finkel S, Shashar N, Benayahu Y (2006) Can artificial reefs mimic natural reef communities? The roles of structural features and age. Marine Environmental Research 61, 121-135.
| Crossref | Google Scholar |
Pinnegar JK, Polunin NVC, Videler JJ, de Wiljes JJ (2007) Daily carbon, nitrogen and phosphorus budgets for the Mediterranean planktivorous damselfish Chromis chromis. Journal of Experimental Marine Biology and Ecology 352, 378-391.
| Crossref | Google Scholar |
Rees MJ, Knott NA, Davis AR (2018) Habitat and seascape patterns drive spatial variability in temperate fish assemblages: implications for marine protected areas. Marine Ecology Progress Series 607, 171-186.
| Crossref | Google Scholar |
Richardson LE, Graham NAJ, Pratchett MS, Hoey AS (2017) Structural complexity mediates functional structure of reef fish assemblages among coral habitats. Environmental Biology of Fishes 100, 193-207.
| Crossref | Google Scholar |
Rilov G, Benayahu Y (2000) Fish assemblage on natural versus vertical artificial reefs: the rehabilitation perspective. Marine Biology 136, 931-942.
| Crossref | Google Scholar |
Saunders BJ, Harvey ES, Kendrick GA (2014) Factors influencing distribution and habitat associations in an endemic group of temperate Western Australian reef fishes over a latitudinal gradient. Marine Ecology Progress Series 517, 193-208.
| Crossref | Google Scholar |
Schramm KD, Marnane MJ, Elsdon TS, Jones C, Saunders BJ, Goetze JS, Driessen D, Fullwood LAF, Harvey ES (2020a) A comparison of stereo-BRUVs and stereo-ROV techniques for sampling shallow water fish communities on and off pipelines. Marine Environmental Research 162, 105198.
| Crossref | Google Scholar |
Schramm KD, Harvey ES, Goetze JS, Travers MJ, Warnock B, Saunders BJ (2020b) A comparison of stereo-BRUV, diver operated and remote stereo-video transects for assessing reef fish assemblages. Journal of Experimental Marine Biology and Ecology 524, 151273.
| Crossref | Google Scholar |
Schramm KD, Marnane MJ, Elsdon TS, Jones CM, Saunders BJ, Newman SJ, Harvey ES (2021) Fish associations with shallow water subsea pipelines compared to surrounding reef and soft sediment habitats. Scientific Reports 11, 6238.
| Crossref | Google Scholar |
Seaman W (Ed.) (2000) ‘Artificial reef evaluation: with application to natural marine habitats.’ (CRC Press: Boca Raton, FL, USA) doi:10.1201/9781420036633
Sheaves M (2009) Consequences of ecological connectivity: the coastal ecosystem mosaic. Marine Ecology Progress Series 391, 107-115.
| Crossref | Google Scholar |
Simon T, Joyeux J-C, Pinheiro HT (2013) Fish assemblages on shipwrecks and natural rocky reefs strongly differ in trophic structure. Marine Environmental Research 90, 55-65.
| Crossref | Google Scholar |
Strelcheck AJ, Cowan JH, Shah A (2005) Influence of reef location on artificial-reef fish assemblages in the northcentral Gulf of Mexico. Bulletin of Marine Science 77, 425-440.
| Google Scholar |
Sugiura N (1978) Further analysis of the data by Akaike’s information criterion and the finite corrections. Communications in Statistics – Theory and Methods 7, 13-26.
| Crossref | Google Scholar |
Sward D, Monk J, Barrett N (2019) A systematic review of remotely operated vehicle surveys for visually assessing fish assemblages. Frontiers in Marine Science 6, 134.
| Crossref | Google Scholar |
Thanner SE, McIntosh TL, Blair SM (2006) Development of benthic and fish assemblages on artificial reef materials compared to adjacent natural reef assemblages in Miami–Dade county, Florida. Bulletin of Marine Science 78, 57-70.
| Google Scholar |
Watt-Pringle P, Strydom NA (2003) Habitat use by larval fishes in a temperate South African surf zone. Estuarine, Coastal and Shelf Science 58, 765-774.
| Crossref | Google Scholar |
Westera MB, Phillips JC, Coupland GT, Grochowski AJ, Harvey ES, Huisman JM (2009) Sea surface temperatures of the Leeuwin Current in the Capes region of Western Australia: potential effects on the marine biota of shallow reefs. Journal of the Royal Society of Western Australia 92, 197-210.
| Google Scholar |
Whitfield AK, Becker A (2014) Impacts of recreational motorboats on fishes: a review. Marine Pollution Bulletin 83, 24-31.
| Crossref | Google Scholar |
Wilhelmsson D, Yahya SAS, Öhman MC (2006) Effects of high-relief structures on cold temperate fish assemblages: a field experiment. Marine Biology Research 2, 136-147.
| Crossref | Google Scholar |
Wilson SK, Graham NAJ, Holmes TH, MacNeil MA, Ryan NM (2018) Visual versus video methods for estimating reef fish biomass. Ecological Indicators 85, 146-152.
| Crossref | Google Scholar |
Appendix
| Species name | Jetty | Reef | Sand | Seagrass | |
|---|---|---|---|---|---|
| Acanthaluteres brownii | ✓ | ✓ | |||
| Acanthaluteres vittiger | ✓ | ✓ | ✓ | ||
| Anoplocapros amygdaloides | ✓ | ✓ | |||
| Aracana aurita | ✓ | ||||
| Arripis georgianus | ✓ | ||||
| Austrolabrus maculatus | ✓ | ✓ | |||
| Bodianus frenchii | ✓ | ||||
| Caesioscorpis theagenes | ✓ | ✓ | |||
| Centroberyx gerrardi | ✓ | ||||
| Centroberyx lineatus | ✓ | ||||
| Cheilodactylus gibbosus | ✓ | ||||
| Chelmonops curiosus | ✓ | ✓ | |||
| Choerodon rubescens | ✓ | ✓ | |||
| Chromis klunzingeri | ✓ | ✓ | |||
| Coris auricularis | ✓ | ✓ | |||
| Dactylophora nigricans | ✓ | ||||
| Dinolestes lewini | ✓ | ✓ | ✓ | ||
| Diodon nicthemerus | ✓ | ||||
| Dotalabrus alleni | ✓ | ✓ | |||
| Dotalabrus aurantiacus | ✓ | ||||
| Enoplosus armatus | ✓ | ✓ | |||
| Epinephelides armatus | ✓ | ||||
| Eubalichthys cyanoura | ✓ | ||||
| Eubalichthys mosaicus | ✓ | ✓ | |||
| Girella zebra | ✓ | ✓ | |||
| Halichoeres brownfieldi | ✓ | ✓ | |||
| Hypoplectrodes nigroruber | ✓ | ||||
| Kyphosus spp. | ✓ | ✓ | |||
| Meuschenia flavolineata | ✓ | ||||
| Meuschenia freycineti | ✓ | ✓ | |||
| Meuschenia hippocrepis | ✓ | ||||
| Microcanthus strigatus | ✓ | ||||
| Neatypus obliquus | ✓ | ||||
| Nemadactylus valenciennesi | ✓ | ||||
| Neoodax balteatus | ✓ | ||||
| Notolabrus parilus | ✓ | ✓ | |||
| Omegophora armilla | ✓ | ||||
| Omegophora cyanopunctata | ✓ | ||||
| Ophthalmolepis lineolatus | ✓ | ✓ | |||
| Ostorhinchus rueppellii | ✓ | ✓ | ✓ | ||
| Ostorhinchus victoriae | ✓ | ✓ | |||
| Othos dentex | ✓ | ||||
| Parapercis haackei | ✓ | ||||
| Paraplesiops meleagris | ✓ | ||||
| Parapriacanthus elongatus | ✓ | ||||
| Parequula melbournensis | ✓ | ✓ | ✓ | ||
| Parma mccullochi | ✓ | ✓ | |||
| Parma victoriae | ✓ | ||||
| Parupeneus spilurus | ✓ | ✓ | |||
| Pelates octolineatus | ✓ | ||||
| Pempheris klunzingeri | ✓ | ✓ | |||
| Pempheris multiradiata | ✓ | ✓ | |||
| Pentapodus vitta | ✓ | ||||
| Psammoperca datnoides | ✓ | ✓ | |||
| Pseudocaranx spp | ✓ | ✓ | ✓ | ||
| Pseudolabrus biserialis | ✓ | ||||
| Rhabdosargus sarba | ✓ | ||||
| Scobinichthys granulatus | ✓ | ✓ | ✓ | ||
| Scobinichthys spp. | ✓ | ||||
| Seriola hippos | ✓ | ✓ | |||
| Siganus fuscescens | ✓ | ✓ | |||
| Sillaginodes punctatus | ✓ | ||||
| Sillago spp. | ✓ | ✓ | |||
| Siphonognathus spp. | ✓ | ||||
| Sphyraena novaehollandiae | ✓ | ||||
| Tilodon sexfasciatus | ✓ | ||||
| Trachinops noarlungae | ✓ | ✓ | |||
| Trygonoptera personata | ✓ | ✓ | |||
| Upeneichthys vlamingii | ✓ | ✓ | ✓ | ✓ | |
| Upeneus tragula | ✓ |