

Environmental predictors of forest structure, tree growth and wood production for Xylocarpus granatum in mixed-species mangrove forests
Alistar I. Robertson A B * , Irena Zagorskis A , Murray Logan A , Paul Dixon A and Paul Daniel A
A
B
Abstract
Restored mangrove forests are threatened by the restricted range of species used. Xylocarpus granatum has excellent timber and could add value in mangrove plantings.
Forest structure and environmental variables were measured at 40 sites in northern Australia and Papua New Guinea. Tree growth was measured at 18 sites. Boosted regression tree modelling identified environmental predictor variables for above-ground biomass for X. granatum (AGBX), mean annual increment in diameter at breast height (DBH) for X. granatum (MAIX) and wood production (PW).
To determine the environmental conditions under which X. granatum has the greatest biomass and growth.
Increasing stem density, basal area and AGB of other tree species were most important in limiting AGBX. MAIX (range 0.03–0.55 cm year−1) was greatest when sediment redox potential was >100 mV and mean annual catchment rainfall was >4000 mm. MAIX increased with an increasing mean minimum air temperature and sediment percentage silt and percentage phosphorus. PW declined with the stem density of all species and increased with an increasing percentage silt and when sediment redox potential was >180 mV.
Under optimal conditions, X. granatum grows as fast as most mangrove species and could make an excellent, harvestable addition to the species mix used in restoration projects.
Keywords: aboveground biomass, boosted regression trees, environmental predictor variables, growth, mangrove, tree height, wood production, Xylocarpus granatum.
Introduction
Magnificent in themselves, mangrove forests provide significant ecosystem services to human populations. Mangroves can trap sediments from uplands and inshore coastal waters, protect shorelines and human populations during storms and tsunamis, support fisheries and marine and terrestrial biodiversity, provide a range of forest products to local human communities and industry and sequester globally significant amounts of carbon (Ewel et al. 1998; Lee et al. 2014; Rog et al. 2017; Sillanpää et al. 2017).
The high annual rates of global mangrove forest loss last century (Duke et al. 2007) appear to have slowed. There is some cautious optimism that a recovery phase is underway through programs established to restore and rehabilitate mangrove for their goods and services (Friess et al. 2020; Hagger et al. 2022). However, there are major concerns with most rehabilitation and restoration programs because success is based on input measures such as number of trees planted rather than outcomes of ecosystem integrity, functionality and resilience to disturbance (McKee and Faulkner 2000; Lee et al. 2019; Rahman et al. 2021; O’Connell et al. 2021). There are also concerns that a global focus on restoration and rehabilitation may detract attention from the conservation of remaining forests (Friess et al. 2019; Bryan-Brown et al. 2020).
The major concern with current and past restoration programs is the extremely limited number of mangrove species used in reforestation relative to the number present in natural forests (Ellison 2000; Bosire et al. 2008; Alongi 2009; Lee et al. 2019). Functional diversity and species diversity have powerful influences on long-term ecosystem resilience (Cardinale et al. 2007; Cadotte et al. 2011; Hutchison et al. 2018). Thus, for improved mangrove restoration, as well as conservation of existing forests, greater attention to the ecology of a diverse range of mangrove species is required (Ellison 2000; Bosire et al. 2008; Huxham et al. 2010).
The cannonball mangrove (Xylocarpus granatum (Meliaceae)) is widespread in the Indo West Pacific region (Duke 1992). The species has excellent furniture-grade timber (Sukardjo 1998). It has been included in small forestry and restoration trials in Thailand and Bangladesh with mixed success (Japan Association for Mangroves 1997; Siddiqi et al. 2020) but its potential for use as a quality timber-producing species in reafforestation and restoration programs has not truly been assessed. Across the region, X. granatum is commonly harvested by local communities (Aksornkoae 1993; Ashton and Macintosh 2002; Mulyadi and Amin 2016; Njana 2020), but not commercially harvested, owing to its rarity at the site scale in most natural forests (Clough 2013). However, some forest stands in the Indo West Pacific region are dominated by X. granatum (Cole et al. 1999; Ashton and Macintosh 2002; Trettin et al. 2016; Nur-Fatehah et al. 2022).
In riverine mangrove forests, X. granatum is more frequently found in the mid- to lower-salinity regions (Bunt et al. 1982) and is most common and sometimes a dominant species in the mid- to higher-intertidal zones (Bunt et al. 1985; Duke 1992). However, large individuals can be found across the intertidal zone (Allen et al. 2003; Trettin et al. 2016) and physiological constraints on X. granatum do not appear to be the only factors determining growth performance and the within-site distribution of adult trees (Robertson et al. 1990; Ashton and Macintosh 2002; Allen et al. 2003).
On the basis of two studies in Thailand and Micronesia (United Nations Development Programme and United Nations Educational, Scientific and Cultural Organization 1991; Devoe and Cole 1998), annual diameter at breast height (DBH) increments and wood production in X. granatum appears to be low relative to many other mangrove species (Xiong et al. 2019a, 2019b; but see more recent data from Tanzania, Njana 2020). Although above-ground biomass (AGB) and wood production (PW) in mangroves is a function of annual DBH increments, both parameters scale with stand structure, composition and tree size (Rovai et al. 2021). In humid tropical forests, stands dominated by X. granatum, where trees heights are <20 m, DBHs are <30 cm and AGB and basal areas are 100 Mg ha−1 and <30 m2 ha−1 (Cole et al. 1999; Ashton and Macintosh 2002; Trettin et al. 2016; Nur-Fatehah et al. 2022), annual DBH increments and wood production would be predicted to be substantial (Rovai et al. 2021).
A first step in assessing the potential of X. granatum for inclusion in mangrove reafforestation and restoration programs is to understand the environmental settings in which growth and timber yield are greatest. Here, we assess forest structure and productivity at many sites spread along five estuaries across eight degrees of latitude in north-eastern Australia and Papua New Guinea. We aimed to fill many of the gaps in knowledge about forest structure and growth for X. granatum and the relationship to environmental variability at different scales. At regional scales, mangrove forest structure and function are influenced by mean annual patterns of rainfall and runoff, temperature and storm frequency, whereas at local levels, geomorphic, edaphic and biological factors can also be highly important (Clough 1992; Smith 1992; Simard et al. 2019; Xiong et al. 2019a; Rovai et al. 2021).
Here, we were particularly focused on addressing the following questions: (1) how does the structure of stands of X. granatum vary with site- and regional-level environmental settings; (2) are the rates of growth of X. granatum trees always at the low end of those for mangroves globally; and, finally, (3) under what set of regional and local environmental conditions is growth optimised for X. granatum?
Methods
Study areas
We chose four rivers in tropical, far north Queensland, Australia, and one in Western Province, Papua New Guinea, representing a range of catchment sizes, rainfall, seasonality and annual discharge. Each river had been surveyed extensively in work on the within-estuary distribution of mangroves, had a very high diversity of mangrove species and contained stands of mixed forests in which X. granatum was a numerical dominant (Bunt et al. 1982, 1985; Robertson et al. 1991).
The Fly River (8°31′36.71″S, 143°48′40.78″E) ranks in the top 40 of the world’s rivers, with a mean annual discharge of ⁓2.35 × 10⁵ GL. The Star Mountains region (3700 m) at the top of the Fly River catchment (76,000 km2) is one of the wettest places on Earth with a mean annual rainfall of ⁓12 m year−1. Mean annual rainfall at Tabubil, 434 km from the mouth of the river, is ⁓6000 mm. The mean annual maximum and minimum air temperatures at the Fly delta are 27.8 and 25.2°C respectively, and vary little throughout the year. The catchment is mainly intact, pristine rainforest with extensive and mostly intact floodplain wetland habitats. In the driest season, estuarine conditions exist for 100°km upstream from the mouth of the river and there are massive mangrove forests (874°km2) in the delta, containing at least 29 mangrove species (Robertson et al. 1991).
The Pascoe River on Cape York in northern Australia (12°29′43.01″S, 143°16′19.18″E) has a catchment area of 2124 km2. Gauging station records are sparse and mean annual discharge is likely to be ⁓1300 GL. There are cattle stations in the upper catchment, whereas in the lower reaches, vegetation is in mainly natural condition. The river is 119 km long and drops 243 m from its source in the Great Dividing Range before discharging into the inshore waters of the Great Barrier Reef. Annual mean catchment rainfall is 1646 mm. The mean maximum and minimum air temperatures at the coast are 30.4 and 22.7°C. There are 33 km2 of riverine wetlands in the catchment, dominated by mangroves. At the end of the dry season, the river can be saline up to 10 km from mouth (Bunt et al. 1982). Extensive surveys of mangroves in the estuary of the Pascoe have recorded 23 species of mangroves (Bunt et al. 1982).
Just to the south of the Pascoe lies the Claudie River (12°50′11.67″S, 143°21′26.57″E). It is a much smaller river (length ⁓35 km) with a catchment of 160 km2. Vegetation in the catchment is in a near-natural state. The mean annual rainfall in the catchment is 1729 mm. Mean annual discharge for the river may be ⁓70 GL. Mean annual maximum and minimum air temperatures at the coast are 30.6 and 22.7°C. The Claudie is saline up to 5 km from its mouth and its estuary supports a total of 2.30 km2 of intertidal forests containing 23 species of mangroves (Bunt et al. 1982).
The McIvor River (15°08′20.73″S, 145°14′05.47″E) is ⁓65 km long with a catchment area of 588 km2. Cattle stations and associated fodder farming are present in the upper catchment and the lowlands have mainly intact native vegetation. Mean annual rainfall is the lowest among the five rivers (1422 mm). The mean annual discharge for the McIvor is 114 GL. There may also be significant groundwater input to the estuarine section of the river from surrounding dune fields (Holliday et al. 2007). Mean annual maximum and minimum air temperatures at the coast are 29.9 and 22.9°C. The McIvor can be saline up to 9 km upriver and has 4.10 km2 of intertidal forest supporting 28 species of mangroves (Bunt et al. 1982).
The Daintree River (16°17′16.63″S, 145°27′12.76″E) has a large catchment (2125 km2) in the north of the World Heritage Wet Tropics region of far north Queensland. Mean annual rainfall in the upper catchment is 2689 mm. The river descends 1270 m over its 127-km course. Mean annual riverine discharge is ⁓1000 GL. Mean annual maximum and minimum air temperatures at the coast are 29.8 and 22.6°C. There are intact rainforest communities in its upper catchment. Clearing for agriculture in the lower catchment represents <5% of the total catchment area. The estuary of the Daintree can be slightly saline up to 18 km from its mouth and supports 28 species of mangroves in its 33 km2 of intertidal forests.
Visits to the rivers were aboard a research vessel, which provided both accommodation and small boats to access research sites within each estuary. Cruises to each Australian river occurred at a frequency of approximately every 6 months over 3.2 years. For the Fly River, there were two cruises separated by 1 year.
Surveys of forest structure and environmental variables
We did not intend that this study would provide a forest inventory (sensuKauffman and Donato 2012) based on a fully randomised or stratified sampling design (e.g. Trettin et al. 2016). Rather we focused on assessing Xylocarpus forest structure and growth across as wide a set of forest and environmental settings as possible, so that we could address the main questions outlined in the Introduction.
In each river, we surveyed forest structure at eight sites distributed along the estuarine salinity gradient. Initially, we explored positions along each river and walked transect lines perpendicular to the river channel until X. granatum was encountered. Site choice on the salinity gradient ensured that there was at least one X. granatum tree present in each site. This was a necessary approach only at the extreme low- or high-salinity regions of each estuary, because X. granatum is more common in the mid-salinity zones of these rivers (Bunt et al. 1982; Robertson et al. 1991).
Relative to the Australian estuaries, logistics in the Fly River estuary are challenging. The delta region is ⁓100 km across the river mouth, estuarine conditions can extend ~100 km upstream from the front of the delta and there are 874 km2 of mangrove forests. Hence, we constrained our choice of sites to within a ⁓30-km length of the estuary in a region where the low water salinities in the late drier season (September) ranged from 4 to 18.
At each site in each of the five estuaries, forest structure was assessed using a relascope (Spiegel Relaskop) and employing the angle-count cruising method (Cintron and Novelli 1984). The DBH was recorded for each tree of each species included in each 360° swing of the relascope and tree densities, and basal areas for X. granatum and all other species were calculated following English et al. (1997). Saplings of X. granatum were considered to have a DBH of <5 cm (Trettin et al. 2016). Maximum tree height for X. granatum in a stand was estimated using an inclinometer and a tape measure to record distance from the tree base and the height at the eye-line of the investigator.
The allometric relationship between DBH and total tree mass was used to estimate the above-ground biomass for X. granatum (AGBX) (Clough and Scott 1989). With the exception of the palm Nypa fruticans (see below), for all other species encountered in the field surveys, AGB was determined using a general equation for mangroves (Komiyama et al. 2008):
where p is wood density (g cm−3) and D is DBH (cm). Species-specific values of p were obtained from Zanne et al. (2009). Where there was more than one value of p per species, we used Australian data. If species-specific wood densities were not available, we used data for a congener. For Nypa fruticans, woody petioles of erect leaves were considered as individuals in relascope swings, and to estimate AGB, we used the allometric equation relating dry mass of leaves to petiole DBH from Robertson et al. (2020).
At each site, we measured or took samples near the centre of each site to assess physical, chemical and biological variables that are known to influence forest structure and growth in mangroves in general and X. granatum specifically (Table 1). Methods for each variable are provided in Table 1, with reference to details described in previous papers by us and others. We also had available data on climate and hydrological variables for each river (Table 1; and see Study areas, above).
| Variable and unit | Method and data availability | Rationale | |
|---|---|---|---|
| Climate | |||
| Mean annual catchment rainfall (mm) CV Mean annual catchment rainfall (dimensionless) Mean maximum air temperature (°C) CV Mean maximum air temperature (dimensionless) Mean minimum air temperature (°C) CV Mean minimum air temperature (dimensionless) | Australian estuaries data from the SILO database of Australian climate data from 1889 to the present https://www.longpaddock.qld.gov.au/silo/ For the Fly River mid-catchment (Tabubil) and delta (Daru, 72 km from the delta) data from https://www.worldweatheronline.com/ | Variation in rainfall and air temperature influence mangrove growth at a variety of levels and by many processes that affect tree physiology and ecology (e.g. Ball 1988; Xiong et al. 2019a; Rovai et al. 2021; Robertson et al. 2021) | |
| Hydrology | |||
| Mean annual discharge (GL) | Fly River data from Pickup and Marshall (2008). Pascoe River from Horn (1995) and Howley (2016). McIvor River (Elderslie gauging station, Qld Water Monitoring Portal https://water-monitoring.information.qld.gov.au/). Daintree River from Bartley et al. (2008). There is no gauging station in the Claudie catchment. An estimate was made by scaling discharge of the greater Lockhart River Basin, which contains the Claudie (McCloskey et al. 2014), by relative catchment area | Mean annual discharge directly influences estuarine and groundwater salinity, key factors affecting mangrove tree growth (Clough 1992; Smith 1992) | |
| Physical | |||
| Elevation (categorical) | In the four Australian rivers, height (m) below mean high-water measured using dumpy level. Heights were allocated to four intertidal categories (4, very high; 3, high; 2, medium; 1, low). In the Fly River intertidal categories were allocated by visual inspection. | Topographic height directly influences frequency and duration of tidal flooding and indirectly influences sediment salinity and moisture content (Smith 1992; Duke et al. 1998) | |
| Silt, sand and gravel content of sediment (%) | Sediment sample in three size classes (gravel, sand, silt). Particle-size analysis following Boto and Wellington (1984) | Particle-size distributions control and affect a range of physical, chemical and biological processes in mangrove sediments (Boto and Wellington 1984; Krauss et al. 2008) | |
| Faunal hole density in sediment (number m−2) | Mean of counts in four 1-m2 random quadrats at each site. Only holes of dominant sesarmid crabs counted | Crab holes facilitate water flow through mangrove soils. This influences redox potential and concentrations of sulphides and can control tree survival and growth (Smith et al. 1991; Stieglitz et al. 2000) | |
| Chemical | |||
| Groundwater salinity | Frozen soil samples taken from across the soil profile (down to 50 cm) in the late dry season were analysed for conductivity following Ball (1998) and converted to salinity | Salinity plays a key role in the survival, growth and distribution of mangroves (Ball 1988, 1998; Duke et al. 1998; Krauss et al. 2008) | |
| Porewater pH (dimensionless) | Following Boto and Wellington (1983) | Microbial activity and mangrove plant physiology are changes with acidity and levels of anaerobiosis (Krauss et al. 2008; Alongi 2009) | |
| Porewater redox potential (mV) | Following Boto and Wellington (1983) | Microbial activity and mangrove plant physiology are changes with acidity and levels of anaerobiosis (Krauss et al. 2008; Alongi 2009) | |
| Sediment bulk carbon (%) Sediment bulk nitrogen (%) Sediment bulk phosphorus (%) | Sediment from different depths dried, weighed and processed with a CHN analyser (C,N) and a plasma emission spectrometer (P) (Alongi et al. 1992) | Provides bulk levels of carbon, nitrogen and phosphorus in sediments reflecting chemical and biological activity (Boto and Wellington 1983; Alongi 2009) | |
| Biological | |||
| Seed predation total (%) | All X. granatum seeds collected from a 250-m2 area of each site were scored for insect or chewing by crabs following Robertson et al. (1990) | Seed predators can have a significant influence on the proportion of seeds of mangrove species that survive to germinate (Robertson et al. 1990; Smith 1992) | |
| Seeds predation by insects (%) | All X. granatum seeds collected from a 250-m2 area of each site were scored for insect damage following Robertson et al. (1990) | Insects that bore into seeds of X. granatum affect survival and subsequent growth of seedlings (Robertson et al. 1990) | |
| Basal area other tree species (m2 ha−1) Total density other tree species (stems ha−1) Total density all tree species (stems ha−1) AGB other tree species (Mg ha−1) Total AGB all species (Mg ha−1) Number of mangrove species | From forest surveys (see Methods) | Competition and facilitation among species can influence mangrove forest structure and function (Smith 1992; Huxham et al. 2010) |
Units and method summary and rationale for inclusion in the study are provided. Data for all environmental variables were included in the boosted regression-tree modelling, unless otherwise indicated. AGB, above-ground biomass.
Tree growth and wood production
We established a total of 18 plots across the region to measure the growth of X. granatum over a range of environmental settings (Table 2). There were three plots in each of the four Australian estuaries and six in the Fly estuary, all arranged to cover the salinity gradient of each estuary. Plots were positioned immediately adjacent to a survey site and their sizes varied (range of areas 150–496 m2) depending on the densities of individuals of X. granatum at each site. We included at least 20 individuals of X. granatum in each plot (range for all plots, 20–41 individuals).
| Forest plot variable | Fly | Pascoe | Claudie | McIvor | Daintree | |
|---|---|---|---|---|---|---|
| N = 6 | N = 3 | N = 3 | N = 3 | N = 3 | ||
| Years between measurements | 1 | 3.18 | 3.18 | 3.16 | 3.15 | |
| Range of plot size (m2) | 220–576 | 300 | 150–450 | 150–259 | 140–250 | |
| ∑ trees measured at t = 1 | 120 | 91 | 87 | 68 | 89 | |
| ∑ trees alive at t = 2 | 119 | 88 | 80 | 67 | 79 | |
| ∑ trees grew > measuring error | 119 | 68 | 32 | 46 | 20 | |
| ∑ trees with negative increment | 6 A | 8 | 7 | 6 | 10 |
At the beginning of the study, in each estuary, we marked off each plot with star pickets and all individual trees of X. granatum were tagged with a stainless steel, numbered marker attached to the tree trunk loosely with stainless-steel wire. A small mark was made in the bark of each tree at 1.2 m from the ground and the DBH was recorded using a DBH tape 10 cm above the mark (i.e. at 1.3 m). The DBH of all trees that had survived was recorded in the same way after between 3.15 and 3.18 years in Australian estuaries. For the Fly River, measurements were taken before and after 1.0 year. The data were used to calculate the mean annual increment in DBH for X. granatum trees in each plot (MAIX, cm year−1).
The growth plots contained sufficient trees to estimate the MAI and to estimate PW at the plot level (Table 2). Overall, we tagged and measured 455 trees in all rivers at the start of the study. Over the time period that elapsed between the first and second measurements of trees in plots, 22 trees died. Time gaps of 1 to 3 years between measurements are far too short a time to estimate rates of tree mortality (Lewis et al. 2004), so we excluded these trees when estimating stand-level PW (see below).
The mass of wood in each X. granatum tree before and after the period of growth was calculated from the allometric relationship between DBH and trunk wood mass (Clough and Scott 1989). Wood-mass increment (kg) was normalised to 1 year for all trees in a plot. PW in a plot was obtained by summing mass increments for all trees in the plot and normalising plot data to 10,000 m2 to obtain annual stand-level trunk PW (Mg ha−1 year−1).
Management of potential error and bias
There are four main potential sources of error when estimating tree biomass and growth in forests, viz. (1) errors in measurement of DBH, (2) choice of allometric relationship between DBH and mass, (3) the representativeness of small plots across large forest landscapes, and (4) sampling uncertainty, related to the size of the study plot (Chave et al. 2004).
We attempted to minimise uncertainty in tree-biomass estimates for X. granatum by using an allometric relationship between DBH and total tree mass and stem mass developed using trees from far north Queensland, Australia (Clough and Scott 1989). However, the maximum tree DBH included in the Clough and Scott (1989) model was 17 cm, and extrapolation to trees with DBH between 20 and 40 cm, commonly encountered in the present study, was another possible source of error. To test the direction and the possible degree of error arising from extrapolation, we used the Clough and Scott (1989) model and the general model of Komiyama et al. (2008) to compare the total tree-mass increment for X. granatum in the six forest growth plots in the Fly River, where the range of individual sizes was from 1.0 to 81.9 cm DBH. Relative to the general model, the Clough and Scott (1989) model underestimated stand mass increase by an average of 9%, an indication that our conversions of DBH to mass are conservative.
In this study, all trees were measured by one of three investigators. We assessed measurement error by allocating five trees of different DBH to each investigator and each tree was measured at five random times during a 1-h period while all other trees in a plot were being measured. The grand mean measurement error per tree was 0.06 cm, with no difference between investigators. The grand MAI across all 18 growth plots in this study was 0.25 cm (range 0.03–0.55), and only 1 of 18 plots exhibited a mean annual increment that was at or below measurement error.
We were not aiming to provide a full forest inventory, but to investigate the possible causes of variation in forest structure, growth and wood production of one species in relation to a range of environmental variables. Hence, the issue of representativeness of small plots across large forest landscapes and subsequent sampling uncertainty related to the size of study plots (Chave et al. 2004) were not sources of error in this study.
There are many ways that data collected from forest plots and used for estimates of MAI may be biased (Phillips et al. 2002). Many relate to the choice of plot positioning and have been dealt with above under errors. The greatest bias in data management relates to the non-recording of negative growth increments (Phillips et al. 2002). In this study, we took a very conservative approach to data inclusion. Overall, a total of 37 trees across plots exhibited a decrease in DBH in the periods between measurements (Table 2). In our calculations of MAI and PW, we included all trees that did not grow more than measuring error (Table 2) and, with the exception of two trees, all trees with negative growth increments (Table 2). The two trees that were excluded were very large trees (DBH, 48.6 cm and 81.9 cm) from separate plots in the Fly estuary. Errors in DBH measurement or real shrinkage in DBH in such large, old trees would have a disproportionate effect on estimates of MIA and PW.
Data analyses
For each river, the distribution of AGBX at sites along the estuarine gradient was examined using a Kolmogorov–Smirnov one-sample test assuming an even distribution of AGB across sites.
Boosted regression tree (BRT) modelling was employed to investigate the environmental predictors of elements of Xylocarpus forest stand structure, including AGBX and maximum tree height (Hmax), growth (MAIX) and trunk PW. The approach has been used successfully in predicting the drivers of growth and yield in other forests (e.g. Aertsen et al. 2012; Gu et al. 2019). BRT modelling is a powerful approach for building predictive models because it is insensitive to outliers and multicollinearity, can fit complex non-linear relationships, automatically handles the interactive effects between predictors and assumes that relationships between variables are complex and unknown (Breiman 2001; De’ath 2007; Elith et al. 2008).
The BRT method combines large numbers of simple regression-tree models in an adaptive fitting process. Boosting is a forward-learning, sequential ensemble technique in which the model is improved using the information from previously grown weaker models. This process is continued for multiple iterations, reducing error iteratively until a final model is built following pruning (Elith et al. 2008). BRT modelling was performed using the gbm package in R (ver. 2.1.8.1, see https://cran.r-project.org/package=gbm), with a squared error-loss function, a shrinkage (‘learning rate’ in Elith et al. 2008) value of 0.001 and the maximum interaction depth (‘individual tree complexity’) set to 9. BRT models were based on 10,000 trees, and the optimum number of trees for each target variable was selected by five-fold cross-validation of a 0.5 out-of-bag (OOB) fraction. The partial relationships were monotonically constrained where associative polarity was evident (based on simple univariate explorations) to help mitigate artifacts resulting from sparse data. The above parameters were selected by a tuning process aimed at yielding an optimum number of trees of at least 1000 (ensuring adequate learning granularity), yet less than the full complement of trees (ensuring all major features had been learned). The associative profile of each predictor to the predictions was assessed by a pseudo-R2.
For AGBX, Hmax, MAI and PW we used the full suite of environmental variables (Table 1) to produce ‘ecosystem models’. For the MAI and PW ecosystem models, we used environmental data from survey sites immediately adjacent to the growth plots. For MAI, we also ran a ‘sediment model’ to further investigate the predictive role of physical and chemical variables (Table 1). It should be noted that in the modelling of AGBX and Hmax there were only six survey sites in the Fly River, covering a narrower range of salinity. This is unlikely to have a major impact on model outputs given the robust nature of the BRT approach (see above).
When modelling was completed, the relative influences (percentage contribution) of each environmental variables on AGBX, Hmax, MAI and PW were calculated as the proportion of the total tree splits involving each variable. The relative-importance values were ranked and those that exceeded the threshold of 100/p (where p is the number of environmental variables) were considered to be useful predictors. Individual partial-dependence plots were developed for each of the useful predictor variables to understand how the response variable changed on the basis of model predictions. This was illustrated with partial-dependence plots for the ecosystem model for MAI. We followed Aertsen et al. (2012) in summarising the main outcomes of the modelling.
Results
Patterns in the structure of forest stands
Xylocarpus granatum was never encountered in pure stands and the mixed forests we sampled had a mean richness per site ranging from 4.8 to 6.3 species, with some sites having up to 10 tree species (Table 3). The mean numerical dominance of X. granatum ranged from 18 to 33%, and in four of the five rivers there was at least one of the eight survey sites where X. granatum was the dominant species. Other abundant mangroves in the mixed forests we sampled were Nypa fruticans, Heritiera littoralis, Bruguiera gymnorhiza and Camptostemon schultzii in the Fly estuary, and Excoecaria agallocha, B. gymnorhiza, species of Ceriops, H. littoralis and Rhizophora apiculata in the Australian estuaries (Table 3).
| Item | Fly River | Pascoe River | Claudie River | McIvor River | Daintree River | |
|---|---|---|---|---|---|---|
| Dominance of X. granatum (%) | 19 (6–59) | 29 (1–71) | 18 (1–66) | 23 (3–48) | 33 (7–78) | |
| Maximum height of X. granatum (m) | 20.8 (12.4–28.8) | 13.1 (8.9–20.2) | 11.9 (6.5–18.0) | 12.0 (4.4–18.3) | 10.6 (5.9–20.8) | |
| Species richness (N) | 4.8 (4–7) | 5.4 (4–10) | 6.3 (4–9) | 5.3 (3–7) | 5.0 (3–7) | |
| Number of species of mangroves in estuary | 29 | 23 | 23 | 28 | 28 | |
| Other mangrove species | Nf, Hl, Bg, Cs, Ra, Xm, Bp | Ea, Bg, Ct, Hl, Cs, Am, Xm, Bs, Dl, Ra, Br | Ea, Ct, Ca, Bg, Bp, Hl, Xm, Dl, Am, Rs, Cd, Tt | Ea, Bg, Ca, Hl, Nf, Am, Ra, Bp, Dl, Xm, Bs, Rm, Lr, Sc | Ca, Bg, Ra, Hl, Ea, Ct, Bp, Xm, Ci, Sc, Br, Bs, Lr |
Means and ranges of dominance values for X. granatum (percentage of total stem density), tree height and total species richness (including X. granatum) in mixed forests across eight sites in each river. Also shown for each river are the number of mangrove species recorded in the estuary and species recorded in mixed forests with X. granatum, ordered by mean abundance across survey sites. Other mangrove species are Nf, Nypa fruticans; Hl, Heritiera littoralis; Bg, Bruguiera gymnorhiza; Cs, Camptostemon schultzii; Ra, Rhizophora apiculata; Xm, Xylocarpus moluccensis; Bp, Bruguiera parviflora; Ea, Excoecaria agallocha; Ct, Ceriops tagal; Am, Avicennia marina; Bs, Bruguiera sexangula; Dl, Diospyros littorea; Br, Barringtonia racemosa; Ca, Ceriops australis; Rs, Rhizophora stylosa; Cd, Ceriops decandra; Tt, Talipariti tiliaceum; Rm, Rhizophora mucronata; Lr, Lumnitzera racemosa; Sc, Sonneratia caseolaris; Ci, Cynometra iripa.
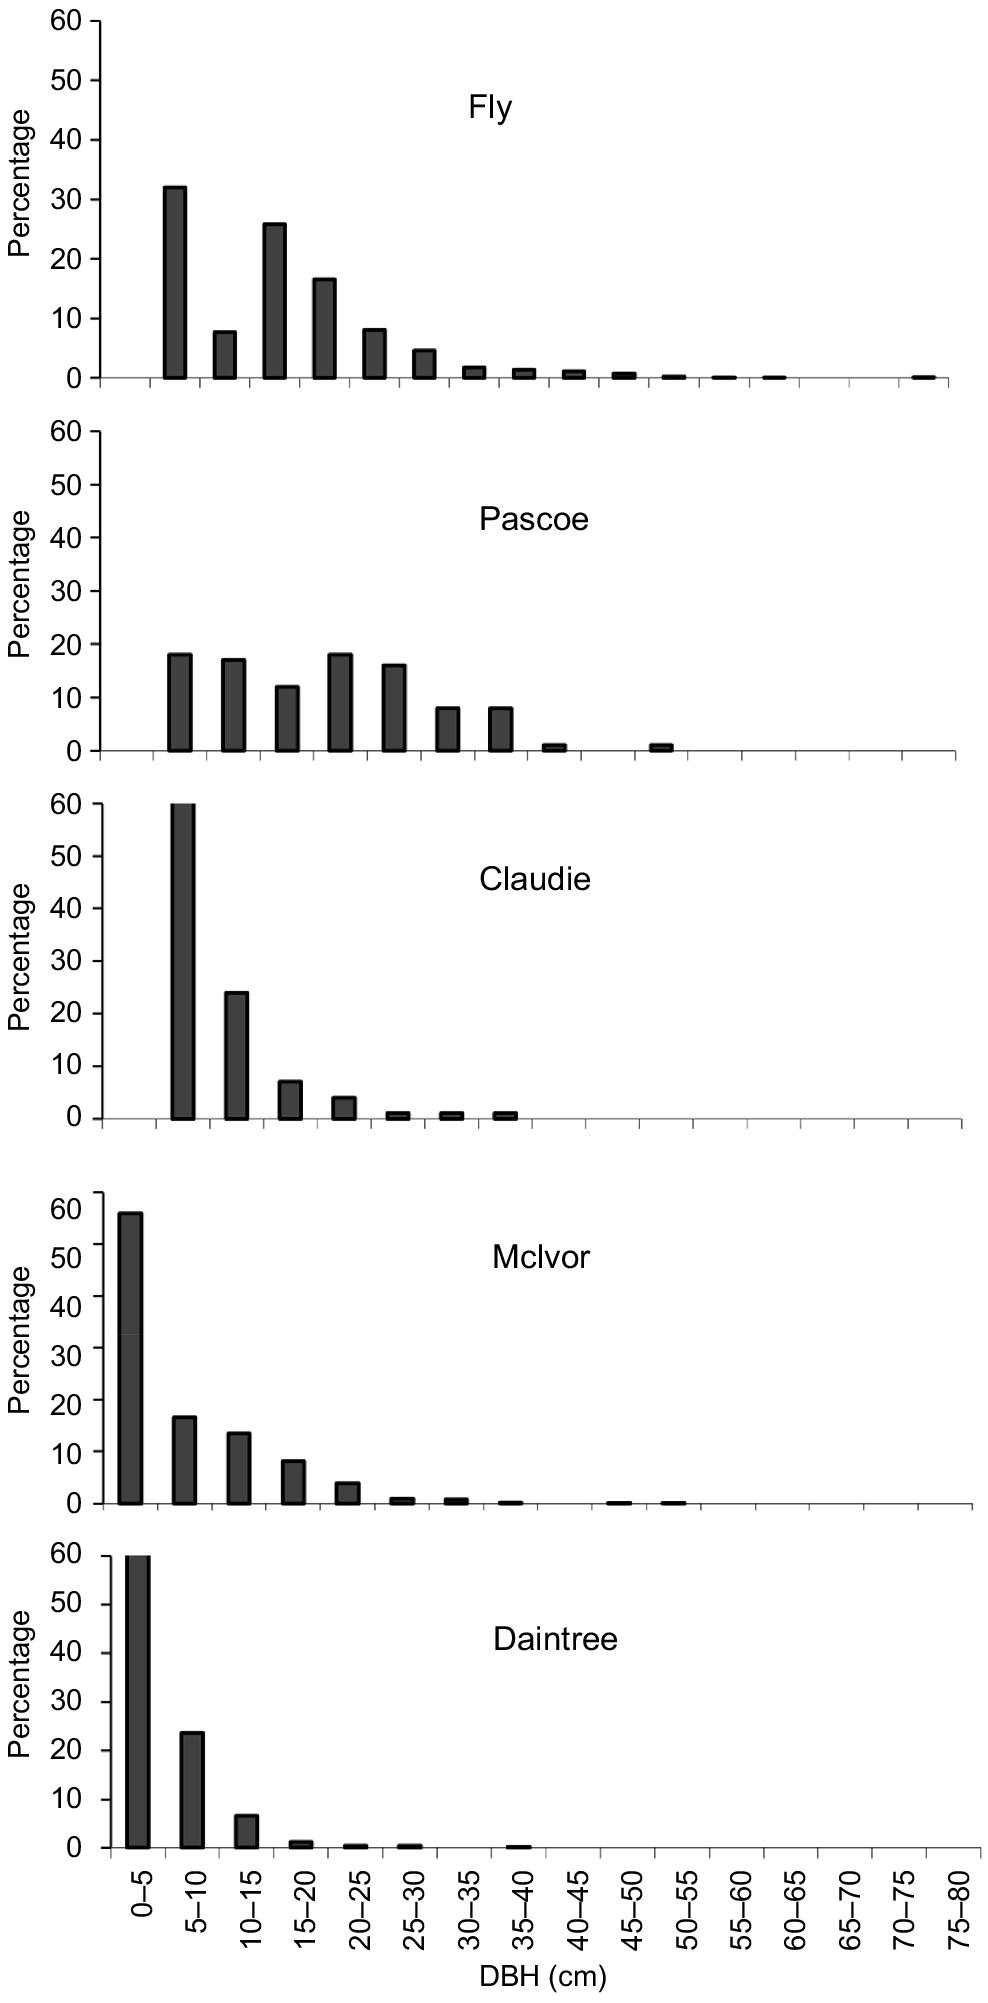
The DBH size distribution for X. granatum varied across estuaries (Fig. 1). In the Fly and Pascoe estuaries, there was a broad range of tree sizes. No saplings (<5 cm DBH) were included in the relascope surveys in these two estuaries (Fig. 1). However, some saplings were present in all the plots established to measure tree growth in both estuaries. In the Claudie estuary, there was a more truncated distribution of tree sizes and, although no saplings occurred in the relascope swings (Fig. 1), some did occur in all three plots established to measure tree growth. The forests in the McIvor and Daintree estuaries were dominated by saplings and small trees, but a few larger trees (>30 cm DBH) were present in the McIvor (Fig. 1). With the exception of the Daintree estuary, survey sites contained many trees of <40 cm DBH and trees of <60 cm DBH were encountered in the Pascoe and Fly estuaries. The largest tree (81.9 cm DBH) encountered in all surveys was in the Fly River.
Diameter at breast height (DBH) percentage frequency distributions of X. granatum derived from data pooled over the eight survey sites in each of the five estuaries.
The AGBX ranged from 16 to >200 Mg ha−1 across the 40 sites we surveyed, with AGBX being greatest at sites in the Pascoe (232 Mg ha−1) and Fly (151 Mg ha−1) rivers. The lowest AGBX (16 Mg ha−1) was recorded in the Daintree River (Fig. 2). AGBX was not evenly distributed across survey sites in all five estuaries (Kolmogorov–Smirnov one-sample tests for all estuaries, Dmax < Dcrit 0.001). In the Australian rivers (Pascoe, Claudie, McIvor, Daintree), AGBX was usually greatest at sites in the mid- to upper reaches of each estuary (Fig. 2). In the Fly estuary, AGBX was not evenly distributed but there was no evidence of an upstream–downstream gradient (Fig. 2) because stations did not cover the full spectrum of estuarine salinity, owing to logistic constraints (see Methods). X. granatum grew in mixed forests at all sampling sites and, with the exception of six sites in the Fly, Pascoe and Claudie rivers, where the AGBX was similar to or greater than that of the total AGB of other species, at most sites AGBX was less than one-quarter of that of the AGB of other species (Fig. 2).
Above-ground biomass (AGB) of X. granatum (solid bars), AGB of all other tree species (dotted bars) and the maximum tree height (Hmax, closed dots) at eight sites on upstream–downstream salinity gradients in the five estuaries. Note that the upstream–downstream gradient in the Fly estuary did not cover the full spectrum of estuarine salinity, owing to logistic constraints (see Methods).
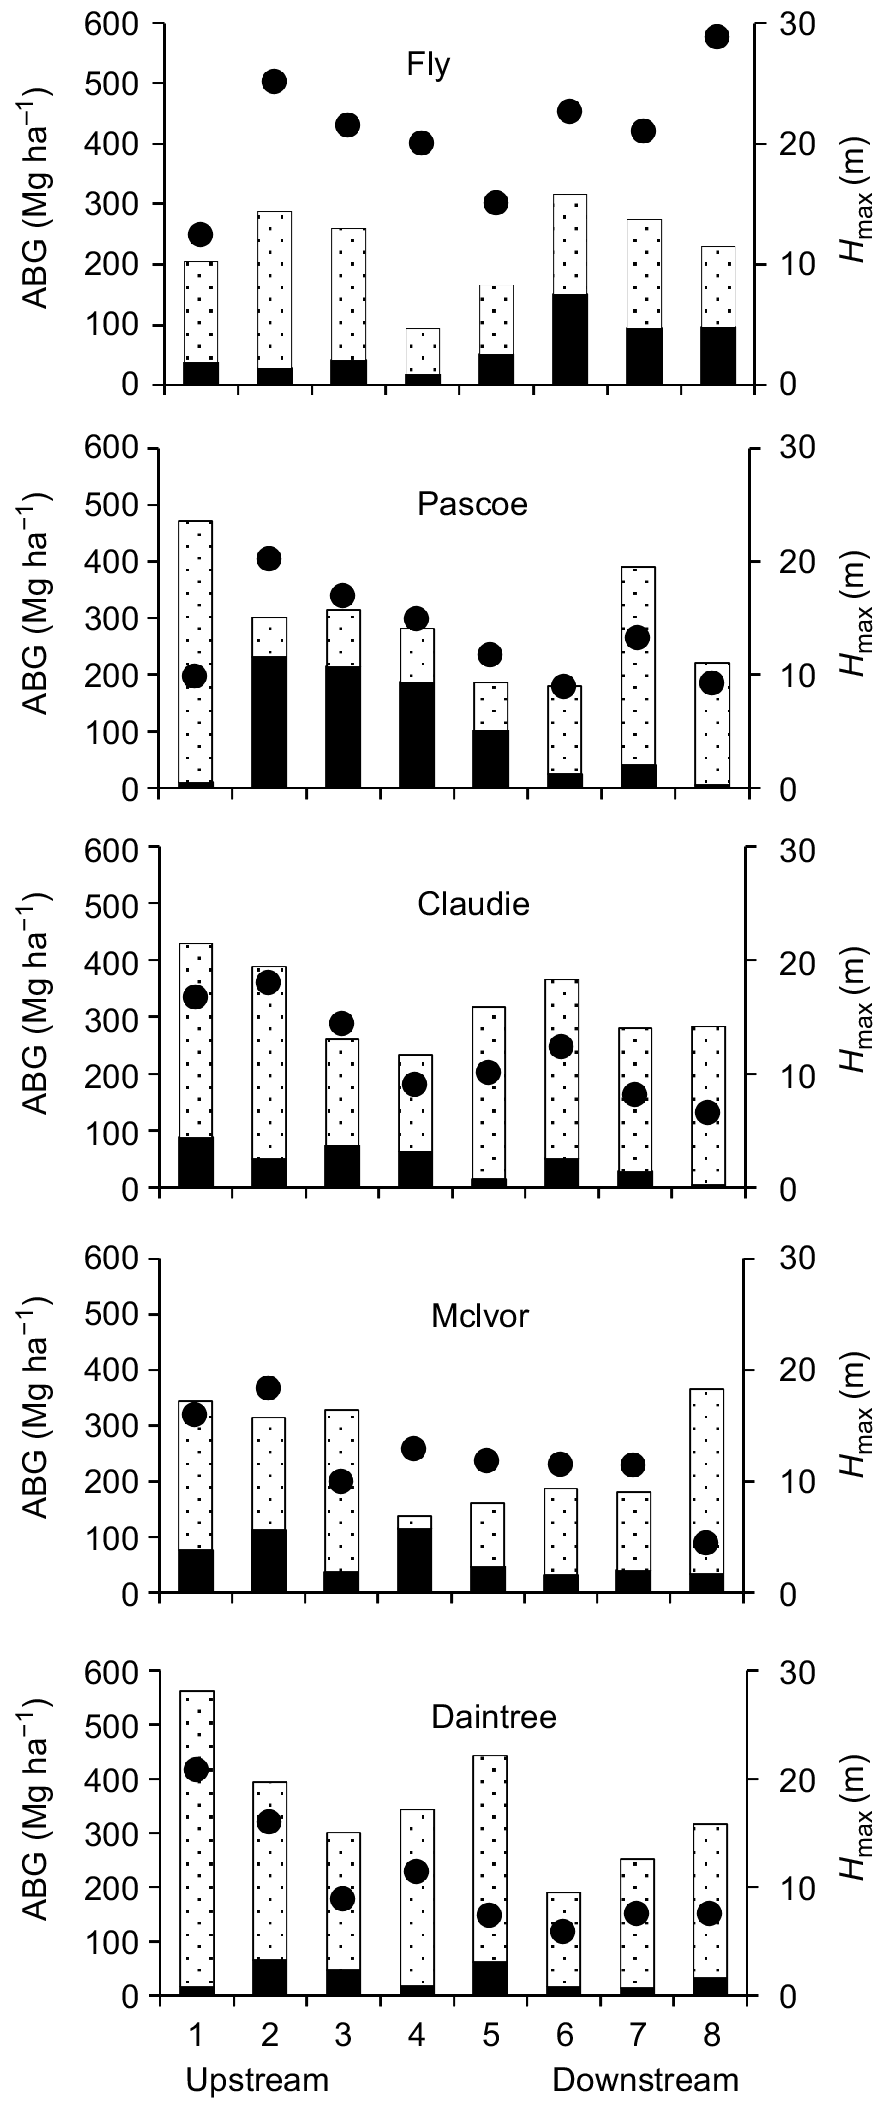
Trees of ≥18 m tall were recorded in all estuaries (Fig. 2). The range of Hmax across all 40 survey sites was 4.4 m in the most upstream site in the McIvor estuary and 28.8 m at a site in the Fly River (Fig. 2, Table 3). In the Australian rivers (Pascoe, Claudie, McIvor and Daintree), Hmax was greater in the upstream section of each estuary than closer to the sea (Fig. 2). In the Fly estuary, sampling stations did not cover the full spectrum of estuarine salinity, owing to logistic constraints (see Methods). There was no clear pattern of Hmax across sites in the Fly estuary (Fig. 2).
BRT modelling showed that five site-level predictor variables had the most influence on AGBX across the study area. AGBX decreased steadily with increases in the density and basal area of other mangrove species at a site and decreased when the AGB of other species reached a threshold of 100 Mg ha−1 (Table 4). AGBX increased gradually with increasing soil redox potentials and was greater when the density of crab holes was less than 7 holes m−2 (Table 4).
| Model | Predictor | Relative influence (%) | Effect | ||
|---|---|---|---|---|---|
| Direction and magnitude | Range or value | ||||
| AGBX ecosystem model | Density of other tree species (stems ha−1) | 27.4 | ↘↘ | 500–1200 | |
| Basal area of other tree species (m2 ha−1) | 17.5 | ↘↘ | 15–30 | ||
| Sediment redox potential (mV) | 11.9 | ↗ | −180–500 | ||
| Density of crab holes (number m−2) | 5.6 | ↓ | 67 | ||
| AGB of other tree species (Mg ha−1) | 4.4 | ↓↓ | 100 | ||
| Hmax ecosystem model | Sediment redox potential (mV) | 19.9 | ↑↑ | 80–250 | |
| Groundwater salinity | 16.6 | ↓↓ | 18 | ||
| Percentage silt | 13.2 | ↑↑ | 40 | ||
| Percentage P | 7.6 | ↑↑ | 0.065 | ||
| Precentage sand | 6.0 | ↘↘ | 10–9055 | ||
| MAI ecosystem model | Sediment redox potential (mV) | 17.2 | ↑ | 100 | |
| Mean annual catchment rainfall (mm) | 16.7 | ↑↑ | 4200 | ||
| Percentage silt | 11.7 | ↗↗ | 5–87 | ||
| Minimum mean air temperature (°C) | 4.8 | ↗↗ | 22.6–25.2 | ||
| MAI sediment model | Percentage silt | 23.4 | ↗↗ | 5–90 | |
| Sediment redox potential (mV) | 21.7 | ↗ | 100–300 | ||
| Percentage P | 17.5 | ↗↗ | 0.044–0.064 | ||
| PW ecosystem model | Sediment redox potential (mV) | 45.3 | ↑ | 180 | |
| Total tree stem density (stems ha−1) | 7.6 | ↘↘ | 400–12,000 | ||
| Percentage silt | 4.6 | ↗↗ | 5–90 | ||
| Density of crab holes (number m−2) | 4.6 | ↓ | 4 | ||
Ecosystem models based on all environmental variables. Sediment model for MAI based on physical and chemical sediment variables in Table 2. Effects: ↑, increasing (with threshold value from partial dependence plot); ↓, decreasing (with threshold value from partial dependence plot), ↗, gradual increase (with range of values over which effect operates – from partial-dependence plots); ↘ gradual decrease (with range of values over which effect operates – from partial-dependence plots); double arrows and single arrows indicate strong (>50%) or weak (<20%) effects.
Five site-level edaphic predictor variables had the most influence on Hmax (Table 4). Maximum tree heights were greater when soil redox potentials were >100 mV and when groundwater salinity was <18. Hmax was greater where sediments were >40% silt, phosphorus concentration was >0.065% and decreased gradually when sediment sand content increased from 10 to 55% (Table 4).
Tree growth and wood production
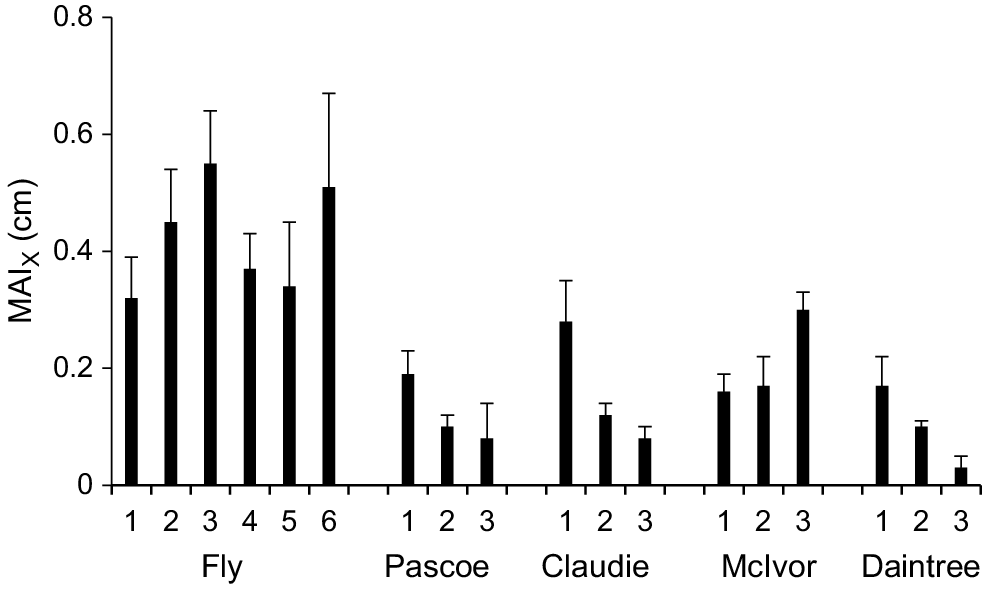
Growth of X. granatum individuals in growth plots, measured as the MAI, varied over 1 order of magnitude (from 0.03 to 0.55 cm year−1) across the study area (Fig. 3). The highest MAIs were recorded in some Fly River plots. The lowest growth rate was recorded from a plot in the Daintree River (Fig. 3). For data pooled across plots within rivers, there were positive correlations between MAI and DBH of individual trees in the Fly (r116 = 0.44, P < 0.01), Pascoe (r88 = 0.24, P < 0.05) and Claudie (r78 = 0.36, P < 0.01), but not in the McIvor (r66 = 0.21, n.s.) or the Daintree (r77 = 0.01, n.s.).
Mean mean annual increment in DBH for X. granatum (MAIX) (+1 s.e.) in all growth plots in the five estuaries.
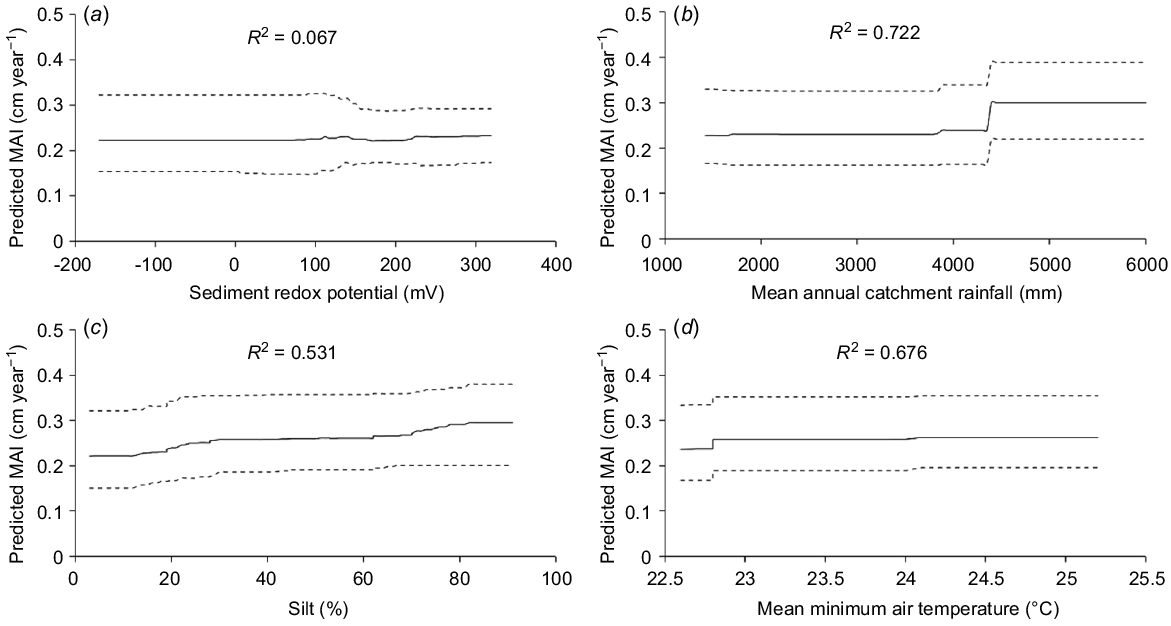
The ecosystem BRT model for MAI showed that a mix of regional-scale climate-predictor variables and site-scale edaphic, predictor variables contributed most to variation in growth (Table 4, Fig. 4). MAI was greatest in estuaries where mean annual catchment rainfall was >4000 mm and MAI increased slightly, and was less variable, where soil redox potential was greater than 100 mV (Table 4, Fig. 4). There was a gradual increase in MAI where sediment was between 5 and 75% silt and mean minimum air temperatures were 22.6–25.2°C (Table 4, Fig. 4). The sediment BRT model for MAI also showed that MAI increased steadily with sediment phosphorus between 0.044 and 0.064% P and remained steady thereafter (Table 4, Fig. 4).
Partial-dependence plots for predictor variable with highest relative importance from the ecosystem BRT model of the mean annual increment in DBH (MAI). (a) Sediment redox potential, (b) mean annual catchment rainfall, (c) sediment percentage silt, and (d) mean annual minimum air temperature. Dotted lines are 95% confidence limits. The pseudo-R2 is shown for each predictor.
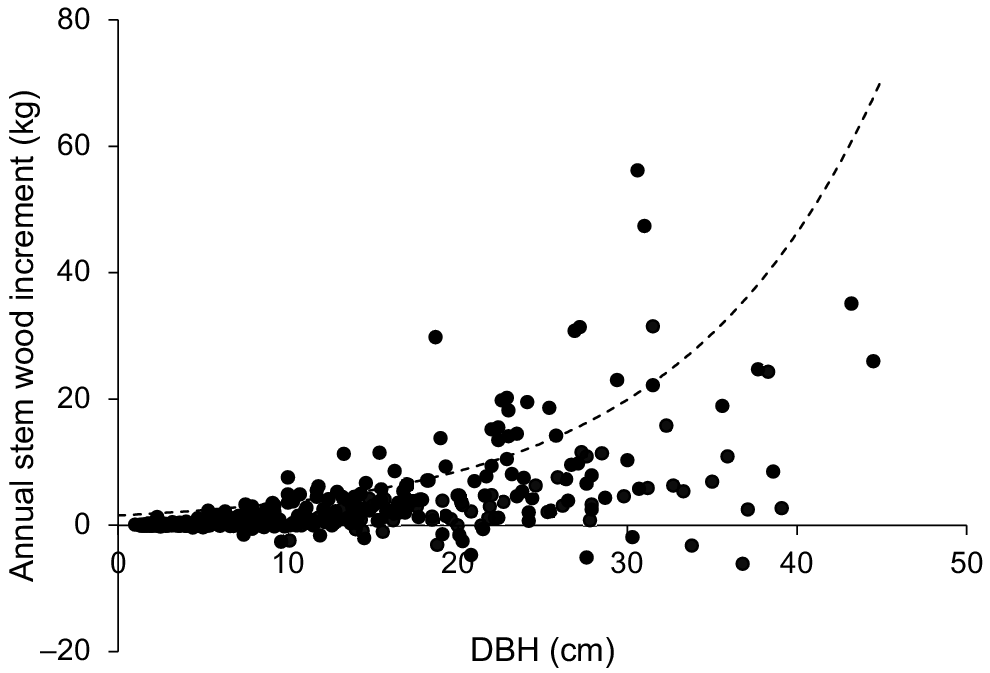
The growth of individual trees from all the growth plots was also expressed as the annual wood-mass increment (kg) scaled with DBH (Fig. 5). There was a large scatter in the data, reflecting differences in MAI among rivers and plots within rivers (Fig. 3). However, annual wood-mass increment per tree generally increased with DBH and comparison with the model fitted to a global data set derived from multispecies tree growth in natural mangrove forests indicated that many individuals of X. granatum exhibited a growth rate significantly greater than for other mangrove species (Fig. 5).
Annual wood-mass increment per tree (kg) plotted against initial diameter at breast height (DBH, cm) for all individual trees of X. granatum in the 18 growth plots used in the study (n = 429). The dashed line shows the relationship between annual wood-growth increments and DBH from a recent global review for trees in natural mangrove forests (Xiong et al. 2019a).
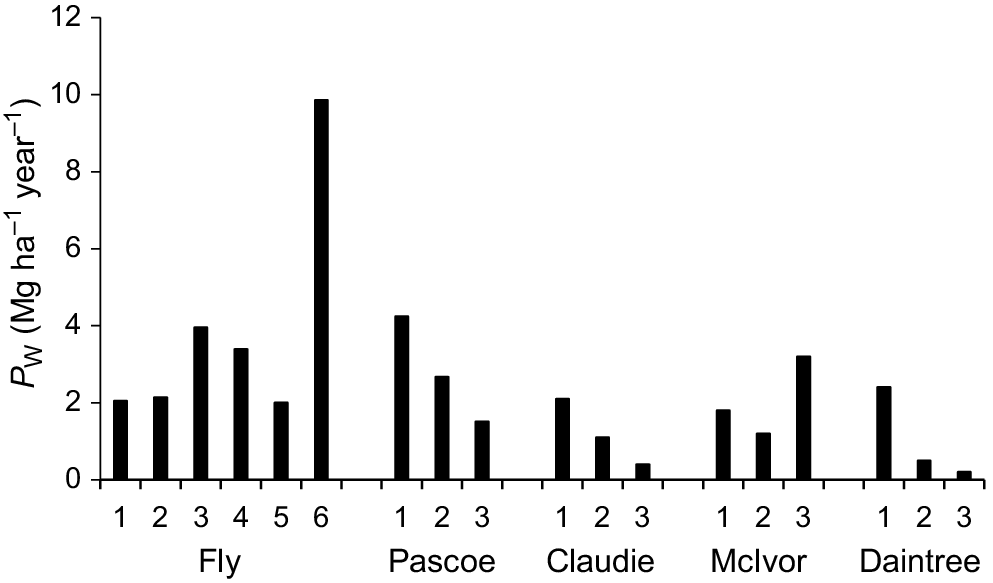
X. granatum PW in growth plots ranged from 0.20 to 9.86 Mg ha−1 year−1 across the five estuaries, with the lowest PW recorded in the Daintree estuary and the highest in the Fly estuary (Fig. 6). Results of the ecosystem BRT model for PW showed that PW decreased steadily as the densities of other trees of all species increased over the range of 400–12,000 stems ha−1 and increased steadily as the percentage of silt in the sediment increased over the range from 5 to 90% (Table 4). When soil redox potential was >180 mV and the density of crab holes was less than 4 holes m−2, PW increased (Table 4).
Discussion
Variation in forest stand structure
Across its range in the Indo West Pacific region, X. granatum usually occurs in diverse mixed forests, grows in most regions of estuaries and can be a dominant species in habitats with freshwater input on well-drained sediments (Bunt et al. 1982; Smith 1992; Cole et al. 1999; Ashton and Macintosh 2002; Trettin et al. 2016; Nur-Fatehah et al. 2022). Across the five estuaries in this study, X. granatum was a numerical (5 of 40 sites) and biomass (4 of 40 sites) dominant at some sites and the species co-occurred with between 3 and 10 other species per site.
Comparison of the DBH size distributions of X. granatum in the five estuaries showed that there were many large (>30 cm DBH) individuals in the Fly and Pascoe rivers, whereas other estuaries were dominated by much smaller size classes. The diameter distribution of the trees in the McIvor and Daintree estuaries exhibited an inverse J-shape curve, which is characteristic of classic uneven-aged stands (Trettin et al. 2016). The frequency of cyclones is much greater in the McIvor and Daintree River regions than in the Pascoe and Fly River regions to the north of our study region (Bureau of Meteorology, see http://www.bom.gov.au/cyclone/tropical-cyclone-knowledge-centre/history/) and the variation in size structure may reflect the frequency and severity of historical disturbance by cyclones (Krauss and Osland 2020). The age structures of the forests in the region are unknown. Some recent advances have shown that X. granatum has annual growth rings related to river flows in the Sundarbans of Bangladesh (Chowdhury et al. 2023). However, X. granatum from the Claudie River has more than one ring per year (Hancock et al. 2006) and it appears that estuary-specific dendrological work on X. granatum will be required before the age structures of forests in this region can be determined (see Roberts et al. 2011).
More large individuals (>30 cm DBH) of X. granatum trees were encountered in four of our estuaries than in forests in Mozambique, Peninsular Malaysia and Sarawak, Malaysia (Shah et al. 2016; Trettin et al. 2016; Nur-Fatehah et al. 2022). Much larger individuals (>120 cm DBH; 31 m in height) have been recorded in Micronesia, probably reflecting the high annual rainfall (>5000 mm) in that region and time for forest tree growth since the last major cyclonic disturbance in 1905 (Cole et al. 1999).
At a few sites in our study, AGBX was similar to mean AGBs for similar geomorphic settings across the Indo West Pacific region. AGBX was surprisingly high in the four sites (three in the Pascoe estuary, one in the McIvor estuary) where X. granatum was a biomass dominant, with a maximum estimate of 232 Mg ha−1 dry mass. When converted to a carbon equivalent (0.475×), this maximum estimate compares well with the mean for multispecies mangrove forests growing in small deltas and tidal systems (180 Mg C ha−1) and large deltas (85 Mg C ha−1) elsewhere in the Indo West Pacific region (Rovai et al. 2021).
The density of trees, basal area and AGB of other species in the mixed-species forests in our study region were the most important predictors of AGBX. This is likely to reflect spatial variation in competition for light during forest establishment and development and on-going competition for sediment nutrient and lower-salinity groundwater resources (e.g. Analuddin et al. 2009; Peters et al. 2020). The BRT model for AGBX also identified higher redox potential having a role in predicting AGBX and AGBX declining with the density of crab holes below a certain threshold value. We included crab-hole density as a physical measure of sediment porosity in mangroves and a priori we expected that because sesarmid crab holes are important locations for water exchange (Stieglitz et al. 2000) that their impact as a predictor of AGBX would be positive. However, sesarmid crabs can be important predators of the seeds of X. granatum and may have helped shape forest composition well prior to our surveys (e.g. Allen et al. 2003).
Globally, mangrove tree height is a function of rainfall, air temperature and cyclone frequency (Simard et al. 2019). There was a wide range of maximum tree heights at our survey sites (4.4–28.8 m). The tallest X. granatum occurred as emergent individuals above a 10-m canopy (Robertson et al. 2020) of Nypa fruticans in the Fly estuary. BRT modelling showed that low groundwater salinity (with a threshold at 18) and greater concentrations of silt (above a threshold of 40%) and phosphorus (above a threshold of 0.065%) in the sediment were important predictors of tree height within our region.
Growth and wood production
We measured a wide range of MAIX across the 18 forest plots in this study (range, 0.03–0.55 cm year−1). MAIX scaled with DBH in the three most northern estuaries and not the two most southern estuaries in our study. In terrestrial forests, MAI generally scales with DBH but interactions between climate and tree physiology modify responses of MAI to increases in DBH (Anderson-Teixeira et al. 2015). Relationships between DBH and MAI do not appear to be common in mangroves (Xiong et al. 2019a) and growth is complex, being influenced by climate, the duration of inundation and sediment factors such as redox potential, groundwater salinity and nutrient availability (Clough 1992; Krauss et al. 2006).
BRT models showed that MAIs increased substantially above mean annual catchment rainfall of >4000 mm and increased with increasing mean minimum air temperatures. MAI also increased with an increasing percentage of silt and when phosphorus concentrations in sediments were between 0.044 and 0.064% P. Well-drained sediments with redox potentials greater than 100 mV also predicted higher MAIs.
The four other existing estimates of MAI for X. granatum are 0.39 cm year−1 in southern Thailand (United Nations Development Programme and United Nations Educational, Scientific and Cultural Organization 1991), 0.31 cm year−1 in the Federated States of Micronesia (Devoe and Cole 1998), 0.24 cm year−1 (based on two trees) in Kenya (Robert et al. 2011) and 0.50 cm year−1 in Tanzania (Njana 2020). The highest MAIs we measured for X. granatum were in the Fly estuary (from 0.32 to 0.55 cm year−1) and were higher than the median (0.24 cm year−1) for mangrove species globally (data from, Xiong et al. 2019b and Njana 2020).
The calculation of annual trunk mass increments per tree incorporates tree size (DBH) within forest plots, and when scaled with tree DBH, represents an excellent way to compare mangrove tree growth across species and regions (Xiong et al. 2019a). It was clear from the results of our study that many Xylocarpus granatum trees have annual trunk mass increments that are greater than the global average for mangrove species.
Plot-level wood production by X. granatum in natural mixed-species forests ranks highly with other tropical terrestrial and mangrove forests. The highest PW for X. granatum recorded in our study was 9.86 Mg ha−1 year−1 in a plot in the Fly estuary. For comparison, mean PW for plots in tropical terrestrial forests in Borneo and the Amazon, that include some of the most productive terrestrial forest sites, were 9.73 Mg ha−1 year−1 and 6.53 Mg h−1 year−1 respectively (Banin et al. 2014). The maximum PW for X. granatum in the Fly estuary was well above the median value of stem wood production globally of 5.75 Mg h−1 year−1 for species of mangroves growing in mainly natural, mixed-species forests (Xiong et al. 2019b). The only previous estimate of wood production for X. granatum is 7.38 Mg h−1 year−1, the mean of 2 years of data from a secondary mangrove forest in one of the wettest provinces in Thailand (Poungparn et al. 2012).
Implications
We have shown that under certain conditions in natural mixed-species forests stands, X. granatum can attain high above-ground biomass with maximum tree heights of >25 m. Trees can grow rapidly and high annual DBH increments can give rise to substantial trunk wood production. Therefore, X. granatum could be a valuable addition to the species mix used in the restoration of mangrove forests in areas where rainfall is high and sediments are silt-dominated, have high phosphorus contents and have positive redox potentials.
The added values for local communities of including X. granatum in plantings are the potential for harvest of high-quality, valuable timber and sequestration of carbon contained in this wood. Potential barriers to adoption of X. granatum inclusion in plantings are the development of silvicultural practices, identification of co-benefits and overcoming the relative scarcity of the large seeds of the species. Experience with this and related species in the Sundarbans shows that such barriers can be overcome (Saenger and Siddiqi 1993; Saenger 2002; Siddiqi et al. 2020), but challenges remain (Rahman and Mahmud 2018).
Acknowledgements
We thank the captain and crews of the AIMS research vessels used in this research for their professionalism and interest in our work. Thanks also go to Frank Tirendi and Paul Christoffersen for help with and advice on sediment analyses. Hanna Sutton helped in the early stages of field data-assessment management. Dr Ken Krauss and Prof. Cath Lovelock provided very helpful reviews of an earlier draft of the paper. The authors acknowledge the Kuuku Ya’u, Northern Kaanju, Gugu Yimithirr and Eastern Kuku Yalanji Peoples, as the Traditional Owners of the sea country where much of this work took place. We pay our respects to their elders past, present and emerging and we acknowledge their continuing spiritual connection to their sea country.
References
Aertsen W, Kint V, De Vos B, Deckers J, Van Orshoven J, Muys B (2012) Predicting forest site productivity in temperate lowland from forest floor, soil and litterfall characteristics using boosted regression trees. Plant and Soil 354, 157-172.
| Crossref | Google Scholar |
Allen JA, Krauss KW, Hauff RD (2003) Factors limiting the intertidal distribution of the mangrove species Xylocarpus granatum. Oecologia 135, 110-121.
| Crossref | Google Scholar | PubMed |
Alongi DM, Christoffersen P, Tirendi F, Robertson AI (1992) The influence of freshwater and material export on sedimentary facies and benthic processes within the Fly Delta and adjacent Gulf of Papua (Papua New Guinea). Continental Shelf Research 12, 287-326.
| Crossref | Google Scholar |
Analuddin K, Suwa R, Hagihara A (2009) The self-thinning process in mangrove Kandelia obovata stands. Journal of Plant Research 122, 53-59.
| Crossref | Google Scholar | PubMed |
Anderson-Teixeira KJ, McGarvey JC, Muller-Landau HC, Park JY, Gonzalez-Akre EB, Herrmann V, Bennett AC, So CV, Bourg NA, Thompson JR, McMahon SM, McShea WJ (2015) Size-related scaling of tree form and function in a mixed-age forest. Functional Ecology 29, 1587-1602.
| Crossref | Google Scholar |
Ashton EC, Macintosh DJ (2002) Preliminary assessment of the plant diversity and community ecology of the Samatan mangrove forest, Sarawak, Malaysia. Forest Ecology and Management 166, 111-129.
| Crossref | Google Scholar |
Ball MC (1988) Ecophysiology of mangroves. Trees 2, 129-142.
| Crossref | Google Scholar |
Ball MC (1998) Mangrove species richness in relation to salinity and waterlogging: a case study along the Adelaide River floodplain, northern Australia. Global Ecology and Biogeography Letters 7, 73-82.
| Crossref | Google Scholar |
Banin L, Lewis SL, Lopez-Gonzalez G, Baker TR, Quesada CA, Chao K-J, Burslem DFRP, Nilus R, Salim AK, Keeling HC, Tan S, Davies SJ, Mendoza AM, Vasquez R, Lloyd J, Neill DA, Pitman N, Phillips OL (2014) Tropical forest wood production: a cross-continental comparison. Journal of Ecology 102, 1025-1037.
| Crossref | Google Scholar |
Bartley R, Keen RJ, Hawdon AA, Hairsine PB, Disher MG, Kinsey-Henderson AE (2008) Bank erosion and channel width change in a tropical catchment. Earth Surface Processes and Landforms 33, 2174-2200.
| Crossref | Google Scholar |
Bosire JO, Dahdouh-Guebas F, Walton M, Crona BI, Lewis RR III, Field C, Kairo JG, Koedam N (2008) Functionality of restored mangroves: a review. Aquatic Botany 89, 251-259.
| Crossref | Google Scholar |
Boto KG, Wellington JT (1983) Phosphorus and nitrogen nutritional status of a northern Australian mangrove forest. Marine Ecology Progress Series 11, 63-69.
| Crossref | Google Scholar |
Boto KG, Wellington JT (1984) Soil characteristics and nutrient status in a northern Australian mangrove forest. Estuaries 7, 61-69.
| Crossref | Google Scholar |
Breiman L (2001) Statistical modeling: the two cultures. Statistical Science 16, 199-231.
| Crossref | Google Scholar |
Bryan-Brown DN, Connolly RM, Richards DR, Adame F, Friess DA, Brown CJ (2020) Global trends in mangrove forest fragmentation. Scientific Reports 10, 7117.
| Crossref | Google Scholar | PubMed |
Bunt JS, Williams WT, Clay HJ (1982) River water salinity and the distribution of mangrove species along several rivers in north Queensland. Australian Journal of Botany 30, 401-412.
| Crossref | Google Scholar |
Bunt JS, Williams WT, Bunt D (1985) Mangrove species distribution in relation to tide at the seafront and up rivers. Australian Journal of Marine and Freshwater Research 36, 481-492.
| Crossref | Google Scholar |
Cadotte MW, Carscadden K, Mirotchnick N (2011) Beyond species: functional diversity and the maintenance of ecological processes and services. Journal of Applied Ecology 48, 1079-1087.
| Crossref | Google Scholar |
Cardinale BJ, Wright JP, Cadotte MW, Carroll IT, Hector A, Srivastava DS, Loreau M, Weis JJ (2007) Impacts of plant diversity on biomass production increase through time because of species complementarity. Proceedings of the National Academy of Science 104, 18123-18128.
| Crossref | Google Scholar |
Chave J, Condit R, Aguilar S, Hernandez A, Lao S, Perez R (2004) Error propagation and scaling for tropical forest biomass estimates. Philosophical Transactions of the Royal Society of London – B. Biological Sciences 359, 409-420.
| Crossref | Google Scholar |
Chowdhury MQ, Sarker SK, Gupta AD, Datta A (2023) Radial growth in mangrove Xylocarpus granatum J. Koenig is driven by salinity in the Sundarbans, Bangladesh. Dendrochronologia 79, 126082.
| Crossref | Google Scholar |
Clough BF, Scott K (1989) Allometric relationships for estimating above-ground biomass in six mangrove species. Forest Ecology and Management 27, 117-127.
| Crossref | Google Scholar |
Cole TG, Ewel KC, Devoe NN (1999) Structure of mangrove trees and forests in Micronesia. Forest Ecology and Management 117, 95-109.
| Crossref | Google Scholar |
Devoe NN, Cole TG (1998) Growth and yield in mangrove forests of the Federated States of Micronesia. Forest Ecology and Management 103, 33-48.
| Crossref | Google Scholar |
De’ath G (2007) Boosted trees for ecological modelling and prediction. Ecology 88, 243-251.
| Crossref | Google Scholar |
Duke NC, Ball MC, Ellison JC (1998) Factors influencing biodiversity and distributional gradients in mangroves. Global Ecology and Biogeography Letters 7, 27-47.
| Crossref | Google Scholar |
Duke NC, Meynecke J-O, Dittmann S, Ellison AM, Anger K, Berger U, Cannicci S, Diele K, Ewel KC, Field CD, Koedam N, Lee SY, Marchand C, Nordhaus I, Dahdouh-Guebas F (2007) A world without mangroves? Science 317, 41-42.
| Crossref | Google Scholar | PubMed |
Elith J, Leathwick JR, Hastie T (2008) A working guide to boosted regression trees. Journal of Animal Ecology 77, 802-813.
| Crossref | Google Scholar |
Ellison AM (2000) Mangrove restoration: do we know enough? Restoration Ecology 8, 219-229.
| Crossref | Google Scholar |
English S, Wilkinson C, Baker V (Eds) (1997) Survey manual for tropical marine resources, 2nd edn. (Published on behalf of ASEAN–Australia Marine Science Project: Living Coastal Resources. Australian Institute of Marine Science) Available at https://www.aims.gov.au/sites/default/files/Survey%20Manual-sm01.pdf
Ewel KC, Twilley RR, Ong JE (1998) Different kinds of mangrove forests provide different goods and services. Global Ecology and Biogeography Letters 7, 83-94.
| Crossref | Google Scholar |
Friess DA, Rogers K, Lovelock CE, Krauss KW, Hamilton SE, Lee SY, Lucas R, Primavera J, Rajkaran A, Shi S (2019) The state of the world’s mangrove forests: past, present, and future. Annual Review of Environmental Research 44, 89-115.
| Crossref | Google Scholar |
Friess DA, Yando ES, Abuchahla GMO, Adams JB, Cannicci S, Canty SWJ, Cavanaugh KC, Connolly RM, Cormier N, Dahdouh-Guebas F, Diele K, Feller IC, Fratini S, Jennerjahn TC, Lee SY, Ogurcak DE, Ouyang X, Rogers K, Rowntree JK, Sharma S, Sloey TM, Wee AKS (2020) Mangroves give cause for conservation optimism, for now. Current Biology 30, R135-R15.
| Crossref | Google Scholar |
Gu H, Wang J, Ma L, Shang Z, Zhang Q (2019) Insights into the BRT (boosted regression trees) method in the study of the climate–growth relationship of Masson pine in subtropical China. Forests 10, 228.
| Crossref | Google Scholar |
Hagger V, Worthington TA, Lovelock CE, Adame MF, Amano T, Brown BM, Friess DA, Landis E, Mumby PJ, Morrison TH, O’Brien KR, Wilson KA, Zganjar C, Saunders MI (2022) Drivers of global mangrove loss and gain in social-ecological systems. Nature Communications 13, 6373.
| Crossref | Google Scholar | PubMed |
Hancock GJ, Murray AS, Brunskill GJ, Argent RM (2006) Ra isotopes in trees: their application to the estimation of heartwood growth rates and tree ages. Global Biogeochemical Cycles 20, GB4007.
| Crossref | Google Scholar |
Holliday D, Stieglitz TC, Ridd PV, Read WW (2007) Geological controls and tidal forcing of submarine groundwater discharge from a confined aquifer in a coastal sand dune system. Journal of Geophysical Research 112, C04015.
| Crossref | Google Scholar |
Horn AM (1995) ‘Surface Water Resources of Cape York Peninsula.’ (Cape York Peninsula Land Use Strategy, Office of the Co-ordinator General of Queensland, Brisbane, Qld, Australia; Department of the Environment, Sport and Territories, Canberra, ACT, Australia; and Queensland Department of Primary Industries)
Hutchison C, Gravel D, Guichard F, Potvin C (2018) Effect of diversity on growth, mortality, and loss of resilience to extreme climate events in a tropical planted forest experiment. Scientific Reports 8, 15443.
| Crossref | Google Scholar | PubMed |
Huxham M, Kumara MP, Jayatissa LP, Krauss KW, Kairo J, Langat J, Mencuccini M, Skov MW, Kirui B (2010) Intra- and interspecific facilitation in mangroves may increase resilience to climate change threats. Philosophical Transactions of the Royal Society B 365, 2127-2135.
| Crossref | Google Scholar |
Komiyama A, Ong JE, Poungparn S (2008) Allometry, biomass, and productivity of mangrove forests: a review. Aquatic Botany 89, 128-137.
| Crossref | Google Scholar |
Krauss KW, Osland MJ (2020) Tropical cyclones and the organization of mangrove forests: a review. Annals of Botany 125, 213-234.
| Google Scholar | PubMed |
Krauss KW, Doyle TW, Twilley RR, Rivera-Monroy VH, Sullivan JK (2006) Evaluating the relative contributions of hydroperiod and soil fertility on growth of south Florida mangroves. Hydrobiologia 569, 311-324.
| Crossref | Google Scholar |
Krauss KW, Lovelock CE, McKee KL, Hoffman LL, Ewe SML, Sousa WP (2008) Environmental drivers in mangrove establishment and early development: a review. Aquatic Botany 89, 105-127.
| Crossref | Google Scholar |
Lee SY, Primavera JH, Dahdouh-Guebas F, McKee K, Bosire JO, Cannicci S, Diele K, Fromard F, Koedam N, Marchand C, Mendelssohn I, Mukherjee N, Record S (2014) Ecological role and services of tropical mangrove ecosystems: a reassessment. Global Ecology and Biogeography 23, 726-743.
| Crossref | Google Scholar |
Lee SY, Hamilton S, Barbier EB, Primavera J, Lewis JJ III (2019) Better restoration policies are needed to conserve mangrove ecosystems. Nature Ecology and Evolution 3, 870-872.
| Crossref | Google Scholar | PubMed |
Lewis SL, Phillips OL, Sheil D, Vinceti B, Baker TR, Brown S, Graham AW, Higuchi N, Hilbert DW, Laurance WF, Lejoly J, Malhi Y, Monteagudo A, Vargas PN, Sonke B, Nur Supardi MN, Terborgh JW, Martinez RV (2004) Tropical forest tree mortality, recruitment and turnover rates: calculation, interpretation and comparison when census intervals vary. Journal of Ecology 92, 929-944.
| Crossref | Google Scholar |
McKee KL, Faulkner PL (2000) Restoration of biogeochemical function in mangrove forests. Restoration Ecology 8, 247-259.
| Crossref | Google Scholar |
Mulyadi A, Amin B (2016) Vegetation structure and mangrove ecosystem threats in the coastal zone of Dumai, Riau, Indonesia. International Journal of Applied Environmental Science 11, 785-798.
| Google Scholar |
Njana MA (2020) Structure, growth, and sustainability of mangrove forests of mainland Tanzania. Global Ecology and Conservation 24, e01394.
| Crossref | Google Scholar |
Nur-Fatehah SR, Nur-Shafikah I, Shamsul K, Wan-Juliana WA, Norela Sulaiman N, Shahril MH, Nurul-Darsani AD (2022) Stand structure and productivity of the firefly riverine mangrove habitat at three rivers in peninsular Malaysia. Journal of Tropical Forest Science 34, 114-126.
| Crossref | Google Scholar |
O’Connell DP, Fusi M, Djamaluddin R, Rajagukguk BB, Bachmid F, Kitson JJN, Dunnett Z, Tranto A, Tjoa AB, Diele K, Evans DM (2021) Assessing mangrove restoration practices using species-interaction networks. Restoration Ecology 30(4), e13546.
| Crossref | Google Scholar |
Peters R, Walther M, Lovelock C, Jiang J, Berger U (2020) The interplay between vegetation and water in mangroves: new perspectives for mangrove stand modelling and ecological research. Wetlands Ecology and Management 28, 697-712.
| Crossref | Google Scholar |
Phillips OL, Malhi Y, Vinceti B, Baker YT, Lewis SL, Higuchi N, Laurance WF, Núñez Vargas P, Vásquez Martinez R, Laurance S, Ferreira LV, Stern M, Brown S, Grace J (2002) Changes in growth of tropical forests: evaluating potential biases. Ecological Applications 12, 576-587.
| Crossref | Google Scholar |
Pickup G, Marshall AR (2008) Geomorphology, hydrology, and climate of the Fly River system. Developments in Earth and Environmental Sciences 9, 3-49.
| Google Scholar |
Poungparn S, Komiyama A, Sangteian T, Maknual C, Patanaponpaiboon P, Suchewaboripont V (2012) High primary productivity under submerged soil raises the net ecosystem productivity of a secondary mangrove forest in eastern Thailand. Journal of Tropical Ecology 28, 303-306.
| Crossref | Google Scholar |
Rahman MM, Mahmud MA (2018) Economic feasibility of mangrove restoration in the southeastern coast of Bangladesh. Ocean and Coastal Management 161, 211-221.
| Crossref | Google Scholar |
Rahman MM, Zimmer M, Ahmed I, Donato D, Kanzaki M, Xu M (2021) Co-benefits of protecting mangroves for biodiversity conservation and carbon storage. Nature Communications 12, 3875.
| Crossref | Google Scholar |
Robert EMR, Schmitz N, Okello JA, Boeren I, Beeckman H, Koedam N (2011) Mangrove growth rings: fact or fiction? Trees 25, 49-58.
| Crossref | Google Scholar |
Robertson AI, Giddins R, Smith TJ (1990) Seed predation by insects in tropical mangrove forests: extent and effects on seed viability and the growth of seedlings. Oecologia 83, 213-219.
| Crossref | Google Scholar | PubMed |
Robertson AI, Daniel PA, Dixon P (1991) Mangrove forest structure and productivity in the Fly River estuary, Papua New Guinea. Marine Biology 111, 147-155.
| Crossref | Google Scholar |
Robertson AI, Dixon P, Daniel PA, Zagorskis I (2020) Primary production in forests of the mangrove palm Nypa fruticans. Aquatic Botany 167, 103288.
| Crossref | Google Scholar |
Robertson AI, Dixon P, Zagorskis I (2021) Phenology and litter production in the mangrove genus Xylocarpus along rainfall and temperature gradients in tropical Australia. Marine and Freshwater Research 72, 551-562.
| Crossref | Google Scholar |
Rog SM, Clarke RH, Cook CN (2017) More than marine: revealing the critical importance of mangrove ecosystems for terrestrial vertebrates. Diversity and Distributions 23, 221-230.
| Crossref | Google Scholar |
Rovai A, Twilley RR, Castañeda Moya E, Midway SR, Friess DA, Trettin CC, Bukoski JJ, Stovall AEL, Pagliosa PR, Fonseca AL, Mackenzie RA, Aslan A, Sasmito SD, Sillanpää M, Cole TG, Purbopuspito J, Warre MW, Murdiyarso D, Mofu W, Sharma S, Tinh PH, Riul P (2021) Macroecological patterns of forest structure and allometric scaling in mangrove forests. Global Ecology and Biogeography 30, 1000-1013.
| Crossref | Google Scholar |
Saenger P, Siddiqi NA (1993) Land from the sea: the mangrove afforestation program of Bangladesh. Ocean and Coastal Management 20, 23-39.
| Crossref | Google Scholar |
Shah K, Kamal AHM, Rosli Z, Hakeem KR, Hoque MM (2016) Composition and diversity of plants in Sibuti mangrove forest, Sarawak, Malaysia. Forest Science and Technology 12, 70-76.
| Crossref | Google Scholar |
Siddiqi HASM, Hasan SM, Rahman MM (2020) Influence of spacing on growth of dhundul (Xylocarpus granatum) in the Sundarbans of Bangladesh. International Journal of Research and Innovations in Earth Science 7, 2394-1375.
| Google Scholar |
Sillanpää M, Vantellingen J, Friess DA (2017) Vegetation regeneration in a sustainably harvested mangrove forest in West Papua, Indonesia. Forest Ecology and Management 390, 137-146.
| Crossref | Google Scholar |
Simard M, Fatoyinbo L, Smetanka C, Rivera-Monroy VH, Castañeda-Moya E, Thomas N, Van der Stocken T (2019) Mangrove canopy height globally related to precipitation, temperature and cyclone frequency. Nature Geoscience 12, 40-45.
| Crossref | Google Scholar |
Smith TJ, III, Boto KG, Frusher SD, Giddins RL (1991) Keystone species and mangrove forest dynamics – the influence of burrowing by crabs on soil nutrient status and forest productivity. Estuarine, Coastal and Shelf Science 33, 419-432.
| Crossref | Google Scholar |
Stieglitz T, Ridd P, Muller P (2000) Passive irrigation and functional morphology of crustacean burrows in a tropical mangrove swamp. Hydrobiologia 421, 69-76.
| Crossref | Google Scholar |
Sukardjo S (1998) Xylocarpus granatum J.Konig. In ‘Plant Resources of South-East Asia Number 5(3), Timber Trees: lesser-known timbers’. Database record 6491. (Eds MSM Sosef, LT Hong, S Prawirohatmodjo): (PROSEA Foundation: Bogor, Indonesia) Available at https://prosea.prota4u.org/view.aspx?id=6491
Trettin CC, Stringer CE, Zarnoch SJ (2016) Composition, biomass and structure of mangroves within the Zambezi River Delta. Wetland Ecology and Management 24, 173-186.
| Crossref | Google Scholar |
United Nations Development Programme and United Nations Educational, Scientific and Cultural Organization (1991) Research and its application to mangrove ecosystems management in Asia and the Pacific. Final report of the integrated multidisciplinary survey and research programme of the Ranong mangrove ecosystem, UNDP/RAS/86/120. (UNDP, UNESCO: Bangkok, Thailand) Available at https://unesdoc.unesco.org/ark:/48223/pf0000090754
Xiong Y, Cakir R, Phan SM, Ola A, Krauss KW, Lovelock CE (2019a) Global patterns of tree stem growth and stand aboveground wood production in mangrove forests. Forest Ecology and Management 444, 382-392.
| Crossref | Google Scholar |
Xiong Y, Cakir R, Phan SM, Ola A, Krauss KW, Lovelock CE (2019b) Data from: global patterns of tree stem growth and stand aboveground wood production in mangrove forests [Dataset]. Dryad
| Crossref | Google Scholar |
Zanne AE, Lopez-Gonzalez G, Coomes DA, Ilic J, Jansen S, Lewis SL, Miller RB, Swenson NG, Wiemann MC, Chave J (2009) Global Wood Density Database. (Dryad Digital Repository) [Dataset] doi:10.5061/DRYAD.234/1