

Are environmental water requirements being met in the Murray–Darling Basin, Australia?
Fran Sheldon A * , Eytan Rocheta B , Celine Steinfeld B , Matthew J. Colloff C , Brad Moggridge D , Emma Carmody E , Terry Hillman F , Richard T. Kingsford B and Jamie Pittock C
A
B
C
D
E
F
Abstract
In implementing the Murray–Darling Basin Plan, jurisdictions have defined environmental water requirements (EWRs) for sites along Basin rivers. EWRs are the flows (frequency, magnitude, duration, and timing) required to achieve environmental outcomes; they are derived from flow-ecology relationships by using best available scientific knowledge.
To assess EWR achievement across the Murray–Darling Basin over a 43.5-year period (1 July 1979 – 31 December 2022) that included periods of drought as well as widespread flooding.
By using a published EWR assessment tool, we analysed the achievement of EWRs for small fresh, large fresh, bankfull and overbank flows for 23 sites.
At 65% of stream gauge sites assessed, most EWRs evaluated had not been met. We also compared analyses of different time periods, namely, a 43.5-year period, and a 10-year period since the Basin Plan was legislated. This highlighted some improvement in EWR achievement for the small fresh EWR.
Despite some improvements, the continued lack of achievement in meeting EWRs is likely to be a major contributing factor to the ongoing poor health of channel, wetland (including Ramsar wetlands) and floodplain ecosystems across most of the rivers of the Murray–Darling Basin.
Keywords: environmental water requirements, environmental watering needs, flow–ecology relationships, long-term water plans, Murray–Darling Basin, river flows, stream flow, water management.
Introduction
Globally, many rivers are drying from their terminus. The mighty Colorado River once drained into the Gulf of Mexico, but most of its lower reaches are now dry (Daesslé et al. 2016). The Colorado is not alone, the Indus (Pakistan), Amu Darya and Syr Darya (central Asia), Rio Grande (southern USA) and the Yellow River (China), were all once mighty rivers that now, in modern times, frequently run dry before reaching their river mouths (Sun et al. 2008; Pitt and Kendy 2017). In Australia, the death of some one million fish in the semi-arid lower Darling River in early 2019 (Sheldon et al. 2022) focused attention on the causes of an unfolding environmental disaster in Australia’s largest river basin, the Murray–Darling Basin (MDB). For many years, the northern section of the MDB, comprising the Barwon–Darling River, has rarely connected to the Murray River in the south and the Murray River itself has relied on near continuous dredging to maintain its connection with the sea, with the barrages and the sand-bar at the Murray mouth basically rendering the MDB an endorheic system most of the time (Kingsford et al. 2011a; Brookes et al. 2023).
An increased frequency and duration of drying in rivers poses a significant threat to their biodiversity and ecosystem functions, which are often already under pressure owing to surrounding landuse change, increased water-borne pollution and invasive species (Bunn and Arthington 2002; Tickner et al. 2020). Although Tickner et al. (2020) outlined an ‘Emergency Recovery Plan’ for freshwater ecosystems, which covers all forms of anthropogenic impact, they recognised the dominating impact of flow alteration and loss of connectivity on the integrity of river systems. Alterations to the flow regimes of rivers is pervasive in affecting their physical form, biodiversity, and ecosystem functions (Bunn and Arthington 2002; Poff and Zimmerman 2010). Environmental flows have become a key management tool for mitigating some of the impacts of anthropogenic flow alteration (Arthington et al. 2023).
The Murray–Darling Basin (MDB) covers one-seventh of the area of Australia (~1 × 10⁶ km2). Its rivers are hydrologically variable (Puckridge et al. 1998), with flows in the northern Basin, the Barwon–Darling River system, being more frequently influenced by tropical weather patterns, whereas the southern Basin, Murray River system, reflects more temperate patterns of winter–spring rainfall (Hart 2016). The MDB is culturally, environmentally, and socially significant; it has been home to Aboriginal people for more than 50,000 years (Bowler et al. 2003; Humphries 2007), contains globally significant river, wetland, and floodplain ecosystems (Swirepik et al. 2016), and is home to more than 2.1 million people, with a further 1.3 million people dependent on its water resources (Hart 2016). Like all large river basins globally (Vörösmarty et al. 2010), agricultural needs for water in the MDB have resulted in over-allocation of water resources and declining ecosystem health, including ecosystem services. This problem, particularly accentuated for the Coorong and Lower Lakes system in South Australia (Kingsford et al. 2011a) during the Millennium Drought (2001–2009) (van Dijk et al. 2013) was the catalyst for the Water Act 2007 (Cth) and the development of the Murray–Darling Basin Plan in 2012 (Hart 2016).
The Murray–Darling Basin Plan, enacted under Part 2 of the Water Act 2007 (Cth), was established to address the imbalance between high consumptive and inadequate environmental water use, a crucial initiative aimed at safeguarding the long-term health of MDB aquatic ecosystems from excessive water extraction. Under the Basin Plan, comprehensive sets of environmental water requirements (EWRs) have been developed. These EWRs recognise the sequence, frequency, magnitude, and duration of flow events required to achieve identified environmental and ecological outcomes. They inform environmental watering decision-making, environmental risk management and long-term planning and evaluation of the implementation of the Basin Plan (Grafton 2019).
Conceptually, EWRs reflect the hydrological regime required to support biodiversity, ecosystem services, some recreational activities, and cultural and spiritual values that depend on healthy aquatic ecosystems (Arthington et al. 2006). EWRs provide a mechanism for linking flow regimes with environmental outcomes in individual rivers across the MDB (Lester et al. 2011), with flow regimes being based on all water passing a flow gauge in a river, not only water that is legally characterised as ‘environmental water’ (Swirepik et al. 2016). This includes contributions from unregulated and regulated flows, environmental water held under entitlement by state and Commonwealth governments (Swirepik et al. 2016), environmental water set aside through water management planning rules and water destined for consumptive take and operational releases.
In this paper, we assessed the achievement of EWRs against observed flow data at 23 sites across the MDB, over the past 43.5 years and the most recent 10 years (during operation of the Basin Plan). For this analysis, EWRs were selected to encompass river flows from small freshes up to overbank flows. EWR achievement was determined using the MDBA EWR tool (MDBAuth/EWR_tool, ver. 1.0.6, available at https://doi.org/10.5281/zenodo.7435847). This tool uses stream flow timeseries and performs the calculations necessary to determine whether the EWR criteria have been achieved within each year and over the entire timeseries. For a specific EWR to be achieved, flow rates and flow volumes need to be met at a particular site, typically a stream gauge, over a particular timing window, often a season or duration for a specified recurrence frequency; EWR achievement is binary, either achieved or not achieved, for each flow category and for each gauge site. To understand EWR achievement over longer time periods, we also compared achievement using three hydrologically modelled scenarios (natural, pre-Basin Plan and Basin Plan) over a 114-year time period at the same 23 sites These analyses provide the basis for understanding high-priority environmental water needs for the wide range of rivers in the MDB.
Methods
Environmental water requirements (EWRs)
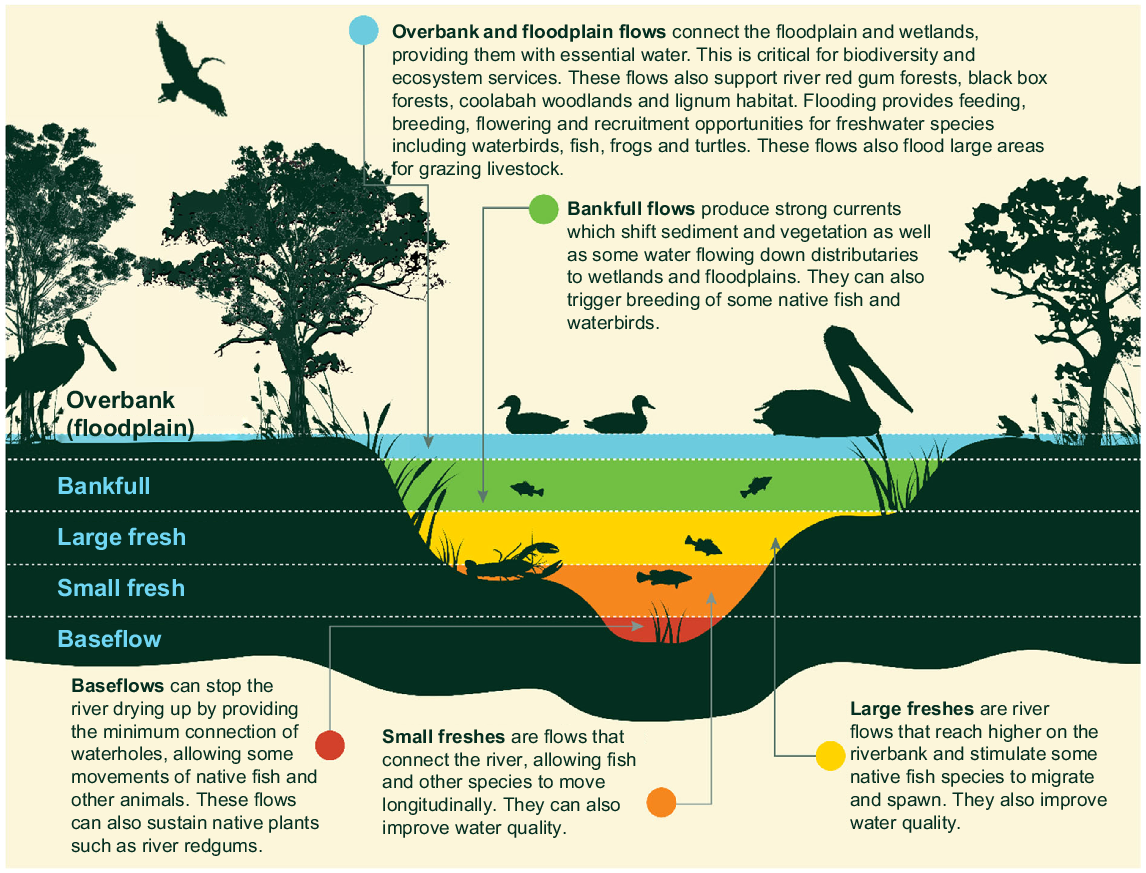
The EWRs used here were drawn from long-term water plans developed for catchments across the MDB. EWRs are standardised into river-flow categories from cease-to-flow through to large overbank flow events (Fig. 1). For each flow category at each site, each EWR provides a guide for achieving the ecological outcomes required to maintain or improve environmental condition and ecosystem functions. EWRs were developed using extensive local, traditional and scientific knowledge about each catchment’s environmental assets and ecosystem functions; they were collected in partnership with water managers, natural resource managers, environmental water holders, landholders and community members (NSW Department of Planning, Industry & Environment 2020a).
Five flow categories linked to scientifically known environmental benefits, for which we used a subset (small fresh, large fresh, bankfull and overbank) to assess achievement of environmental water requirements (EWRs) at different sites in the Murray–Darling Basin.
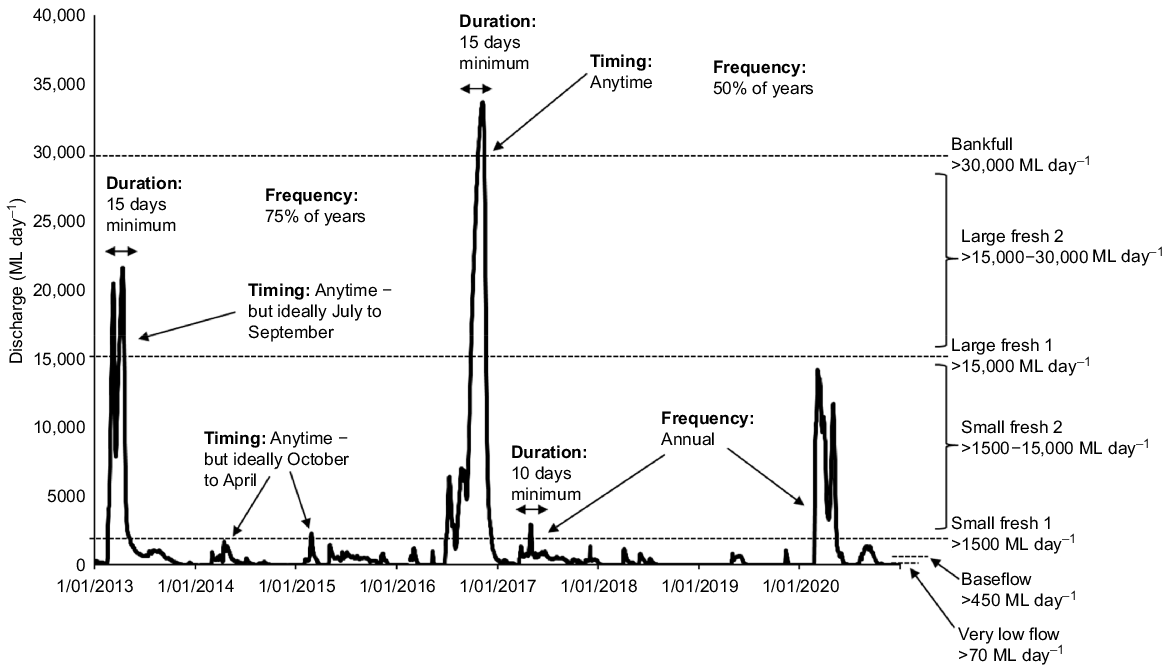
An EWR describes the characteristics of a flow event (magnitude, duration, timing, frequency, and maximum inter-event period) within a particular flow category (e.g. small fresh; Fig. 1) that are required for that event to achieve a specified ecological objective or set of objectives such as replenishing waterhole volumes, providing water at sufficient depth for fish passage, or a flow pulse occurring at the time of year optimal for fish spawning. There can be multiple EWRs within a flow category and many EWRs across multiple flow categories. Fig. 2 conceptually summarises the EWRs for the small fresh, large fresh and bankfull flow categories for the Darling River at the Louth gauge (425004) for the period 2013–2020.
The environmental water requirements (EWRs) for the small fresh 1 (SF1), large fresh 1 (LF1) and bankfull (BK1) flow categories for the Darling River at Louth (gauge 425004). EWRs are described for a specific flow rate and prescribe the timing, duration, frequency, and maximum inter-event period for flow pulses greater that than flow rate. EWRs for SF1 (flow rate of ≥1500 ML day−1; duration of 10 days minimum; timing anytime, but ideally October to April; frequency annual; maximum inter-event period of 1 year), LF1 (flow rate ≥15,000 ML day−1; duration of 15 days minimum; timing anytime, but ideally July to September; frequency of 75% of years; maximum inter-event period of 2 years) and BK1 (flow rate ≥30,000 ML day−1; duration of 15 days minimum; timing anytime; frequency of 50% of years; maximum inter-event period of 4 years) (NSW Department of Planning, Industry & Environment 2020b).
Assessing EWR achievement
Thousands of EWRs have been developed across more than 150 sites on the rivers of the MDB by the Murray–Darling Basin Authority (MDBA) and state governments, representing outcomes for each of the major rivers, wetlands, and species. We evaluated 23 EWR sites on representative rivers that matched stream gauge sites used as hydrological indicator sites by the MDBA during the development of the Basin Plan (Murray–Darling Basin Authority 2010a; Swirepik et al. 2016). These hydrological indicator sites have at least one stream gauge in each river catchment and align with the hydrological river model sites in the Basin Plan (Murray–Darling Basin Authority 2012). We did not use sites where daily-timescale observed or modelled streamflow data were not available or where there were substantial observed data gaps or known model biases. Appendix A1 outlines the EWRs used and their achievement criteria. The qualitative hydrological metrics that define EWRs are broadly divided into flow (in-channel) and volume (in weir pools and storages) metrics. In this paper, we assessed only flow-based EWRs. These are consistently defined across all flow categories on the basis of the following parameters (Table 1): minimum flow threshold (which can also include a maximum flow threshold), start and end month, target frequency (which can include minimum and maximum target frequencies), number of events per year, the duration of events, the minimum spell length of flows above a threshold, which contribute to the duration of events, the maximum inter-event period, and the maximum within-event gap tolerance.
| EWR parameter | Unit | EWR value | Explanation | |
|---|---|---|---|---|
| Flow threshold minimum | Flow (ML day−1) | 15,000 | The minimum flow threshold for an event | |
| Flow threshold maximum | Flow (ML day−1) | Optional: the maximum flow threshold for an event | ||
| Start month | Month | 7 | Start of the timing window (July) | |
| End month | Month | 6 | End of the timing window (June) | |
| Event duration | Days | 15 | The duration of flow above the threshold for the event (generally consecutive days depending on the minimum spell length and the within event-gap tolerance) | |
| Minimum spell length | Days | 15 | Minimum consecutive number of days that contribute to the event duration | |
| Within event gap tolerance | Days | 0 | Tolerance for the number of days within an event where the flow can drop below the flow threshold | |
| Maximum inter-event period | Years | 2 | Maximum period between events | |
| Events per year | 1 | Number of events within an ‘achievement year’. Usually one, but some EWRs require multiple events per year to be achieved | ||
| Multigauge | Gauge number | Optional: if multiple gauges are used | ||
| Target frequency | Percentage of years | 75 | The targeted frequency (i.e. events are targeted for 75% of years) | |
| Target frequency minimum | Percentage of years | 50 | Optional: the minimum targeted frequency | |
| Target frequency maximum | Percentage of years | 100 | Optional: the maximum targeted frequency |
The method used to choose sites and EWR flow ranges closely reflected that employed by the MDBA to support the determination of the environmentally sustainable level of take (Murray–Darling Basin Authority 2012). We used MDBAuth/EWR_tool (ver. 1.0.6, see https://doi.org/10.5281/zenodo.7435847), Python code developed by the MDBA, to evaluate achievement of EWRs at these 23 sites. The EWR assessment tool tracks EWR achievement at streamflow gauges in real time and allows comparison of EWR achievement between hydrological model simulations. The tool can be run in the following two modes: (1) ‘real time testing’ through automatically downloading and evaluating observed stream flow data, and (2) ‘scenario testing’ through evaluating inputted timeseries data.
Real-time, or ‘observed’ streamflow data, were formatted as MDBA BIGMOD data and processed through the ‘scenario-testing’ option because this allowed for pre-processing of input streamflow data (such as gap filling) before EWR evaluation. The EWR tool was configured to recognise EWR achievement even when the minimum and maximum flow thresholds and the flow durations were up to 10% lower than the target value. These allowances were provided to account for uncertainty with the specification of EWR criteria and were consistent with allowances applied in the determination of the environmentally sustainable level of take (ESLT) (Murray–Darling Basin Authority 2011).
Each New South Wales (NSW) site assessed contained, on average, 23 EWRs, often including multiple distinct EWRs within each flow category. From all the EWRs available, we selected an EWR to represent the following flow categories (Fig. 1, 2): small fresh, large fresh, bankfull, and overbank flow. Cease-to-flow, very low flow and baseflow environmental water requirements were not assessed because, at the time of assessment, revisions were still being made to the EWR assessment tool for evaluating these flow categories. Where multiple distinct EWRs existed for a particular flow category at a site, we adopted a conservative approach, opting for EWRs with smaller flow rates or shorter durations. Where the flow rates and durations were identical, we assessed the EWR most likely to be regularly achieved by considering the required duration, recurrence frequency and timing window; we did not assess the maximum inter-event period as part of the EWR assessment. In cases where EWRs had both a preferred timing window and a satisfactory timing window, we assessed against the more lenient satisfactory timing window. Within the overbank and floodplain flow category, each site usually contained multiple EWRs which represented a range of overbank flows from small overbank flows (which are targeted to occur more frequently) to very large overbank flows, which can be achieved only during large natural flood events. We conservatively assessed only the smallest of the overbank and floodplain flows, omitting EWRs associated with moderate and major flooding from the evaluation.
EWR comparisons
To explore EWR achievement, we used both observed hydrological data as well as a comparison among hydrological model scenarios. To assess EWR achievement across the MDB against observed hydrological data, we evaluated the longest observed time period for each site from state-based stream gauge data portals (Table 2). The longest common time period across most sites with substantially continuous data was 43.5 years from 1 July 1979 to 31 December 2022. This period covered three severe droughts, including that in 1997–1998, the Millennium Drought (2001–2009; van Dijk et al. 2013) and that in 2017–2020, as well as periods of sustained high rainfall and flows, including the La Niña events of 2020–2023. We included an additional 6-month period from 1 July 2022 to 31 December 2022 rather than ending the assessment at the water year, because this additional period contained large flood events across the Basin that were outside the average flow conditions, and which contributed to enhancing EWR achievement.
| Stream gauge number | Site code | Stream gauge location | Period | Period length (days) | Missing data | |||
|---|---|---|---|---|---|---|---|---|
| Count (days) | Percentage | Max. gap length | ||||||
| 425004 | N10 | Darling River at Louth (N) | 3 May 1992–31 December 2022 | 11,200 | 168 | 1.50 | 120 | |
| 421090 | N3 | Combined flow at the Macquarie River downstream of Marebone Weir and at Marebone Break (N) | 12 April 1986–31 December 2022 | 13,413 | 98 | 0.73 | 98 | |
| 12 April 1986–31 December 2022 | 13,413 | 160 | 1.19 | 118 | ||||
| 425003 | N5 | Darling River at Bourke Town (N) | 1 July 1979–31 December 2022 | 15,890 | 223 | 1.40 | 108 | |
| 425012 | S11 | Darling River at Menindee upstream of Weir 32 (N) | 1 July 1979–23 November 2022 | 15,852 | 262 | 1.65 | 99 | |
| 409003 | S6 | Edward River at Deniliquin (N) | 1 August 1981–16 July 2018 | 13,499 | 134 | 0.99 | 91 | |
| 416001 | N2 | Barwon River at Mungindi (N) | 1 July 1979–31 December 2022 | 15,890 | 84 | 0.53 | 84 | |
| 412005 | S2 | Lachlan River at Booligal (N) | 1 July 1979–31 December 2022 | 15,890 | 85 | 0.53 | 78 | |
| 425008 | N8 | Darling River at Wilcannia (N) | 1 July 1979–31 December 2022 | 15,890 | 162 | 1.02 | 65 | |
| 410040 | S9 | Murrumbidgee River downstream of Maude Weir (N) | 1 July 1979–31 December 2022 | 15,890 | 65 | 0.41 | 48 | |
| 410130 | S8 | Murrumbidgee River downstream of Balranald Weir (N) | 1 July 1979–31 December 2022 | 15,890 | 56 | 0.35 | 23 | |
| A4260509 | S13 | Murray River Flow to South Australia (S) | 1 July 1979–31 December 2022 | 15,890 | 81 | 0.52 | 7 | |
| 409025 | S3 | Murray River downstream of Yarrawonga Weir (N) | 1 July 1979–31 December 2022 | 15,890 | 9 | 0.06 | 5 | |
| 407205A | S5 | Loddon River at Appin South (V) | 1 July 1979–31 December 2022 | 15,890 | 5 | 0.03 | 5 | |
| 414203 | S12 | Murray River at Euston (N) | 1 July 1979–31 December 2022 | 15,890 | 2 | 0.01 | 2 | |
| 410005 | S10 | Murrumbidgee River at Narrandera (N) | 1 July 1979–31 December 2022 | 15,890 | 2 | 0.01 | 2 | |
| 409207 | S4 | Murray River at Torrumbarry (N) | 1 July 1979–31 December 2022 | 15,890 | 3 | 0.02 | 2 | |
| 406202C | S1 | Campaspe River at Rochester (V) | 1 July 1979–31 December 2022 | 15,890 | 2 | 0.01 | 2 | |
| 422015 | N9 | Culgoa River at Brenda (N) | 1 July 1979–31 December 2022 | 15,890 | 0 | 0 | 0 | |
| 422016 | N7 | Narran River at Wilby Wilby (N) | 1 July 1979–31 December 2022 | 15,890 | 0 | 0 | 0 | |
| 419021 | N6 | Namoi River at Bugilbone (N) | 1 July 1979–31 December 2022 | 15,890 | 0 | 0 | 0 | |
| 418004 | N4 | Gwydir River at Yarraman Bridge (N) | 1 July 1979–31 December 2022 | 15,890 | 0 | 0 | 0 | |
| 417001 | N1 | Moonie River at Gundablouie (N) | 1 July 1979–31 December 2022 | 15,890 | 0 | 0 | 0 | |
| 405232C | S7 | Goulburn River at McCoys Bridge (V) | 1 July 1979–31 December 2022 | 15,890 | 0 | 0 | 0 | |
Data were sourced from https://realtimedata.waternsw.com.au/ (N), https://data.water.vic.gov.au/ (V), https://water.data.sa.gov.au/ (S).
Stream gauge data gaps for periods of less than 120 consecutive days were infilled using linear interpolation, an approach aligned with techniques used in MDBA assessments (Murray–Darling Basin Authority 2013; 2020a). Infilling was applied to 17 of the 23 datasets (Table 2), with stream gauges along the Darling River at Louth, Bourke Town and Menindee containing the highest percentage of missing days, ranging from 1.40 to 1.65%. Three sites, the Darling River at Louth, the combined flow at the Macquarie River downstream of Marebone Weir and at Marebone Break and the Edward River at Deniliquin, contained continuous gaps too long to reasonably fill with this approach and so we used a reduced time period without data gaps for these sites (Table 2). EWR achievement was then determined for the full 43.5 years of observed gauge data (1979–2022) as well as a shorter 10-year period that corresponds with the commencement of the Basin Plan (2012–2022).
EWR achievement was also compared across three hydrological model scenarios simulated over a 114-year period (1895–2009) by the MDBA to inform the Basin Plan (Murray–Darling Basin Authority 2012). EWR achievement was compared across the following three scenarios: (1) modelled without any water resource development and therefore near-natural conditions (without development model); (2) modelled without Basin Plan sustainable diversion limit (SDL) settings, before implementation of the Basin Plan (baseline model); and (3) modelled with Basin Plan implementation settings, 2750 GL including the SDL adjustment scenario of 605 GL less 70 GL reduction in the northern basin (Murray–Darling Basin Authority 2017) (Basin Plan model).
Assessing environmental water requirement (EWR) achievement
EWR achievement was assessed using the MDBAuth/EWR_tool (ver. 1.0.6, see https://doi.org/10.5281/zenodo.7435847). This tool provides a publicly available method to consistently assess EWR achievement across the MDB. By way of overview, the tool iterates over each day in the timeseries and identifies all events within each water year where the sequences of flow are equal to or greater than the specified EWR criteria (flow rate, timing window, duration, minimum spell length, within event gap tolerance). EWRs are generally assessed over water years unless an assessment criterion, such as the timing window, requires bridging of multiple water years.
Summary statistics for successful events over the duration of the timeseries are returned, including the total frequency of achievement and duration of inter-event periods. These summary statistics can then be compared against the targeted frequency of achievement to identify whether the EWRs were achieved over the length of the timeseries. Although EWR achievement can be assessed on individual flow events, or over shorter periods of time, we assessed EWR achievement in aggregate over the entire flow record as a means of identifying whether environmental water needs have been met over the long term, in line with the aims of the Basin Plan. We adopted a conservative approach, defining EWR achievement or success when the frequency of flow events for that EWR occurred at a rate equal to, or higher than, 90% of the required frequency.
For detailed information on the method for evaluating EWR achievement using the EWR tool, including EWR interpretation assumptions, see the EWR tool user manual available through the MDBA GitHub repository (see https://github.com/MDBAuth/EWR_tool).
EWR achievement needs to be assessed over an extended time period, because the natural background hydrological variability of rivers in the MDB (Puckridge et al. 1998) means that achievement is not predictable. For example, the large fresh EWR (LF1) for the Louth gauge (Fig. 2) states that the event needs to be achieved in 75% of years, but this does not mean this EWR is always achieved every 3 years in 4; in wetter periods, it may be achieved every year; however, in naturally dry periods, it may not be achieved for several years, even before water resource development (Leigh et al. 2010).
Results
Hydrological context
The 43.5-year period of hydrological data analysed included several La Niña events (1988–1989; 1998–2001; 2007–2009; 2010–2012; 2020–2023; see the Bureau of Meteorology’s Long Range Weather and Climate at http://www.bom.gov.au/climate/) where rainfall, and therefore river discharge, was higher than average, often leading to widespread flooding (Chiew et al. 1998). Sequential years of La Niña conditions, as occurred in 2010–2012 and then again in 2020–2023, generated some of the largest floods in the MDB (Leigh et al. 2010) (Fig. 3). The time period used for analysis also covered several El Niño events (1982–1983; 1987–1988; 1991–1995, 1997–1998, 2002–2003; 2006–2007; 2009–2010; 2015–2016; see http://www.bom.gov.au/climate/), including one of the most severe droughts on record, the Millennium Drought (2001–2009) (van Dijk et al. 2013), and a shorter period of extreme drought (2017–2019) where inflows to the MDB were the lowest on record (Fig. 3) (Holgate et al. 2020).
Stream discharge (ML day−1) at two gauges in the two major river catchments: (a) Darling River at Bourke (425003) and (b) Murray River downstream of Euston (414203) for the period 1 July 1979 – 31 December 2022. Discharges required to meet the EWR flow threshold for small freshes (green), large freshes (blue), bankfull (orange) and overbank (red) for each gauge are displayed. The time period of the Millennium Drought (2001–2010) is shaded grey.

Achieving environmental water requirements (EWRs) over the past 43.5 years
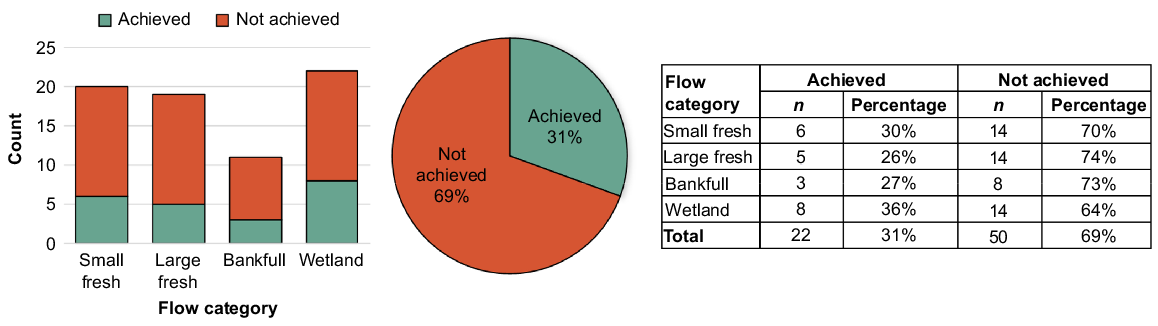
Across the MDB, there were only two sites where all assessed EWRs were achieved over the 43.5-year period, namely, the Moonie River at Gundablouie and the Campaspe River at Rochester, whereas 11 sites had 0% achievement (Table 3). Less than one-third (31%) of the 72 EWRs assessed at 23 sites were achieved (Fig. 4), with achievement variable across flow bands (Table 3, Fig. 4).
| Site code | Stream gauge location | Small fresh | Large fresh | Bankfull | Wetland | Percentage achieved | North or south MDB | Upstream of Ramsar location | Downstream of CMS constraint location | |
|---|---|---|---|---|---|---|---|---|---|---|
| S1 | Campaspe River at Rochester | Y | Y | Y | 100 | South | ||||
| N1 | Moonie River at Gundablouie | Y | Y | Y | 100 | North | ||||
| N2 | Barwon River at Mungindi | Y | N | Y | Y | 75 | North | |||
| N3 | Combined flow at the Macquarie River downstream of Marebone Weir and at Marebone | Y | Y | N | 67 | North | x | |||
| N4 | Gwydir River at Yarraman Bridge | Y | N | Y | 67 | North | x | |||
| N5 | Darling River at Bourke Town | N | N | Y | Y | 50 | North | |||
| N6 | Namoi River at Bugilbone | N | Y | N | Y | 50 | North | |||
| S2 | Lachlan River at Booligal | N | Y | N | 33 | South | ||||
| N7 | Narran River at Wilby Wilby | N | N | Y | 33 | North | x | |||
| N8 | Darling River at Wilcannia | N | N | N | Y | 25 | North | |||
| S3 | Murray River downstream of Yarrawonga Weir | Y | N | N | N | 25 | South | x | x | |
| S4 | Murray River at Torrumbarry | N | Y | N | N | 25 | South | x | x | |
| S5 | Loddon River at Appin South | N | 0 | South | ||||||
| S6 | Edward River at Deniliquin | N | 0 | South | x | x | ||||
| S7 | Goulburn River at McCoys Bridge | N | 0 | South | x | |||||
| S8 | Murrumbidgee River downstream of Balranald Weir | N | N | 0 | South | x | ||||
| S9 | Murrumbidgee River downstream of Maude Weir | N | N | N | 0 | South | x | |||
| S10 | Murrumbidgee River at Narrandera | N | N | N | 0 | South | x | x | ||
| N9 | Culgoa River at Brenda | N | N | N | 0 | North | ||||
| N10 | Darling River at Louth | N | N | N | N | 0 | North | |||
| S11 | Darling River at Menindee upstream of Weir 32 | N | N | N | N | 0 | South | |||
| S12 | Murray River at Euston | N | N | N | N | 0 | South | x | x | |
| S13 | Murray River Flow to South Australia | N | N | N | N | 0 | South | x | x |
Sites upstream of Ramsar-listed wetlands of international importance or downstream of the key focus areas for the constraints management strategy (CMS) of Murray–Darling Basin Authority are identified (x).
Environmental water requirements (EWRs) achieved and not achieved in relation to the four flow categories (see Fig. 1) analysed using historical flow data, for 72 EWRs across 23 sites of the Murray–Darling Basin’s major rivers, 1979–2022 (43.5 years), the percentage of all EWRs achieved and not achieved across all sites and a tabular breakdown of the number of sites, and associated percentage, where EWRs were achieved and not achieved for each of the four flow categories from the long-term water plans.
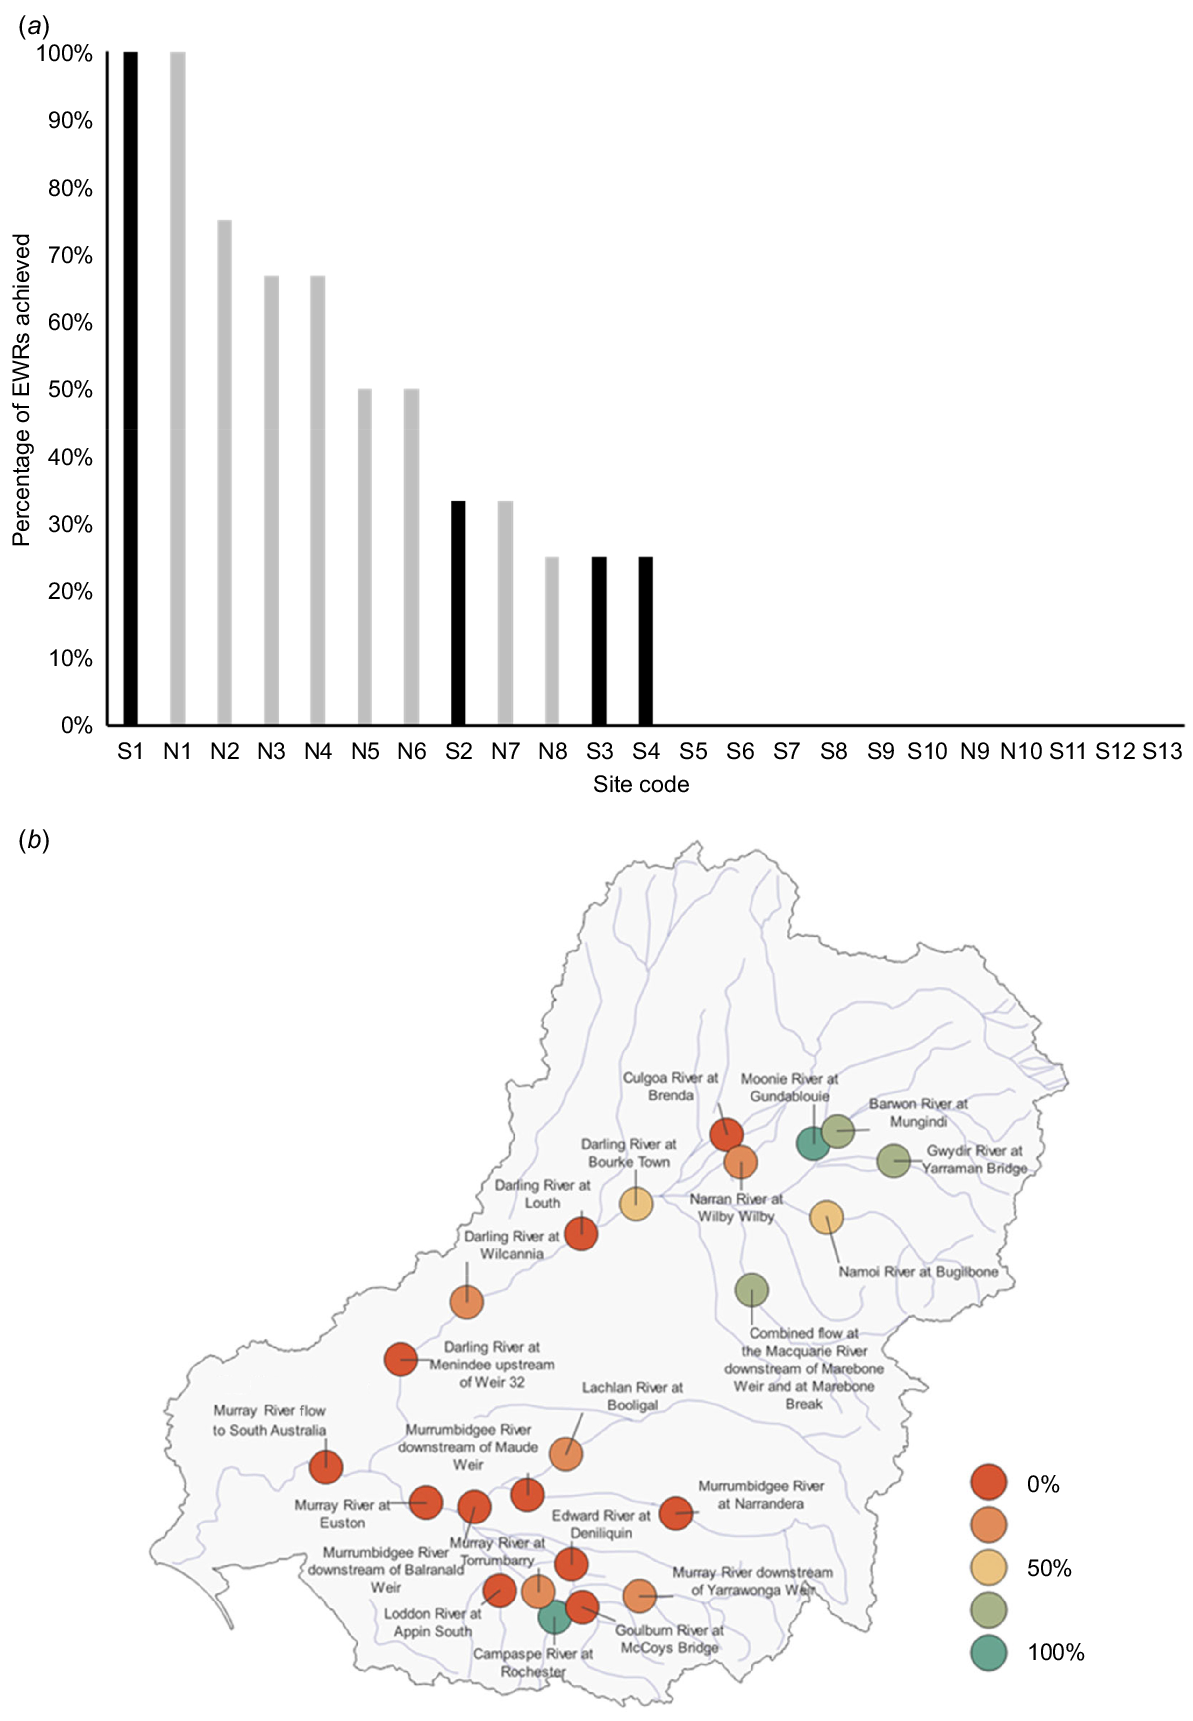
Over the assessed time period, EWRs were more likely to be achieved in the tributaries of the northern MDB (the Darling River tributaries), with sites further downstream and along the Murray River showing lower levels of achievement (Fig. 5). The Barwon River at Mungindi, Gwydir River at Yarraman Bridge and Macquarie River downstream of Marebone Weir achieved most of the EWRs assessed. However, along the main stem of the Darling River and the Murray River and its tributaries, fewer EWRs were achieved over the 43.5-year period, with 50% being achieved in the Darling River at Bourke, 25% at three sites on the Murray River and none achieved at the remaining four sites (Table 3, Fig. 5).
Percentage of environmental water requirements achieved at each stream gauge site (see Tables 1, 3) in the Murray–Darling Basin across four flow categories (see Fig. 1), on the basis of analyses of flow data, 1979–2022 (43.5 years); (a) sites ordered on the basis of percentage EWR achievement, showing southern basin sites (black bars) and northern basin sites (grey bars), see Table 3 for site codes; (b) gauges and percentage EWR achievement are displayed spatially across the MDB, with the circle colour depicting percentage of EWRs achieved.
Environmental water requirement (EWR) across flow categories
Across the MDB, there were similar levels of EWR achievement for small freshes, large freshes and bankfull flows, with slightly higher achievement for overbank (Fig. 6). In the northern Basin, 6 of 10 sites had not achieved the small fresh EWR. This included all sites on the Darling River (Fig. 6, Table 3). Only those sites on the upper tributaries, including on the Macquarie River, the Gwydir River at Yarraman Bridge, the Barwon River at Mungindi and the Moonie River at Gundablouie, met the small fresh EWR. A similar pattern occurred for large freshes, with 7 of 10 sites not meeting this EWR over the period, including all sites along the Darling River (Fig. 6, Table 3). Again, the large fresh EWR was met at similar sites in the northern tributaries, the Macquarie, Namoi and Moonie Rivers. The bankfull EWR was met at only 2 of 5 sites, Bourke on the Darling River, and the Moonie River (Fig. 6, Table 3). The overbank flow EWR was met at 7 of 10 sites across the northern basin, including the Namoi, Gwydir, Moonie and Condamine–Balonne (Narran River at Wilby Wilby) rivers, as well as the Barwon River at Mungindi and two sites along the Darling River (Fig. 6, Table 3).
Achievement of environmental water requirements (EWRs; achieved, green; not achieved, red; not assessed, white) in 1979–2022 at 23 sites in the Murray–Darling Basin analysed by flow category.
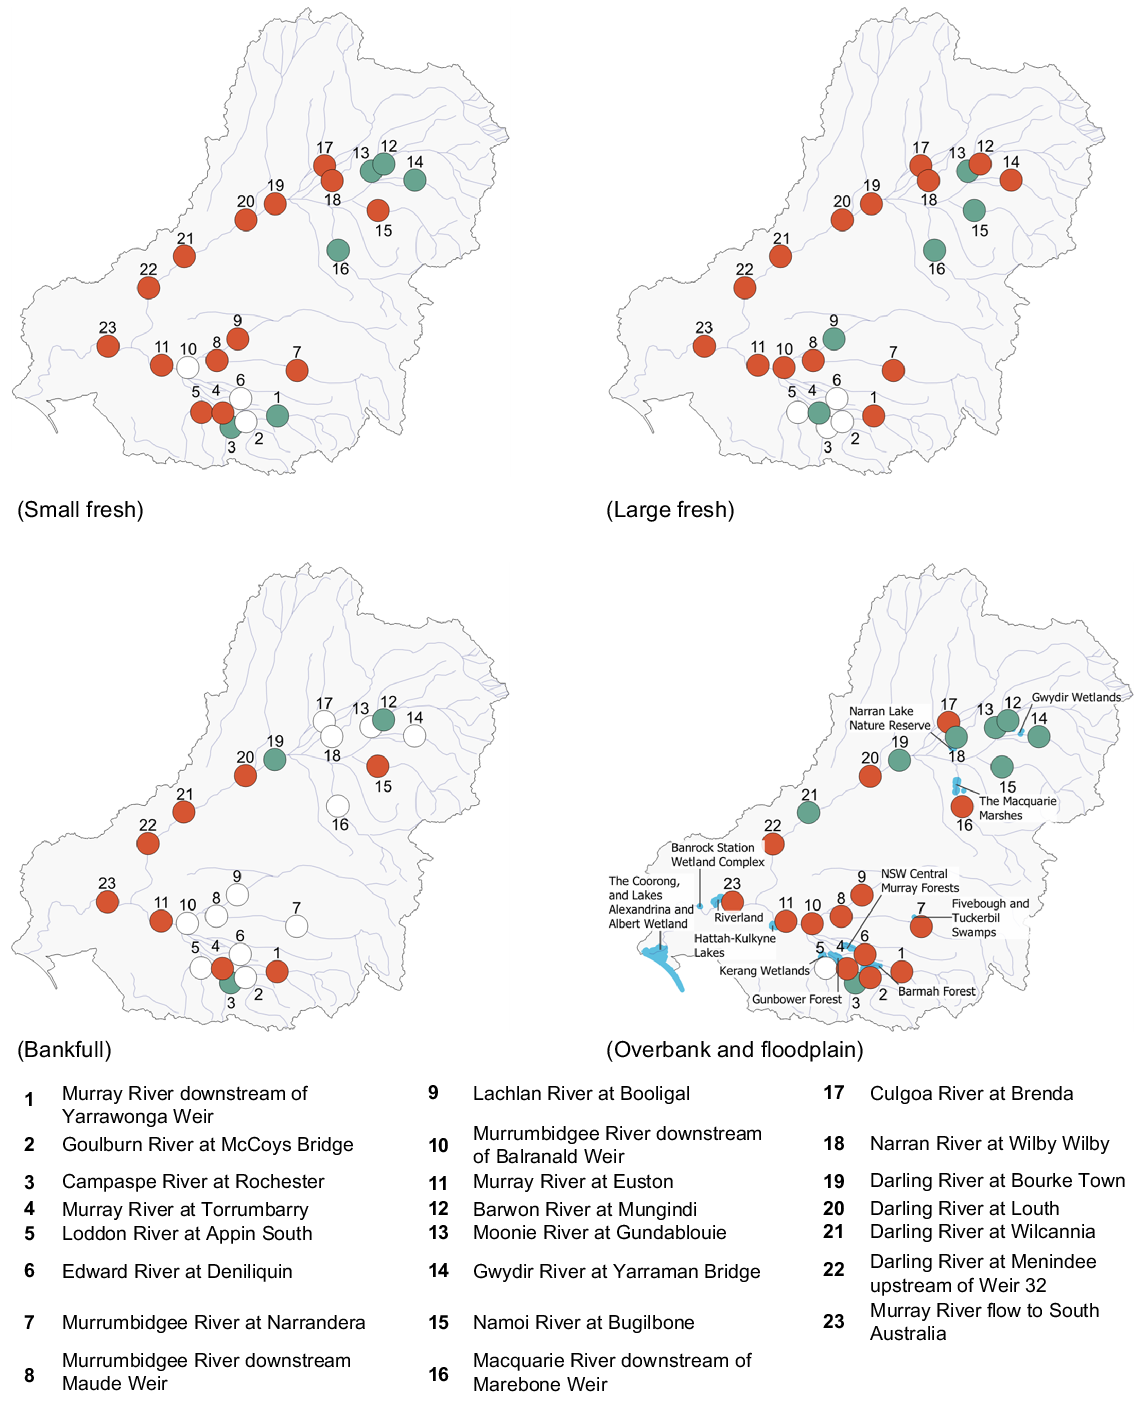
Achievement in the southern Basin was lower than in the northern MDB, over the 43.5-year period, with 8 of 10 sites assessed having not met the small fresh EWR, with achievement only downstream of Yarrawonga Weir and the Campaspe River on the Murray River. Likewise, 7 of 9 sites assessed had not met the large fresh EWR, which was achieved only on the Lachlan Valley and the Torrumbarry gauge on the Murray River. The bankfull EWR was met only on the Campaspe River, with all remaining sites failing (5 of 6); the same result was evident for overbank flows, with only the Campaspe River at Rochester meeting this EWR (Fig. 6, Table 3).
For Ramsar-listed wetlands of international importance across the Basin, only two stream gauges, namely upstream of the Narran Lakes Nature Reserve and the Gwydir Wetlands, achieved the overbank flow EWR (Table 4) over the 43.5-year period. All other assessed stream gauges above Ramsar-listed wetlands, including the Macquarie Marshes, did not meet the overbank flow EWR.
| Ramsar-listed site | Stream gauge | EWR achieved | |
|---|---|---|---|
| Narran Lake Nature Reserve | Narran River at Wilby Wilby | Achieved | |
| Gwydir Wetlands | Gwydir River at Yarraman Bridge | Achieved | |
| The Macquarie Marshes | Macquarie River at downstream of Marebone Weir | Not achieved | |
| Barmah–Millewa | Murray River downstream of Yarrawonga Weir | Not achieved | |
| Werai Forest | Edward River at Deniliquin | Not achieved | |
| Gunbower–Koondrook–Perricoota | Murray River at Torrumbarry | Not achieved | |
| Hattah–Kulkyne Lakes | Murray River at Euston | Not achieved | |
| Riverland and Banrock Station Wetland | Murray River flow to South Australia | Not achieved |
Long-term trends and detecting Basin Plan impacts on environmental water requirements
The total number of flow events meeting EWR flow thresholds for one site in the northern and southern MDB (Darling River at Bourke and Murray River downstream Euston respectively) were calculated for each decade over the 43.5-year period and compared. This analysis suggested a consistent decline in the total number of events in each of the four EWR flow categories in both the northern and southern Basin (Fig. 7). Only the small fresh EWR at the Murray River downstream of Euston showed a positive trend; the number of small freshes meeting this EWR flow threshold increased at this site over the past decade (Fig. 7a, c). When the duration of each flow event meeting EWR flow thresholds was compared across all decades, there was a consistent decline in duration in both the northern and southern Basin for all flow thresholds (Fig. 7b, d). This suggests that although the number of small freshes in the Murray River may have increased, their duration had not.
Decadal trends in total number of flow events for the four EWRs for (a) Murray River downstream Euston (414203) in the southern basin and (c) Darling River at Bourke (425003) in the northern basin, and decadal trends in the total number of days of each flow event above the four EWR flow thresholds for (b) Murray River downstream Euston (414203) in the southern basin and (d) Darling River at Bourke (425003) in the northern basin. Note, the final decade (2013–2022) is 9.5 years and not 10 years.
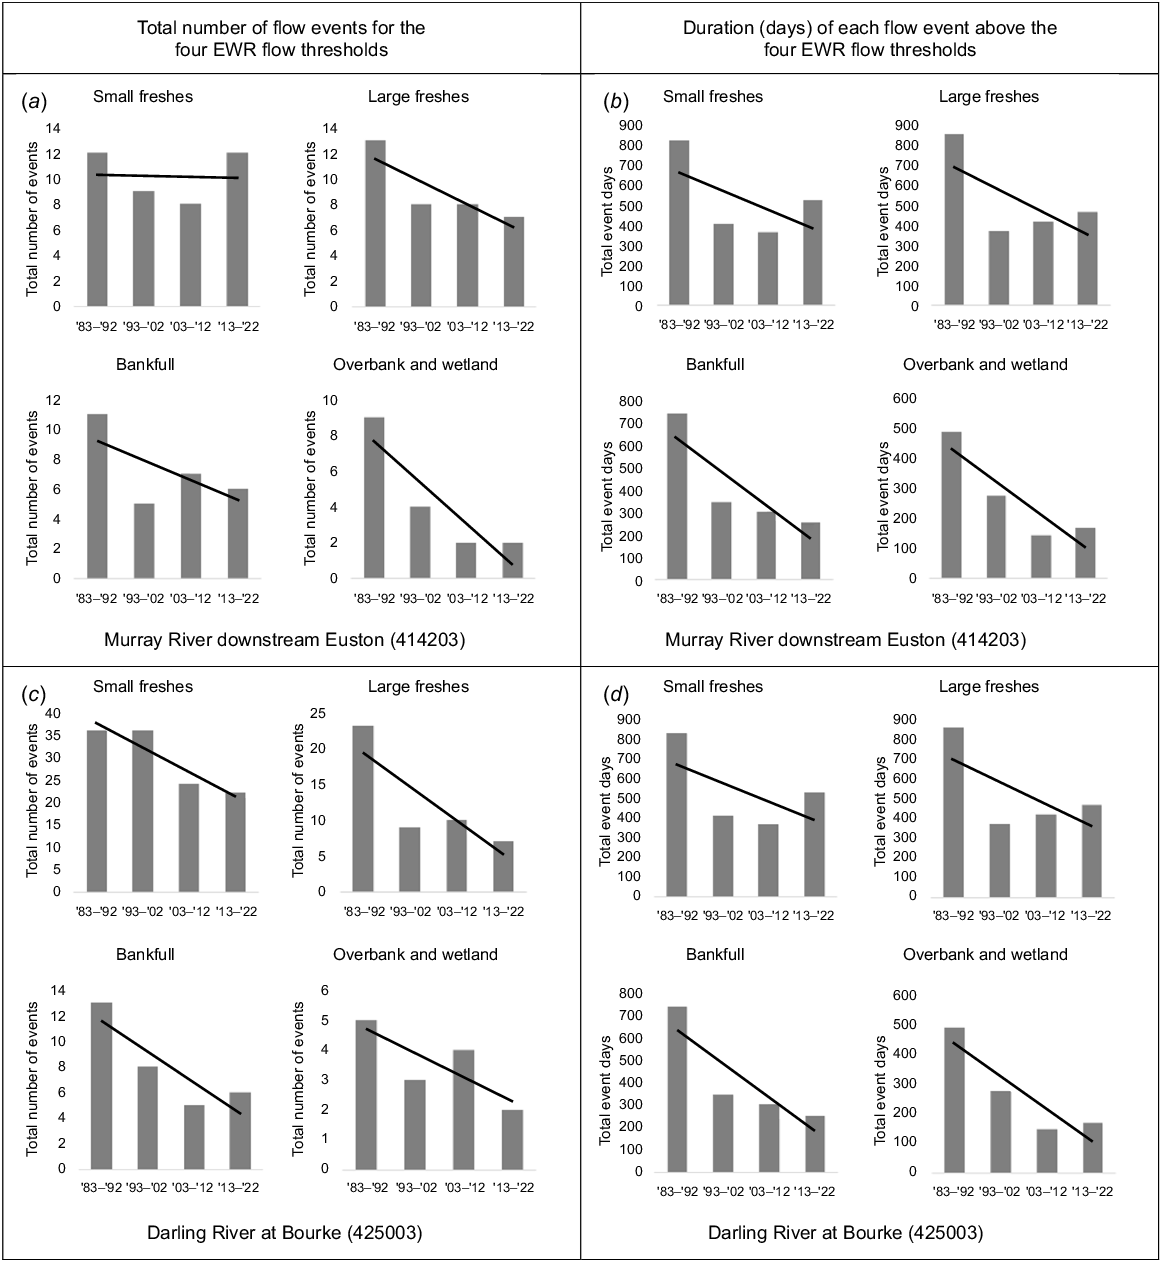
The largest decline in number and duration of thresholds of all four EWR categories occurred between the first decade (1983–1992) and the second decade (1992–2002) (Fig. 7), with some stabilisation of the declining trend in the last decade. However, other than the number of small freshes at the Murray River site, the other thresholds, at both the northern and southern sites, were 50% lower in the most recent decade than in the first decade 1983–1992.
The most recent decade of data was for 2012–2022 when the Basin Plan was partially implemented, during which water extractions were reduced and additional environmental water was made available as managed environmental flows (Swirepik et al. 2016). The percentage change between the 43.5-year flow period compared with the 10 years of Basin Plan flows (Table 5) suggested that there were some increases in EWR flow threshold achievement for small freshes, particularly in the southern Basin and where environmental flows can be delivered. Sites at the ends of river systems, such as the Barwon–Darling River, at sites downstream of Mungindi and the Murray River in South Australia had decreased EWRs achieved over the past 10 years (Table 5, Appendix A2).
| Gauge | Site code | Stream gauge location | Small fresh (%) | Large fresh (%) | |
|---|---|---|---|---|---|
| 406202C | S1 | Campaspe River at Rochester | |||
| 417001 | N1 | Moonie River at Gundablouie | −24 | −4 | |
| 416001 | N2 | Barwon River at Mungindi | 0 | −13 | |
| 421090 | N3 | Combined flow at the Macquarie River downstream of Marebone Weir and at Marebone Break | 5 | −8 | |
| 418004 | N4 | Gwydir River at Yarraman Bridge | 16 | −8 | |
| 425003 | N5 | Darling River at Bourke Town | −25 | −16 | |
| 419021 | N6 | Namoi River at Bugilbone | −22 | −17 | |
| 412005 | S2 | Lachlan River at Booligal | 11 | 16 | |
| 422016 | N7 | Narran River at Wilby Wilby | −8 | −5 | |
| 425008 | N8 | Darling River at Wilcannia | −29 | −13 | |
| 409025 | S3 | Murray River downstream of Yarrawonga Weir | 0 | −15 | |
| 409207 | S4 | Murray River at Torrumbarry | 31 | 9 | |
| 407205A | S5 | Loddon River at Appin South | 21 | ||
| 410130 | S8 | Murrumbidgee River downstream of Balranald Weir | −9 | ||
| 410040 | S9 | Murrumbidgee River downstream of Maude Weir | 5 | −3 | |
| 410005 | S10 | Murrumbidgee River at Narrandera | 3 | −15 | |
| 422015 | N9 | Culgoa River at Brenda | 21 | 7 | |
| 425004 | N10 | Darling River at Louth | −23 | −11 | |
| 425012 | S11 | Darling River at Menindee upstream of Weir 32 | −16 | −28 | |
| 414203 | S12 | Murray River at Euston | 7 | −20 | |
| A4260509 | S13 | Murray River fFlow to South Australia | −14 | −11 |
To further compare EWR achievement and changes through time, we compared achievement on the basis of observed flow data from river gauges for the two time periods (43.5 years and 10 years under the Basin Plan), with achievement using the three modelled scenarios for the 114-year period (1895–2009). The three modelled scenarios included without development (i.e. near natural conditions), baseline (i.e. before Basin Plan) and Basin Plan implementation (i.e. 2750 GL, including the SDL adjustment scenario of 605 GL less 70 GL reduction in the northern basin). By design, this analysis evaluated only EWRs that were achieved in the ‘without development’ scenario, with EWRs that were not achieved being removed from the analysis. The ‘baseline’ scenario achieved just over one-third (35%), and the ‘Basin Plan’ scenario achieved 46%. In comparison, our observed data showed the EWR achievement for the 43.5- and 10-year period was 31 and 26% respectively (Table 6). The analysis of the modelled data supports the trend analysis above, suggesting that current Basin Plan settings should improve EWR achievement from 34% under baseline conditions to 46% under Basin Plan settings. However, this improvement has not yet been seen across all EWRs in the observed data over the past 10 years.
| Item | Modelled scenario | Observed data | ||||
|---|---|---|---|---|---|---|
| Without development (1895–2009) | Baseline (1895–2009) | Basin Plan (1895–2009) | 1 July 1979–31 December 2022 (43.5 years) | 22 November 2012–31 December 2022 (10 years) | ||
| Achieved | 72 | 25 | 33 | 22 | 19 | |
| Not achieved | 0 | 46 | 39 | 50 | 53 | |
| Percentage achieved | 100 | 35 | 46 | 31 | 26 | |
Note: Loddon River at Appin South gauge (407205A) was not assessed in the baseline scenario because the modelled data were in monthly time steps and daily time steps were required; therefore, only 71 EWRs were assessed in the baseline scenario. In the modelled scenario, only EWRs that were achieved in the without-development scenario were used in this analysis, so as to only represent EWRs achievable in the modelling framework. Therefore, the 100% achievement under this scenario arises as a result of removing EWRs that were not achieved under this scenario.
Discussion
Our analysis suggests that over the past 43.5 years, and in the 10 years since the Basin Plan was legislated, most designated EWRs were not achieved across the MDB, including those relevant to Ramsar-listed wetlands. This finding aligns with other flow-indicator evaluations for the MDB, including the annual assessments of environmental watering priorities by the Commonwealth Environmental Water Holder (Commonwealth Environmental Water Office 2020, 2021, 2022) and the analysis by the MDBA of stream-flow indicators, supporting the assessment of the environmentally sustainable level of take (Murray–Darling Basin Authority 2011; Young et al. 2011).
The consistent lack of achievement of EWRs in both the northern and southern Basin reinforces the need for comprehensive and sustainable water management strategies designed to support the requirements of flow-dependent ecosystems. It also highlights the importance of considering environmental needs in the framework of water use. The higher achievement of EWRs in the northern basin over the 43.5-year period is likely to reflect that the assessment period included a longer duration, in which water resource development and use in the northern basin was less developed than it is currently. This observation is underlined by the relatively recent (since the 1970s) development of irrigated agriculture in the Darling River catchments, compared with the Murray River catchments (Kingsford et al. 2017; Quentin Grafton et al. 2022). These findings provide valuable insights for policymakers and water managers to address the challenges in achieving desired environmental outcomes, while meeting the diverse demands for water within the MDB.
Environmental implications
EWRs were designed to represent the minimum water requirements needed to support important environmental assets and ecosystem functions. Where flow regimes fall short of meeting these requirements, ecosystem condition is likely to decline (NSW Department of Planning, Industry & Environment 2020a). Our analyses showed that at 65% of the stream gauge sites assessed over the 43.5 years, most EWRs evaluated had not been met, despite the evaluation period including both periods of drought and widespread flooding (Fig. 3).
The failure to meet the EWR thresholds across such an extended period is reflected in observed declines in species distribution and abundance and ecosystem functions across the MDB (Kingsford et al. 2017; Ryan et al. 2021). The degradation of flow-dependent ecosystems continues to be documented in condition monitoring and evaluation assessments, including the Sustainable Rivers Audits (Davies et al. 2010, 2012), the 2020 Murray–Daring Basin Plan evaluation (Murray–Darling Basin Authority 2020b), and the 2021 State of the Environment Report (Kingsford et al. 2015, 2017; Green and Moggridge 2021).
EWRs also include a parameter that specifies the maximum inter-event period, namely, the longest allowable time between flow events before a significant decline in the condition, survival, or viability of a specific population is likely to occur (NSW Department of Planning, Industry & Environment 2020c), with both the required frequency and maximum inter-event periods needing to be met to achieve environmental outcomes (NSW Department of Planning, Industry & Environment 2020a). Although our study did not assess inter-event frequencies, a brief evaluation showed instances where the maximum inter-event period was exceeded, meaning that if this parameter were assessed, overall EWR achievement would have been further reduced.
Factors contributing to the lack of environmental water requirement achievement
Determining the primary factors that affected EWR achievement over the different time periods assessed requires hind-cast simulations using suitable hydrological river models. This was not our focus; such work could be undertaken using consistent hydrological models across the MDB. However, we qualitatively assessed factors that, individually and collectively, may have influenced the outcomes.
Insufficient frequencies and volumes of water are likely to have reduced achievement of EWRs. Indeed, modelled EWR achievement for different water-resource development scenarios, reflecting varying levels of flow volumes, suggested that frequency and volume were key determinants of EWR achievement (Table 5). The ‘Basin Plan’ modelled scenario over the longer 114-year period achieved only 46% of the EWRs. An inadequate frequency of flow events that met EWR thresholds was a key factor in this low EWR achievement, suggesting that even under Basin Plan settings, full achievement of EWRs will be difficult.
Complexities with how achievement of EWRs is measured using the current assessment tool may have affected the results. Flow timing, duration and other non-volumetric parameters interact with frequency and volumetric parameters, affecting EWR achievement over particular time periods. Insufficient duration of events was sometimes a key factor, but this was not always the case. For example, EWRs at four sites (Campaspe River at Rochester, Loddon River at Appin South, Lachlan River at Booligal and Murrumbidgee River downstream of Maude Weir) required two small freshes within 1 year; however, during the 2022 flood, flows were sustained above the small fresh threshold for the entire year, thus affecting achievement of at least one of those EWRs during that period. Similarly, during that same flood period, some flows above EWR flow thresholds occurred outside the timing window and were not counted towards EWR achievement over that period. Finally, three of the EWRs (all small freshes) at three sites (Campaspe River at Rochester, Loddon River at Appin South and Gwydir River at Yarraman Bridge) had a maximum flow threshold whereby flows needed to be within a flow range to count towards EWR achievement. During the recent floods of 2020–2022, flows were higher than the maximum flow threshold and these EWRs were not counted as being achieved over that period. This suggests that during periods of high flows, when bankfull and overbank EWRs are being met, the concurrent achievement of small fresh EWRs with the maximum flow thresholds are not counted, which means that small fresh and large fresh achievement may be slightly higher than the assessment tool suggests.
In addition, the time period used to assess the EWR achievement may also have an impact. We found that for shorter assessment periods, the start of the time period and the resulting division of the timeseries into yearly blocks could affect the EWR achievement. The use of water years or calendar years can also influence the EWR achievement through the same process. Where there are no timing-window constraints identified in the EWR parameters, the EWR tool assumes that flows can cross over water years. The tool allocates the event to the year that contains most of the event duration. If the event is split evenly between water years, it is allocated to the earlier water year; however, if the event is long enough to be counted in both water years, it is still counted only in one. Further refinement of EWRs and the EWR tool are continuing. We consider that additional research is needed to further identify limitations on the use of EWRs and factors that affect EWR achievement in ways not envisioned when specifying EWRs. This research could help inform future reviews of EWRs as well as EWR assessment methods.
Although environmental flows are not a new concept (Arthington 2015) and are provided for under the Water Act 2007 (Cth) and Basin Plan, there are still challenges in the effective delivery of environmental flows. For example, management of overbank flows for environmental purposes potentially inundates floodplain corridors involving private property. Landholders affected by such flows may argue that their land suffers damage, and if the flows occur without prior landholder approval, may seek compensation. Structures built across rivers, such as roads, bridges and low-level crossings, also limit flow rates that can occur without potentially leading to structural damage. These physical channel-capacity constraints have been operationalised through limits on managed flow rates along certain river reaches, particularly in the Murrumbidgee, Goulburn and Murray rivers. During normal operations, river operators seek to constrain river flows to below these limits. At some sites downstream of constraints identified in the MDBA Constraints Relaxation Strategy (see Table 2), flow limits were smaller than the smallest overbank EWR assessed.
These channel-capacity constraints mean that during normal river operations including regulated river flow, held and planned environmental water cannot be used to meet overbank EWRs, with channel constraints limiting the effectiveness of river operators to provide overbank flows for environmental needs (Young et al. 2011; Kahan et al. 2021). In these cases, outcomes for floodplains and wetlands that rely on overbank EWR achievement are restricted mainly to periods of natural flooding or uncontrolled flow events such as dam spills. Finding approaches to overcome these challenges is crucial to ensuring the successful restoration of floodplain and wetland ecosystems and the species that depend on them.
Uncertainty in flow–ecology relationships and environmental water requirements
The relationships between environmental impacts and the failure to achieve EWRs and environmental outcomes remain uncertain. This reflects the limited empirical data on explicit relationships between flow and ecological response, which are often non-linear and complex (Lester et al. 2011; Colloff et al. 2018). Although many studies have linked altered flow and flooding regimes with environmental degradation (Bunn and Arthington 2002; Poff and Zimmerman 2010; Webb et al. 2010; Arthur et al. 2012; Davies et al. 2014; Colloff et al. 2018), the specific relationships between flow thresholds and ecological responses remain uncertain for many rivers.
To address some of this uncertainty, we used six conservative approaches. These included assessing key representative sites rather than the full domain of EWR sites; allowing 10% leeway for minimum and maximum flow thresholds and flow duration; using smaller flow EWRs for each flow category that were easier to achieve and limited the assessment of larger overbank events; applying the ‘satisfactory’ timing window instead of the ‘preferred’ timing window (the latter generally increased environmental outcomes); recording achievement if the frequency of events was equal to or greater than 90% required; and not limiting EWR achievement on the basis of lack of achievement of maximum inter-event periods.
EWR evaluation was also limited to in-channel stream gauges, which estimate stream flow on the basis of river height through ‘ratings curves’, which often do not adequately capture all important parameters of flow requirements, such as inundation extent during overbank flow events (Ren and Kingsford 2011). Additionally, any overbank flow that occurs externally to a stream gauge is not captured in this assessment, including any floodplain or wetland environmental watering that occurs by pumping water overbank. Consequently, accurately assessing floodplain flow requirements, essential for environmental outcomes, requires ancillary data and alternative methods. Better integration of in-channel gauge data with remote-sensing monitoring across floodplains could improve the specification and evaluation of overbank flow EWRs.
Adopting an adaptive management approach (Kingsford et al. 2011b; Roux and Foxcroft 2011) can also address uncertainties in flow–ecology relationships, as well as linking flows to ecosystem responses explicitly. This approach involves proposing, testing, evaluating and updating flow–ecology relationships over time to explicitly link objectives to outcomes. An agreed standard for defining EWRs and long-term follow-up evaluations of their ecological appropriateness and effectiveness are vital components of an effective environmental water management framework (Davies et al. 2014). Current arrangements require reviews within 5 years of implementation and offer opportunities to re-evaluate EWRs considering new information, including both ecological knowledge and climate-change impacts (NSW Department of Planning, Industry & Environment 2020a).
Is there enough environmental water to meet the environmental water requirement thresholds?
The Water Act 2007 (Cth) requires the Basin Plan to determine the environmentally sustainable level of take (ESLT) that is based on the ‘best available scientific knowledge and socio-economic analysis’ (Water Act 2007, S.21(4)(b), p. 46) and which, inter alia, does not compromise environmental outcomes, including key environmental assets and ecosystem functions (Water Act 2007, S.4(1)). The Guide to the Basin Plan (Murray–Darling Authority 2010b) indicated that it was necessary to recover between 3856 GL year−1 (high risk of not achieving environmental outcomes) and 6983 GL year−1 (low risk of not achieving environmental outcomes) to reinstate an ESLT. However, this volume was later revised down (Murray–Darling Authority 2011) and in 2012 the Commonwealth Government legislated a recovery volume of 2750 GL year−1 plus 450 GL year−1 for ‘enhanced environmental outcomes’. This recovery volume was further reduced by 70 GL year−1 after a review conducted under S.6.06 of the Basin Plan (commonly known as the ‘Northern Basin Review’).
A CSIRO review of this water-recovery volume concluded that it was ‘not consistent with the currently stated environmental targets’ (Young et al. 2011, p. 29) and ‘the modelling indicates that the proposed SDLs [Sustainable Diversion Limits] would be highly unlikely to meet the specified ecological targets even in the absence of future climate change. Operational constraints are a key reason for this, but many achievable targets are also not met in the modelling’ (Young et al. 2011, p. 30). The SDLs legislated in the Basin Plan reflect inadequacies in the ESLT determinations and the lack of achievement of more than half (54%; Table 5, Basin Plan scenario) of EWRs we examined. As such, the Basin Plan water-recovery targets, even when fully implemented, are likely to increase some EWR achievement but may not be sufficient to achieve EWRs over the long term. All EWRs are unlikely to be achieved unless additional water is made available for environmental needs and there is a repeat of historical climate conditions.
Impacts of climate change on water availability
The achievement of EWRs into the future could be significantly influenced by alterations in rainfall and river inflows (Speer et al. 2021), characterised by deviations from historical climatic conditions, including increases in the severity and duration of drought conditions (Kirby et al. 2013). The MDB is already being affected by the consequences of climate change (Bureau of Meteorology 2020; Whetton and Chiew 2021; Quentin Grafton et al. 2022), including shifting rainfall patterns, water availability and fundamental alterations in hydrological relationships (Peterson et al. 2021), such as those between surface and groundwater systems (Crosbie et al. 2023). Moreover, the MDB is experiencing elevated mean surface temperatures and, consequently, increased evaporation rates. Lower runoff reduces the amount of water available for all uses, including for environmental purposes, reducing the effectiveness of water management practices. These climate-induced changes have already had a notable impact on river flows and water resources in the region, and their influence on EWR outcomes is expected to continue to grow (Chiew et al. 2009), affecting the supply of important ecosystem services (Colloff et al. 2016).
Ecosystems in the MDB have evolved over long-term historical climates, and the shifts posed by climate change will further reduce ecosystem resilience (Colloff and Baldwin 2010). Addressing these challenges will necessitate the adoption of adaptive water management strategies that consider the dynamic nature of climatic conditions and their effects on the MDB’s ecosystems. Furthermore, the impacts of climate change may require a triage approach to determine which ecosystems can be conserved using environmental watering, along with a re-evaluation of some EWRs to account for the effects of climate change (Schweizer et al. 2022). Future research and policy initiatives should focus on transparent monitoring of EWRs on the basis of best available science and implementing measures to safeguard the ecological integrity of the MDB under changing climate conditions.
Conclusions
Environmental water requirements for rivers in the MDB represent the best available understanding of the minimum river flows needed to sustain flow-dependent ecosystems, their biota and processes. We compared 72 environmental water requirements at 23 sites against observed river flows to determine the extent to which environmental needs have been achieved over a 43.5-year period to 31 December 2022 and for the 10 years since the Basin Plan was legislated. For each site, we assessed environmental needs related to small fresh, large fresh, bankfull and overbank flow events.
Over both the 43.5-year period and the 10 years since Basin Plan legislation, more than two-thirds of the environmental water requirements assessed were not achieved. Only two gauges, for Narran Lakes and Gwydir wetlands, upstream of the eight Ramsar sites in the MDB, received the overbank watering needed for environmental outcomes. None of the overbank flow EWRs along the Murray River had been achieved. However, the past 10 years since the Basin Plan was legislated have seen an increase in the achievement of small fresh threshold EWRs, perhaps reflecting the positive outcome of substantial environmental water releases along the Murray River (Chen et al. 2021).
Our analysis considered the range of factors affecting achievement of results, and implications for the environment and its health in a changing climate. The lack of achievement in meeting EWRs, particularly in the bankfull and overbank categories, is likely to be a major contributing factor to the ongoing poor health of wetland and floodplain ecosystems, encompassing approximately 25,000 km2 across a significant portion of the MDB (Murray–Darling Authority 2010b). Although there is evidence of positive effects of water recovery for environmental purposes in limited wetland environments (Chen et al. 2021; Ryan et al. 2021; Mason et al. 2022), further reforms are necessary, particularly the implementation of an improved management framework grounded on EWR-based access rules to prioritise environmental needs. Such measures are essential to ensure the long-term health and sustainability of rivers in Australia’s iconic Murray–Darling Basin.
Data availability
All data used in this paper are publicly available. A preprint of a version of this paper is available through the ResearchGate Preprint service (Sheldon et al. 2023).
Declaration of funding
This work was supported by the Wentworth Group of Concerned Scientists with generous funding from the Purves Environment Fund, the Ian Potter Foundation, the Curlew and Melliodora subfunds of the Australian Communities Foundation, Coniston Fund, Garry White Foundation, Crothers Walton Foundation, FWH Foundation, and individual donors from the Australian Environment Grantmakers Network.
Acknowledgements
This research was undertaken as part of a project led by the Wentworth Group of Concerned Scientists. The authors acknowledge Martin Job and Joel Bailey from the Murray–Darling Basin Authority for assisting with using the EWR assessment tool software. Observed stream gauge data were collected by the State of New South Wales (Water NSW), the State of Victoria (Department of Environment, Land, Water and Planning), and the Commonwealth of Australia through the Bureau of Meteorology and Murray–Darling Basin Authority. The Murray–Darling Basin Authority provided modelled streamflow data, developed as part of the Murray–Darling Basin Plan.
References
Arthington AH (2015) Environmental flows: a scientific resource and policy framework for river conservation and restoration. Aquatic Conservation: Marine and Freshwater Ecosystems 25, 155-161.
| Crossref | Google Scholar |
Arthington AH, Bunn SE, Poff NLR, Naiman RJ (2006) The challenge of providing environmental flow rules to sustain river ecosystems. Ecological Applications 16, 1311-1318.
| Crossref | Google Scholar | PubMed |
Arthington AH, Tickner D, McClain ME, Acreman MC, Anderson EP, Babu S, Dickens CWS, Horne AC, Kaushal N, Monk WA, O’Brien GC, Olden JD, Opperman JJ, Owusu AG, LeRoy Poff N, Richter BD, Salinas-Rodríguez SA, Shamboko Mbale B, Tharme RE, Yarnell SM (2023) Accelerating environmental flow implementation to bend the curve of global freshwater biodiversity loss. Environmental Reviews [Published online early 21 September 2023].
| Crossref | Google Scholar |
Arthur AD, Reid JRW, Kingsford RT, McGinness HM, Ward KA, Harper MJ (2012) Breeding flow thresholds of colonial breeding waterbirds in the Murray–Darling Basin, Australia. Wetlands 32, 257-265.
| Crossref | Google Scholar |
Bowler JM, Johnston H, Olley JM, Prescott JR, Roberts RG, Shawcross W, Spooner NA (2003) New ages for human occupation and climatic change at Lake Mungo, Australia. Nature 421, 837-840.
| Crossref | Google Scholar | PubMed |
Brookes JD, Busch B, Cassey P, Chilton D, Dittmann S, Dornan T, Giatas G, Gillanders BM, Hipsey M, Huang P, Keneally C, Jackson MV, Mosley L, Mott R, Paton D, Prowse T, Waycott M, Ye Q, Zhai S, Gibbs M (2023) How well is the Basin Plan meeting its objectives? From the perspective of the Coorong, a sentinel of change in the Murray–Darling Basin. Australasian Journal of Water Resources 27, 223-240.
| Crossref | Google Scholar |
Bunn SE, Arthington AH (2002) Basic principles and ecological consequences of altered flow regimes for aquatic biodiversity. Environmental Management 30, 492-507.
| Crossref | Google Scholar | PubMed |
Bureau of Meteorology (2020) Special climate statement 70 update – drought conditions in Australia and impact on water resources in the Murray–Darling Basin. (The Bureau, Australia) Available at http://www.bom.gov.au/climate/current/statements/scs70.pdf
Chen Y, Colloff MJ, Lukasiewicz A, Pittock J (2021) A trickle, not a flood: environmental watering in the Murray–Darling Basin, Australia. Marine and Freshwater Research 72, 601-609.
| Crossref | Google Scholar |
Chiew FHS, Piechota TC, Dracup JA, McMahon TA (1998) El Nino/Southern Oscillation and Australian rainfall, streamflow and drought: links and potential for forecasting. Journal of Hydrology 204, 138-149.
| Crossref | Google Scholar |
Chiew FHS, Teng J, Vaze J, Post DA, Perraud JM, Kirono DGC, Viney NR (2009) Estimating climate change impact on runoff across southeast Australia: method, results, and implications of the modeling method. Water Resources Research 45, W10414.
| Crossref | Google Scholar |
Colloff MJ, Baldwin DS (2010) Resilience of floodplain ecosystems in a semi-arid environment. The Rangeland Journal 32, 305-314.
| Crossref | Google Scholar |
Colloff MJ, Lavorel S, Wise RM, Dunlop M, Overton IC, Williams KJ (2016) Adaptation services of floodplains and wetlands under transformational climate change. Ecological Applications 26, 1003-1017.
| Crossref | Google Scholar | PubMed |
Colloff MJ, Overton IC, Henderson BL, Roberts J, Reid JRW, Oliver RL, Arthur AD, Doody TM, Sims NC, Ye Q, Cuddy SM (2018) The use of historical environmental monitoring data to test predictions on cross-scale ecological responses to alterations in river flows. Aquatic Ecology 52, 133-153.
| Crossref | Google Scholar |
Crosbie R, Wang B, Kim S, Mateo C, Vaze J (2023) Changes in the surface water – Groundwater interactions of the Murray–Darling Basin (Australia) over the past half a century. Journal of Hydrology 622, 129683.
| Crossref | Google Scholar |
Daesslé LW, van Geldern R, Orozco-Durán A, Barth JAC (2016) The 2014 water release into the arid Colorado River delta and associated water losses by evaporation. Science of The Total Environment 542, 586-590.
| Crossref | Google Scholar | PubMed |
Davies PE, Harris JH, Hillman TJ, Walker KF (2010) The Sustainable Rivers Audit: assessing river ecosystem health in the Murray–Darling Basin, Australia. Marine and Freshwater Research 61, 764.
| Crossref | Google Scholar |
Davies PM, Naiman RJ, Warfe DM, Pettit NE, Arthington AH, Bunn SE (2014) Flow–ecology relationships: closing the loop on effective environmental flows. Marine and Freshwater Research 65, 133-141.
| Crossref | Google Scholar |
Grafton RQ (2019) Policy review of water reform in the Murray–Darling Basin, Australia: the ‘do’s’ and ‘do’nots’. Australian Journal of Agricultural and Resource Economics 63, 116-141.
| Crossref | Google Scholar |
Hart BT (2016) The Australian Murray–Darling Basin Plan: factors leading to its successful development. Ecohydrology & Hydrobiology 16, 229-241.
| Crossref | Google Scholar |
Holgate CM, van Dijk AIJM, Evans JP, Pitman AJ (2020) Local and remote drivers of Southeast Australian Drought. Geophysical Research Letters 47, e2020GL090238.
| Crossref | Google Scholar |
Humphries P (2007) Historical indigenous use of aquatic resources in Australia’s Murray–Darling Basin, and its implications for river management. Ecological Management & Restoration 8, 106-113.
| Crossref | Google Scholar |
Kahan G, Colloff M, Pittock J (2021) Using an ecosystem services approach to re-frame the management of flow constraints in a major regulated river basin. Australasian Journal of Water Resources 25, 222-233.
| Crossref | Google Scholar |
Kingsford RT, Walker KF, Lester RE, Young WJ, Fairweather PG, Sammut J, Geddes MC (2011a) A Ramsar wetland in crisis – the Coorong, Lower Lakes and Murray Mouth, Australia. Marine and Freshwater Research 62, 255-265.
| Crossref | Google Scholar |
Kingsford RT, Biggs HC, Pollard SR (2011b) Strategic adaptive management in freshwater protected areas and their rivers. Biological Conservation 144, 1194-1203.
| Crossref | Google Scholar |
Kingsford RT, Mac Nally R, King A, Walker KF, Bino G, Thompson R, Wassens S, Humphries P (2015) A commentary on ‘long-term ecological trends of flow-dependent ecosystems in a major regulated river basin’, by Matthew J. Colloff, Peter Caley, Neil Saintilan, Carmel A. Pollino and Neville D. Crossman. Marine and Freshwater Research 66, 970-980.
| Crossref | Google Scholar |
Kingsford RT, Bino G, Porter JL (2017) Continental impacts of water development on waterbirds, contrasting two Australian river basins: global implications for sustainable water use. Global Change Biology 23, 4958-4969.
| Crossref | Google Scholar | PubMed |
Kirby M, Chiew F, Mainuddin M, Young B, Podger G, Close A (2013) Drought and climate change in the Murray–Darling Basin: a hydrological perspective. In ‘Drought in arid and semi-arid environments: a multi-disciplinary and cross-country perspective’. (Eds K Schwabe, J Albiac, JD Connor, RM Hassan, L Meza González) pp. 281–299. (Springer Netherlands: Dordrecht, Netherlands)
Leigh C, Sheldon F, Kingsford RT, Arthington AH (2010) Sequential floods drive ‘booms’ and wetland persistence in dryland rivers: a synthesis. Marine and Freshwater Research 61, 896-908.
| Crossref | Google Scholar |
Lester RE, Webster IT, Fairweather PG, Young WJ (2011) Linking water-resource models to ecosystem-response models to guide water-resource planning – an example from the Murray–Darling Basin, Australia. Marine and Freshwater Research 62, 279-289.
| Crossref | Google Scholar |
Mason TJ, Honeysett J, Thomas RF, Popovic GC, Hosking T, Shelly DJ, Bowen S (2022) Monitoring vital signs: wetland vegetation responses to hydrological resources in the Macquarie Marshes NSW, Australia. Austral Ecology 47, 1296-1314.
| Crossref | Google Scholar |
NSW Department of Planning, Industry & Environment (2020a) Murray–Lower Darling long term Water Plan. Part A: Murray–Lower Darling catchment. (NSW Environment and Heritage, Sydney, NSW, Australia) Available at https://www.environment.nsw.gov.au/research-and-publications/publications-search/murray-lower-darling-long-term-water-plan-part-a-catchment
NSW Department of Planning, Industry & Environment (2020b) Barwon–Darling long term Water Plan. Part B: Barwon–Darling planning units. (NSW Environment and Heritage, Sydney, NSW, Australia) Available at https://www.environment.nsw.gov.au/research-and-publications/publications-search/barwon-darling-long-term-water-plan-part-b-planning-units
NSW Department of Planning, Industry & Environment (2020c) Murray–Lower Darling long term Water Plan. Part B: Murray–Lower Darling planning units. (NSW Environment and Heritage, Sydney, NSW, Australia) Available at https://www.environment.nsw.gov.au/research-and-publications/publications-search/murray-lower-darling-long-term-water-plan-part-b-planning-units
Peterson TJ, Saft M, Peel MC, John A (2021) Watersheds may not recover from drought. Science 372, 745-749.
| Crossref | Google Scholar | PubMed |
Pitt J, Kendy E (2017) Shaping the 2014 Colorado River Delta pulse flow: rapid environmental flow design for ecological outcomes and scientific learning. Ecological Engineering 106, 704-714.
| Crossref | Google Scholar |
Poff NL, Zimmerman JKH (2010) Ecological responses to altered flow regimes: a literature review to inform the science and management of environmental flows. Freshwater Biology 55, 194-205.
| Crossref | Google Scholar |
Puckridge JT, Sheldon F, Walker KF, Boulton AJ (1998) Flow variability and the ecology of large rivers. Marine and Freshwater Research 49, 55-72.
| Crossref | Google Scholar |
Quentin Grafton R, Chu L, Kingsford RT, Bino G, Williams J (2022) Resilience to hydrological droughts in the northern Murray–Darling Basin, Australia. Philosophical Transactions of the Royal Society – A. Mathematical, Physical and Engineering Sciences 380, 20210296.
| Crossref | Google Scholar |
Ren S, Kingsford RT (2011) Statistically integrated flow and flood modelling compared to hydrologically integrated quantity and quality model for annual flows in the regulated Macquarie River in Arid Australia. Environmental Management 48, 177-188.
| Crossref | Google Scholar | PubMed |
Roux DJ, Foxcroft LC (2011) The development and application of strategic adaptive management within South African National Parks. Koedoe 53, 1049.
| Crossref | Google Scholar |
Ryan A, Colloff MJ, Pittock J (2021) Flow to nowhere: the disconnect between environmental watering and the conservation of threatened species in the Murray–Darling Basin, Australia. Marine and Freshwater Research 72, 1408-1429.
| Crossref | Google Scholar |
Schweizer V, Colloff MJ, Pittock J (2022) The dammed and the saved: a conservation triage framework for wetlands under climate change in the Murray–Darling Basin, Australia. Environmental Management 70, 549-564.
| Crossref | Google Scholar | PubMed |
Sheldon F, Barma D, Baumgartner LJ, Bond N, Mitrovic SM, Vertessy R (2022) Assessment of the causes and solutions to the significant 2018–19 fish deaths in the Lower Darling River, New South Wales, Australia. Marine and Freshwater Research 73, 147-158.
| Crossref | Google Scholar |
Sheldon F, Rocheta E, Steinfeld C, Colloff M, Moggridge B, Carmody E, Hillman T, Kingsford R, Pittock J (2023) Testing the achievement of environmental water requirements in the Murray–Darling Basin, Australia. ResearchGate [Preprint, September 2023].
| Crossref | Google Scholar |
Speer MS, Leslie LM, MacNamara S, Hartigan J (2021) From the 1990s climate change has decreased cool season catchment precipitation reducing river heights in Australia’s southern Murray–Darling Basin. Scientific Reports 11, 16136.
| Crossref | Google Scholar | PubMed |
Sun T, Yang ZF, Cui BS (2008) Critical environmental flows to support integrated ecological objectives for the Yellow River Estuary, China. Water Resources Management 22, 973-989.
| Crossref | Google Scholar |
Swirepik JL, Burns IC, Dyer FJ, Neave IA, O’Brien MG, Pryde GM, Thompson RM (2016) Establishing environmental water requirements for the Murray–Darling Basin, Australia’s largest developed river system. River Research and Applications 32, 1153-1165.
| Crossref | Google Scholar |
Tickner D, Opperman JJ, Abell R, Acreman M, Arthington AH, Bunn SE, Cooke SJ, Dalton J, Darwall W, Edwards G, Harrison I, Hughes K, Jones T, Leclère D, Lynch AJ, Leonard P, McClain ME, Muruven D, Olden JD, Ormerod SJ, Robinson J, Tharme RE, Thieme M, Tockner K, Wright M, Young L (2020) Bending the curve of global freshwater biodiversity loss: an emergency recovery plan. BioScience 70, 330-342.
| Crossref | Google Scholar | PubMed |
van Dijk AIJM, Beck HE, Crosbie RS, de Jeu RAM, Liu YY, Podger GM, Timbal B, Viney NR (2013) The Millennium Drought in southeast Australia (2001–2009): natural and human causes and implications for water resources, ecosystems, economy, and society. Water Resources Research 49, 1040-1057.
| Crossref | Google Scholar |
Vörösmarty CJ, McIntyre PB, Gessner MO, Dudgeon D, Prusevich A, Green P, Glidden S, Bunn SE, Sullivan CA, Liermann CR, Davies PM (2010) Global threats to human water security and river biodiversity. Nature 467, 555-561.
| Crossref | Google Scholar | PubMed |
Webb J, Stewardson M, Koster W (2010) Detecting ecological responses to flow variation using Bayesian hierarchical models. Freshwater Biology 55, 108-126.
| Crossref | Google Scholar |
Appendix A1.Environmental water requirement parameters
NSW-based EWRs were extracted from the MDBA’s EWR database available at https://github.com/MDBAuth/EWR_tool. Victorian EWRs were extracted from the Victorian long-term watering plans. A description of each of the EWR parameter fields is provided in Table 1.
| Gauge | Code | Start month | End month | Target frequency | Target frequency minimum | Target frequency maximum | Events per year | Duration | Min. spell | Flow threshold minimum | Flow threshold maximum | Maximum inter-event period | Within event gap tolerance | Multigauge | |
|---|---|---|---|---|---|---|---|---|---|---|---|---|---|---|---|
| (month) | (month) | (percentage of years) | (percentage of years) | (percentage of years) | (days) | (days) | (ML day−1) | (ML day−1) | |||||||
| 405232C | OB1 | 6 | 11 | 50 | 40 | 60 | 1 | 4 | 4 | 40,000 | 0 | ||||
| 406202C | BK1 | 7 | 6 | 10 | 1 | 2 | 1 | 8000 | 0 | ||||||
| 406202C | OB1 | 7 | 6 | 10 | 1 | 1 | 1 | 12,000 | 0 | ||||||
| 406202C | SF1 | 7 | 10 | 20 | 2 | 3 | 2 | 1800 | 2000 | 0 | |||||
| 407205A | SF1 | 12 | 5 | 100 | 2 | 4 | 3 | 30 | 75 | ||||||
| 409003 | OB3 | 7 | 6 | 35 | 30 | 40 | 1 | 10 | 10 | 28,000 | 5 | 5 | |||
| 409025 | BK2_S | 7 | 6 | 75 | 50 | 100 | 1 | 15 | 15 | 29,000 | 3 | 7 | |||
| 409025 | LF3 | 7 | 9 | 75 | 70 | 80 | 1 | 8 | 8 | 18,000 | 2 | 0 | |||
| 409025 | OB1_S | 7 | 6 | 75 | 60 | 100 | 1 | 45 | 45 | 15,000 | 2 | 7 | |||
| 409025 | SF1_S | 7 | 6 | 100 | 1 | 10 | 10 | 7000 | 1 | 0 | |||||
| 409207 | BK1_S | 7 | 6 | 75 | 50 | 100 | 1 | 45 | 45 | 16,000 | 2 | 7 | |||
| 409207 | LF1_S | 7 | 6 | 75 | 50 | 100 | 1 | 5 | 5 | 12,000 | 2 | 0 | |||
| 409207 | OB1_S | 7 | 6 | 65 | 50 | 80 | 1 | 60 | 60 | 25,000 | 3 | 7 | |||
| 409207 | SF2 | 9 | 12 | 75 | 50 | 100 | 1 | 90 | 90 | 7000 | 2 | 0 | |||
| 410005 | LF1_S | 7 | 6 | 75 | 50 | 100 | 1 | 5 | 5 | 14,000 | 2 | 0 | |||
| 410005 | OB-S2_S | 7 | 6 | 50 | 1 | 8 | 4 | 38,000 | 4 | 90 | |||||
| 410005 | SF1_S | 7 | 6 | 100 | 2 | 10 | 10 | 4000 | 1 | 0 | |||||
| 410040 | LF1_S | 7 | 6 | 75 | 50 | 100 | 1 | 5 | 5 | 6000 | 2 | 0 | |||
| 410040 | OB-S1 | 10 | 4 | 50 | 1 | 10 | 5 | 15,000 | 4 | 90 | |||||
| 410040 | SF1_S | 7 | 6 | 100 | 2 | 10 | 10 | 2500 | 1 | 0 | |||||
| 410130 | LF1_S | 7 | 6 | 75 | 50 | 100 | 1 | 5 | 5 | 6000 | 2 | 0 | |||
| 410130 | OB-S2 | 8 | 2 | 50 | 1 | 49 | 8 | 10,500 | 4 | 90 | |||||
| 412005 | LF1_S | 7 | 6 | 75 | 50 | 100 | 1 | 5 | 5 | 650 | 2 | 0 | |||
| 412005 | OB2 | 10 | 4 | 55 | 40 | 70 | 1 | 5 | 5 | 2500 | 3 | 0 | |||
| 412005 | SF1_S | 7 | 6 | 100 | 1 | 10 | 10 | 200 | 1 | 0 | |||||
| 414203 | BK1_S | 7 | 6 | 65 | 50 | 80 | 1 | 30 | 30 | 38,000 | 3 | 0 | |||
| 414203 | LF2 | 9 | 4 | 80 | 60 | 100 | 1 | 25 | 25 | 20,000 | 2 | 0 | |||
| 414203 | OB1_S | 7 | 6 | 50 | 30 | 70 | 1 | 30 | 30 | 50,000 | 4 | 0 | |||
| 414203 | SF1 | 6 | 9 | 100 | 1 | 14 | 14 | 14,000 | 1 | 0 | |||||
| 416001 | BK1 | 7 | 6 | 50 | 1 | 5 | 5 | 7900 | 4 | 0 | |||||
| 416001 | LF1_S | 7 | 6 | 75 | 50 | 100 | 1 | 15 | 15 | 3000 | 2 | 0 | |||
| 416001 | OB1 | 7 | 6 | 30 | 20 | 40 | 1 | 5 | 5 | 10,000 | 5 | 0 | |||
| 416001 | SF1_S | 7 | 6 | 100 | 1 | 10 | 10 | 540 | 1 | 0 | |||||
| 417001 | LF1 | 7 | 6 | 45 | 20 | 60 | 1 | 5 | 5 | 3900 | 6.5 | 0 | |||
| 417001 | OB3 | 7 | 6 | 10 | 0 | 30 | 1 | 3 | 3 | 18,800 | 20 | 0 | |||
| 417001 | SF1_S | 7 | 6 | 55 | 30 | 80 | 1 | 10 | 10 | 300 | 4.5 | 0 | |||
| 418004 | LF2 | 10 | 4 | 40 | 30 | 50 | 1 | 5 | 5 | 4860 | 4 | 0 | |||
| 418004 | OB5 | 7 | 6 | 10 | 1 | 1 | 1 | 60,000 | 15 | 0 | |||||
| 418004 | SF2 | 9 | 4 | 75 | 50 | 100 | 1 | 14 | 14 | 540 | 4860 | 2 | 0 | ||
| 419021 | BK1 | 9 | 4 | 50 | 1 | 3 | 3 | 9900 | 4 | 0 | |||||
| 419021 | LF1_S | 7 | 6 | 75 | 50 | 100 | 1 | 5 | 5 | 3200 | 2 | 0 | |||
| 419021 | OB2_S | 7 | 6 | 40 | 30 | 50 | 1 | 5 | 5 | 13,400 | 5 | 0 | |||
| 419021 | SF1_S | 7 | 6 | 100 | 1 | 10 | 10 | 350 | 1 | 0 | |||||
| 421090 | LF1 | 7 | 6 | 75 | 50 | 100 | 1 | 5 | 5 | 2500 | 2 | 0 | 421088 | ||
| 421090 | OB/WS2 | 10 | 4 | 75 | 50 | 100 | 1 | 10 | 10 | 4000 | 4 | 0 | 421088 | ||
| 421090 | SF1_S | 7 | 6 | 100 | 1 | 10 | 10 | 350 | 1 | 0 | 421088 | ||||
| 422015 | LF1 | 7 | 6 | 75 | 50 | 100 | 1 | 5 | 5 | 3600 | 2 | 0 | |||
| 422015 | OB1 | 7 | 6 | 40 | 30 | 5 | 1 | 12 | 12 | 9200 | 9 | 0 | |||
| 422015 | SF3 | 7 | 6 | 85 | 60 | 100 | 1 | 7 | 7 | 1000 | 3 | 0 | |||
| 422016 | LF1 | 7 | 6 | 75 | 60 | 90 | 1 | 5 | 5 | 1600 | 3.5 | 0 | |||
| 422016 | OB2 | 7 | 6 | 20 | 0 | 30 | 1 | 6 | 6 | 6200 | 9 | 0 | |||
| 422016 | SF1_S | 7 | 6 | 75 | 60 | 90 | 1 | 10 | 10 | 230 | 3 | 0 | |||
| 425003 | BK1 | 7 | 6 | 50 | 1 | 15 | 15 | 30,000 | 4 | 0 | |||||
| 425003 | LF1_S | 7 | 6 | 75 | 50 | 100 | 1 | 15 | 15 | 15,000 | 2 | 0 | |||
| 425003 | OB1 | 7 | 6 | 30 | 20 | 40 | 1 | 15 | 15 | 50,000 | 5 | 0 | |||
| 425003 | SF1_S | 7 | 6 | 100 | 1 | 10 | 10 | 1550 | 1 | 0 | |||||
| 425004 | BK1 | 7 | 6 | 50 | 1 | 15 | 15 | 30,000 | 4 | 0 | |||||
| 425004 | LF1_S | 7 | 6 | 75 | 50 | 100 | 1 | 15 | 15 | 15,000 | 2 | 0 | |||
| 425004 | OB1 | 7 | 6 | 30 | 20 | 40 | 1 | 15 | 15 | 44,000 | 5 | 0 | |||
| 425004 | SF1_S | 7 | 6 | 100 | 1 | 10 | 10 | 1500 | 1 | 0 | |||||
| 425008 | BK1 | 7 | 6 | 50 | 1 | 15 | 15 | 25,000 | 4 | 0 | |||||
| 425008 | LF1_S | 7 | 6 | 75 | 50 | 100 | 1 | 15 | 15 | 14,000 | 2 | 0 | |||
| 425008 | OB1 | 7 | 6 | 30 | 20 | 40 | 1 | 15 | 15 | 30,000 | 5 | 0 | |||
| 425008 | SF1_S | 7 | 6 | 100 | 1 | 10 | 10 | 1400 | 1 | 0 | |||||
| 425012 | BK1_S | 7 | 6 | 65 | 50 | 80 | 1 | 14 | 14 | 10,000 | 2 | 0 | |||
| 425012 | LF2_S | 7 | 6 | 75 | 50 | 100 | 1 | 5 | 5 | 7000 | 2 | 0 | |||
| 425012 | OB1_S | 7 | 6 | 50 | 1 | 14 | 14 | 15,000 | 3 | 0 | |||||
| 425012 | SF1 | 3 | 5 | 75 | 50 | 100 | 1 | 10 | 10 | 2000 | 2 | 0 | |||
| A4260509 | SF1 | 6 | 9 | 100 | 1 | 14 | 14 | 14,000 | 1 | 0 | |||||
| A4260509 | LF1 | 9 | 2 | 90 | 80 | 100 | 1 | 14 | 14 | 20,000 | 2 | 0 | |||
| A4260509 | BK1_S | 7 | 6 | 70 | 60 | 80 | 1 | 30 | 30 | 40,000 | 3 | 0 | |||
| A4260509 | OB1_S | 7 | 6 | 50 | 30 | 70 | 1 | 30 | 30 | 55,000 | 4 | 0 |
Appendix A2.Achievement of environmental water requirements (EWRs) since Basin Plan was enacted (2012–2022)
Achievement of environmental water requirements in the past 10 years (2012–2022) at sites assessed (Y, achieved; N, not achieved) for four flow categories analysed and combined percentage and site of stream gauge in northern or southern Murray–Darling Basin. Sites upstream of Ramsar-listed Wetlands of International Importance or downstream of the key focus areas for the Murray–Darling Basin Authority’s constraints management strategy (CMS) are identified (x).
| Stream gauge location | Small fresh | Large fresh | Bankfull | Wetland | Percentage achieved | North or south MDB | Upstream of Ramsar location | Downstream of CMS constraint location | |
|---|---|---|---|---|---|---|---|---|---|
| Campaspe River at Rochester | N | Y | Y | 67 | South | ||||
| Moonie River at Gundablouie | Y | Y | Y | 100 | North | ||||
| Barwon River at Mungindi | Y | N | Y | Y | 75 | North | |||
| Combined flow at the Macquarie River downstream of Marebone Weir and at Marebone Break | Y | Y | N | 67 | North | x | |||
| Gwydir River at Yarraman Bridge | Y | N | Y | 67 | North | x | |||
| Darling River at Bourke Town | N | N | N | N | 0 | North | |||
| Namol River at Bugilbone | N | N | N | N | 0 | North | |||
| Lachlan River at Booligal | Y | Y | N | 67 | South | ||||
| Narran River at Wilby Wilby | N | N | Y | 33 | North | x | |||
| Darling River at Wilcannia | N | N | N | N | 0 | North | |||
| Murray River downstream of Yarrawonga Weir | Y | N | N | N | 25 | South | x | x | |
| Murray River at Torrumbarry | N | Y | N | N | 25 | South | x | x | |
| Loddon River at Appin South | Y | 100 | South | ||||||
| Edward River at Deniliquin | N | 0 | South | x | x | ||||
| Goulburn River at McCoys Bridge | N | 0 | South | x | |||||
| Murrumbidgee River downstream of Balranald Weir | N | N | 0 | South | x | ||||
| Murrumbidgee River downstream of Maude Weir | N | N | N | 0 | South | x | |||
| Murrumbidgee River at Narrandera | N | N | N | 0 | South | x | x | ||
| Culgoa River at Brenda | Y | N | N | 33 | North | ||||
| Darling River at Louth | N | N | N | N | 0 | North | |||
| Darling River at Menindee upstream of Weir 32 | N | N | N | N | 0 | South | |||
| Murray River at Euston | N | N | N | N | 0 | South | x | x | |
| Murray River Flow to South Australia | N | N | N | N | 0 | South | x | x |