

Quantifying the accessibility of sustainable seafood in south-eastern Queensland, Australia
Tia Vella A * , Leslie Roberson A , Caitie Kuempel B and Carissa Klein A
A
B
Marine and Freshwater Research 74(15) 1340-1354 https://doi.org/10.1071/MF23054
Submitted: 14 March 2023 Accepted: 13 September 2023 Published: 4 October 2023
Abstract
Seafood is a nutritious source of protein. However, seafood production can have perverse environmental impacts. Seafood sustainability differs depending on species, origin, and production or fishing method. Australian consumers seeking sustainable seafood rely on independent sustainability guides and detailed labels at point of sale.
We aimed to determine consumer accessibility to sustainable seafood products in south-eastern Queensland, Australia.
We assessed the sustainability of 8497 seafood products from 1050 restaurants, supermarkets, and takeaway shops.
We determined the sustainability of 31.83% of products according to Australia’s GoodFish guide. Of these, 4.25% were classified as sustainable, 3.35% as ‘Eat Less’, and 24.23% as ‘Say No’. Australian farmed barramundi was the most common sustainable product and farmed Australian Atlantic salmon the most common ‘Say No’ product. We could not assess 68.17% of products because of a lack of information (26.73%) or the product was not included in the GoodFish guide (41.44%).
Inadequate labelling of species, origin, or production or fishing method reduces the accessibility of sustainable seafood in south-eastrn Queensland, Australia.
Improving labelling, especially origin information at point of sale is critical for changing consumer behaviour, which represents a significant hurdle to improving the sustainability of the seafood industry.
Keywords: Australia, consumers, ecolabels, labelling, seafood, seafood guides, seafood origin, traceability.
Introduction
One of the greatest sustainability challenges is feeding a further two billion people without incurring an overwhelming environmental impact. Seafood will continue to play a key role in solving this challenge because it is generally more environmentally efficient than other sources of animal-based proteins (Hilborn et al. 2018; Poore and Nemecek 2018; Halpern et al. 2022). Globally, fish consumption has increased, at a rate of 3.1% each year from 1961 to 2017 (Food and Agriculture Organization of the United Nations 2020). Increased demand for fish has caused fisheries catch and wild-caught fish populations to stagnate or decline across the globe (Pauly et al. 2002), which has serious consequences for marine biodiversity, ecosystem function, and human nutrition and welfare (Worm et al. 2006; Myers et al. 2007; Marschke and Vandergeest 2016). Improving the sustainability of seafood benefits the ocean and associated ecosystems, as well as the people it supports.
There are multiple ways of defining sustainable seafood, but environmental sustainability is typically the focus of wild-caught and aquaculture-produced seafood (Bogard et al. 2019). For example, fisheries are considered to be sustainable when the stocks of target species are well managed, destructive fishing practices and bycatch levels are minimised, and the system is deemed as viable into the future (Hilborn et al. 2015). Similarly, aquaculture systems are considered to be sustainable when there is efficient production with minimal pollution and waste generated, a high production to feed ratio, and minimal impacts on the surrounding environment (Valenti et al. 2018; Ahmed et al. 2019; Cánovas-Molina and García-Frapolli 2021).
The demand from consumers to have access to sustainable seafood products is growing as sustainability awareness and education grows, and consumers are sometimes willing to pay more for these sustainable products (Witkin et al. 2015; McClenachan et al. 2016; Lawley et al. 2019). This has spurred an increase in prevalence of ecolabels and seafood certification schemes such as the Marine Stewardship Council for wild-capture fisheries, and the Aquaculture Stewardship Council for farmed-seafood products (Aquaculture Stewardship Council 2020; Marine Stewardship Council 2022). In addition, sustainable seafood guides have been developed to help consumers determine the sustainability of the seafood available within specific countries; for example, The GoodFish guide assesses the sustainability of common seafood products found in Australia.
However, sustainability guides and certification schemes will help people choose sustainable seafood products only if they are readily available to consumers. Further, sustainability guides can be difficult to use because they require information that is not always available from seafood vendors, such as the species and where or how it was caught or produced. There can be substantial variability in the environmental sustainability of seafood products, even for the same species, contingent on the farming or fishing location and the type of fishing gear (Australian Marine Conservation Society 2019a). This complexity makes the sustainability of seafood especially difficult to communicate to consumers. In Australia, for example, seafood labelling laws do not mandate that this information is provided to consumers, especially in the case of cooked seafood. The European Union arguably has the most comprehensive seafood labelling laws, whereas the more limited requirements in Australia are typical of many developed markets (Cawthorn et al. 2018).
Here, we aim to determine how accessible sustainable seafood is to consumers in Australia, with a focus on south-eastern Queensland. Given the environmental and socioeconomic importance of fishing and seafood in this area, sustainability must be a key component of the seafood seascape now and looking forward (Steven et al. 2020). By determining the range of sustainable seafood products in this region, we show where key gaps and opportunities exist to make real improvements in seafood consumption behaviours in developed markets such as coastal Australian cities.
Methods
Study region
Australians consumed an average of 13.7 kg of seafood (edible weight) per person in 2017–18 (Steven et al. 2020). Although Australians still eat more beef, chicken, and pork than seafood, there is cultural significance around fishing and seafood, especially near the coasts (Steven et al. 2020). Australia has numerous policies managing fishery operations, such as the Fisheries Management Act 1991, which support sustainability and conservation. The seafood that Australia produces is not necessarily consumed in Australia, given that, globally, seafood is one of the most traded commodities. Australia exports ~19% of the seafood it produces and imports ~70% of its seafood from overseas (Steven et al. 2020). Thus, the seafood that is consumed in Australia may not be sustainable, despite Australia’s rigorous marine conservation and sustainability policies (Hilborn et al. 2020). We focus on environmental sustainability, in line with available information. We conducted this study in south-eastern Queensland, Australia, a region with a population of 3 366 880 (Australian Bureau of Statistics 2017) across 12 local government areas (‘areas’). We chose this region because it was accessible to us during extensive COVID lockdowns that prohibited interstate travel and because of the socio-economic importance of fishing and seafood. South-eastern Queensland has a large and active recreational fishing sector, which has grown since the COVID-19 pandemic (Major 2021) and even exceeds commercial catch volumes and value for some species and areas (Brown 2016).
Data collection
We designed a survey to assess the sustainability of unique fresh or raw, frozen (packaged products in freezer sections), cooked (meals from restaurants, cafés and takeaway shops, and smoked products) and canned seafood products per establishment on the basis of the Australian Marine Conservation Society (AMCS) guide, GoodFish (Australian Marine Conservation Society 2019a). The survey targeted any establishment that sold seafood products. Each unique seafood product within an establishment was surveyed for the information available to consumers, with employees being asked follow-up questions about their products if required. The guide was chosen because it is freely available to the public on an online website and phone application and is specifically designed for use by consumers to assess the sustainability of seafood products they are likely to encounter in Australia. The guide categorises the sustainability of common seafood products into the following three categories on the basis of their species, origin and catch method (Australian Marine Conservation Society 2019a): ‘Better Choice’ (most sustainable categorisation), ‘Eat Less’ (some sustainability concerns), and ‘Say No’ (least sustainable categorisation). The survey (Appendix 1) included questions targeting the information required for consumers to determine the sustainability of a seafood product (fresh, cooked, frozen or canned) within the GoodFish guide, focusing on species, origin and catch-method information.
Surveys were conducted across 12 local government areas at any establishment that sells seafood to the general population, including restaurants, supermarkets, and takeaway venues. We determined a sample size for each area (95% confidence, 5% margin of error) of 62–348 establishments, depending on population size and how many potential establishments in each area sell seafood products (Table 1, Appendix 2). To determine the initial sample size, we used publicly available food licence data provided for four areas (Brisbane City, Gold Coast City, Ipswich City and Logan City) (Brisbane City Council 2021; Gold Coast City Council 2021; Ipswich City Council 2021; Logan City Council 2021). We excluded establishments such as schools, hospitals, nursing homes and childcare centres, as well as establishments that definitely do not sell seafood products such as ice-cream parlours and some fast-food chains from the food licence datasets to produce a more accurate number of establishments that may sell seafood products (Morland et al. 2002). The potential number of seafood establishments was then used to calculate the sample size for each area. We extrapolated the number of potential establishments for the eight areas that did not provide food licence data by calculating the number of establishments per 1000 people in a known area with a similar population size and multiplying by the population of the unknown area. When surveying in person, we further refined the number of potential establishments that sold seafood by counting the number of establishments that sold seafood products versus did not (not counting establishments already removed), which we used to estimate the proportion of seafood establishments in each area that was surveyed in person. This was completed for 1250 establishments across south-eastern Queensland areas. We then multiplied the proportion of seafood establishments in person by the potential number estimated previously from the methods as described above, to determine a more accurate sample size (Appendix 2).
| Region | Population (2016 census) | Sample size, 5% margin of error, 95% confidence | Number of surveyed establishments in-person | Number of surveys collected in-person | |
|---|---|---|---|---|---|
| Brisbane City | 1 131 155 | 348 | 276 | 1831 | |
| Gold Coast City | 555 721 | 341 | 249 | 2497 | |
| Ipswich City | 193 733 | 205 | 152 | 932 | |
| Lockyer Valley | 38 609 | 89 | 0 | 0 | |
| Logan City | 303 386 | 233 | 72 | 1165 | |
| Moreton Bay Region | 425 302 | 269 | 148 | 740 | |
| Noosa Shire | 52 149 | 102 | 10 | 26 | |
| Redland City | 147 010 | 169 | 105 | 1098 | |
| Scenic Rim Region | 40 072 | 49 | 18 | 45 | |
| Somerset Region | 24 597 | 62 | 0 | 0 | |
| Sunshine Coast Region | 294 367 | 208 | 20 | 163 | |
| Toowoomba City | 160 779 | 214 | 0 | 0 | |
| Total | 3 366 880 | 2289 | 1050 | 8497 |
On the basis of numerous studies that have successfully incorporated citizen-scientist data, we engaged volunteers to help conduct surveys (Sullivan et al. 2014; McKinley et al. 2017). To do this, we designed a simple survey for data entry of in-person surveys that was easy to access by volunteers in Google Forms. We also created a website (see https://sustainableseafoodsurvey.wordpress.com/) that provided detailed instructions on how to fill in the survey to ensure consistency among in-person survey entries from citizen scientists. We focused on the recruitment of citizen scientists connected to local universities. Recruitment included presenting to over 80 students and staff at the University of Queensland, emailing local environmental or marine science university groups (e.g. University of Queensland’s Centre for Biodiversity and Conservation Science), posting on social media, and hanging posters around the University of Queensland. We conducted all surveys in person, using a door-to-door method, to every open establishment at the time in an area. Surveys were conducted between March and August 2021. At each establishment, the surveyor first observed and recorded the available information (e.g. reading the menu or food product label) for each unique product, then asked an employee one or two follow-up questions if the information was not observable. If more enquiries were required, the answer was marked as ‘unknown,’ because the information was not easily available. Enquiries were not made for pre-packaged products (e.g. canned and frozen products) because employees were unlikely to be able to provide any additional information.
A University of Queensland ethics exemption was granted for this study, 17/02/2021–29/10/2021. Project number: 2021/HE000078.
Analysis
We assessed each survey entry by using the AMCS GoodFish guide, to determine the sustainability category of the seafood product, namely, Better Choice, Eat Less and Say No (Australian Marine Conservation Society 2019a). The seafood products not listed in the guide were given the category ‘NA’. Some seafood products did not have enough information to categorise their sustainability. However, in some cases, we were able to determine the missing information so that we could assess their sustainability. For example, farmed Australian products for a particular species have the same sustainability categorisation for all locations around Australia; thus, if we knew that a barramundi product was farmed in Australia, we could assume it was a Better Choice, without specific origin information being provided. When species-level information (e.g. only the species group was provided) was not provided and there were multiple different species options to choose from in the GoodFish guide, we deemed the product to not have specific enough information to determine its sustainability, and categorised it as unknown. For example, 14 prawn listings are included in the guide, covering all three sustainability categorisations; however, products containing prawns are often sold without all the information to determine the exact listing of the product. Similarly, origin information was considered unknown if it was not given or if it was not specific enough to use the guide to determine the sustainability categorisation. For example, the GoodFish guide categorises barramundi caught in Queensland fisheries as Say No; however, barramundi caught in the Northern Territory or Western Australian fisheries are categorised as Eat Less (Australian Marine Conservation Society 2019a). Therefore, barramundi labelled only as Australian barramundi would not be able to be classified.
In addition, we assessed the entries for wild-caught Australian species by using the stock status sustainability categories of the Fisheries Research and Development Corporation (FRDC). Only Australian wild-caught entries were assessed in this analysis, because the FRDC does not include any sustainability information on farmed or imported species. The FRDC works in partnership (including receiving funding) with the Australian Government to ensure sustainability of fisheries and marine ecosystems (for FRDC’s Status of Australian fish stocks reports full list, see https://www.fish.gov.au/). Although the FRDC is aimed at a broader audience (including industry, researchers and policy makers), not just consumers, we included this analysis to compare sustainability information for seafood species, because it is another source of data available to Australian consumers that may provide conflicting information for some species (see https://www.fish.gov.au/). We did not include non-Australian seafood guides because of the lack of information on local Australian seafood products (Appendix 3).
Results
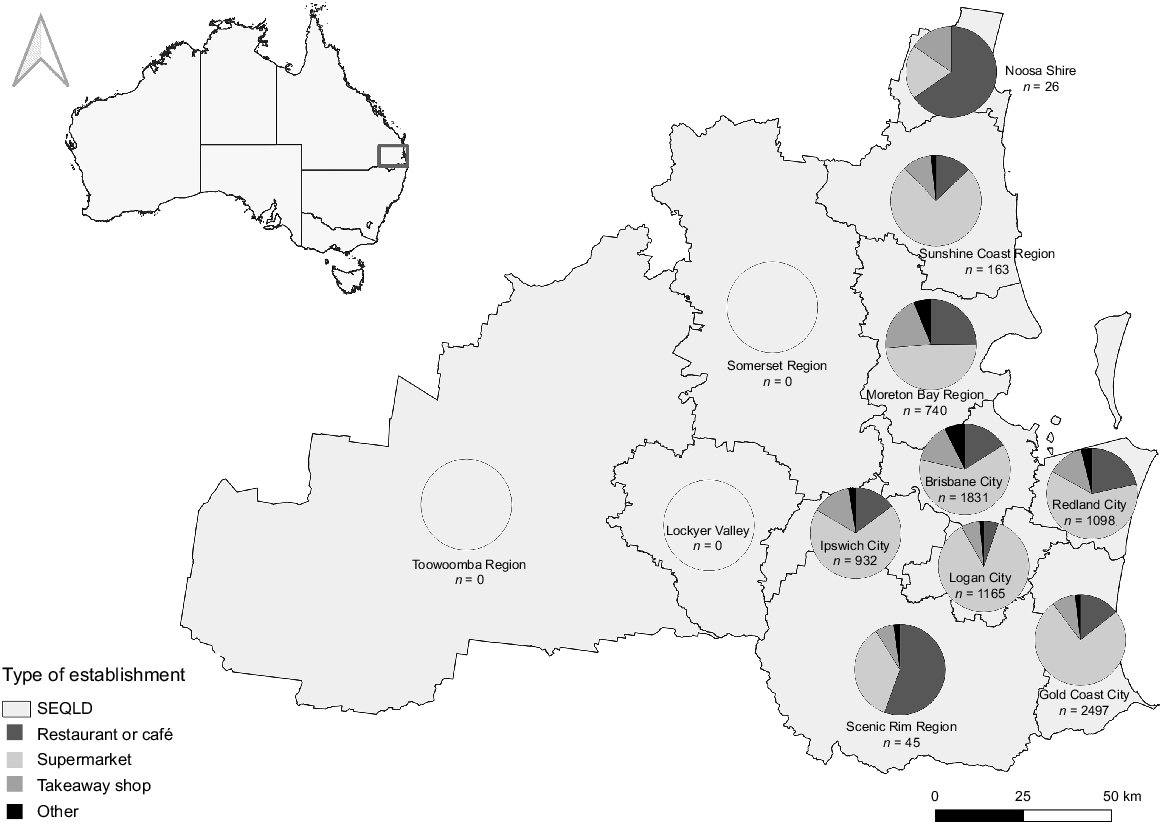
We surveyed 1050 different establishments, covering 8497 products across south-eastern Queensland (Fig. 1, Table 1). The lead author conducted the vast majority (estimated 96%) of the surveys, with anonymous citizens contributing the remaining 4%. Of these products, 2705 (31.83%) contained enough information to assess sustainability using the AMCS GoodFish guide, 2271 (26.73%) did not have enough information (could not be categorised), and 3521 (41.44%) were not listed in the guide (Table S1 of the Supplementary material). We found that 361 (4.25%) of the products were categorised as a Better Choice, 2059 (24.32%) as Say No and 285 (3.35%) as Eat Less. There were 156 species (n = 3521 products) that were not listed in the guide (or the guide did not have a listing for the information, such as a specific origin), and were therefore categorised as NA. Skipjack tuna (n = 490) and Atlantic salmon (n = 230) from imported origins were the most common species categorised as NA.
Seafood products (n = 8497) from 1050 establishments were surveyed across south-eastern Queensland (SEQLD), Australia, and assessed for their sustainability using Australia’s GoodFish guide (Australian Marine Conservation Society 2019a).
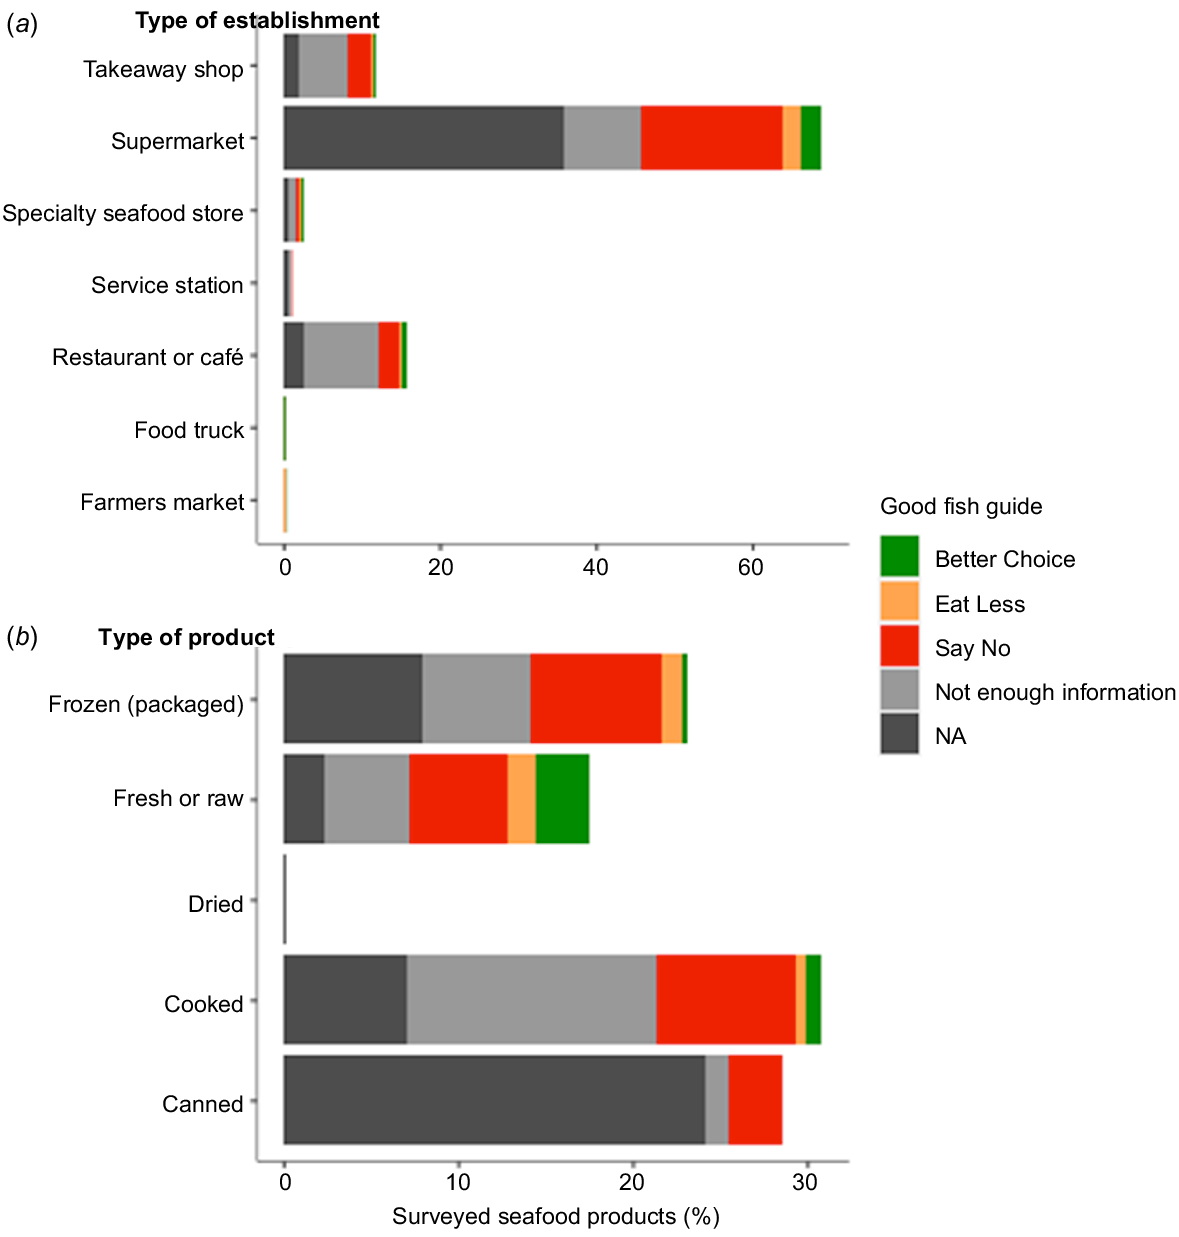
The greatest number of seafood product surveys was conducted in supermarkets (n = 5851), where 4.05% (n = 237) of seafood products were categorised as a Better Choice option (Fig. 2a). Farmers markets had the highest proportion of Better Choice options (32%, n = 7), followed by specialty seafood stores (13%, n = 27), supermarkets (4.05%, n = 237) and restaurants (4.2%, n = 56) (Fig. 2a). Although supermarkets had a low proportion of Better Choice options (4.05%, n = 237), they had the highest number of Better Choice seafood products of all the establishment types, owing to their supplying the greatest number of seafood products to consumers overall (n = 5851). Cooked seafood items were the most common product type for seafood products (n = 2619); however, only 3.2% (n = 85) were categorised as a Better Choice (Fig. 2b). The most common sustainable, Better Choice seafood products were in their fresh or raw form (3%, n = 255) (Fig. 2b). The majority of products were imported (58.26%, n = 4950), with only 22.62% (n = 1922) of seafood products coming from Australia (0.5%, n = 44 products were a mix of origins and 18.61%, n = 1581 were of unknown origin).
The sustainability of seafood products (n = 8497) was assessed using Australia’s GoodFish guide (Australian Marine Conservation Society 2019a) across (a) a range of establishments and (b) for a variety of products. The guide categorises seafood products into the following three categories: ‘Better Choice’, ‘Eat Less’ and ‘Say No’. Some of the seafood products could not be categorised because of a lack of information, or were not in the guide (NA).
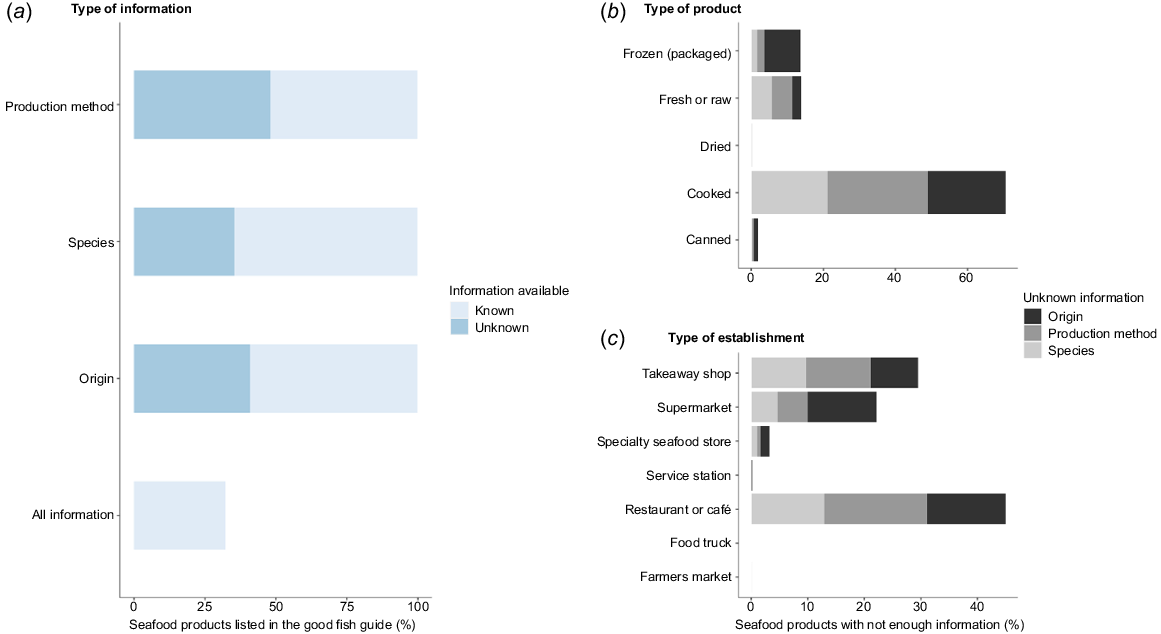
We found that across the surveyed products listed in the GoodFish guide, only 32.21% (n = 1603) had all three types of information required to determine their sustainability category. Production method information was the most commonly lacking element (48.09%, n = 2393), followed by adequate origin information (43.99%, n = 2189) (Fig. 3a). Of the 2271 products that did not have enough information to be categorised for their GoodFish guide sustainability category, 83.97% (n = 1907) were completely missing origin information or did not have detailed enough information to allow the sustainability category of the product to be determined (Fig. 3b, c). We found that 35.27% (n = 1755) of surveyed seafood products listed in the GoodFish guide did not have clear species names (Fig. 3a). Cooked products were most commonly lacking information (n = 1222), whereas canned (n = 112) products usually provided enough information to categorise them (Fig. 3b). Restaurants or café and takeaway shops were more likely to lack the required information to assess sustainability than were supermarkets and had a much higher proportion of products unable to be categorised (59.1%, n = 792) than did supermarkets (14.56%, n = 852) (Fig. 3c). When queried about missing information, staff were often unable to provide the information (54.97%, n = 3324, Appendix 4). With the inclusion of this information to consumers, an additional 1448 surveyed seafood products may have been considered to be a Better Choice, sustainable option. This increases the potential availability of sustainable seafood products to 21.29%, instead of only 4.25% of seafood products being a Better Choice. However, without this additional information, consumers looking to use the GoodFish guide to purchase sustainable seafood products are, often unnecessarily, further limited in their choices.
(a) Seafood products listed in the GoodFish guide (n = 4976) (Australian Marine Conservation Society 2019a) were assessed to see what type of information was available to consumers. ‘All information’ represents the products that had species, origin, and catch method known (a). The seafood products that did not have enough information (n = 2271) to be assessed for their sustainability category by the GoodFish guide (Australian Marine Conservation Society 2019a) were analysed to determine which types of information were unknown or not specific enough, for different types of (b) products and (c) establishments.
We found some discrepancies between the GoodFish guide sustainability categories and the FRDC stock status reports (Table 2). There were inconsistent categorisations for 31 of the species (n = 218 products). For example, 11 stocks were considered to be sustainable by the FRDC and unsustainable (Say No) by the GoodFish guide (Australian Marine Conservation Society 2019a). If consumers use the FRDC statuses as their guide when purchasing sustainable seafood products, 3.41% (n = 290) of seafood products surveyed would be considered sustainable (compared with 4.25% with GoodFish guide alone), or 6.68% (n = 568) of products were sustainable if considering the best listing from either guide.
| Item | FRDC stock status | GoodFish guide category | |||
|---|---|---|---|---|---|
| Better Choice | Eat Less | Say No | |||
| Number of products | Sustainable | 83 | 167 | 40 | |
| Number of species | 20 | 16 | 11 | ||
| Number of products | Depleting | – | 6 | – | |
| Number of species | – | 1 | – | ||
| Number of products | Depleted | – | – | 4 | |
| Number of species | – | – | 2 | ||
| Number of products | Undefined | – | 8 | 3 | |
| Number of species | – | 3 | 1 | ||
We summarised the most common products in each sustainability category and found that the most common Better Choice options surveyed were farmed Australian seafood (Table 3). The exception is farmed Australian Atlantic salmon, which was the most common farmed species and is categorised as Say No. Blue grenadier was one of the most common species available to consumers (n = 217); however, the sustainability categorisation is determined by the origin of the fish, with the less sustainable option from New Zealand being more prevalent than the more sustainable option from Australia (Table 3). There were eight species listed in the GoodFish guide, which we did not encounter during the survey (e.g. Australian salmon and luderick); however, as there were numerous unknown species (categorised as not enough information), the species may still be present in the surveyed products.
| GoodFish guide sustainability categorisation | |||||||||
|---|---|---|---|---|---|---|---|---|---|
| Better Choice | Eat Less | Say No | |||||||
| Species | Conditions | Number of products | Species | Conditions | Number of products | Species | Conditions | Number of products | |
| Barramundi | Australian farmed | 106 | Blue grenadier or hoki | Australian wild-caught | 54 | Atlantic salmon | Australian farmed | 399 | |
| All prawn species | Australian farmed | 65 | Ocean or rainbow trout | Australian farmed | 48 | Basa | Imported wild-caught or farmed | 164 | |
| All oyster species | Australian farmed | 54 | Banana prawn | Wild-caught from WA, Commonwealth Waters | 27 | Blue grenadier or hoki | New Zealand wild-caught | 163 | |
| Blue mussel | Australian farmed | 24 | Saddletail snapper | Australian wild-caught | 26 | Hake | Imported wild-caught | 76 | |
| All rocklobster species (except southern rocklobster) | Wild-caught from WA, Qld, NSW or Commonwealth Waters | 18 | Nile perch | Imported wild-caught | 23 | Prawns | Imported wild-caught or farmed | 62 | |
Discussion
We found that it is difficult for consumers to access sustainable seafood products in south-eastern Queensland. There are many detrimental impacts from producing unsustainable seafood products for both fisheries and aquaculture systems, including overfishing and bycatch, habitat destruction, and pollution. Overfishing of target and non-target (bycatch) species is a fundamental challenge for a wide range of fisheries in Australia and globally, and combatting overfishing is a core tenet of sustainable seafood initiatives (Roberson et al. 2020). Habitat destruction from fisheries often refers to damage to the benthic structure from certain fishing methods (e.g. trawling), but fishing can also create disturbances that negatively affect non-target organisms (e.g. resuspending sediments), or reduce overall benthic diversity (Collie et al. 2000; O’Neill and Ivanovic 2016). Fishing methods differ substantially in their environmental impacts. For instance, tuna caught from hand-line fisheries typically affect the environment less than does tuna caught from longline, purse seine, or gillnet fisheries, even for the same species and fishing area (Bailey et al. 2012; McCluney et al. 2019). This is why, in some cases, a particular seafood species may be sustainable in one place (or for one fishery) and not in another place (or fishery). Unsustainable aquaculture systems can also cause habitat destruction of marine, coastal, and terrestrial ecosystems through habitat clearing, depending where the farm is based (Ahmed et al. 2019; Cánovas-Molina and García-Frapolli 2021). Pollution is a serious issue for aquaculture, especially eutrophication and sedimentation of the surrounding environment from effluent, which can lead to anoxic conditions and harmful algal blooms (Tovar et al. 2000; Ahmed et al. 2019). The major source of fisheries-based pollution is discarded (‘ghost’) fishing gear, which is a direct threat to marine biodiversity and results in measurable economic losses for fisheries (Hardesty et al. 2015; Eric Gilman et al. 2016). If better options are accessible, consumers have the power to shift demand towards seafood products with fewer deleterious environmental impacts, which can drive industry to produce more sustainable products.
There are some limitations and potential biases to our results. For example, when asking a server at a particular establishment questions about the product, the answer may have differed depending on who answered the question. Thus, the results may differ if the survey was conducted at the same places at different times, which mimics the problem consumers’ face when purchasing seafood products. Some severs were more willing to search for the information, or were able to get a manger, owner or chef who was able to answer the questions. Others had no idea and were unwilling to investigate, or no one with the information was available at the time. There may have been some social desirability bias with some of the answers, because some servers may have given a dishonest answer (mostly in regards to origin information), depending on what they thought the person surveying wanted to hear, so as to give them a higher likelihood of a sale. For example, claiming the seafood was of Australian origin as opposed to imported, because it may sound higher quality. Another limitation was that not all areas were surveyed in person, meaning that the range of sustainable seafood products for those areas were not represented in this study. However, the majority of in-person surveys were completed in the most populated areas with the highest number of seafood vendors. Additionally, the accuracy of the labels was not tested, and numerous recent studies have shown through genetic testing that many products are mislabelled (Kroetz et al. 2020). Further, the availability of seafood may vary depending on the season, especially for fresh seafood products, which would have influenced our results.
The main legislation in Australia governing labelling laws is the Australia New Zealand Food Standards Code (ANZFSC). Currently, the ANZFSC requires only country of origin labelling for packaged seafood products, such as canned and frozen seafood (Rural and Regional Affairs and Transport References Committee 2014; Australian Government 2016). This explains why there are a high number of products with inadequate information for cooked products and restaurant or café and takeaway shops, in comparison to supermarkets. Removing the labelling exemption for cooked food in places including restaurants and café would greatly improve the transparency of seafood labels and allow the sustainability of more seafood products to be determined. This would make Australia a world leader in this regard, as cooked seafood products in most countries, including the European Union, Canada and America, do not mandate country of origin labelling for cooked seafood products served in the hospitality industry (Agricultural Marketing Service 2009; European Parliament and Council of the European Union 2013; Government of Canada 2019). An Australian senate inquiry into this issue was conducted in 2014, which determined that the exemption for cooked seafood in the food service industry should be removed (Rural and Regional Affairs and Transport References Committee 2014). This further supports changing the country of origin requirements for seafood products in hospitality establishments across Australia. However, when the federal labelling laws were updated in 2016, the origin exemption for the hospitality industry was not removed (Australian Government 2016). The Northern Territory already requires hospitality establishments to label if seafood is imported and demonstrates that concerns about high additional costs to implement country of origin laws for seafood are unfounded (Rural and Regional Affairs and Transport References Committee 2014). Queensland has recently passed a Bill (Food (Labelling of Seafood) Amendment Act 2021), which is due to come into effect in July 2023, which requires the hospitality industry in Queensland to label seafood items as Australian or imported on their menus, in line with the Northern Territory. This will help improve the transparency of where seafood products are from and, thus, make it easier for consumers to determine the sustainability of seafood. Transparency in seafood production chains could help improve the responsibility and accountability of producers to use more sustainable practices (Bailey et al. 2016; Lewis and Boyle 2017), and therefore reduce their overall environmental impact on the ocean.
The number of canned and frozen products missing information, which are typically packaged and are predominately found in supermarkets, is still quite large considering the Australian labelling laws. This is likely to be due to a generic name such as ‘fish’ being an acceptable species label (Rural and Regional Affairs and Transport References Committee 2014; Australian Government 2016), with 996 products being labelled as ‘fish’ and 135 of those products provided fish as the most detailed species information, after examining the label or asking a server. In addition, there were 41 products labelled as flake (shark), another common generic name, with 28 products not providing any extra details even after enquiry. Furthermore, lax species labelling laws are facilitated by the lack of an official compulsory naming standard for seafood species. The seafood industry (funded by the FRDC) created the only available guide, the Australian Fish Names Standard, which is voluntary for businesses to use (Rural and Regional Affairs and Transport References Committee 2014). Therefore, adopting a mandatory labelling system will improve consistency and allow consumers to know exactly what species they are consuming. The framework for this to occur is already in place with the Australian Fish Names Standard, which covers over 4000 species, including both imported and domestically produced seafood (see https://www.fish.gov.au/).
We found that almost half of products were missing origin information, despite current labelling laws, which was likely to be due to two factors. First, in many cases, more detailed origin information (e.g. at Australian state level instead of just ‘Australia’) was required to successfully categorise a species by using the GoodFish guide. Second, many products (mostly packaged) that listed a country of origin, labelled only the country of processing (satisfying the labelling requirements), but did not list where the seafood in the product was caught or farmed (Australian Government 2016). It is common for seafood products to be transported to numerous destinations before reaching a consumer’s plate; for instance, the animal may be caught or farmed in one country then sent to one or more additional countries for processing, before ultimately being sent to another country (or sometimes back to where it was caught) for final sale and consumption (Food and Agriculture Organization of the United Nations 2020). Therefore, adding more specific origin of seafood labelling for processed seafood products (e.g. the fishery or farm where the species was caught) will also allow the consumer to have a better understanding of where the product has come from as well as where it was processed, giving greater transparency of the supply chain for the seafood product. For farmed seafood, the country of the farm and the species is sufficient detail for consumers to understand its geographic origin. Additionally, including the specific farm name on products could be beneficial for consumers because individual farms may have differing sustainability standards. It is more difficult to label the origin of wild-caught seafood, for instance, when there are multiple stocks of the same species in a country. Furthermore, the GoodFish guide recommends that labels also include which gear was used and the name of company to increase the accountability of the company and encourage them to ensure a high standard of environmental management, which will allow consumers to pick products with the best sustainability practices (Australian Marine Conservation Society 2019b).
Requirements for more detailed product origin information would bring Australia in line with countries such as America and the European Union that already enforce specific country of origin laws for packaged seafood products, including detailing where the seafood was caught or farmed as well as listing of the catch method (Agricultural Marketing Service 2009; European Parliament and Council of the European Union 2013). These regulations by the United States and the European Union have been put in place in an attempt to reduce the amount of illegal, unreported and unregulated (IUU) seafood products entering their markets (Bailey et al. 2016; Lewis and Boyle 2017). Improving traceability of seafood in an equitable and economically viable manner is a major challenge, especially for wild-caught products, owing to the nature of their production and trade, but the USA and EU initiatives have made some progress. Examples from the manufacturing or other food product sectors demonstrate that traceability is technically achievable where there is political will.
The GoodFish guide has a limited number of products classified as a Better Choice for consumers (Australian Marine Conservation Society 2019a). The guide currently lists 45 Better Choice options of 130 options, potentially making the choice limited for consumers and harder to find among the large range of species that are consumed (Australian Marine Conservation Society 2019a). A large portion of seafood species was not included in the guide, especially imported species. Furthermore, the missing Australian species were often common in major supermarkets, such as sweetlip and blacktip shark, which is concerning because supermarkets were the most common place for consumers to access seafood products. Because Australia imports 70% of seafood products (Steven et al. 2020), the addition of commonly available species is necessary to improve the effectiveness of the guide to consumers. The inconsistency in information between the GoodFish guide and the FRDC also has the potential to confuse consumers because different species have different sustainability categorisations when it comes to wild-caught Australian seafood. When used individually, both sources of sustainability information had low (less than 5%) availability of sustainable products. Combining the availability of sustainable products increases the availability to 6.68%. However, this is still quite poor, given the large number of seafood products available to consumers. Furthermore, it is unrealistic for people to refer to two different sources of sustainability information when purchasing seafood.
The conflicting results when comparing the FRDC with the GoodFish guide can be explained by the differences in their assessment criteria. The GoodFish guide for wild-caught species uses a holistic view of the ecosystem, focusing not only on the stock status of the target species, but also on environmental impacts, bycatch, and management, when assessing the categorisation of a species fishery (Australian Marine Conservation Society 2019a). In contrast, the FRDC considers a species only on an individual level, and assesses how that specific stock is performing in terms of biomass and fishing pressure to determine sustainability. However, in the future they are planning to consider broader ecosystem, social and economic impacts in their reports (see https://www.fish.gov.au/). These differences in assessment and sustainability information highlight the inconsistencies in the definitions of sustainable fisheries and seafood (Hilborn et al. 2015), and could cause confusion for consumers.
These results have highlighted how challenging it is for consumers to access sustainable seafood in south-eastern Queensland, despite the existence of sustainable options, including products that cost the same or less than ‘Say No’ or ‘Eat Less’ options. The effort involved in obtaining the necessary information may discourage them from buying seafood products altogether. When information is not presented to the consumer in enough detail and staff cannot provide the missing information, guides such as the GoodFish guide and America’s Monterey Bay Aquarium Seafood Watch are unable to be successfully used (Kemmerly and Macfarlane 2009; Roheim 2009). However, when there is sufficient information, guides are an excellent resource for consumers to utilise and not only aid in increasing knowledge and awareness of sustainability issues in the seafood industry, but also help change consumer purchasing habits (Kemmerly and Macfarlane 2009). Thus, our recommendations broadly apply to countries with seafood guides that are looking to improve the availability of sustainable seafood to their consumers. As a general rule for Australian seafood consumers, we recommend choosing local Australian products because they are usually the most sustainable option owing to regulated legislation, such as the Fisheries Management Act 1991, that ensures generally well-managed fisheries and aquaculture systems compared with those in many exporting countries. Farmed prawns, mussels, oysters and barramundi are the most common sustainable seafood products available.
Overall, there needs to be a higher standard of seafood production to increase the accessibility of sustainable seafood products to consumers and give them a greater variety of choices. Stricter laws for Australia’s seafood imports in terms of sustainability and traceability would further increase the relative availability of sustainable seafood options for consumers. Improving the sustainability of trade and food production in Australia would not only benefit people looking to make sustainable choices, but also help the Australian Government meet the United Nations Sustainable Development goals, specifically Goals 12 and 14 (Responsible Consumption and Production and Life Below Water). Ultimately, efforts to improve the production component of sustainable seafood will be wasted if complementary actions are not taken to close the supply loop and communicate that information to consumers.
Data availability
The data that supports this study are available in the article and accompanying online supplementary material. This study has previously been posted as a preprint (doi:10.20944/preprints202112.0164.v2).
Declaration of funding
This research was funded by an ARC Future Fellowship (200100314) grant awarded to Carissa Klein.
Acknowledgements
We thank the citizen scientists who volunteered their time to collect surveys for the study, especially the field trip participants.
References
Australian Bureau of Statistics (2017) 2016 census quickstats. (ABS) Available at https://quickstats.censusdata.abs.gov.au/census_services/getproduct/census/2016/quickstat/036
Agricultural Marketing Service (2009) Mandatory country of origin labeling of beef, pork, lamb, chicken, goat meat, wild and farm-raised fish and shellfish, perishable agricultural commodities, peanuts, pecans, ginseng, and macadamia nuts. Document number 74 FR 2658. (US Department of Agriculture) Available at https://www.federalregister.gov/documents/2009/01/15/E9-600/mandatory-country-of-origin-labeling-of-beef-pork-lamb-chicken-goat-meat-wild-and-farm-raised-fish
Ahmed N, Thompson S, Glaser M (2019) Global aquaculture productivity, environmental sustainability, and climate change adaptability. Environmental Management 63(2), 159-172.
| Crossref | Google Scholar | PubMed |
Australian Marine Conservation Society (2019a) Goodfish: Australia’s sustainable seafood guide. (AMCS) Available at https://goodfish.org.au
Australian Marine Conservation Society (2019b) Australian seafood labelling. (AMCS) Available at https://goodfish.org.au/resource/australian-seafood-labelling/
Australian Government (2016) Country of origin food labelling information standard 2016. (Australian Government: Canberra, ACT, Australia) Available at https://www.legislation.gov.au/Details/F2017C00920
Bailey M, Flores J, Pokajam S, Sumaila UR (2012) Towards better management of coral triangle tuna. Ocean & Coastal Management 63, 30-42.
| Crossref | Google Scholar |
Bailey M, Bush SR, Miller A, Kochen M (2016) The role of traceability in transforming seafood governance in the global south. Current Opinion in Environmental Sustainability 18, 25-32.
| Crossref | Google Scholar |
Bogard JR, Farmery AK, Baird DL, Hendrie GA, Zhou S (2019) Linking production and consumption: the role for fish and seafood in a healthy and sustainable Australian diet. Nutrients 11(8), 1766.
| Crossref | Google Scholar | PubMed |
Brisbane City Council (2021) Food safety permits. (Brisbane City Council: Brisbane, Qld, Australia) Available at https://www.data.brisbane.qld.gov.au/data/dataset/food-safety-permits/resource/69ed0503-43db-4873-abd6-9fcc500b805b
Brown CJ (2016) Social, economic and environmental effects of closing commercial fisheries to enhance recreational fishing. Marine Policy 73, 204-209.
| Crossref | Google Scholar |
Cánovas-Molina A, García-Frapolli E (2021) Socio-ecological impacts of industrial aquaculture and ways forward to sustainability. Marine and Freshwater Research 72(8), 1101-1109.
| Crossref | Google Scholar |
Cawthorn D-M, Baillie C, Mariani S (2018) Generic names and mislabeling conceal high species diversity in global fisheries markets. Conservation Letters 11(5), e12573.
| Crossref | Google Scholar |
Collie JS, Hall SJ, Kaiser MJ, Poiner IR (2000) A quantitative analysis of fishing impacts on shelf-sea benthos. Journal of Animal Ecology 69(5), 785-798.
| Crossref | Google Scholar | PubMed |
European Parliament and Council of the European Union (2013) Regulation (EU) no 1379/2013 of the European Parliament and of the council. On the common organisation of the markets in fishery and aquaculture products, amending Council Regulations (EC) No 1184/2006 and (EC) No 1224/2009 and repealing Council Regulation (EC) No 104/2000. Official Journal of the European Union – Legislation 354, 28.12.2013 Available at https://eur-lex.europa.eu/eli/reg/2013/1379/oj/eng.
| Google Scholar |
Food and Agriculture Organization of the United Nations (2020) The state of world fisheries and aquaculture 2020. Sustainability in action. (FAO: Rome, Italy) Available at https://www.fao.org/3/ca9229en/ca9229en.pdf
Gold Coast City Council (2021) Eat safe Gold Coast. (Gold Coast City Council: Gold Coast, Qld, Australia) Available at https://www.goldcoast.qld.gov.au/Invest-do-business/Business-regulation/Eat-Safe-Gold-Coast
Government of Canada (2019) Safe food for Canadians regulations (SOR/2018-108). (Government of Canada: Canada) Available at https://laws-lois.justice.gc.ca/PDF/SOR-2018-108.pdf
Halpern BS, Frazier M, Verstaen J, Rayner P-E, Clawson G, Blanchard JL, Cottrell RS, Froehlich HE, Gephart JA, Jacobsen NS, Kuempel CD, McIntyre PB, Metian M, Moran D, Nash KL, Többen J, Williams DR (2022) The environmental footprint of global food production. Nature Sustainability 5(12), 1027-1039.
| Crossref | Google Scholar |
Hardesty BD, Good TP, Wilcox C (2015) Novel methods, new results and science-based solutions to tackle marine debris impacts on wildlife. Ocean & Coastal Management 115, 4-9.
| Crossref | Google Scholar |
Hilborn R, Fulton EA, Green BS, Hartmann K, Tracey SR, Watson RA (2015) When is a fishery sustainable? Canadian Journal of Fisheries and Aquatic Sciences 72(9), 1433-1441.
| Crossref | Google Scholar |
Hilborn R, Banobi J, Hall SJ, Pucylowski T, Walsworth TE (2018) The environmental cost of animal source foods. Frontiers in Ecology and the Environment 16(6), 329-335.
| Crossref | Google Scholar |
Hilborn R, Amoroso RO, Anderson CM, Baum JK, Branch TA, Costello C, de Moor CL, Faraj A, Hively D, Jensen OP, Kurota H, Little LR, Mace P, McClanahan T, Melnychuk MC, Minto C, Osio GC, Parma AM, Pons M, Segurado S, Szuwalski CS, Wilson JR, Ye Y (2020) Effective fisheries management instrumental in improving fish stock status. Proceedings of the National Academy of Sciences 117(4), 2218-2224.
| Crossref | Google Scholar |
Ipswich City Council (2021) Eat safe Ipswich City. (Ipswich City Council) Available at https://maps.ipswich.qld.gov.au/eatsafe
Kemmerly JD, Macfarlane V (2009) The elements of a consumer-based initiative in contributing to positive environmental change: Monterey Bay Aquarium’s Seafood Watch program. Zoo Biology 28(5), 398-411.
| Crossref | Google Scholar | PubMed |
Kroetz K, Luque GM, Gephart JA, Jardine SL, Lee P, Chicojay Moore K, Cole C, Steinkruger A, Donlan CJ (2020) Consequences of seafood mislabeling for marine populations and fisheries management. Proceedings of the National Academy of Sciences 117(48), 30318-30323.
| Crossref | Google Scholar |
Lawley M, Craig JF, Dean D, Birch D (2019) The role of seafood sustainability knowledge in seafood purchase decisions. British Food Journal 121(10), 2337-2350.
| Crossref | Google Scholar |
Lewis SG, Boyle M (2017) The expanding role of traceability in seafood: tools and key initiatives. Journal of Food Science 82, A13-A21.
| Crossref | Google Scholar | PubMed |
Logan City Council (2021) Eat safe Logan. (Logan City Council: Logan, Qld, Australia) Available at https://www.logan.qld.gov.au/eat-safe-logan-star-ratings
Major T (2021) Recreational fishing is booming in Queensland, so should fishers pay a licence fee? In ‘ABC Rural’, 24 February 2021. (Australian Broadcasting Corporation) Available at https://www.abc.net.au/news/rural/2021-02-24/recreational-fishing-conservation-seafood-regulations-qld-fish/13180176?nw=0&r=Image
Marine Stewardship Council (2022) MSC fisheries standard. Version 3.0, 26 October, 2022. (Marine Stewardship Council: London, UK) Available at https://www.msc.org/docs/default-source/default-document-library/for-business/program-documents/fisheries-program-documents/msc-fisheries-standard-v3-0.pdf?sfvrsn=53623a3_21
Marschke M, Vandergeest P (2016) Slavery scandals: unpacking labour challenges and policy responses within the off-shore fisheries sector. Marine Policy 68, 39-46.
| Crossref | Google Scholar |
McClenachan L, Dissanayake STM, Chen X (2016) Fair trade fish: consumer support for broader seafood sustainability. Fish and Fisheries 17(3), 825-838.
| Crossref | Google Scholar |
McCluney JK, Anderson CM, Anderson JL (2019) The fishery performance indicators for global tuna fisheries. Nature Communications 10(1), 1641.
| Crossref | Google Scholar |
McKinley DC, Miller-Rushing AJ, Ballard HL, Bonney R, Brown H, Cook-Patton SC, Evans DM, French RA, Parrish JK, Phillips TB, Ryan SF, Shanley LA, Shirk JL, Stepenuck KF, Weltzin JF, Wiggins A, Boyle OD, Briggs RD, Chapin SF, III, Hewitt DA, Preuss PW, Soukup MA (2017) Citizen science can improve conservation science, natural resource management, and environmental protection. Biological Conservation 208, 15-28.
| Crossref | Google Scholar |
Morland K, Wing S, Diez Roux A, Poole C (2002) Neighborhood characteristics associated with the location of food stores and food service places. American Journal of Preventive Medicine 22(1), 23-29.
| Crossref | Google Scholar | PubMed |
Myers RA, Baum JK, Shepherd TD, Powers SP, Peterson CH (2007) Cascading effects of the loss of apex predatory sharks from a coastal ocean. Science 315(5820), 1846-1850.
| Crossref | Google Scholar | PubMed |
O’Neill FG, Ivanovic A (2016) The physical impact of towed demersal fishing gears on soft sediments. ICES Journal of Marine Science 73, i5-i14.
| Crossref | Google Scholar |
Pauly D, Christensen V, Guenette S, Pitcher TJ, Sumaila UR, Walters CJ, Watson R, Zeller D (2002) Towards sustainability in world fisheries. Nature 418(6898), 689-695.
| Crossref | Google Scholar | PubMed |
Poore J, Nemecek T (2018) Reducing food’s environmental impacts through producers and consumers. Science 360(6392), 987-992.
| Crossref | Google Scholar |
Roberson LA, Watson RA, Klein CJ (2020) Over 90 endangered fish and invertebrates are caught in industrial fisheries. Nature Communications 11(1), 4764.
| Crossref | Google Scholar |
Roheim CA (2009) An evaluation of sustainable seafood guides: implications for environmental groups and the seafood industry. Marine Resource Economics 24(3), 301-310.
| Crossref | Google Scholar |
Rural and Regional Affairs and Transport References Committee (2014) Current requirements for labelling of seafood and seafood products. (Rural and Regional Affairs and Transport: Canberra, ACT, Australia) Available at htps://www.aph.gov.au/Parliamentary_Business/Committees/Senate/Rural_and_Regional_Affairs_and_Transport/Seafood_labelling/Report
Steven AH, Mobsby D, Curtotti R (2020) Australian fisheries and aquaculture statistics 2018. Fisheries Research and Development Corporation project 2019-093. (ABARES: Canberra, ACT, Australia) doi:10.25814/5de0959d55bab
Sullivan BL, Aycrigg JL, Barry JH, Bonney RE, Bruns N, Cooper CB, Damoulas T, Dhondt AA, Dietterich T, Farnsworth A, Fink D, Fitzpatrick JW, Fredericks T, Gerbracht J, Gomes C, Hochachka WM, Iliff MJ, Lagoze C, La Sorte FA, Merrifield M, Morris W, Phillips TB, Reynolds M, Rodewald AD, Rosenberg KV, Trautmann NM, Wiggins A, Winkler DW, Wong W-K, Wood CL, Yu J, Kelling S (2014) The ebird enterprise: an integrated approach to development and application of citizen science. Biological Conservation 169, 31-40.
| Crossref | Google Scholar |
Tovar A, Moreno C, Manuel-Vez MP, Garcia-Vargas M (2000) Environmental impacts of intensive aquaculture in marine waters. Water Research 34(1), 334-342.
| Crossref | Google Scholar |
Valenti WC, Kimpara JM, Preto BdL, Moraes-Valenti P (2018) Indicators of sustainability to assess aquaculture systems. Ecological Indicators 88, 402-413 [In English].
| Crossref | Google Scholar |
Witkin T, Dissanayake STM, McClenachan L (2015) Opportunities and barriers for fisheries diversification: consumer choice in new england. Fisheries Research 168, 56-62.
| Crossref | Google Scholar |
Worm B, Barbier EB, Beaumont N, Duffy JE, Folke C, Halpern BS, Jackson JBC, Lotze HK, Micheli F, Palumbi SR, Sala E, Selkoe KA, Stachowicz JJ, Watson R (2006) Impacts of biodiversity loss on ocean ecosystem services. Science 314(5800), 787-790.
| Crossref | Google Scholar | PubMed |
Appendix 1
Sustainable seafood survey
A single enquiry may be given to the person serving you, for example, could you please tell me what species this is and where it was caught?
*Required
Date *
Name of establishment *
Suburb or postcode *
Type of establishment *
Mark only one.
Restaurant or café
Take away (e.g. fish and chip shop)
Supermarket
Specialty seafood store
Farmers market
Food truck
Other:
Type of product*
Mark only one.
Fresh or raw
Frozen
Cooked
Canned
Product label*
Includes the label on the menu, packaging or signage.
Which species*
Please be as detailed as possible (this can include scientific name or common name(s)). If no species information is available please specify the type of seafood, e.g. fish, prawns.
Place of origin (where caught or farmed)*
This could be a country, region or ocean, please be as detailed as possible.
State or Territory (if Australian place of origin)
Mark only one.
Qld
NSW
Vic.
SA
NT
WA
Tas.
Unknown
Catch method*
Mark only one.
Farmed
Wild caught
Unknown
Any other catch information (e.g. line caught, trap)
Sustainability certification*
Tick all that apply.
Marine Stewardship Council (MSC)
Responsibly sourced (Woolworths)
Aquaculture Stewardship Council (ASC)
Responsibly sourced (Coles)
Best aquaculture practices (BAP)
No certification
Other:
Cost A$*
Cost units*
Mark only one.
Per 100 g
Per kg
Per serve
Other:
Did you ask for any of this information?*
Tick all that apply.
Species
Origin
Catch method
No
Other:
Additional comments
Appendix 2
| Region | Number of potential seafood establishments | Population (2016 census) | Proportion of seafood establishments (after in-person surveying) | Sample size, 5% margin of error, 95% confidence | Number of in-person surveyed establishments | Number of surveys collected in person | Number of extrapolated surveyed establishments | Number of extrapolated surveys | |
|---|---|---|---|---|---|---|---|---|---|
| Brisbane City | 6159 | 1 131 155 | 0.60 | 348 | 276 | 1831 | 654 | 17 812 | |
| Gold Coast City | 4446 | 555 721 | 0.67 | 341 | 249 | 2497 | 458 | 10 708 | |
| Ipswich City | 576 | 193 733 | 0.76 | 205 | 152 | 932 | 216 | 3896 | |
| Lockyer Valley A | 115 | 38 609 | 0 | 89 | 0 | 0 | 13 | 383 | |
| Logan City | 970 | 303 386 | 0.61 | 233 | 72 | 1165 | 165 | 4242 | |
| Moreton Bay Region A | 1360 | 425 302 | 0.66 | 269 | 148 | 740 | 263 | 4982 | |
| Noosa Shire A | 155 | 52 149 | 0.89 | 102 | 10 | 26 | 19 | 720 | |
| Redland City A | 437 | 147 010 | 0.68 | 169 | 105 | 1098 | 140 | 2414 | |
| Scenic Rim Region A | 119 | 40 072 | 0.46 | 49 | 18 | 45 | 24 | 258 | |
| Somerset Region A | 73 | 24 597 | 0 | 62 | 0 | 0 | 3 | 163 | |
| Sunshine Coast Region A | 941 | 294 367 | 0.48 | 208 | 20 | 163 | 106 | 4750 | |
| Toowoomba City A | 478 | 160 779 | 0 | 214 | 0 | 0 | 50 | 2119 | |
| Total | 15 829 | 3 366 880 | – | 2289 | 1050 | 8497 | 2110 | 52 447 |
Appendix 3
| Establishment | Product | Sustainability categorisation | |
|---|---|---|---|
| Date A | Type of product | AMCS guide categorisation | |
| Establishment A | Product label | AMCS guide categorisation (worst choice) | |
| Suburb A | Type of seafood (e.g. fish, prawn) | GoodFish guide recognised establishment | |
| Postcode A | Which species | Great Australian Seafood Finder establishment | |
| Region (local government area) | Scientific name if given | EPBC Act list of threatened species | |
| Australian or imported | FRDC stock status | ||
| Place of origin | IUCN Red List status | ||
| State (if Australian place of origin) | Presence of MSC certification | ||
| Catch method | Canned tuna guide | ||
| Other catch method information | WWF at risk species to avoid | ||
| Presence or absence of a sustainability certification | Monterey Bay Aquarium seafood watch | ||
| Researched sustainability certifications | Fish choice | ||
| Price (A$) | GoodFish guide UK | ||
| Price units | Ocean Wise Seafood Program | ||
| Did you ask for any of this information? | |||
| Additional comments |
| Type | Sustainability categorisation (number of products) | Total | |||||
|---|---|---|---|---|---|---|---|
| Better Choice | Eat Less | Say No | Not enough information | NA | |||
| (a) Establishments | |||||||
| Farmers market | 7 | 12 | – | 1 | 2 | 22 | |
| Food truck | 2 | 2 | 2 | – | 1 | 7 | |
| Restaurant or café | 56 | 21 | 247 | 792 | 223 | 1339 | |
| Service station | – | – | 11 | 10 | 58 | 79 | |
| Specialty seafood store | 27 | 21 | 36 | 70 | 52 | 206 | |
| Supermarket | 237 | 206 | 1524 | 852 | 3032 | 5851 | |
| Takeaway shop | 32 | 23 | 239 | 546 | 153 | 993 | |
| (b) Products | |||||||
| Canned | – | – | 268 | 112 | 2049 | 2429 | |
| Cooked | 85 | 47 | 673 | 1222 | 592 | 2619 | |
| Dried | – | – | – | 1 | 7 | 8 | |
| Fresh or raw | 255 | 141 | 474 | 418 | 196 | 1484 | |
| Frozen (packaged) | 21 | 97 | 644 | 518 | 677 | 1957 | |
Appendix 4
| Question | Total | |||||||||
|---|---|---|---|---|---|---|---|---|---|---|
| Species | Origin | Catch method | ||||||||
| Known | Unknown | Known | Unknown | Known | Unknown | Known | Unknown | |||
| (a) Summary | ||||||||||
| Number of products | 814 | 1285 | 1519 | 1775 | 502 | 264 | 2835 | 3324 | ||
| Percentage (%) | 38.78 | 61.22 | 46.11 | 53.89 | 65.54 | 34.46 | 46.03 | 53.97 | ||
| (b) Type of establishment | ||||||||||
| Farmers market | Number of products | – | – | – | – | – | – | – | – | |
| Percentage (%) | – | – | – | – | – | – | – | – | ||
| Food truck | Number of products | 2 | – | 3 | – | 6 | – | 11 | – | |
| Percentage (%) | 100 | 0 | 100 | 0 | 100 | 0 | 100 | 0 | ||
| Restaurant or café | Number of products | 42 | 69 | 609 | 486 | 147 | 137 | 798 | 692 | |
| Percentage (%) | 37.84 | 62.16 | 55.62 | 44.38 | 51.76 | 48.24 | 53.56 | 46.44 | ||
| Service station | Number of products | – | 1 | – | 1 | – | – | – | 2 | |
| Percentage (%) | 0 | 100 | 0 | 100 | – | – | 0 | 100 | ||
| Specialty seafood store | Number of products | 3 | 3 | 6 | – | 130 | 8 | 139 | 11 | |
| Percentage (%) | 50.00 | 50.00 | 100 | 0 | 94.20 | 5.80 | 92.67 | 7.33 | ||
| Supermarket | Number of products | 252 | 154 | 30 | 6 | 33 | 15 | 315 | 175 | |
| Percentage (%) | 62.07 | 37.93 | 83.33 | 16.67 | 68.75 | 31.25 | 64.29 | 35.71 | ||
| Takeaway shop | Number of products | 200 | 768 | 763 | 792 | 182 | 102 | 1145 | 1662 | |
| Percentage (%) | 20.66 | 79.34 | 49.07 | 50.93 | 64.08 | 35.92 | 40.79 | 59.21 | ||