Climate summary for the southern hemisphere, 2019–20: a strong positive Indian Ocean Dipole
Blair Trewin A *
A *
A
Abstract
This is a summary of the southern hemisphere atmospheric circulation patterns and meteorological indices for 2019–20; an account of rainfall and temperature for the Australian region is also provided. The second half of 2019 was dominated by a strong positive Indian Ocean Dipole, before a return to more normal conditions from early 2020. The Indian Ocean Dipole, along with generally negative phases of the Southern Annular Mode associated with a marked high-latitude sudden stratospheric warming, contributed to very dry conditions in Australia in the second half of 2019, with exceptional fire weather conditions and associated severe fires. The sudden stratospheric warming was also a major contributor to a well below average Antarctic ozone hole in spring 2019. It was also fairly dry over most other southern hemisphere continental areas, and over the Maritime Continent in the second half of 2019, with the most significant wet anomalies in 2019–20 being in equatorial east Africa. Temperatures were well above average in 2019–20 for both Australia and the southern hemisphere as a whole.
Keywords: 2019, 2020, Black Summer of fire, climate summary, El Niño–Southern Oscillation, ENSO, Forest Fire Danger Index, Indian Ocean Dipole, IOD, OLR, outgoing longwave radiation, Pacific, rainfall anomalies, rainfall overview, SAM, sea ice extent, sea surface temperature, seasonal summary, southern hemisphere, SST, summer of extremes, Southern Annular Mode, temperature anomalies, temperature overview.
1.Introduction
This summary is the first of a new series that documents conditions in the 12 months from July of 1 year to June of the following year. This timespan was chosen as it incorporates the typical lifecycle of El Niño–Southern Oscillation (ENSO) events more clearly than does a calendar year, as well as aligning more clearly with key features of the southern hemisphere climate such as the tropical monsoon seasons. This report incorporates information from the published summary for summer 2019−20 (Benger and Chapman 2023) and follows on from previous seasonal summaries for spring 2018 (Trewin 2020) and summer 2018−19 (Hague 2021).
This summary reviews the southern hemisphere and equatorial climate patterns relevant to summer 2019–20, and some of the associated impacts, with particular attention given to the Australasian and equatorial regions of the Pacific and Indian ocean basins. It includes a description of the status of major large-scale climate influences relevant to the region, as well as key indicators of the state of the southern hemispheric climate system, including concentrations of greenhouse gases and stratospheric ozone. Individual severe weather events and their impacts are generally outside the scope of this report and are covered in the World Meteorological Organization’s State of the Climate1 report series, as well as in national annual reports, including the Annual Climate Statement2 for Australia.
A major influence on the climate system during the period, particularly in the second half of 2019, was a strong positive phase of the Indian Ocean Dipole (IOD) (Section 3.2). Positive phases of the IOD are associated with low rainfall over much of Australia, along with parts of the Maritime Continent, and high rainfall in equatorial east Africa (Ashok et al. 2003; Saji and Yamagata 2003). The rainfall anomalies associated with the 2019 event were especially large and contributed to many of the major climate impacts experienced during 2019–20.
2.Data sources
The main sources of information for this report are analyses prepared by the Australian Bureau of Meteorology (The Bureau), the United States National Oceanic and Atmospheric Administration (NOAA) and the Global Precipitation Climatology Centre (GPCC). This report also draws on the annual State of the Climate reports of the World Meteorological Organization (2020, 2021a, 2021b) and the annual State of the Climate reports published in the Bulletin of the American Meteorological Society (Blunden and Arndt 2020; Blunden and Boyer 2021). Figures are sourced from The Bureau of Meteorology unless otherwise stated.
In addition to the information sourced from NOAA, GPCC and The Bureau, the latter operates a suite of numerical weather prediction (NWP) models, named the Australian Community Climate and Earth System Simulator (ACCESS). Objective analyses used in the present study are mostly obtained from ACCESS-G (Australian Community Climate and Earth System Simulator–Global, Bureau of Meteorology 2010; Puri et al. 2013) at 0.5° resolution. Charts sourced for Section 7 originate from ACCESS-G.
Real-time rainfall analyses (Section 10) of accumulated precipitation are obtained from the The Bureau at: http://www.bom.gov.au/jsp/awap/rain/index.jsp. The analysis system is described in Evans et al. (2020). Temperature anomalies in Section 10 are calculated with respect to the period 1961–90, and percentile-based analyses for the period from the start of the relevant dataset to 2020. The ACORN-SAT temperature data set (ver. 2.4; Trewin et al. 2020), released in September 2023, was used in the preparation of this document.
The ENSO 5VAR was developed by The Bureau and is described by Kuleshov et al. (2009). The principal component analysis and standardisation of this ENSO index is performed over the period 1950–99. Sea surface temperatures are obtained from National Centers of Environmental Prediction (NCEP).
The ‘CAMS_OPI’ data are 2.5° latitude and longitude spatial means of monthly mean precipitation derived from station gauges and satellite estimates. Anomalies have been recomputed using the 1979–2000 base period.
Baseline periods used for anomaly and percentile calculations are those used by the data providers unless otherwise stated. Baseline periods are influenced by the available data, with most products based directly or indirectly on satellite data not commencing until the late 1970s or later.
References to records and rankings are as of the end of June 2020, and do not include values observed subsequently.
3.Pacific and Indian ocean basin climate indices
The Indian and Pacific Oceans play a significant role in Australia’s climate.3 Variations in sea surface temperatures in the tropical regions in both oceans have been shown to dramatically increase the potential for rainfall and temperature extremes for Australia.
3.1. Southern Oscillation and ENSO Indices
The El Niño–Southern Oscillation (ENSO) is monitored through a range of indices, both atmospheric and oceanic. During 2019–20, both the Troup Southern Oscillation Index4 (SOI) and the NINO3.4 and 5VAR sea surface temperature indices were generally consistent with conditions in the equatorial central and eastern Pacific, which were mostly warmer than average, but not at a level sufficient to reach El Niño thresholds on a sustained basis. These are the primary indices used to measure variations in sea surface temperatures and atmospheric conditions along the tropical Pacific Ocean; such variations are well known to influence the climate in the Australian region and much of the broader southern hemisphere. When indices are neutral, as for the bulk of 2019−20, other climate influences tend to dominate. For reference, plots of the indices are included below.
Fig. 1 (left) shows the SOI and a 5-month weighted moving average of the monthly SOI. SOI values were negative through the second half of 2019 but were within the neutral range (generally considered to be between +7 and −7) for most of the year, with the 5-month mean falling to −7.5 at its lowest point. From January 2020 onwards, SOI values were generally close to zero.5
(Left) Troup Southern Oscillation Index (SOI) values from January 2017 to September 2020, with a 5-month binomial weighted moving average. (Right) Anomalies of the composite 5VAR ENSO index for the period January 2016 to September 2020 with the 3-month binomially weighted moving average.

The ENSO 5VAR Index is a composite monthly ENSO index. Values of the 5VAR within 1 s.d. are typically associated with neutral conditions; as evident in Fig. 1 (right), this was the case for most of 2019−20. The NINO3.4 index is used by The Bureau to monitor ENSO as it is closely related to the Australian climate (Wang and Hendon 2007); it measures sea surface temperatures in the central Pacific Ocean between 5°N–5°S and 120–170°W. NINO3.4 also remained in the neutral range (between +0.8 and −0.8°C) for most of 2019–20. It was positive for most of 2019–20 but did not exceed 0.7°C at any stage, before dropping back to near zero in May and June 2020. Overall, The Bureau’s operational ENSO monitoring6 assessed ENSO conditions as neutral throughout the 12 months. The NINO4 index, which represents conditions in the central-western equatorial Pacific (between 160°E and 150°W), was warm for most of the period and peaked near +1°C in late 2019 and early 2020. With the tropical Pacific Ocean indices in a neutral phase, the main oceanic climate influence through the second half of 2019 was the Indian Ocean.
3.2. Indian Ocean Dipole (IOD)
The IOD7 is the difference in ocean temperatures from the western node of the tropical Indian Ocean (centred on the equator, off the coast of Somalia) and the eastern node (off the coast of Sumatra). The IOD is said to be in a positive phase when values of the Dipole Mode Index (DMI) are greater than +0.4°C, negative when DMI values are less than −0.4°C, and neutral otherwise. The positive and negative phases of the IOD are known to significantly influence Australian rainfall. The IOD is correlated with ENSO, with positive IOD events more likely to occur during El Niño events (Stuecker et al. 2017), but significant positive or negative IOD events can occur in the absence of a corresponding ENSO signal.
The positive IOD is known to have a significant influence over temperature and rainfall.8 During positive IOD periods, above average maximum temperatures typically occur in the west and south of Australia, and above average minimum temperatures in the south-west, but below average minimum temperature in the tropics, with below average rainfall in many parts of Australia.
The IOD’s primary influence on climate is during the austral winter and spring. Strong IOD phases are rare during the austral summer as DMI variability is low at this time of year (Yang et al. 2015). This is due to the monsoon trough shifting south over the tropical Indian Ocean and changing the overall circulation, meaning that an IOD ocean temperature pattern cannot be sustained. The influence of the positive IOD event of 2019, however, continued into summer as the monsoon trough remained farther north. The monsoon trough departed India much later than usual, only beginning its retreat on 9 October, compared with the average date of 1 September (India Meteorological Department 2019).
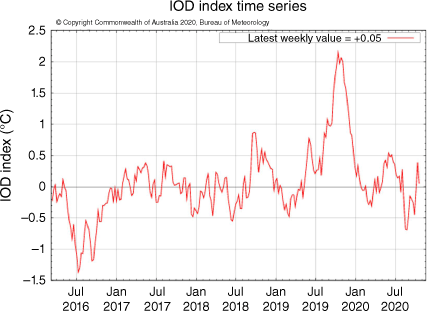
There was a strong positive IOD event in the second half of 2019. DMI values exceeded +0.4°C from late July 2019 onwards and remained above that threshold until late December (Fig. 2). The event peaked in October with DMI values near +2°C. Although there are differences between different data sets in the assessment of the strength of historical IOD events, the 2019 IOD event was clearly the strongest since 1997, and the strongest known event to occur in the absence of a clearly defined El Niño. DMI values then remained close to zero through the first half of 2020.
Widespread dry conditions in Australia in the second half of 2019, as well as anomalies elsewhere in the hemisphere, including dry conditions in much of Indonesia and the Australian Indian Ocean islands, and wet conditions in equatorial eastern Africa, were consistent with the conditions that would be expected with the positive IOD, in conjunction with other influences, such as the negative Southern Annular Mode phase late in 2019.
4.Outgoing longwave radiation (OLR)
Outgoing longwave radiation (OLR) in the equatorial Pacific Ocean can be used as an indicator of enhanced or suppressed tropical convection. Increased positive OLR anomalies typify a regime of reduced convective activity, a reduction in cloudiness and, usually, rainfall. Conversely, negative OLR anomalies indicate enhanced convection, increased cloudiness and chances of increased rainfall. During La Niña, decreased convection (increased OLR) can be seen near the International Date Line (180°E), whereas increased cloudiness (decreased OLR) near the Date Line usually occurs during El Niño. Similarly, when Australia is under the influence of a negative IOD event, OLR anomalies are negative over the eastern Indian Ocean where increased convection occurs.
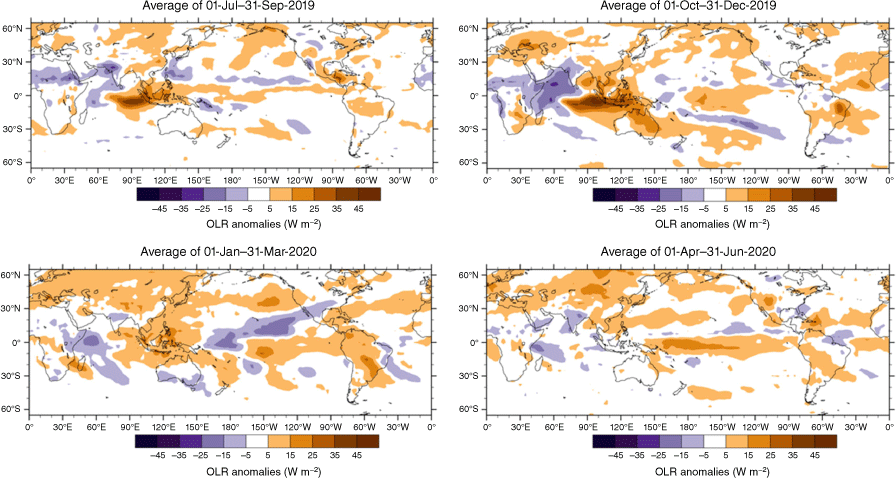
The strongest OLR signal observed in the southern hemisphere (Fig. 3) was an area of persistent strong positive anomalies in the second half of 2019 in the eastern half of the tropical Indian Ocean, associated with below-average sea surface temperatures and the positive IOD. These anomalies peaked during the October–December period in 2019, extending from ~75°E in the central Indian Ocean across the Maritime Continent and much of Australia, with a peak intensity exceeding +30 W m−2 off the west coast of Sumatra. Also consistent with the positive IOD, negative anomalies were observed over the tropical Indian Ocean west of 60°E, and adjacent areas of the east African continent. Both positive and negative OLR anomalies in the tropics retained their approximate geographic extent in the first quarter of 2020 while weakening in intensity, before returning to near-average from April onwards. OLR near the Date Line was near or slightly above average for most of the second half of 2019, and briefly fell below average in January and February 2020, before being consistently above average from April onwards as positive OLR anomalies developed across the equatorial Pacific more broadly.
5.Madden–Julian Oscillation (MJO) and tropical cyclone activity
The Madden–Julian Oscillation (MJO)9 is a tropical convective wave anomaly that develops in the Indian Ocean and propagates eastwards into the Pacific Ocean (Madden and Julian 1971, 1972, 1994). The MJO takes ~30 to 60 days to reach the western Pacific, with a frequency of six to twelve events per year (Donald et al. 2004). When the MJO is in an active phase, it is associated with areas of increased and decreased tropical convection, with effects on the southern hemisphere often weakening during early autumn, before transitioning to the northern hemisphere. Active phases are typically associated with increased rainfall and, during relevant seasons, an increased risk of tropical cyclone development in the sectors concerned. A description of the Real-time Multivariate MJO (RMM) index and the associated phases is documented by Wheeler and Hendon (2004).
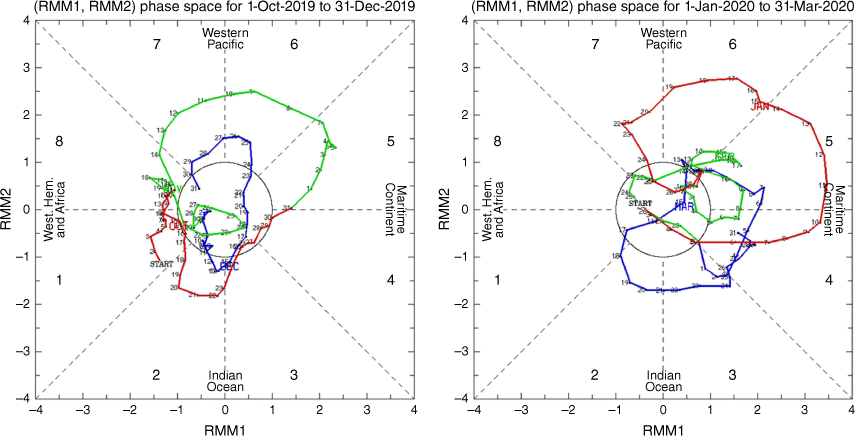
The seasonal phase-space diagrams of the RMM for 2019–20 are shown in Fig. 4. The two strongest phases of the MJO in 2019–20 occurred from late October to late November, and in January. Both were focused on the eastern part of the region, developing over the Maritime Continent and propagating into the western Pacific over the following 20–30 days. There was limited MJO activity over the Indian Ocean, particularly in the second half of 2019, when OLR was consistently above average over the eastern Indian Ocean (Section 4) and there were persistent easterly wind anomalies through the region, associated with a strongly positive IOD. The November event had only limited effects on Australian rainfall, but the January event was associated with an extreme rainfall event in the Top End of the Northern Territory on 11 January (see Section 10).
Phase-space representation of the MJO index for October–December 2019 (left) and January–March 2020 (right). The eight phases of the MJO and the corresponding (approximate) locations of the near-equatorial enhanced convective signal are labelled. The labelled dots indicate each day. In the left image, the coloured lines indicate months as follows: blue, December; green, November; red, October. In the right image, the coloured lines indicate months as follows: blue, March; green, February; red, January.
Tropical cyclone activity in the southern hemisphere in 2019–20 was fairly close to average. There were 11 tropical cyclones for the season in the south-west Indian Ocean region10 (Magee and Schreck 2021), 8 in the Australian region (Trewin and Bond 2021) and 9 in the south-west Pacific (Woolley et al. 2021), which was slightly below the 1981–2010 average in the Australian region and near average in the other regions.
The most significant cyclone of the season was Harold in April 2020, which crossed through Vanuatu from north-west to south-east as a Category 5 system, with maximum sustained 10-min winds of 64 m s−1 and a minimum central pressure of 912 hPa, one of the strongest systems ever to affect Vanuatu. In total, 30 deaths were reported, most of them losses at sea from a ferry in the Solomon Islands during the cyclone’s development phase, whereas in Vanuatu, more than 17,000 homes were damaged or destroyed and ~65% of the country’s population was affected (World Meteorological Organization 2021b). Significant impacts were also reported in Fiji and Tonga. Other cyclones in the south-west Pacific with significant impacts included Tino in January, which had direct and indirect impacts across a wide area extending from Tonga to Tuvalu and Niue; Sarai in December in Fiji, and Uesi in New Caledonia in February. In the south-west Indian Ocean region, Belna in December and Herold in March both resulted in loss of life through flooding in Madagascar, whereas in Australia, Damien made landfall in February near Karratha as a Category 3 system with widespread, though mostly minor to moderate, damage. Blake, in January, brought very heavy rainfall after landfall, with a daily total of 270 mm11 at Carnegie on 10 January, the highest on record for any site in the Interior district of Western Australia. The precursor low to Claudia in January brought extreme rainfall to parts of the Northern Territory (Section 10).
6.Oceanic patterns
6.1. Sea surface temperatures (SSTs)
The average SST in the southern hemisphere for 2019–20 was 0.63°C above the 1901–2000 average.12 This was the equal third-highest value on record, with the record highest value set during the strong El Niño event of 2015–16. Warm anomalies were strongest later in 2019–20, with an anomaly of +0.68°C for January to June 2020 (third highest on record), compared with +0.58°C for July to December 2019 (fourth highest). In both cases, the record high values were also in 2015–16.
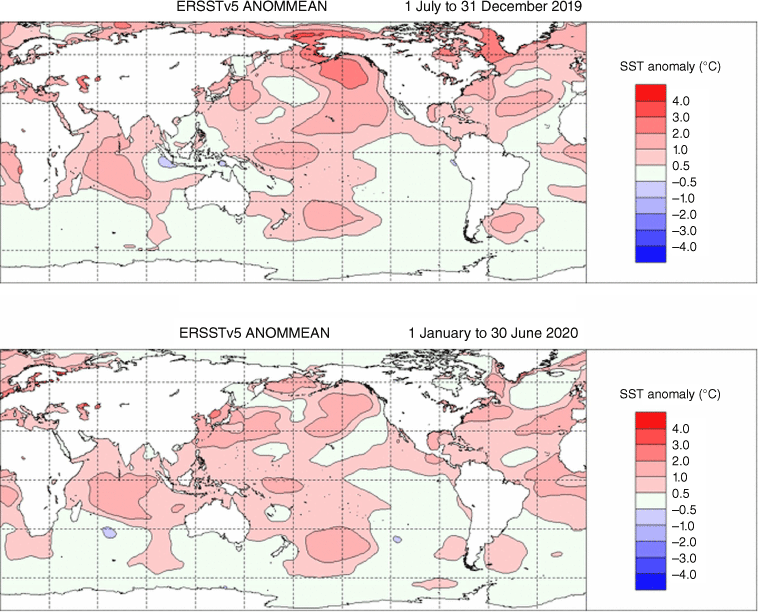
The most prominent warm areas of the southern hemisphere were in the tropics (Fig. 5), in the western half of the Pacific and the western and central Indian Ocean. A large part of the Indian Ocean had SSTs for the 12-month period more than 1°C above the 1961–90 average. Similar anomalies were found in the equatorial Pacific near the Date Line between 160°E and 170°W, and in parts of the eastern tropical South Atlantic. Outside the tropics, a prominent area of warm conditions was east of New Zealand, with anomalies exceeding +1°C over a broad area. Most tropical areas were at least 0.5°C above the 1961–90 average, except for the eastern half of the Pacific Ocean and an area stretching east from the eastern tropical Indian Ocean through most of the northern waters of Australia. SSTs were within 0.5°C of average over most areas south of 30°S, except for the region east of New Zealand, and smaller areas off the coast of Argentina.
ERSSTv5 sea surface temperature (SST) analysis for the period from July 2019 to June 2020: anomalies from 1961 to 1990 baseline (top) and percentiles from all years of record (bottom).
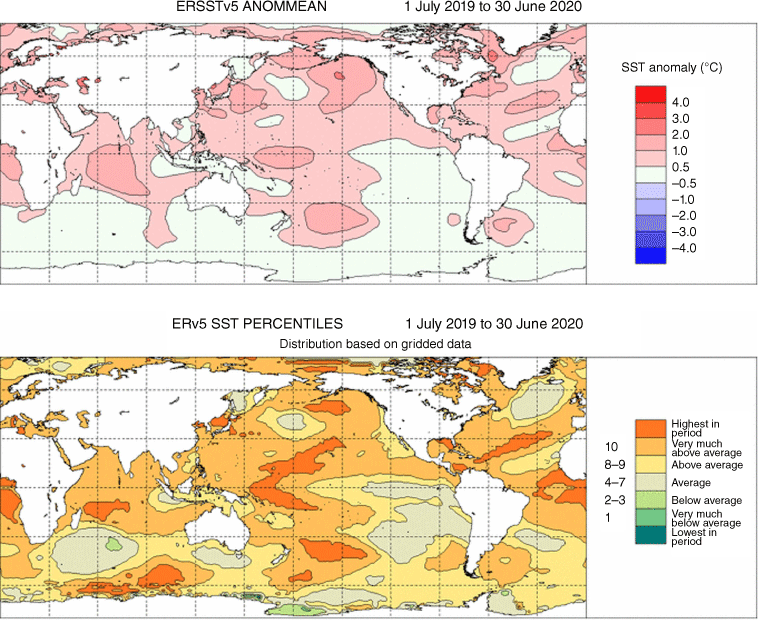
In the period from July to December 2019, SSTs were more than 0.5°C below the 1961–90 average in the eastern equatorial Indian Ocean west of Sumatra (Fig. 6), the eastern node of the IOD, but by the January to June 2020 period, they had returned to above average in this region. In the January–June period, almost all tropical areas apart from the eastern half of the Pacific were at least 0.5°C above average.
6.2. Subsurface
Ocean heat content, an indicator of heat through the ocean subsurface, was at record or near-record levels for most of the period. Averaged over the southern hemisphere, values for the 0–2000-m layer reached 15.34 × 10²² J in the quarter January–March 2020, the highest value on record for any quarter to that time. October–December 2019 (15.10 × 10²² J) was the highest October–December value on record, with April–June 2020 ranking second and July–September 2019 third.13 The warmth was especially pronounced in the South Atlantic, where ocean heat content was at record levels in all four quarters; the strongest warm anomalies here were in a band stretching across the ocean from west to east near 30°S. Anomalies were less extreme in the South Pacific and Indian Oceans, where ocean heat content was generally lower than it had been the previous year. Values for the South Indian Ocean for the April–June 2020 quarter were the lowest for that quarter since 2013.
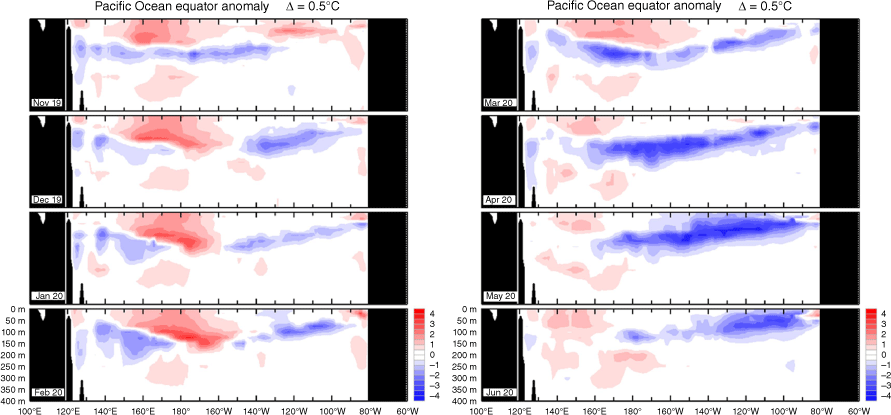
Subsurface temperatures in the equatorial Pacific (Fig. 7) were generally fairly close to average for most of the period, consistent with the neutral ENSO conditions. Subsurface waters were warmer than average near the Date Line during the summer, with peak anomalies exceeding 2°C between 100- and 150-m depth. Cool subsurface waters developed in the western equatorial Pacific in January and February and then propagated to most of the remainder of the Pacific east of 160°E from March onwards, with anomalies in May locally exceeding −3°C in parts of the central and eastern Pacific.
Subsurface ocean temperature anomalies14 (°C) along the equator from November 2019 to February 2020 (left) and March to June 2020 (right), obtained from NOAA’s TAO/TRITON data.
7.Sea ice
Antarctic sea ice extent was below the 1981–2010 average for most of 2019–20 (Reid et al. 2020, 2021), returning to values closer to average in the later part of the period. The seasonal maximum15 in September 2019 was 18.45 × 10⁶ km2 and the minimum in February 2020 was 2.74 × 10⁶ km2, both slightly below the 1981–2010 averages of 18.71 × 10⁶ and 2.84 × 10⁶ km2 respectively. The seasonal minimum was the highest since 2016. Sea ice extent was consistently below average in the second half of 2019 (Fig. 8), although rebounding somewhat from the record low values (for the time of year) observed at times in early 2019. Negative anomalies weakened from February 2020 onwards, with sea ice extent at near average levels in March and again in June.
Antarctic sea ice extent in 2019 (blue) and 2020 (purple), compared with the 1981−2010 median and interquartile and inter-decile ranges. Source: National Snow and Ice Data Center.
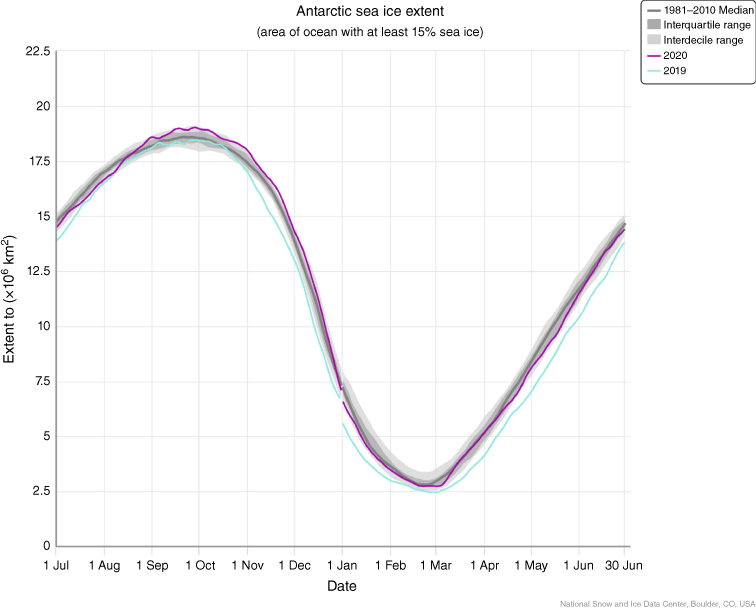
The transition from below-average sea ice extent in January 2020 to near-average by March coincided with a transition from a predominantly negative to predominantly positive phase of the Southern Annular Mode (Section 8). Positive phases of the Southern Annular Mode are generally associated with stronger westerly winds in latitudes near the Antarctic coast and ice divergence from the continent, expanding sea ice extent (Reid et al. 2021).
At the time of the seasonal maximum in September 2019, the sea ice edge was generally south of its normal position between 110 and 160°W in the Amundsen and eastern Ross Seas, whereas it was north of its normal position south of Australia (between 110 and 160°E), and between 20 and 50°E. Decreased spring sea ice extent in the Amundsen Sea region is characteristic of years with anomalously warm SSTs in the western tropical Indian Ocean (Zhang et al. 2024). During the summer, there were strong negative anomalies in the central Weddell Sea (20–40°W) and eastern Ross Sea (140–160°W). Generally positive sea ice anomalies persisted through much of the period in the Bellinghausen Sea west of the Antarctic Peninsula, a pattern that has persisted for several years and that has been associated with ocean freshening linked with glacial melt on the continent (Reid et al. 2020), although the anomalies in this area weakened during autumn 2020.
8.Atmospheric circulation
8.1. Southern Annular Mode (SAM)
The Southern Annular Mode (SAM), also known as the Antarctic Oscillation (AAO), describes north–south shifts of the belt of strong westerly winds in the middle to high latitudes of the southern hemisphere,16 with positive SAM indicating a poleward shift of these winds and associated frontal systems, and negative SAM an equatorward shift. The SAM is known to influence temperature and rainfall patterns across Australia with varying influences across the seasons (Hendon et al. 2007), with negative SAM associated with below-average rainfall on the east coast south of the tropics in spring and summer. It varies on shorter timescales, typically of a few weeks, than do ENSO and the IOD. A number of SAM data sets based on hemispheric analyses extend back to 1979, with SAM indices based on station data covering the whole post-1900 period. In this analysis, the data set of the NOAA Climate Prediction Center (CPC) is used.
SAM was predominantly in its negative phase during the second half of 2019 (Fig. 9), bringing stronger westerly winds over the southern Australian continent. The negative values were especially persistent and strong from October to December. Daily values of the SAM index in the CPC data set were continuously negative from 18 October to 23 December. The strongest monthly negative value of the index was −1.84 in November, the fourth-lowest of the post-1979 period and the lowest for November since 2009. The October–December mean was −1.37, the lowest of the post-1979 period for an October–December timespan (although the mean value for September–November 2002 was −1.45). Both the 2019 and 2002 events were associated with sudden stratospheric warmings in the Antarctic (Section 8.3).
Monthly Southern Annular Mode (SAM) index values from January 2016 to June 2020 (data: Climate Prediction Center).
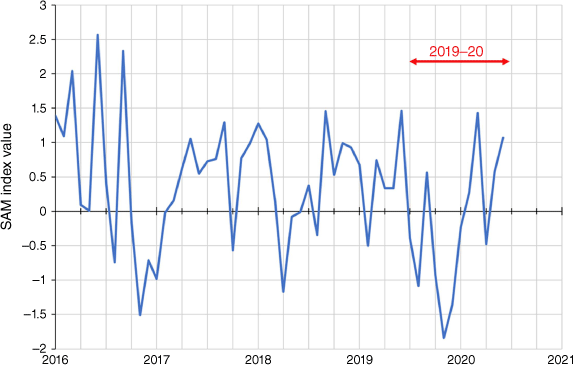
SAM returned to more neutral levels from January 2020 onwards, and leaned positive for most of the first half of 2020. Monthly values reached +1.43 in March and +1.07 in June, although both were lower than those observed in the corresponding months of 2016.
8.2. Surface analyses
Mean sea level pressure (MSLP) anomalies for the four quarters of the period are shown in Fig. 10, relative to the 1979–2000 climatology obtained from the NCEP II Reanalysis data (Kanamitsu et al. 2002). The MSLP pattern is computed using data from the 0000 hours UTC daily analyses of The Bureau’s ACCESS model.17 The MSLP anomaly field is not shown over areas of elevated topography (grey shading).
Southern hemisphere mean sea level pressure (MSLP) anomaly pattern for July to September 2019 (top left), October to December 2019 (top right), January to March 2020 (bottom left) and April to June 2020 (bottom right). Anomalies (hPa) calculated with respect to base period of 1979–2000. Areas of elevated topography are shown in grey.
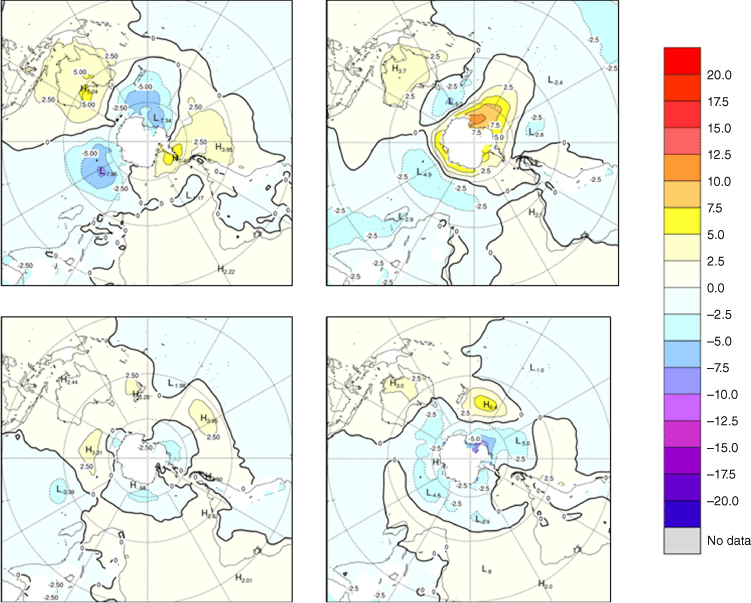
The most striking MSLP anomalies were in the October–December period, during the time with the most strongly negative SAM, with positive MSLP anomalies over most of Australia but strongly negative anomalies south of the continent, consistent with typical patterns during a negative SAM phase and resulting in anomalous westerly flow over southern Australia. The anomalies were especially strong in November (not shown), with monthly anomalies of +5 hPa over South Australia and −12 hPa near 50°S south of Tasmania. December showed similar spatial patterns but with weaker anomalies. There was also strong ridging over the South Pacific centred near 150°W during this period. Negative anomalies persisted over much of the July–December period in the Indian Ocean between 30 and 60°S, and there were weak negative anomalies over the western tropical Indian Ocean, which had anomalously warm SSTs during the positive phase of the IOD.
There were fewer strong MSLP anomalies in the first half of 2020 than there had been in the previous 6 months, consistent with the return of key climate influences to more neutral levels. Positive MSLP anomalies were centred near New Zealand in the January–March period, and to the east of the country in April–June. There was also an anomalous trough west of South America in the April–June period.
8.3. Upper atmosphere
The most notable event in the upper atmosphere during 2019–20 was a significant sudden stratospheric warming (SSW) over high latitudes of the southern hemisphere (Lim et al. 2021). Starting in the fourth week of August, the polar cap warmed by 35°C at 30 hPa over 3 weeks, whereas the polar westerly jet at 10 hPa weakened by 80 m s−1. This major weakening of the polar vortex then propagated downward and was a trigger for the strongly negative SAM from October onwards. Although SSW events are fairly common in the Arctic, they are rare in the Antarctic, with the only previous event comparable with the 2019 event occurring in 2002 (although the 2019 event surpassed that of 2002 on a number of key metrics).
The strongest 500-hPa geopotential height anomalies (Fig. 11) were observed in the October–December quarter, consistent with the SSW and the negative SAM (Section 8.1). Strong positive anomalies were observed over Antarctica, with almost the entire continent having 500-hPa geopotential heights 60 geopotential metres (gpm) or more above the 1979–2000 average. By contrast, negative anomalies were observed in most areas between 40 and 50°S, consistent with a northward displacement of the normal zonal circulation in these latitudes and mostly coincident with negative pressure anomalies at the surface (Fig. 11). This followed a July–September quarter when there was strong anomalous ridging over the Antarctic Peninsula (with a peak anomaly of +132 gpm), and anomalous troughs centred near 60°E in the Indian Ocean and south of New Zealand.
The mean 500-hPa geopotential metre (gpm) height anomalies for July to September 2019 (top left), October to December 2019 (top right), January to March 2020 (bottom left) and April to June 2020 (bottom right). Anomalies calculated with respect to base period of 1979−2000.
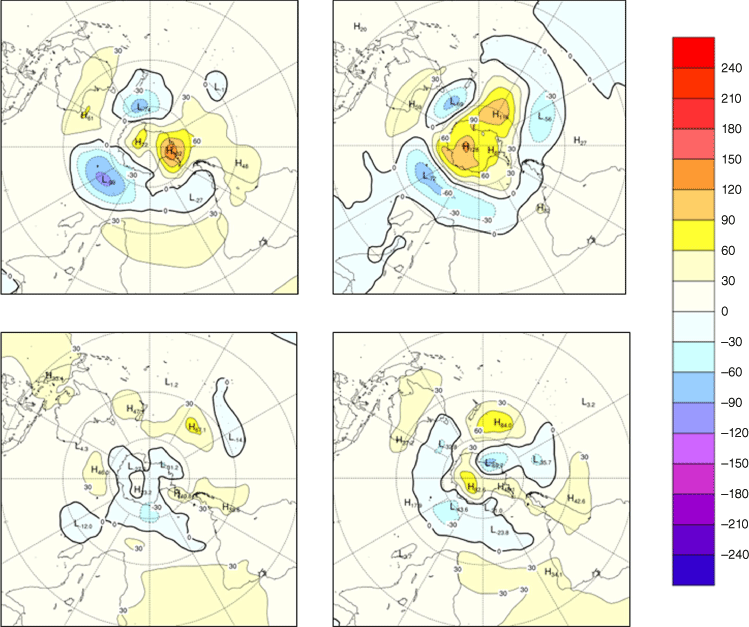
As with many other features of the climate system, conditions reverted to a situation closer to long-term averages in the first half of 2020, particularly in the January–March quarter where the only strong feature was ridging east of New Zealand. This strengthened further in the April–June period, in which an anomalous trough developed in the Indian Ocean centred near 40 to 60°E. Weak to moderate positive anomalies prevailed throughout the year over most areas beneath or north of the subtropical ridge.
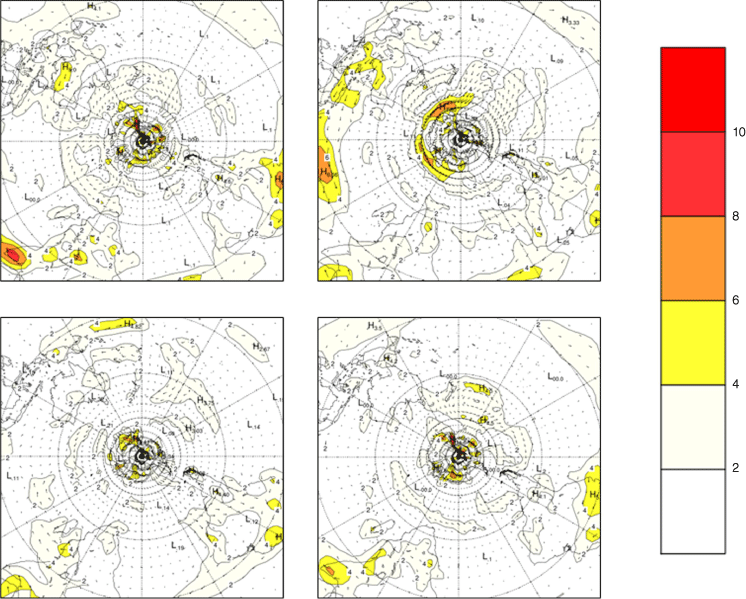
Fig. 12 and 13 show 2019–20 low-level (850 hPa) and upper-level (200 hPa) wind anomalies respectively (winds computed from ACCESS and anomalies with respect to the 22-year 1979–2000 NCEP climatology). Isotach contours are at an interval of 2 m s−1 (850 hPa) and 5 m s−1 (200 hPa).
The 850-hPa vector wind anomalies (m s−1) for July to September 2019 (top left), October to December 2019 (top right), January to March 2020 (bottom left) and April to June 2020 (bottom right).
The 200-hPa vector wind anomalies (m s−1) for July to September 2019 (top left), October to December 2019 (top right), January to March 2020 (bottom left) and April to June 2020 (bottom right).
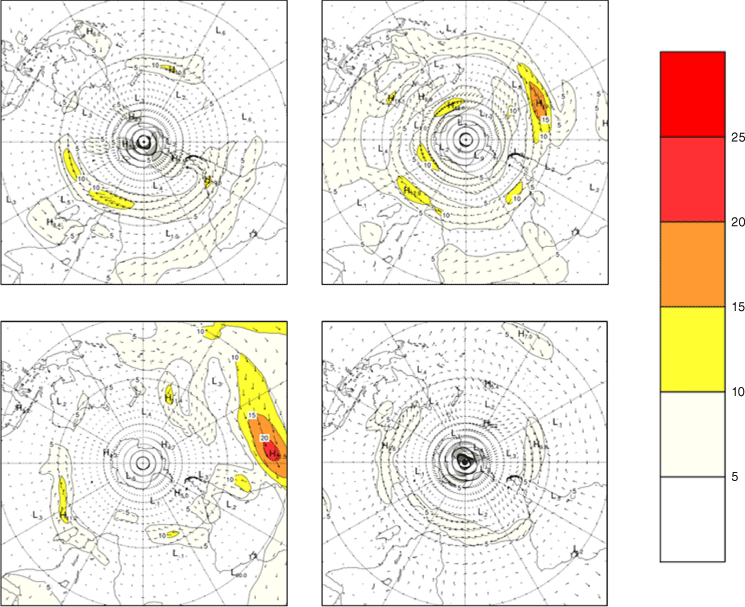
The strongest 850-hPa wind anomalies were mostly in the October–December period. During this period, there were strong westerly anomalies over and south of southern Australia, consistent with the negative SAM phase, and easterly anomalies further north. Easterly anomalies had also been evident over northern Australia between July and September. There were also strong easterly anomalies (reaching 6 m s−1) in the central and eastern Indian Ocean between 70 and 100°E, during the peak of the positive IOD phase. Anomalies at this level were fairly weak in most tropical and subtropical areas in the first half of 2020, although there were some anticyclonic anomalies associated with areas of above-average surface pressure in the South Pacific. One noteworthy anomaly was a strong westerly anomaly in the April–June 2020 period over equatorial eastern Africa, aligning with the active wet season at that time in the region (Section 11).
The most consistent feature of the 200-hPa wind anomalies was a high frequency of westerly anomalies between latitudes 30 and 45°S, marking a southward extension of the climatological maximum of westerly winds at this level. These were most prominent in the central South Pacific in the October–December quarter, which also saw a marked southward displacement of the climatological peak winds in the Australian sector, with easterly anomalies over the continent. In early 2020, when mid-latitude anomalies were weaker than in other seasons, there was an area of very strong westerly anomalies (exceeding 20 m s−1) in the equatorial central and eastern Pacific, a region where 200-hPa winds are typically fairly weak.
9.Greenhouse gases and ozone
Greenhouse gas concentrations reached new record levels during 2019–20. Globally averaged annual mean concentrations of the three major greenhouse gases, carbon dioxide (CO2), methane (CH4) and nitrous oxide (N2O), all reached record high levels in 2020 (World Meteorological Organization 2021c). The global mean CO2 concentration in 2020 was 413.2 ± 0.2 parts per million (ppm), 149% of estimated pre-industrial (pre-1750) levels and 2.5 ppm higher than the previous year. This growth rate was only slightly lower than that observed from 2018 to 2019 and was above the mean growth rate of the last decade, despite a 5.6% fall in CO2 emissions from fossil fuels as a result of the Covid-19 pandemic. Global mean methane concentrations in 2020 were 1889 ± 2 parts per billion (ppb), 262% of estimated pre-industrial levels and 11 ppb higher than the previous year, whereas global mean N2O concentrations were 333.2 ± 0.1 ppb, 123% of estimated pre-industrial levels and 1.2 ppb higher than the previous year. The annual growth rate was above the decadal mean for both methane and N2O.
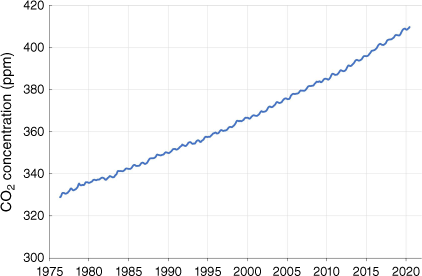
In the southern hemisphere specifically, long-term greenhouse gas measurements are made at Kennaook–Cape Grim in north-west Tasmania. Absolute greenhouse gas concentrations at this location are generally slightly lower than the global mean but overall trends and growth rates are similar. The seasonal cycle at Kennaook–Cape Grim also differs from northern hemisphere locations; compared with Mauna Loa (Hawaii), the seasonal cycle of CO2 concentrations is weaker and differently timed. Whereas at Mauna Loa, CO2 concentrations typically peak in May, at Kennaook–Cape Grim, they generally reach a local maximum in October and November, and a weak local minimum in January and February. In 2019–20, CO2 concentrations (Fig. 14) ranged from 408.0 ppm in July 2019 to 409.6 ppm in June 2020. Methane concentrations, which show a more pronounced seasonal cycle, ranged from 1833 ppm in September 2019 to 1803 ppb in February 2020, whereas N2O concentrations ranged from 330.7 ppb in July 2019 to 331.7 ppb in June 2020.
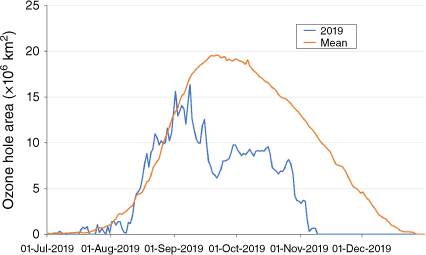
The spring 2019 Antarctic ozone hole was the weakest on most metrics since the early 1980s (Krummel et al. 2020; Klekociuk et al. 2021), with 2002 (another year with a SSW) the only comparable year this century. Although the ozone hole has shown slight weakening over the last 20 years, the abnormally small 2019 hole was a consequence of the dramatic sudden stratospheric warming (Section 8.3) in late August and early September, and the weakening and displacement of the stratospheric polar vortex. The ozone hole area (the area with total ozone column less than 220 Dobson units) was near or slightly below average for the date until the end of August, but further development largely stopped at this point (Fig. 15). The ozone hole area peaked at 16.4 × 10⁶ km2 on 8 September, ~30% below the 2005–18 average peak area, and ~3 weeks before the average peak date.
Area of the 2019 Antarctic ozone hole (blue) compared with the 1979–23 mean (orange). Data from NASA Goddard Space Flight Center (https://ozonewatch.gsfc.nasa.gov/).
10.Australian region
This section includes an overview of the rainfall, temperatures and fire weather conditions for 2019–20.
10.1. Rainfall
The overall 12-month period from July 2019 to June 2020 was substantially drier than average over most of Australia (Table 1, Fig. 16). This combined an exceptionally dry second half of 2019, during the period when the IOD was strongly positive, with near-average conditions in the first half of 2020. The 12-month period as a whole was the third-driest on record for Australia, with national area-averaged rainfall of 346.5 mm, 26% below the 1961–90 average. Only 1901–02 (298.2 mm) and 1951–52 (325.5 mm) were drier, although 2019–20 was only slightly drier than 2018–19 (346.9 mm). All states and territories were drier than average, with South Australia (fourth driest on record) 44% below the 1961–90 average. The only substantial areas with significantly above-average rainfall were western Tasmania and an area of southern Victoria east of Melbourne. There were large areas with rainfall below the 10th percentile for the 12-month period, including most of South Australia from Adelaide northwards and westwards, much of the southern half of Western Australia, the Top End of the Northern Territory, much of the south-east quarter of Queensland, and the far south-east of New South Wales and far eastern Victoria.
| Region | July 2019–June 2020 | July–December 2019 | January–June 2020 | |||||||
|---|---|---|---|---|---|---|---|---|---|---|
| Total (mm) | Percentage above or below average | Rank | Total (mm) | Percentage above or below average | Rank | Total (mm) | Percentage above or below average | Rank | ||
| Australia | 346.5 | −26 | 3 | 63.4 | −61 | 1 | 283.1 | −6 | 59 | |
| Queensland | 443.1 | −29 | 11 | 57.0 | −71 | 1 | 386.1 | −9 | 51 | |
| New South Wales | 421.9 | −24 | 24 | 82.6 | −68 | 1 | 339.3 | +13 | 99 | |
| Victoria | 583.2 | −12 | 35 | 238.9 | −36 | 11 | 344.3 | +20 | 98 | |
| Tasmania | 1438.2 | +6 | 81 | 764.0 | 0 | 68 | 674.2 | +13 | 87 | |
| South Australia | 125.5 | −44 | 4 | 34.0 | −68 | 1 | 91.4 | −22 | 47 | |
| Western Australia | 269.3 | −21 | 22 | 49.4 | −53 | 1 | 220.0 | −7 | 55 | |
| Northern Territory | 391.2 | −28 | 18= | 43.9 | −71 | 1 | 347.4 | −12 | 56 | |
The baseline used for averages is 1961−90. Ranks are for the period from 1900 to 2019−20, with 1 being the lowest and 120 or 121 (depending on period) the highest.
Rainfall deciles for July 2019 to June 2020 (left), July to December 2019 (centre) and January to June 2020 (right); decile ranges based on grid-point data with respect to all available data 1900–2020.

The second half of 2019 was exceptionally dry. It was the driest July–December period on record for Australia, with area-averaged rainfall of 63.4 mm, 61% below the 1961–90 average. All states and territories other than Victoria and Tasmania also had their driest July–December on record, with Queensland, New South Wales, South Australia and the Northern Territory all between 65 and 75% below the 1961–90 average. Rainfall was below average almost everywhere in mainland Australia apart from locally in southern Victoria, although it was well above average in western Tasmania, associated with the occurrence of negative SAM phases. Many areas in the eastern two-thirds of Australia had their driest July–December on record, especially in the northern half of New South Wales and southern inland Queensland. Most areas west of the ranges in New South Wales and away from the east coast in Queensland had less than 100 mm for the period, and a substantial area of the eastern interior received less than 10 mm. Every month of the period was significantly drier than average, with all 6 months ranking in the 12 driest on record for Australia for their respective month, but November and December were particularly extreme, both ranking as the driest on record nationally.
By contrast, rainfall in the first half of 2020 was generally close to average. Nationally, rainfall was 6% below the 1961–90 average, with all states and territories being within 25% of average and none ranking in the top or bottom 20 years. Rainfall was above average in most of New South Wales and Victoria, although there was a remaining dry area in far south-eastern New South Wales and eastern Victoria. Seasonal rainfall was above the 90th percentile in central Victoria, and parts of inland New South Wales. Outside these two states, rainfall for the 6-month period was generally fairly close to average, although somewhat below average in western parts of Western Australia. January to March was wet in most eastern areas south of the tropics, including a major rain event in February that produced some flooding in the Sydney area; April to June was dry along the New South Wales coast and in southern Queensland, but wet in most of Victoria and in New South Wales west of the ranges. April to June was also dry in most of the southern half of Western Australia.
The heaviest daily rainfall in Australia during 2019–20 was 562.0 mm on 11 January 2020 at Dum In Mirrie, south-west of Darwin, a record daily rainfall for the Northern Territory. This was associated with a tropical low that subsequently became Tropical Cyclone Claudia.
10.2. Rainfall deficiencies
The very dry conditions in the second half of 2019 resulted in extensive rainfall deficiencies at a range of timescales. These then progressively eased through the first half of 2020 as rainfall returned to near- to above-average levels in many areas. Nationally, the proportion of Australia experiencing serious rainfall deficiencies (below the 10th percentile) at the 12-month timescale (Fig. 17) increased from 34.3% at the end of June 2019 to 69.2% in December. It then fell to 20.6% by April 2020, before increasing to 27.6% at the end of June 2020 as rainfall deficiencies expanded in southern Western Australia with the dry start to the 2020 cool season there. The area of severe 12-month rainfall deficiencies (below the 5th percentile) increased from 19.3% of Australia at the end of June 2019 to 55.2% in December, before decreasing to 9.8% by April 2020.
Rainfall deficiencies for the 12 months ending June 2019 (left), December 2019 (centre) and June 2020 (right).

Rainfall deficiencies were even more widespread at shorter timescales, with 81.6% of Australia showing serious deficiencies for the 6 months to December 2019. At the state level as of December 2019, 97.1% of New South Wales had serious 6-month deficiencies, whereas 94.7% of South Australia showed serious deficiencies at the 6-month timescale, and 94.0% at the 12-month timescales.
10.3. Temperature
Overall, the period from July 2019 to June 2020 was the equal third-warmest such period on record for Australia (Table 2), with temperatures 1.22°C above the 1961–90 mean, 0.17°C below the record set in 2015−16. Mean maximum temperatures were 1.66°C above the 1961–90 mean (second highest) and minimum temperature 0.77°C above the 1961–90 mean (eighth highest). Mean temperatures were above the 1961–90 average almost everywhere except for some small areas in eastern South Australia and south-western Victoria (Fig. 18). Much of interior Western Australia had mean temperatures 1.5–2.5°C above average; the state as a whole was 1.56°C above average, 0.29°C above the previous record from 2015 to 2016. It was the warmest July to June period on record for most of Western Australia south of 20°S except for the immediate coastal fringe, as well as locally in inland parts of south-east Queensland.
| Region | Maximum temperature | Minimum temperature | Mean temperature | ||||
|---|---|---|---|---|---|---|---|
| Anomaly (°C) | Rank | Anomaly (°C) | Rank | Anomaly (°C) | Rank | ||
| Australia | +1.66 | 2 | +0.77 | 8 | +1.22 | 3 A | |
| Queensland | +1.55 | 3 | +1.03 | 12 | +1.30 | 6 | |
| New South Wales | +1.38 | 8 | +0.83 | 13 | +1.11 | 9 | |
| Victoria | +0.45 | 25 | +0.23 | 29= | +0.34 | 27 A | |
| Tasmania | +0.03 | 42= | +0.15 | 29 | +0.09 | 35 | |
| South Australia | +1.47 | 8 | +0.21 | 37= | +0.85 | 11 A | |
| Western Australia | +2.19 | 1 | +0.93 | 2 | +1.56 | 1 | |
| Northern Territory | +1.43 | 2 | +0.64 | 19 | +1.04 | 4 | |
Mean temperature anomalies (1961−90 climatology) for July 2019 to June 2020 (left), July to December 2019 (centre) and January to June 2020 (right). Data from version 2.4 of the ACORN-SAT dataset.

As with rainfall, there was a contrast between the second half of 2019 and the first half of 2020. July to December 2019 was the warmest such period on record, with mean temperatures 1.59°C above average. Daytime maximum temperatures were particularly extreme, 2.38°C above average and 0.39°C above the previous record, set in 2013. Maximum temperatures for the July to December 2019 period were the highest on record for New South Wales, the Northern Territory, South Australia and Western Australia, and Western Australia also had its highest mean temperatures on record, 0.53°C above the previous record from 2015.
January to June 2020 was also significantly warmer than average, but anomalies were much weaker than they had been in the preceding 6 months, with a national mean temperature anomaly of +0.84°C. Much of the northern half of Australia remained warm during this period, with temperatures widely 1–2°C above the 1961–90 average, but temperatures were below average over a broad area of the south encompassing much of South Australia and Victoria, and parts of western New South Wales. The large positive diurnal temperature range anomalies of late 2019 also reverted to near-average in early 2020 as rainfall returned to near-average; the mean national diurnal temperature range was 1.57°C above average for July to December 2019, but only 0.21°C above average for January to June 2020.
The most extreme individual month was December 2019. National mean temperatures for the month were 3.20°C above the 1961–90 average and more than 1°C above the previous December record. This was also the largest monthly anomaly observed for any month, surpassing October 2015 (+3.03°C). It was the hottest December on record for all states and territories except Victoria and Tasmania. There was a particularly extreme and extensive heatwave in the second half of the month. Australia’s five hottest area-averaged days on record for mean temperature, and seven hottest for maximum temperature, all occurred between 17 and 29 December. On 18 December, the nationally averaged maximum temperature was 41.88, 1.58°C above the record prior to December 2019. In total, there were 11 days during the month when the nationally averaged maximum temperature reached 40°C; there had only been 11 previously in total between 1910 and November 2019, 7 of which occurred during the summer of 2018–19 (Bureau of Meteorology 2020). The highest temperature during this period, and during 2019–20 as a whole, was 49.9°C at Nullarbor (SA), an Australian record for December and the highest in any month since 1998, and Eucla (WA) reached 49.8°C on the same day. Keith (SA) reached 49.2°C on 20 December, the highest ever in Australia at such a high latitude (36.1°S). Further extreme heat occurred in early January, including 48.9°C at Penrith on 4 January, a record for metropolitan Sydney (and for any site east of the ranges in New South Wales), and 44.0°C at Canberra on the same day, its highest on record. Although temperatures moderated in February, it was still Australia’s second-hottest summer on record behind 2018–19.
Western Australia had its warmest spring on record. Autumn 2020 was quite cool in south-eastern Australia, particularly by day; most of inland New South Wales had mean autumn maximum temperatures below the 10th percentile, and the statewide mean maximum for the season was the lowest since 1995. May was the only 1 of the 12 months during the period with national temperatures below the 1961–90 average.
The lowest temperature in Australia during 2019–20 was −12.3°C at Glen Innes Airport on 19 July 2019, a rare instance of the year’s lowest temperature occurring outside the Australian Alps.
10.4. Fire weather
Summer 2019–20 is now widely referred to as ‘Black Summer’ owing to the unprecedented extent and severity of fire activity. Major fire activity in eastern Australia began in early September and continued until February, particularly affecting eastern parts of New South Wales, Victoria and southern Queensland (Royal Commission into National Natural Disaster Arrangements 2020). There were also major fires in South Australia around Adelaide and on Kangaroo Island. In addition to direct losses of life, property and biodiversity, there was also extensive and long-lived smoke pollution in many areas, which had major health impacts, with over 400 excess deaths attributed to smoke exposure (Borchers Arriagada et al. 2020).
A metric of the incidence of significant fire weather is the aggregated Forest Fire Danger Index (FFDI) (McArthur 1967), which is an indicator of fire danger in forested areas, and combines temperature, humidity, wind speed and antecedent dryness information. It is particularly relevant in forested areas of eastern and south-western Australia. It is less applicable to grassland areas, particularly in arid and semi-arid regions of interior Australia where the occurrence of fire is heavily influenced by fuel availability.
Monthly aggregated FFDI was well above average over most of Australia from September onwards (Fig. 19). In eastern Australia, September values were the highest on record over much of the north-east quarter of New South Wales away from the coast, along with parts of eastern Queensland. Although easing slightly in October, record high monthly FFDI values expanded again in November, covering most of the south-east quarter of Queensland and most areas on and east of the ranges in New South Wales. There was a dramatic expansion in December, covering almost all of New South Wales, Queensland except for the far north, eastern and northern Victoria, and north-east Tasmania. Over the September to December period as a whole, almost all of the area that experienced major fires during the summer had record high FFDI values (the only major exception being parts of the Australian Alps).
Monthly Forest Fire Danger Index (FFDI) deciles (1950−2019 climatology) for each of the months from September 2019 to February 2020.
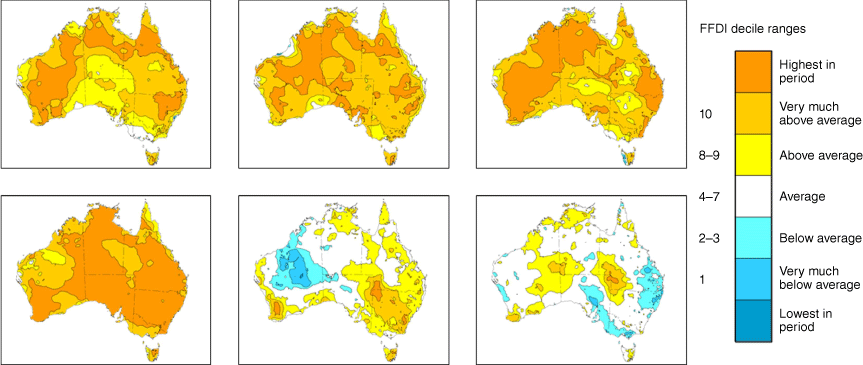
Fire weather conditions generally moderated in January, particularly in Queensland, northern New South Wales and Victoria, although there were still areas of record high monthly FFDI in the southern ranges of New South Wales. By February, monthly FFDI had mostly returned to near- to below-average in eastern Australia, influenced by heavy rain during the middle of the month in many areas.
11.Southern hemisphere
The period 2019–20 was significantly warmer than the long-term average over much of the southern hemisphere. In the NOAA GlobalTemp data set (Vose et al. 2021), southern hemisphere temperatures for the period from July 2019 to June 2020 were 0.72°C above the 1901–2000 average, the second-highest value on record after +0.73°C in 2015–16. Land temperatures for the period (1.10°C above the 1901–2000 average) were the highest on record, surpassing the previous record of +1.03°C set in 2018–19, and SSTs (0.63°C above the 1901–2000 average) were equal third highest on record. July 2019 was the only month during the period that ranked as the warmest on record for the southern hemisphere, but all months except September ranked in the top five.
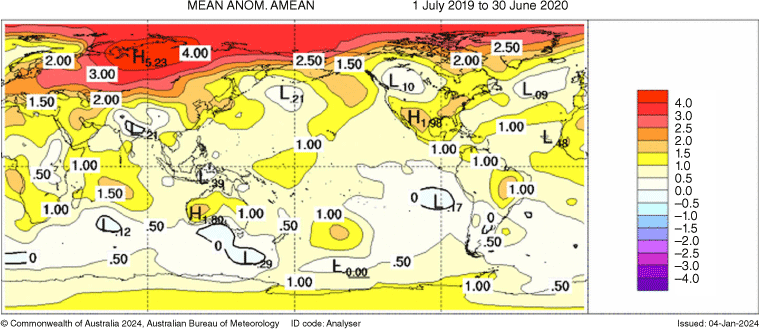
Temperatures were above the 1961–90 average almost throughout the southern hemisphere (Fig. 20). They were more than 1°C above average in numerous areas, including most of southern Africa, the western Indian Ocean north of 20°S, much of the Australian continent away from the southern coast, an area of the South Pacific east of New Zealand, and eastern Brazil. The most significant area with temperatures below the 1961–90 average was the Southern Ocean south of Australia, and many other ocean areas south of 40°S were fairly close to average. The only significant land area with below-average temperatures was a part of eastern Argentina south of Buenos Aires.
Temperature anomalies (1961−90 climatology, °C) for the period from July 2019 to June 2020. Data from the Had-CRUTv5 data set (Morice et al. 2021).
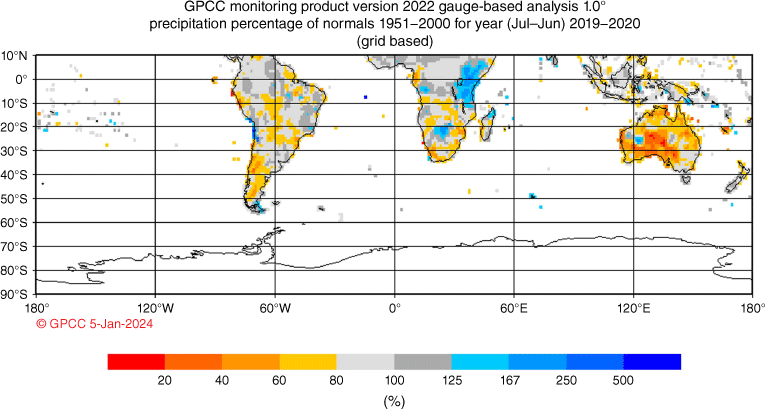
Precipitation was below average over many southern hemisphere land areas (Fig. 21). In addition to Australia, the period was substantially drier than average over many parts of South America, particularly interior Brazil and areas of Chile and Argentina south of 30°S, most of mainland Africa south of 10°S except for Botswana and Zimbabwe, and the North Island of New Zealand. The most prominent area that was wetter than average was equatorial east Africa. Wet conditions in this region are characteristic of positive phases of the Indian Ocean Dipole.
Precipitation (percentage of 1951−2000 mean) for the 12 months from July 2019 to June 2020. Source: Global Precipitation Climatology Centre (GPCC) (Becker et al. 2013).
Summer and autumn were very dry in much of the North Island of New Zealand, particularly its northern half (National Institute of Water and Atmospheric Research 2020a, 2020b). Seasonal records were set in both seasons at stations in the Auckland area, and significant drought developed, with water restrictions imposed in Auckland. The dry conditions extended north to Norfolk Island, which had its driest summer on record. Drought conditions eased with significant rain in June. By contrast, there was major flooding in the western and southern South Island in early February, with Milford Sound receiving 1104 mm in 4 days from 1 to 4 February. November was the warmest on record for New Zealand (1.6°C above the 1981–2010 average) and July the second-warmest. Temperatures in remaining months were generally close to average, but there were some significant heatwaves in summer, with all-time records set at locations including Gisborne (38.2°C on 31 January) and Whangarei (34.1°C on 4 February).
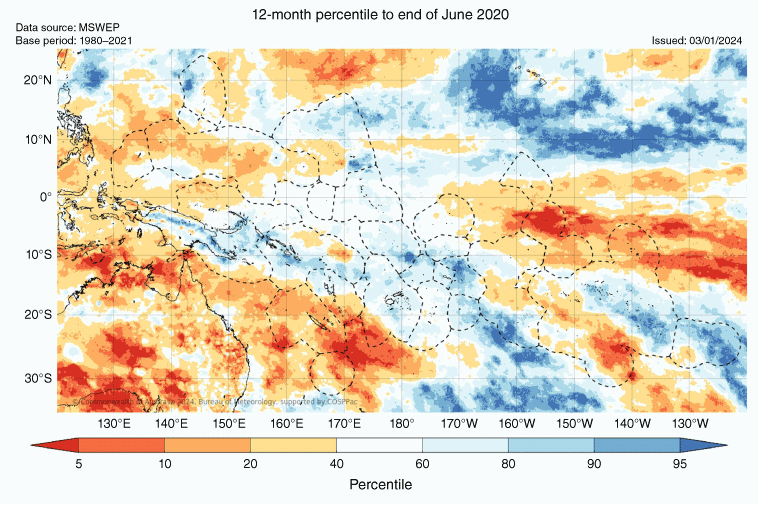
In the Pacific (Fig. 22), rainfall was generally above average in an area extending from Papua New Guinea and the Solomon Islands to Fiji and Samoa, and below average in an area covering New Caledonia and southern Vanuatu. In both cases, anomalies were stronger from July to December 2019 than in the following 6 months. New Caledonia was particularly dry in the October–December quarter, whereas in Papua New Guinea and the Solomon Islands, the most prominent wet anomalies were in the July–September period. By the April–June quarter, a La Niña-like rainfall pattern was beginning to develop in equatorial areas, with below-average rainfall in most areas north of 10°S and east of 150°E.
Rainfall percentiles for the Pacific region for the 12 months from July 2019 to June 2020, derived from the MSWEP data set. Dotted lines are national economic zone boundaries (border equivalents), but have no direct scientific significance.
Indonesia was very dry in the second half of 2019, with nationally averaged rainfall for 2019 19% below average, the fourth-lowest on record, but rainfall was generally near to above average in the first half of 2020. Metropolitan Jakarta experienced extreme rainfall and widespread flooding in early January, with Halim Airport (in the south-eastern suburbs) receiving 377 mm in 24 h on 1 January. The Australian Indian Ocean islands were also very dry in late 2019, with Christmas Island only receiving 1.2 mm in spring, by far its driest on record.
Southern Africa was exceptionally warm in the second half of 2019 before conditions reverted to near-average in the first half of 2020. Mean monthly maximum temperatures were 3°C or more above average over large parts of South Africa in each of the months from July to November, and 2019 was the equal warmest year on record for South Africa (1.1°C above the 1981–2010 average). By contrast, consistent with the strongly positive IOD, both the October–December 2019 and March–May 2020 rainy seasons were extremely wet in equatorial east Africa, and there were also unseasonable rains in normally dry parts of this region in January and February. This led to widespread flooding with significant loss of life, and also contributed to a major locust outbreak. Western Indian Ocean islands were very warm in late 2019; October, November and December were all the warmest on record for La Réunion, with record high monthly mean temperatures extending to Mauritius and the Seychelles in December. Temperatures in the Seychelles remained at or near record high levels through the first half of 2020, but further south, temperatures returned to near-average levels.
Drought had significant impacts in many parts of South America (Gomes et al. 2021). Much of southern South America was very dry in 2019, which was the driest year on record for a number of locations, including Valparaiso and Curicó in Chile, and Bahia Blanca in Argentina. Santiago had its third-driest year on record. The interior of Brazil was also dry in the second half of 2019, and fire activity in the Amazon was well above that of the preceding 4 years. A weak 2019–20 summer wet season in the Pantanal and upper Parana basin also set the scene for fire activity there later in 2020. There was only slight moderation in drought conditions in southern South America in the first half of 2020, and it was a dry autumn in southern Brazil and Paraguay, but heavy rains in north-east Brazil in the March–May period eased long-term drought there. Coastal Peru experienced significant rainfall and flooding in the early months of 2020. Autumn was very warm in southern South America, but otherwise temperatures in the region were close to average. Abnormal cold affected the far south in late June, including an all-time record low (−13.1°C) at Puerto Natales (Chile) on 28 June.
From November onwards, temperatures were above average over much of the Antarctic continent. In January–March, the warmth was focused over the Antarctic Peninsula. This included a record high temperature for Antarctica of 18.3°C at Esperanza, at the northern tip of the peninsula, on 6 February (Francelino et al. 2021), associated with föhn effects during a landfalling atmospheric river. In November–December 2019 and April–June 2020, the warmth was spread more broadly over the continent. Macquarie Island had its eighth successive year of above-average precipitation with a total of 1148.6 mm from July 2019 to June 2020 (11% above the 1981–2010 average), the seventh highest on record.
Data availability
Data sources for this manuscript are described in Section 2. Data are generally available from the institutions described in that section.
Conflicts of interest
B. Trewin is an editor for the Journal of Southern Hemisphere Earth Systems Science but did not at any stage have editor-level access to this manuscript while in peer review, as is the standard practice when handling manuscripts submitted by an editor to this journal. The journal encourages its editors to publish in the journal and they are kept totally separate from the decision-making processes for their manuscripts. The author has no further conflicts of interest to declare.
Acknowledgements
Comments on the manuscript from Nadine d’Argent and Jannatun Nahar were greatly appreciated.
References
Ashok K, Guan Z, Yamagata T (2003) Influence of the Indian Ocean Dipole on the Australian winter rainfall. Geophysical Research Letters 30, 1821.
| Crossref | Google Scholar |
Becker A, Finger P, Meyer-Christoffer A, Rudolf B, Schamm K, Schnieder U, Ziese M (2013) A description of the global land-surface precipitation data products of the Global Precipitation Climatology Centre with sample applications including centennial (trend) analysis from 1901−present. Earth Systems Science Data 5, 71-99.
| Crossref | Google Scholar |
Benger N, Chapman B (2023) Seasonal climate summary for the southern hemisphere (summer 2019−20): a summer of extremes. Journal of Southern Hemisphere Earth Systems Science 73, 83-101.
| Crossref | Google Scholar |
Blunden J, Arndt DS (2020) State of the Climate in 2019. Bulletin of the American Meteorological Society 101, S1-S429.
| Crossref | Google Scholar |
Blunden J, Boyer T (2021) State of the Climate in 2020. Bulletin of the American Meteorological Society 102, S1-S475.
| Crossref | Google Scholar |
Borchers Arriagada N, Palmer AJ, Bowman DM, Morgan GG, Jalaludin BB, Johnston FH (2020) Unprecedented smoke-related health burden associated with the 2019−20 bushfires in eastern Australia. Medical Journal of Australia 213, 282-283.
| Crossref | Google Scholar | PubMed |
Bureau of Meteorology (2010) Operational implementation of the ACCESS Numerical Weather Prediction systems, NMOC Operations Bulletin 83. (The Bureau) Available at http://www.bom.gov.au/nwp/doc/bulletins/apob83.pdf
Bureau of Meteorology (2020) Special Climate Statement 73 – extreme heat and fire weather in December 2019 and January 2020. (The Bureau) Available at http://www.bom.gov.au/climate/current/statements/scs73.pdf
Donald A, Heinke H, Power B, Wheeler M, Ribbe J (2004) Forecasting with the Madden–Julian Oscillation and the applications for risk management. In ‘Proceedings of the 4th International Crop Science Congress: New Directions for a Diverse Planet’, 26 September–1 October 2004, Brisbane, Qld, Australia. (The Crop Science Society of America) Available at https://research.usq.edu.au/download/78994ab5c3379815a1b696342e0cee4b757290e8caaf7e059263d89e1fa64eb6/191163/Donald_Mienke_Power_Wheeler_Ribbe_Forecasting_with_the_Madden.pdf
Evans A, Jones D, Smalley R, Lellyett S (2020) An enhanced gridded rainfall analysis scheme for Australia. Bureau Research Report 41. June 2020. (The Bureau of Meteorology: Melbourne, Vic., Australia) Available at http://www.bom.gov.au/research/publications/researchreports/BRR-041.pdf
Francelino MR, Schaefer C, Skansi M, et al. (2021) WMO evaluation of two extreme high temperatures occurring in February 2020 for the Antarctic Peninsula region. Bulletin of the American Meteorological Society 102, E2053-E2061.
| Crossref | Google Scholar |
Gomes MS, de Albuquerque Cavalcanti IF, Müller GV (2021) 2019/2020 drought impacts on South America and atmospheric and oceanic influences. Weather and Climate Extremes 34, 100404.
| Crossref | Google Scholar |
Hague B (2021) Seasonal climate summary for Australian and the southern hemisphere (summer 2018−19): extreme heat and flooding prominent. Journal of Southern Hemisphere Earth Systems Science 71, 147-158.
| Crossref | Google Scholar |
Hendon HH, Thompson DWJ, Wheeler MC (2007) Australian rainfall and surface temperature variations associated with the Southern Hemisphere Annular Mode. Journal of Climate 20, 2452-2467.
| Crossref | Google Scholar |
Kanamitsu M, Ebisuzaki W, Woollen J, Yang S-K, Hnilo JJ, Fiorino M, Potter GL (2002) NCEP-DOE AMIP-II reanalysis. Bulletin of the American Meteorological Society 83, 1631-1644.
| Crossref | Google Scholar |
Klekociuk AR, Tully MB, Krummel PB, et al. (2021) The Antarctic ozone hole during 2018 and 2019. Journal of Southern Hemisphere Earth System Science 71, 66-91.
| Crossref | Google Scholar |
Krummel P, Fraser P, Derek N (2020) The 2019 Antarctic ozone hole summary: final report. Report prepared for the Australian Government Department of Agriculture, Water and the Environment. (CSIRO, Australia) Available at https://www.dcceew.gov.au/sites/default/files/env/resources/bde22641-eeb6-4502-9c54-8239c2c64c0f/files/2019-aoh-report-final-summary.pdf
Kuleshov Y, Qi L, Fawcett R, Jones D (2009) Improving preparedness to natural hazards: tropical cyclone seasonal prediction for the Southern Hemisphere. Advances in Geosciences 12, 127-143.
| Crossref | Google Scholar |
Levitus S, Antonov JI, Boyer TP, et al. (2012) World ocean heat content and thermosteric sea level change (0−2000 m), 1955−2010. Geophysical Research Letters 39, L10603.
| Crossref | Google Scholar |
Lim E-P, Hendon HH, Butler AH, et al. (2021) The 2019 Southern Hemisphere stratospheric polar vortex weakening and its impacts. Bulletin of the American Meteorological Society 102, E1150-E1171.
| Crossref | Google Scholar |
Madden RA, Julian PR (1971) Detection of a 40–50 day oscillation in the zonal wind in the tropical Pacific. Journal of the Atmospheric Sciences 28, 702-708.
| Crossref | Google Scholar |
Madden RA, Julian PR (1972) Description of global-scale circulation cells in the tropics with a 40–50 day period. Journal of the Atmospheric Sciences 29, 1109-1123.
| Crossref | Google Scholar |
Madden RA, Julian PR (1994) Observations of the 40–50 day tropical oscillation: a review. Monthly Weather Review 122, 814-837.
| Crossref | Google Scholar |
Magee AD, Schreck C (2021) Tropical cyclones: south Indian Ocean basin (in ‘State of the Climate in 2020’). Bulletin of the American Meteorological Society 102, S244-S247.
| Crossref | Google Scholar |
Morice CP, Kennedy JJ, Rayner NA, et al. (2021) An updated assessment of near-surface temperature change from 1850: the HadCRUT5 data set. Journal of Geophysical Research: Atmospheres 126, e2019JD032361.
| Crossref | Google Scholar |
National Institute of Water and Atmospheric Research (2020a) Summer 2019−20: 04 March 2020. Flooding in the south; drought in the north. (NIWA) Available at https://niwa.co.nz/climate-and-weather/seasonal/summer-2019-20
National Institute of Water and Atmospheric Research (2020b) Autumn 2020: 04 June 2020. A dry autumn for most areas of the country. (NIWA) Available at https://niwa.co.nz/climate-and-weather/seasonal/autumn-2020
Puri K, Dietachmeyer G, Steinle P, et al. (2013) Implementation of the initial ACCESS numerical weather prediction system. Australian Meteorological and Oceanographic Journal 63, 265-284.
| Crossref | Google Scholar |
Reid P, Stammerjohn S, Massom RA, Barreira S, Scambos T, Lieser JL (2020) Sea ice extent, concentration and seasonality (in ‘State of the Climate in 2019’). Bulletin of the American Meteorological Society 101, S304-S306.
| Crossref | Google Scholar |
Reid P, Stammerjohn S, Massom RA, Barreira S, Scambos T, Lieser JL (2021) Sea ice extent, concentration and seasonality (in ‘State of the Climate in 2020’). Bulletin of the American Meteorological Society 102, S336-S338.
| Crossref | Google Scholar |
Royal Commission into National Natural Disaster Arrangements (2020) Report of the Royal Commission into National Natural Disaster Arrangements. (Commonwealth of Australia: Canberra, ACT, Australia) Available at https://www.royalcommission.gov.au/natural-disasters/report
Saji NH, Yamagata T (2003) Possible impacts of Indian Ocean dipole mode events on global climate. Climate Research 25, 151-169.
| Crossref | Google Scholar |
Stuecker MF, Timmermann A, Jin F-F, Chikamoto Y, Zhang W, Wittenburg AT, Widiasih E, Zhao S (2017) Revisiting ENSO/Indian Ocean Dipole phase relationships. Geophysical Research Letters 44, 2481-2492.
| Crossref | Google Scholar |
Trewin B (2020) Seasonal climate summary for the southern hemisphere (spring 2018): positive Indian Ocean Dipole and Australia’s driest September on record. Journal of Southern Hemisphere Earth Systems Science 70, 373-392.
| Crossref | Google Scholar |
Trewin BC, Bond S (2021) Tropical cyclones: Australian basin (in ‘State of the Climate in 2020’). Bulletin of the American Meteorological Society 102, S247-S248.
| Crossref | Google Scholar |
Trewin B, Braganza K, Fawcett R, Grainger S, Jovanovic B, Jones D, Martin D, Smalley R, Webb V (2020) An updated long-term homogenized daily temperature data set for Australia. Geoscience Data Journal 7, 149-169.
| Crossref | Google Scholar |
Troup A (1965) The ‘Southern Oscillation’. Quarterly Journal of the Royal Meteorological Society 91, 490-506.
| Crossref | Google Scholar |
Vose RS, Huang B, Yin X, Arndt D, Easterling DR, Lawrimore JH, Menne MJ, Sanchez-Lugo A, Zhang HM (2021) Implementing full spatial coverage in NOAA’s global temperature analysis. Geophysical Research Letters 48, e2020GL090873.
| Crossref | Google Scholar |
Wang G, Hendon HH (2007) Sensitivity of Australian rainfall to inter-El Niño variations. Journal of Climate 20, 4211-4226.
| Crossref | Google Scholar |
Wheeler MC, Hendon HH (2004) An all-season real-time multivariate MJO Index: development of an index for monitoring and prediction. Monthly Weather Review 132, 1917-1932.
| Crossref | Google Scholar |
Woolley JM, Magee A, Lorrey AM, Diamond HJ (2021) Tropical cyclones: southwest Pacific basin (in ‘State of the Climate in 2020’). Bulletin of the American Meteorological Society 102, S248-S251.
| Crossref | Google Scholar |
World Meteorological Organization (2020) WMO Statement on the State of the Global Climate in 2019. WMO Number 1248. (WMO: Geneva, Switzerland) Available at https://library.wmo.int/idurl/4/56228
World Meteorological Organization (2021a) State of the Global Climate 2020. WMO Number 1264. (WMO: Geneva, Switzerland) Available at https://library.wmo.int/idurl/4/56247
World Meteorological Organization (2021b) State of the Climate in South-West Pacific 2020. WMO Number 1276. (WMO: Geneva, Switzerland) Available at https://library.wmo.int/idurl/4/57732
World Meteorological Organization (2021c) WMO Greenhouse Gas Bulletin 17. Number 17 – 25 October 2021. The state of greenhouse gases in the atmosphere based on global observations through 2020. (WMO: Geneva, Switzerland) Available at https://library.wmo.int/idurl/4/58705
Yang Y, Xie S-P, Wu L, Kosaka Y, Lau N-C, Vecchi GA (2015) Seasonality and predictability of the Indian Ocean Dipole Mode: ENSO forcing and internal variability. Journal of Climate 28, 8021-8036.
| Crossref | Google Scholar |
Zhang L, Ren X, Cai W, Li X, Wu L (2024) Weakened western Indian Ocean dominance on Antarctic sea ice variability in a changing climate. Nature Communications 15, 3261.
| Crossref | Google Scholar | PubMed |
Footnotes
4 The Troup Southern Oscillation Index (Troup 1965) used in this article is 10 times the standardised monthly anomaly of the difference in mean sea level pressure (MSLP) between Tahiti and Darwin. The calculation is based on a 60-year climatology (1933–1992), with records commencing in 1876. The Darwin MSLP is provided by The Bureau of Meteorology, and the Tahiti MSLP is provided by Météo France inter-regional direction for French Polynesia.
5 Sustained negative values of SOI below −7 are often indicative of El Niño episodes while persistently positive values of SOI above +7 are typical of a La Niña episode.
8 http://www.bom.gov.au/climate/enso/#tabs=Indian-Ocean&indian=History&iodPhases=Positive-IOD-phase.
9 Madden Julian Oscillation: http://www.bom.gov.au/climate/mjo/.
10 The south-western Indian Ocean region is west of 90°E, the Australian region between 90 °E and 160 °E, and the south-west Pacific east of 135°E, with the last two partly overlapping. For climatological purposes, the Australian region includes the Indonesian and Papua New Guinea areas of forecast responsibility.
12 SST anomalies from the ERSSTv5 data set, https://www.ncdc.noaa.gov/monitoring-references/faq/anomalies.php.
13 From the NOAA ocean heat content data set (Levitus et al. 2012), https://www.ncei.noaa.gov/products/ocean-heat-salt-sea-level. Values are expressed as a change from the 1955 to 2006 mean.
14 Details on the calculation of the baseline climatology for subsurface temperatures are available at https://www.pmel.noaa.gov/tao/clim/clim-info.html.
15 Data from the National Snow and Ice Data Center, http://www.nsidc.org.
16 For more information on the SAM index from the Climate Prediction Center (NOAA), see http://www.cpc.ncep.noaa.gov/products/precip/CWlink/daily_ao_index/aao/aao.shtml.
17 For more information on The Bureau of Meteorology’s ACCESS model, see http://www.bom.gov.au/nwp/doc/access/NWPData.shtml.

