
Utilisation FINN data version 2.5 for forecasting PM2.5 during forest fire 2019 in Sumatra by using WRF–Chem
Prawira Yudha Kombara A * , Alvin Pratama B , Waluyo Eko Cahyono A , Wiwiek Setyawati A , Emmanuel Adetya A and Hana Listi Fitriana C
A Research Centre for Climate and Atmosphere, National Research and Innovation Agency of Indonesia, Jalan Cisitu Sangkuriang, Bandung, 40135, West Java, Indonesia.
B Department of Atmospheric and Planetary Science, Sumatera Institute of Technology, South Lampung, 35365, Lampung Province, Indonesia.
C Research Centre for Remote Sensing, National Research and Innovation Agency of Indonesia, Jalan Raya Jakarta-Bogor KM 46, Cibinong, 16911, Bogor, Indonesia.
Journal of Southern Hemisphere Earth Systems Science 73(2) 212-218 https://doi.org/10.1071/ES22030
Submitted: 26 September 2022 Accepted: 2 August 2023 Published: 17 August 2023
© 2023 The Author(s) (or their employer(s)). Published by CSIRO Publishing on behalf of the Bureau of Meteorology. This is an open access article distributed under the Creative Commons Attribution-NonCommercial-NoDerivatives 4.0 International License (CC BY-NC-ND)
Abstract
In 2019 there were forest fires in Sumatra, Indonesia, which co-occurred with a strong positive IOD. The forest fire disaster caused the thick smoke containing dusts such as particulate matter with a size of 2.5 μm (PM2.5). In this study, a model simulation was conducted to predict the distribution of PM2.5 using the WRF–Chem model when forest fires in 2019 occurred. The prediction was produced by adding the latest version of fire inventory from NCAR (FINN) input data, version 2.5. The prediction result was verified and compared with ground station data from the Ministry of Environment and Forestry (KLHK) station and NASA’s EOSDIS satellite imagery. There are three ground stations that were used for verification: the Jambi, Palembang and Pekanbaru stations. Of the three stations, the prediction results at the Palembang station are the best in correlation and RMSE value. Spatially, the distribution of PM2.5 from the model result is similar and can follow the pattern of smoke distribution from satellite imagery observations. Even though, generally the WRF–Chem model equipped with the latest FINN data still cannot produce an accurate prediction for the 2019 forest fires event yet in Sumatra region.
Keywords: FINN, forecasting, forest fire, PM2.5, positive IOD 2019, smoke, Sumatra, WRF–Chem.
1Introduction
Some parts of Indonesia, such as Sumatra Island, which has peatlands, often experience forest fires yearly. Some forest fire events co-occur with global atmospheric phenomena such as El Niño or positive Indian Ocean Dipole (IOD). Forest fires are usually very severe and complex to extinguish when occurring together with global atmospheric phenomenon due to arid conditions. In 2019, there were forest fires in Sumatra and several other areas in Indonesia that have peatlands (Wahid 2019). These forest fires co-occurred with positive IOD. Some literature states that the 2019 IOD was a highly positive IOD (Lu and Ren 2020; Ratna et al. 2021). Moreover, similar to El Niño, positive IOD can cause reduced rainfall and drought in several regions of Indonesia (Lestari et al. 2018; Mardiansyah et al. 2018; Ratna et al. 2021).
One of the major impacts of forest fire is the increasing incidence of respiratory system diseases such as Infeksi Saluran Pernapasan Akut (ISPA or acute respiratory infection), which is affected by smoke inhalation. This respiratory system disease is due to smog containing toxic substances such as particulate matter measuring 2.5 μm in diameter (PM2.5), carbon monoxide (CO), sulfur dioxide (SO2), etc. (Mulia et al. 2021). Wind can can cause smoke haze from forest fires to spread to other areas that do not experience forest fires. For example, the spread of smoke haze from forest fires in Indonesia has affected neighbouring countries, Malaysia and Singapore (Editorial Board 2019; Greenpeace Southeast Asia 2019; Reuters Newsdesk 2019; Blunden and Arndt 2020). Therefore, the mitigation and handling of the haze caused by forest fires is an urgent matter.
Several mitigation programs have been taken by government agencies such as Badan Meteorologi, Klimatologi, dan Geofisika (BMKG, the Indonesian Meteorology, Climatology and Geophysical Agency) and Pusat Riset Penginderaan Jauh (the Research Centre for Remote Sensing) of Badan Riset dan Inovasi Nasional (BRIN, the Indonesian National Research and Innovation Agency) by providing maps of hotspots in areas prone to forest fires, such as in Sumatra. The hotspot distribution map is mainly used by local governments and Badan Nasional Penanggulangan Bencana (BPBD, the Indonesian Regional Disaster Management Agency) to prepare anticipatory steps if forest fires occur. In addition, there is also an information system about the spread of smoke haze obtained from satellite observations and BMKG has made a product called Sistem Peringatan Kebakaran Hutan dan Lahan(SPARTAN or ‘Warning System of Forest Fire’) that contains forest fire early warnings and can predict of the distribution of smoke haze. Nevertheless, that product does not yet provide a high-resolution prediction of the distribution of smoke haze (other examples that provide information about forest fires can be found at https://www.bmkg.go.id/satelit/satelit.bmkg?Sat=8&id=2, https://sipongi.menlhk.go.id/ and https://spartan.bmkg.go.id/).
The spread of smog from forest fires is strongly influenced by weather conditions, especially wind direction and speed, and atmospheric stability. The spread of smog from forest fires can be simulated and predicted using numerical models. One example of such a model is the WRF–Chem model. The WRF–Chem model is a model that combines elements of weather and atmospheric chemistry (Grell et al. 2005; Fast et al. 2006; Baklanov et al. 2014; Powers et al. 2017). Several studies about the spread of smoke from forest fires, both simulations and predictions, can be carried out using the WRF–Chem model (Heriyanto and Nuryanto 2014; Heriyanto et al. 2015; Nuryanto 2015; Vara-Vela et al. 2021). Heriyanto et al. (2015) and Nuryanto (2015) stated that the WRF–Chem model using input data from the fire inventory from the US National Center for Atmospheric Research (NCAR) or ‘FINN’ was able to simulate the spread of smoke haze due to forest fires well.
Currently, the FINN data have been updated to version 2.5. Nevertheless, the latest data from FINN have not been tested to predict smog, PM2.5 or other toxic gases in Indonesia when forest fires occur. Therefore, in this study, we try to use the latest FINN data as input data for WRF–Chem to predict PM2.5 during the 2019 forest fires in Sumatra.
2Methods
2.1 Model setup
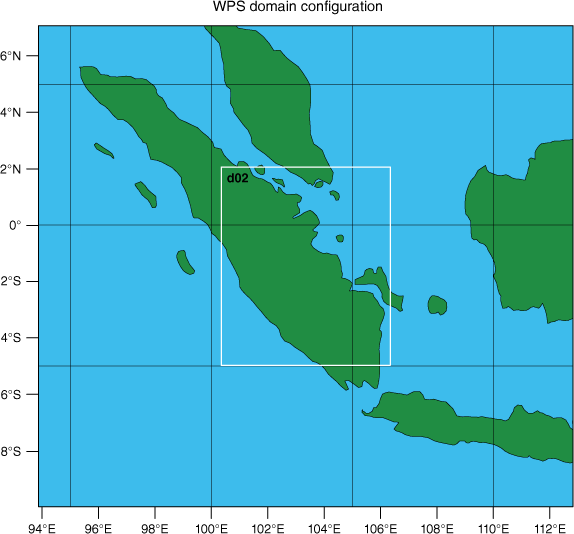
In this study, we used the WRF–Chem model version 4.2.2 to predict PM2.5. The study area was in Sumatra, Indonesia, and used the 2019 forest fire case study. The study domain used consisted of two domains with a resolution of 9 and 3 km. Fig. 1 shows the domain design used in this study.
Predictions were made on 22–25 September 2019 with output intervals every hour. For meteorological input data, we used Global Forecast System (GFS) data with a spatial resolution of 0.25° (~27 km) and a time resolution of every 3 h. The GFS data can be downloaded from the website: https://nomads.ncep.noaa.gov/pub/data/nccf/com/gfs/prod/. To predict the distribution of PM2.5 during forest fires, we used FINN data. FINN data are global forest fire emission data on a daily time scale with a spatial resolution of 1 km. This study used FINN data version 2.5, which is the latest version (Wiedinmyer et al. 2011). The latest version of FINN data can be downloaded here: https://www.acom.ucar.edu/Data/fire/. The WRF–Chem model used several parameterisation schemes to run predictions. The parameterisation schemes that we used in this study are presented in Table 1.
2.2 Model evaluation
The results of numerical models such as WRF–Chem must be evaluated before being used. To evaluate the model results, we used observation data from three stations. The three stations were at Jambi (1.5818°S, 103.5791°E), Palembang (2.9979°S, 104.7327°E) and Pekanbaru (0.5111°S, 101.45996°E). Those three stations are operated by Kementerian Lingkungan Hidup dan Kehutanan (KLHK, the Indonesian Ministry of Environment and Forestry). Then, for evaluating the model results, we used two methods: the Pearson Correlation Coefficient (R) and Root Mean Square Error (RMSE).
2.3 Pearson Correlation Coefficient (R)
Pearson correlation coefficient is one of the methods that can determine linearity between two variables. Two variables in this study are the prediction variable from the model result and observation data from the ground station. The coefficient value has a range between −1 and +1. If the coefficient has a negative value, it means an opposite relationship and vice versa. To calculate the coefficient correlation, Eqn 1 is used.
where, Fi is the prediction variable from the model and Oi is the observation data.
2.4 Root Mean Square Error (RMSE)
Root Mean Square Error (RMSE) is the second method in this study to evaluate the model result. RMSE measures how the difference between observation and model data. The smaller RMSE value means the model shows better results. RMSE is computed by using Eqn 2.
3Results
3.1 PM2.5 parameter
Evaluating the prediction results for the PM2.5 parameter of the model was carried out by comparing it with the observation data obtained from the KLHK measurement station. Three station points used to verify the model results. The model results were extracted to the coordinates of the three station points and then visualised in a time series form as shown in Fig. 2. Based on the results shown in Fig. 2, the PM2.5 value of the model still had a large enough difference for the three stations. When looking at the pattern of values, the Palembang station (Fig. 2b) has the most similar pattern when compared to the other two stations. Based on observation data in Palembang, the maximum PM2.5 concentration occurred on 23 September 2019, and the model results also showed the same thing even though the maximum concentration of the model results occurred several hours earlier.
The comparison model result with station data, (a) Jambi station, (b) Palembang station, and (c) Pekanbaru station.
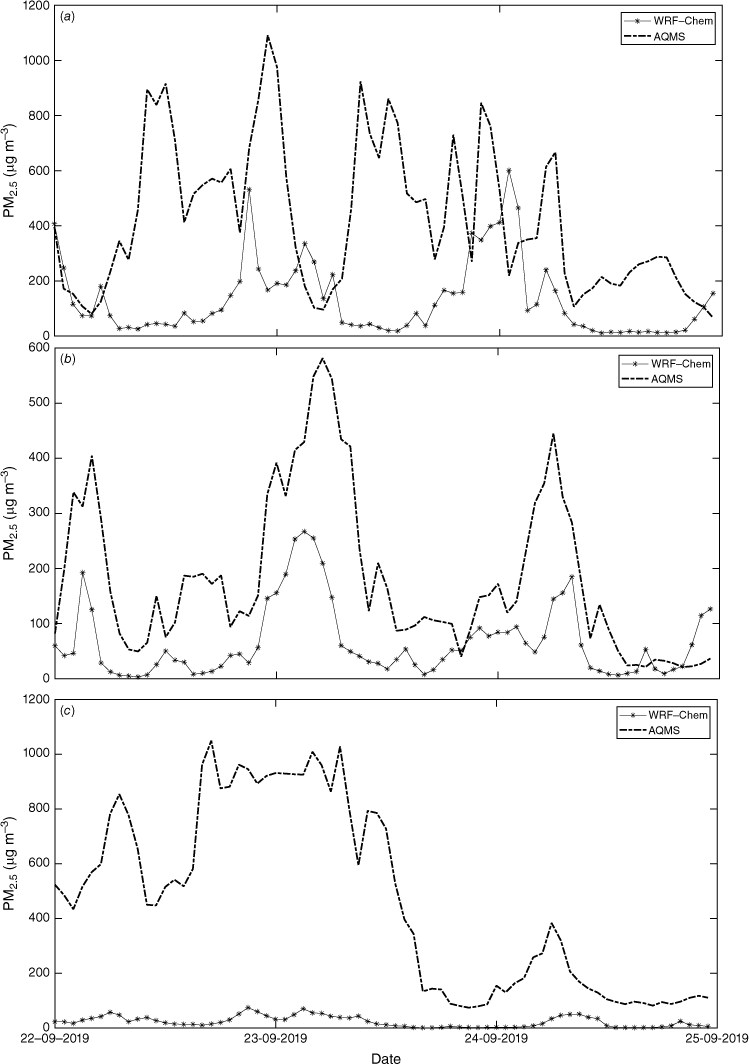
The suitability of the PM2.5 pattern at the Palembang station for the prediction results on 22–24 September 2019 is confirmed by an R-value of 0.7054 as shown in Table 2. This proves that the PM2.5 parameter of the model results for the Palembang station follows the PM2.5 pattern from observational data, although the PM2.5 value produced by the model is underestimated compared to observed data. This large difference is indicated by the RMSE value of 159.87, even though that value is the smallest of the three stations. Furthermore, the other two stations, Jambi and Pekanbaru, did not show a conformity pattern as close as the Palembang station. The results of the correlation calculation also showed smaller values than the Palembang station, especially for the Jambi station, which had the smallest correlation score. The difference in PM2.5 magnitude for each of the Jambi and Pekanbaru stations was much larger than that at the Palembang station. The largest difference occurs at the Pekanbaru station with a RMSE value of 550.74. This confirms that the model was not able to calculate the increase of PM2.5 magnitude during the 2019 forest fire event at Pekanbaru station. In addition, the prediction for Jambi station showed was also poor. The value of coefficient correlation was almost zero, which shows there was no correlation between the model result and observed data. Furthermore, the RMSE value was larger than Palembang station or similar as Pekanbaru station. These facts show that the model performance is not yet satisfactory.
| Station | Correlation | RMSE |
|---|---|---|
| Jambi | 0.0674 | 411.55 |
| Palembang | 0.7054 | 159.87 |
| Pekanbaru | 0.6510 | 550.74 |
The large RMSE difference between the model results and observations can also be seen in the simulation results conducted by Heriyanto et al. (2015) and Nuryanto (2015). Nuryanto (2015) simulated forest fires in Riau Province using FINN emission data as input in 2014. The active fire detection used in FINN data is based on observations from MODIS on NASA Terra and Aqua satellite instruments. One of the uncertainty values in the prediction results can be caused by incorrect identification of land cover. In addition, remote sensing cannot detect a fire area of less than 100 ha. Nevertheless, open burning can be a significant source of emissions to the atmosphere (Wiedinmyer et al. 2011). In addition, the presence of cloud cover or smog can hinder satellite detection, thereby reducing satellite visibility of the burned area and thereby causing uncertainty in fire measurements.
3.2 Comparing with satellite imagery
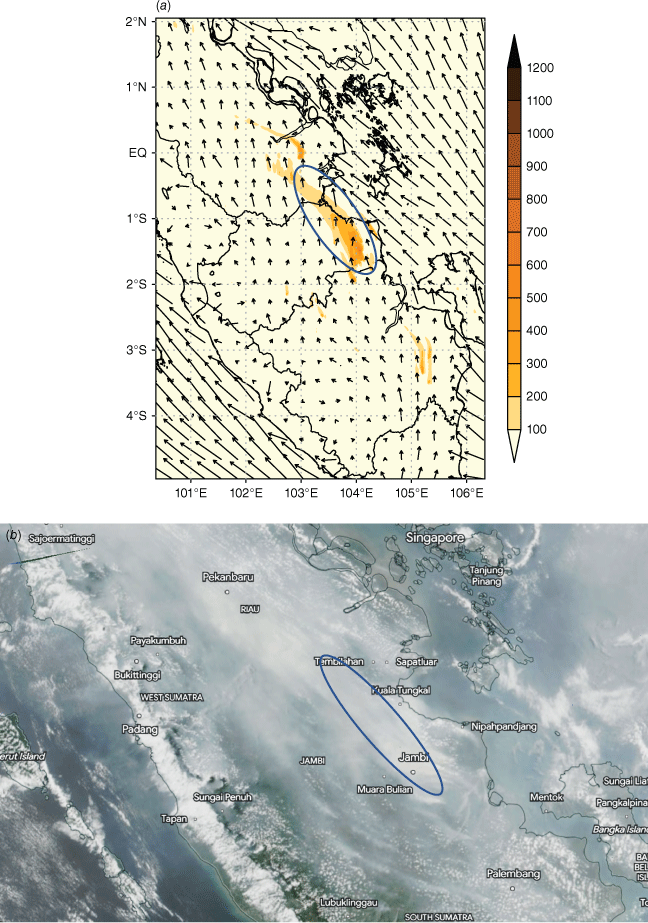
After verification by coefficient correlation and RMSE methods, we then compared the results of the model with satellite images or spatial comparisons. The satellite image used was a true colour image from the MODIS satellite overlaid with a hotspot. Hotspot data were obtained from Visible Infrared Imaging Radiometer Suite (VIIRS) or Suomi National Polar-orbiting Partnership (SNPP) satellite observations. Spatial comparison is shown in Fig. 3, where Fig. 3a shows the PM2.5 parameter and Fig. 3b shows the result of satellite imagery. Both images show the comparison at 07:00 hours Western Indonesian Time (WIB) (00:00 hours UTC) on 22 September 2019. In Fig. 3b, the distribution of smoke due to forest fires originating from the Palembang area is moving towards the north-west following the direction of the wind, which is the same as in the model results. Nevertheless, there is a slightly difference between the satellite image and the model result. In Fig. 3a, the model result shows PM2.5 tends to move northward first, then turns left north-westward, whereas, in Fig. 3b, the smoke of forest fire tends to move north-westward first, then turns right to northward. This difference is still being discussed by the authors and no reason has been found yet. Generally, for the spatial distribution pattern, the model can produce a similar pattern for PM2.5 parameter with the smoke observations data from satellite imagery.
The comparison spatial plot (a) PM2.5 parameter with (b) satellite imagery at 07:00 hours WIB (00:00 hours UTC) on 22 September 2019 (https://worldview.earthdata.nasa.gov/). Blue ovals in both figures show the distribution of PM2.5 (a) and smoke (b).
4Conclusion
The WRF–Chem model has been equipped with FINN version 2.5 input data and can predict the distribution of PM2.5 during the 2019 forest fire events in the Sumatra region, Indonesia. Unfortunately, the prediction of the PM2.5 parameter does not yet produce a satisfactory result. This is confirmed by the results of the calculation of R and RSME at the three stations. Of the three stations, only the prediction result of PM2.5 at the Palembang and Pekanbaru stations exhibit an R-value greater than 0.5, whereas the smallest RMSE value compared to the other stations was Palembang station. Although, if we take a look at the spatial comparison, the distribution of PM2.5 from the model can produce a similar pattern to the smoke observation data from satellite imagery. Therefore, the model can actually be used by local government and authorised agencies to do mitigation work when a forest fire has occurred. Nevertheless, the model still needs to be more developed because it does not show good performance for pattern suitability and the magnitude of the parameter values yet, especially in Jambi and Pekanbaru stations.
Data availability
Data used in this research can be found at https://nomads.ncep.noaa.gov/pub/data/nccf/com/gfs/prod/ and https://www.acom.ucar.edu/Data/fire/.
Acknowledgements
The authors express their gratitude to the Minister of Environment and Forestry for sharing the data of the related stations. They also thank Rumah Program Kebencanaan and acknowledge the use of imagery from the NASA Worldview application (https://worldview.earthdata.nasa.gov), part of the NASA Earth Observing System Data and Information System (EOSDIS).
References
Baklanov A, Schlünzen K, Suppan P, Baldasano J, Brunner D, Aksoyoglu S, Carmichael G, Douros J, Flemming J, Forkel R, Galmarini S, Gauss M, Grell G, Hirtl M, Joffre S, Jorba O, Kaas E, Kaasik M, Kallos G, Kong X, Korsholm U, Kurganskiy A, Kushta J, Lohmann U, Mahura A, Manders-Groot A, Maurizi A, Moussiopoulos N, Rao ST, Savage N, Seigneur C, Sokhi RS, Solazzo E, Solomos S, Sørensen B, Tsegas G, Vignati E, Vogel B, Zhang Y (2014) Online coupled regional meteorology chemistry models in Europe: current status and prospects. Atmospheric Chemistry and Physics 14, 317-398.
| Crossref | Google Scholar |
Blunden J, Arndt DS (2020) State of the climate in 2019. Bulletin of the American Meteorological Society 101, S1-S429.
| Crossref | Google Scholar |
Editorial Board (2019) Haze control: a legacy? In The Jakarta Post, 14 August 2019. Available at https://www.thejakartapost.com/academia/2019/08/14/haze-control-a-legacy.html
Fast JD, Gustafson WI, Easter RC, Zaveri RA, Barnard JC, Chapman EG, Grell GA, Peckham SE (2006) Evolution of ozone, particulates, and aerosol direct radiative forcing in the vicinity of Houston using a fully coupled meteorology–chemistry–aerosol model. Journal of Geophysical Research: Atmospheres 111, D21305.
| Crossref | Google Scholar |
Greenpeace Southeast Asia (2019) ASEAN haze 2019: the battle of liability. Press Release. (Greenpeace Southeast Asia) Available at https://www.greenpeace.org/southeastasia/press/3221/asean-haze-2019-the-battle-of-liability/
Grell GA, Peckham SE, Schmitz R, McKeen SA, Frost G, Skamarock WC, Eder B (2005) Fully coupled “online” chemistry within the WRF model. Atmospheric Environment 39, 6957-6975.
| Crossref | Google Scholar |
Heriyanto E, Nuryanto DE (2014) Prediksi sebaran asap kebakaran hutan dan lahan menggunakan WRF–Chem (studi kasus: tanggal 14 dan 20 Juni 2012, Pekanbaru-Riau). [Prediction of smoke distribution from forest and land fires using WRF–Chem (case study: 14 and 20 June 2012, Pekanbaru-Riau).]. Jurnal Meteorologi dan Geofisika 15, 51-58 [In Indonesian].
| Crossref | Google Scholar |
Heriyanto E, Syaufina L, Sobri M (2015) Forecasting simulation of smoke dispersion from forest and land fires in Indonesia. Procedia Environmental Sciences 24, 111-119.
| Crossref | Google Scholar |
Lestari DO, Sutriyono E, Sabaruddin S, Iskandar I (2018) Respective influences of Indian Ocean Dipole and El Niño–Southern Oscillation on Indonesian precipitation. Journal of Mathematical and Fundamental Sciences 50, 257-272.
| Crossref | Google Scholar |
Lu B, Ren HL (2020) What Caused the Extreme Indian Ocean Dipole Event in 2019? Geophysical Research Letters 47, e2020GL087768.
| Crossref | Google Scholar |
Mardiansyah W, Setiabudidaya D, Khakim MYN, Yustian I, Dahlan Z, Iskandar I (2018) On the influence of ENSO and IOD on rainfall variability over the Musi Basin, south Sumatra. Science & Technology Indonesia 3, 157-163.
| Crossref | Google Scholar |
Mulia P, Nofrizal N, Dewi WN (2021) Analisis dampak kabut asap Karhutla terhadap gangguan kesehatan fisik. [Analysis of the impact of the forest fire haze on physical health problems.]. Jurnal Ners Indonesia 12, 51-66 [In Indonesian].
| Crossref | Google Scholar |
Nuryanto DE (2015) Simulation of forest fires smoke using WRF–Chem model with FINN fire emissions in Sumatera. Procedia Environmental Sciences 24, 65-69.
| Crossref | Google Scholar |
Powers JG, Klemp JB, Skamarock WC, Davis CA, Dudhia J, Gill DO, Coen JL, Gochis DJ, Ahmadov R, Peckham SE, Grell GA, Michalakes J, Trahan S, Benjamin SG, Alexander CR, Dimego GJ, Wang W, Schwartz CS, Romine GS, Liu Z, Snyder C, Chen F, Barlage MJ, Yu W, Duda MG (2017) The weather research and forecasting model: overview, system efforts, and future directions. Bulletin of the American Meteorological Society 98, 1717-1737.
| Crossref | Google Scholar |
Ratna SB, Cherchi A, Osborn TJ, Joshi M, Uppara U (2021) The extreme positive Indian Ocean Dipole of 2019 and associated Indian summer monsoon rainfall response. Geophysical Research Letters 48, e2020GL091497.
| Crossref | Google Scholar |
Reuters Newsdesk (2019) Malaysia sends half a million face masks to haze-hit state as fires burn. In The Jakarta Post, 10 September 2019. Available at https://www.thejakartapost.com/seasia/2019/09/10/malaysia-sends-half-a-million-face-masks-to-haze-hit-state-as-fires-burn.html [Verified 9 December 2022]
Vara-Vela AL, Herdies DL, Alvim DS, Vendrasco ÉP, Figueroa SN, Pendharkar J, Reyes Fernandez JP (2021) A new predictive framework for Amazon forest fire smoke dispersion over South America. Bulletin of the American Meteorological Society 102, E1700-E1713.
| Crossref | Google Scholar |
Wahid AB (2019) BNPB: Karhutla 2019 Bakar Lahan 857 Ribu Ha, Terparah dalam 3 Tahun. [BNPB: 2019 forest fire burns 857 000 ha of land, worst in 3 years.] In detikNews, 22 October 2019. Available at https://news.detik.com/berita/d-4755492/bnpb-karhutla-2019-bakar-lahan-857-ribu-ha-terparah-dalam-3-tahun/2 [In Indonesian, verified 9 December 2022]
Wiedinmyer C, Akagi SK, Yokelson RJ, Emmons LK, Al-Saadi JA, Orlando JJ, Soja AJ (2011) The fire inventory from NCAR (FINN): a high resolution global model to estimate the emissions from open burning. Geoscientific Model Development 4, 625-641.
| Crossref | Google Scholar |