The Antarctic ozone hole during 2020
Andrew R. Klekociuk A * , Matthew B. Tully B , Paul B. Krummel C , Stuart I. Henderson D , Dan Smale
  E , Richard Querel E , Sylvia Nichol F , Simon P. Alexander A , Paul J. Fraser C and Gerald Nedoluha G
A Australian Antarctic Division, Department of Agriculture, Water and the Environment, Kingston, Tas., Australia.
B Bureau of Meteorology, Melbourne, Vic., Australia.
C Climate Science Centre, CSIRO Oceans and Atmosphere, Aspendale, Vic., Australia.
D Australian Radiation Protection and Nuclear Safety Agency, Yallambie, Vic., Australia.
E National Institute of Water & Atmospheric Research, Lauder, New Zealand.
F National Institute of Water & Atmospheric Research, Wellington, New Zealand.
G Naval Research Laboratory, Washington, DC, USA.
Journal of Southern Hemisphere Earth Systems Science 72(1) 19-37 https://doi.org/10.1071/ES21015
Submitted: 18 June 2021 Accepted: 28 December 2021 Published: 2 March 2022
© 2022 The Author(s) (or their employer(s)). Published by CSIRO Publishing on behalf of BoM. This is an open access article distributed under the Creative Commons Attribution-NonCommercial-NoDerivatives 4.0 International License (CC BY-NC-ND)
Abstract
The Antarctic ozone hole remains the focus of scientific attention because of its importance to the health of the biosphere and its influence on the climate of the southern hemisphere. Here we examine the general characteristics of the 2020 Antarctic ozone hole using a variety of observational and reanalysis data and compare and contrast its behaviour with earlier years. The main feature of the 2020 ozone hole was its relatively large size, and persistence to the beginning of the 2020/2021 summer, with new maximum records being set for the ozone hole daily area and ozone mass deficit during November and December. This was in strong contrast to 2019 when the ozone hole was one of the smallest observed. We show that a key factor in 2020 was the relative stability and strength of the stratospheric polar vortex, which allowed low temperatures in the Antarctic lower stratosphere to enhance ozone depletion reactions in relative isolation from the rest of the global atmosphere. These conditions were associated with relatively weak Rossby wave activity at high southern latitudes that occurred during the strengthening westerly phase of the Quasi Biennial Oscillation as well as the emerging La Niña phase of the El Niño Southern Oscillation. A consequence of the conditions in early summer was the measurement of new maximum values of ultraviolet radiation at Australia’s three Antarctic research stations of Mawson, Davis and Casey. Indications of anomalous chlorine partitioning above Arrival Heights in Antarctica prior to the 2020 winter are provided, which may relate to effects from the 2019/2020 Australian wildfires. We also examine the effect of the downward coupling of the 2020 ozone hole to the climate of the wider southern hemisphere, which showed regional influences on surface temperature and precipitation in common with other strong vortex years.
Keywords: Antarctica, ‘Black Summer fires’, climate, ozone, ozone hole, ozone hole metrics, Rossby waves, stratosphere.
1. Introduction
The Antarctic ozone hole continues to be a significant, annually-occurring feature of the polar atmosphere. Discovered in the mid-1980s, the ozone hole is directly caused by a chain of processes that enable human-made chlorofluorocarbon and related gases to destroy a significant fraction of ozone in the lower stratosphere over the Antarctic region during spring (Solomon et al. 1986). Controls on ozone-depleting chemicals by the Montreal Protocol are helping to reduce ozone depletion, and substantial recovery of the Antarctic ozone hole is expected in the next 3–4 decades (Dhomse et al. 2018; Langematz et al. 2018).
A key factor that promotes the chemical processes leading to ozone depletion are Polar Stratospheric Cloud (PSC) particles, which form when strong radiative cooling takes place in the Antarctic winter stratosphere (Tritscher et al. 2021). The PSCs promote heterogeneous chemical reactions that activate the release of reactive chlorine and bromine compounds from inert reservoir species. These reactive compounds catalyse chemical ozone destruction when sunlight returns at the end of the polar night. The amount of available PSC particle area, and hence the amount of stratospheric chemical processing, is strongly influenced by the temperature and stability of the polar vortex, with greater potential for ozone destruction when the vortex is cold and stable (Solomon et al. 2015).
The ozone hole is recognised as playing an important role in the climate of the southern hemisphere. Ozone depletion has cooled the stratosphere, and this has trended the Southern Annular Mode (SAM) towards a more positive state during the austral summers in recent decades (Thompson and Grosbois 2002; Polvani et al. 2011; Thompson et al. 2011). The tendency in the SAM has influenced the westerly wind belt over the Southern Ocean, increasing its strength and shifting its core towards Antarctica, and has altered rainfall patterns at southern mid-latitudes (Thompson et al. 2011; Turner et al. 2014; Smith and Polvani 2017). The mechanism behind these changes is associated with a dynamical coupling that acts progressively downward in altitude over time because of the cooling induced in the lower stratosphere by ozone depletion (Thomson and Solomon 2002). In the southern hemisphere, the coupling typically takes approximately 2–3 months to progress from the lower stratosphere to the surface, and its strength varies year-to-year depending on the characteristics of meteorological patterns in the troposphere (Thompson et al. 2005).
Because of the climate effects of stratosphere–troposphere coupling by the polar vortex, it is important to assess the annual state of the Antarctic stratosphere and the meteorological and chemical factors that influence its inter-annual variability. In turn, understanding the variability assists in anticipating future recovery of the ozone hole. The cooling effect of ozone depletion is implicated in affecting the strength of the Antarctic stratospheric vortex over recent decades (Langematz and Kunze 2006; Zhang et al. 2017). Additionally, Hu et al. (2021) have shown that the propagation of Rossby waves into the Antarctic stratosphere has decreased since around the year 2000, and suggest that this is due to warming of sea surface temperatures in the extra-tropics. This reduction of stratospheric wave activity has potentially strengthened the vortex, countering the effect of warming expected with ozone recovery (Xia et al. 2020). Recently, Jucker et al. (2021) presented model results indicating that future increases of the high-latitude stratospheric zonal wind in spring from enhanced carbon dioxide cooling will lead to strengthening of the vortex and an associated reduction in the likelihood of strong stratospheric warmings in the southern hemisphere.
Large inter-annual variability has been observed in Antarctic ozone depletion, with the years 1988, 2002 and 2019 showing particularly small ozone holes. The variability has complicated the evaluation of ozone trends (Chipperfield et al. 2017), although several lines of evidence indicate that a statistically significant increase has occurred since 2000 in Antarctic stratospheric ozone during September (Langematz et al. 2018). In 2002, an observationally unprecedented major stratospheric warming occurred in the southern hemisphere, with the reversal of the zonal wind at 10 hPa and 60°S during mid-September (Butler et al. 2017). In the spring of 2019, strong stratospheric warming occurred which rivalled the warming event in 2002 (Newman and Nash 2005; Kramarova et al. 2020; Milinevsky et al. 2020; Rao et al. 2020; Klekociuk et al. 2021; Lim et al. 2021). This was a key factor in the anomalously small ozone hole of 2019. A similarly strong warming event also limited ozone depletion in 1988 (Kanzawa and Kawaguchi 1990).
Effects associated with the 2019 stratospheric warming have been implicated as a driver of the extreme climatic conditions that occurred in eastern Australia, South America and parts of Antarctica in the 2019/2020 summer (Robinson et al. 2020; Lim et al. 2021). The conditions in 2019 had two important effects on the stratosphere over the following several months. Firstly, wildfires in eastern Australia during the 2019/2020 summer that were exacerbated by extreme climatic conditions lofted extraordinary amounts of smoke, aerosol and entrained tropospheric air into the stratosphere (Allen et al. 2020; Kablick III et al. 2020; Khaykin et al. 2020). The effects of the plume were primarily observed at mid-latitudes and included a persistent warming of the lower stratosphere by the radiative effects of black carbon (Yu et al. 2021) and dilution of the ozone layer by the entrained tropospheric air (Schwartz et al. 2020). Secondly, Rossby wave activity associated with the stratospheric warming has been implicated in disrupting the normal cycle of the Quasi-Biennial Oscillation (QBO) in late-2019/early-2020 (Anstey et al. 2020; Kang and Chun 2021). Both of these influences are relevant to the development of the 2020 Antarctic ozone hole, through the potential contribution of any persistent effects of the wildfire smoke on chemical ozone depletion, and the influence of the QBO state on Rossby wave propagation during the life cycle of the Antarctic stratospheric vortex.
Here we describe the general characteristics of the 2020 ozone hole and examine two specific questions: (1) What were the key conditions that resulted in the unusual persistence of Antarctic ozone depletion in the latter part of 2020? (2) What were the implications of the characteristics of the 2020 ozone for the climate of the southern hemisphere in the months that followed? To do this, we first describe the data and methods that we use, and follow this with a general description of the main features of the 2020 ozone hole and associated stratospheric conditions as observed in a variety of observational and meteorological reanalysis data. We then synthesise the analysis to address our two key questions. This work complements analyses of earlier ozone holes presented in the following series of papers where further details on individual years discussed here can be obtained: Tully et al. (2008), Tully et al. (2011), Klekociuk et al. (2014), Krummel et al. (2019), Tully et al. (2019) and Klekociuk et al. (2021).
2. Materials and methods
2.1. Satellite measurements
We used daily global gridded (level 3) total column ozone data from three separate satellite-borne instruments to evaluate metrics of the ozone hole: (a) the Total Ozone Mapping Spectrometer (TOMS), (b) the Ozone Monitoring Instrument (OMI) and (c) the Ozone Mapping and Profiler Suite (OMPS). These instruments provided total column ozone information from sun-synchronous orbits using nadir measurements of backscattered solar ultraviolet (UV) radiation (UVR). The time intervals, spatial resolutions and versions of the total column ozone data, and the method used to evaluate the ozone hole metrics are provided in Klekociuk et al. (2021). We also use vertically resolved backscatter measurements from the Cloud-Aerosol Lidar with Orthogonal Polarization (CALIOP) space-borne lidar to examine the location of PSCs using the detection criteria of Pitts et al. (2018).
2.2. In situ measurements and ground-based remote sensing
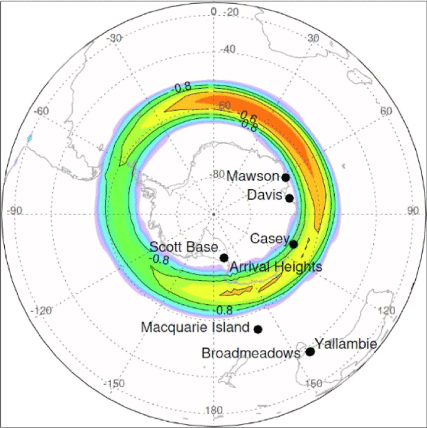
The location of ground-based sites used for in situ and remote sensing measurements are shown in Fig. 1 along with a depiction of the climatological boundary of the stratospheric vortex.
|
2.2.1. Trace gas measurements at Arrival Heights and Scott Base
We compare gas-phase total column abundances in 2020, for a variety of species relevant to ozone chemistry, to those taken in earlier years. The data are from solar observations made with a Fourier Transform Spectrometer (FTS) at Arrival Heights in Antarctica (77.9°S, 166.7°E; Kohlhepp et al. 2012). The species considered here are ozone (O3), hydrogen chloride (HCl), chlorine nitrate (ClONO2), nitric acid (HNO3) and nitrogen dioxide (NO2). We also report measurements of stratospheric chlorine monoxide (ClO) obtained at Scott Base (77.9°S, 166.8°E) using a microwave radiometer (Nedoluha et al. 2016). Additionally, we show data from the Dobson spectrophotometer (instrument number 17) at Arrival Heights, which have been used to obtain the total ozone column abundance from direct solar and lunar observations since 1995. Measurements by all of the instruments are made under the auspices of the Network for the Detection of Atmospheric Composition Change (De Mazière et al. 2018; NDACC 2021).
2.2.2. Ozonesondes
To characterise the vertical distribution of ozone within the ozone hole, we used in situ measurements of ozone mixing ratio obtained from Science Pump Corporation type ECC-6 ozonesondes launched approximately weekly by the Australian Bureau of Meteorology (BoM) at Australia’s Davis (68.6°S, 78.0°E; since 2003) and Macquarie Island (54.5°S, 159.0°E; since 1994) research stations, and from the BoM site at Broadmeadows (37.7°S, 144.9°E; since 1999), near Melbourne, Australia. The Davis measurements are made in collaboration with the Australian Antarctic Division. Details of the equipment are discussed in Klekociuk et al. (2021). Here we used 10-s cadence measurements (obtained at approximately 50 m height intervals) that are archived by the World Ozone and Ultraviolet Data Center (WOUDC 2021).
2.2.3. Ultraviolet radiation measurements
The Australian Radiation Protection and Nuclear Safety Agency (ARPANSA) maintains a network of detectors to monitor solar UVR arriving at ground level. Two types of broadband sensors are used at the Australian Antarctic research stations: Casey (66.3°S, 110.5°E) and Davis use Robertson-Berger style detectors (UVBiometer model 501, Solar Light Co., Philadelphia, USA), while at Mawson (67.6°S, 62.9°E) and Macquarie Island, silicon carbide-based UVR sensitive photodiode sensors (Cosine UV Index Sensor, sglux GmbH, Berlin, Germany) are employed. Here we also use measurements from Yallambie (37.7°S, 145.1°E), near Melbourne, Australia which are also made with the same model of photodiode sensor. The response of both types of sensors approximates that of human skin as described by the erythemal action spectrum. The output of the sensors are converted to a UV Index value (an erythemally effective irradiance of 25 mW m−² is equivalent to one unit on the UV Index scale) and the maximum 10-min average value recorded each day is reported as the UV Index for that date. Prior to deployment at the Antarctic stations, the sensors are calibrated against a spectroradiometer (Bentham model DTMc300, Bentham Instruments Ltd., Reading, UK) by performing simultaneous solar UVR measurements at the ARPANSA laboratory in Melbourne. Irradiance calibration of the spectroradiometer is achieved using a 1000-W quartz tungsten halogen lamp traceable to the Australian Government National Measurement Institute while its wavelength calibration is set with reference to the UV spectral lines of a mercury lamp. Measurements from 2007 are used here.
2.3. Reanalysis data
To examine meteorological conditions associated with the ozone hole, we used data from the European Centre for Medium-Range Weather Forecasts (ECMWF) fifth-generation reanalysis ERA5 (Hersbach et al. 2020). ERA5 data were used to derive two dynamical quantities related to the propagation of Rossby (planetary-scale) waves: the meridional eddy heat flux T*u* (where T and u are the air temperature and zonal wind speed, respectively, and * denotes the deviation from the zonal mean) and the horizontal wave activity flux (WAF), obtained from geopotential and the horizontal wind components using the formalism of Takaya and Nakamura (2001). The eddy heat flux is a proxy for upward energy propagation by Rossby waves, while the WAF provides information on the horizontal propagation of the waves. Geopotential height data (obtained by division of ERA5 geopotential by 9.80555 ms−2) were used to obtain the SAM index as a function of pressure level using empirical orthogonal function analysis following the approach used by the National Oceanic and Atmospheric Administration (NOAA 2021). We standardised the index using the monthly climatology over the base period 1980–2010. The SAM index provides information on the coupling between mid- and high-southern latitudes, and its vertical evolution is influenced by coupling between the stratosphere and troposphere.
We also use gridded total column ozone data from ERA5, the National Institute of Water and Atmospheric Research–Bodeker Scientific (NIWA–BS) total column ozone database version 3.5.1 (Bodeker et al. 2021) and version 2 of the Multi-Sensor Reanalysis (MSR2; van der A 2015) to evaluate ozone hole metrics.
3. Results and discussion
3.1. Ozone hole metrics
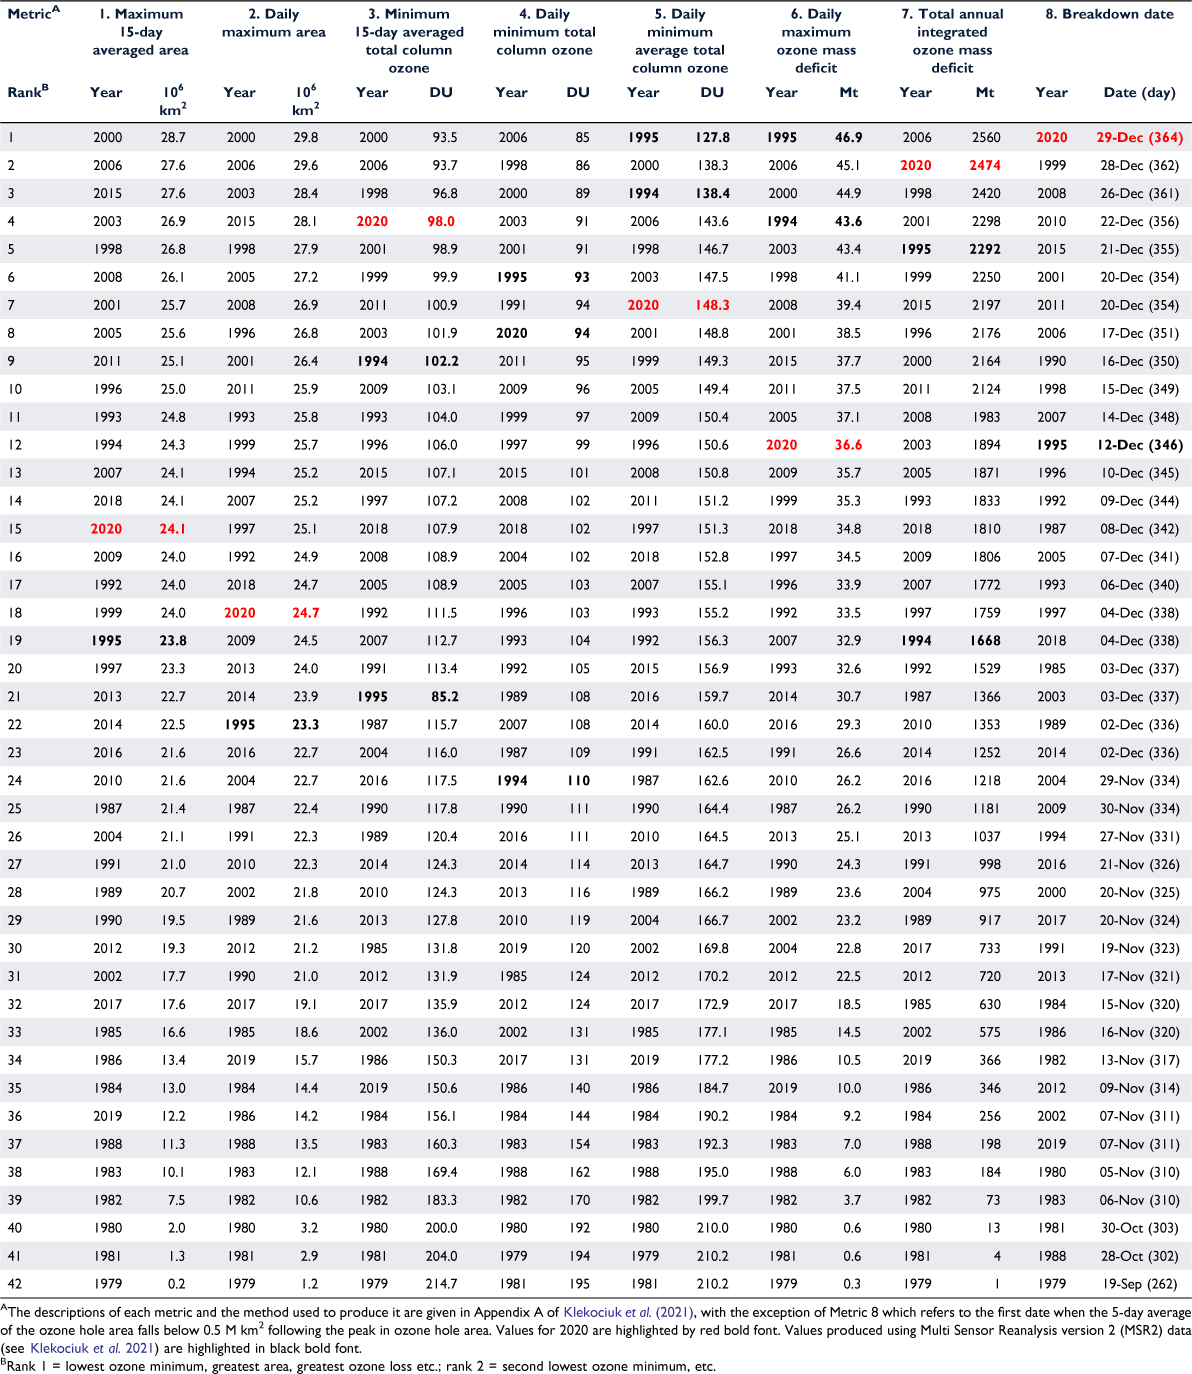
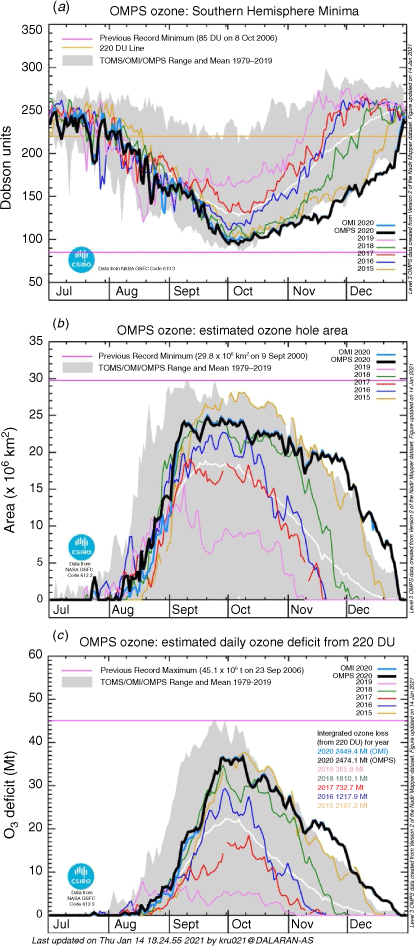
Table 1 provides annual values for eight ozone hole metrics obtained by the Commonwealth Scientific and Industrial Research Organisation (CSIRO) from analysis of satellite total column ozone measurements. The analysis was augmented with values obtained from MSR2 data for 1994 and 1995 when there was a gap in coverage by the TOMS instrument. Daily values of selected metrics are shown in Fig. 2. Fig. 2a shows the daily minimum total column ozone south of 35°S (Metric 4 in Table 1) for 2020 and other selected years obtained from the analysis of satellite data. During 2020, the lowest total column values consistently fell below the 220 Dobson Unit (DU) ozone hole threshold (Uchino et al. 1999; Newman et al. 2004; Bodeker et al. 2005; Bodeker and Kremser 2021) in early August. During most of the period up to mid-September, this metric was close to the long-term average. However, from mid-September up to the last week of December, the daily minimum column values were well below the long-term average, and set new extreme low values on several days, particularly in November and December. A relatively deep minimum of 94 DU (ranked 8th in Metric 4 of Table 1) occurred in early October.
|
|
The daily ozone hole area (the area within the 220 DU contour; Metric 2 in Table 1) is shown in Fig. 2b. The growth in area of the 2020 ozone hole was generally close to the long-term average up to the end of August. Strong growth occurred in the first week of September, and the daily area metric attained an initial maximum on 8 September. Following a minor decline up to 13 September, the ozone hole reached its maximum area for the year of 24.7 Mkm2 on 20 September. This maximum was close to the peak value observed in 2018. After maximising in area, the 2020 ozone hole became relatively stable and persistent. From mid-September up to the end of November, the area metric showed some modest fluctuations (centred on 13 and 30 October and 9 November) but generally decayed more slowly than previously observed, setting maximum daily area records from mid-November until its final breakdown on 29 December. Notably, the breakdown date was the latest observed. The evolution of the area metric showed some similarities with 2015 and 2018. While the 2020 ozone hole was smaller than that in 2015, when ozone depletion was influenced by volcanic aerosols and the general absence of dynamical variability in the polar vortex (Stone et al. 2017; Tully et al. 2019), it showed similar persistence. The evolution of the daily area metric in 2020 up to the end of October closely matched the behaviour in 2018, when the relative absence of strong dynamical activity was also a feature (Klekociuk et al. 2021).
Fig. 2c shows the daily maximum ozone mass deficit in the Antarctic ozone hole with respect to 220 DU (Metric 6 of Table 1), which is a function of both ozone hole depth and area. The maximum daily ozone mass deficit was 36.6 million tonnes (Mt) in early October, the 12th largest deficit in Table 1. Notably, because of the unusual persistence and size of the ozone hole, particularly during November and December, the total ozone mass deficit (the sum of the daily ozone mass deficits) based on data from the Ozone Mapping and Profiler Suite (OMPS) satellite instrument was approximately 2449 Mt, second only to the value of 2560 Mt for 2006 (Table 1).
3.2. In situ measurements and ground-based remote sensing
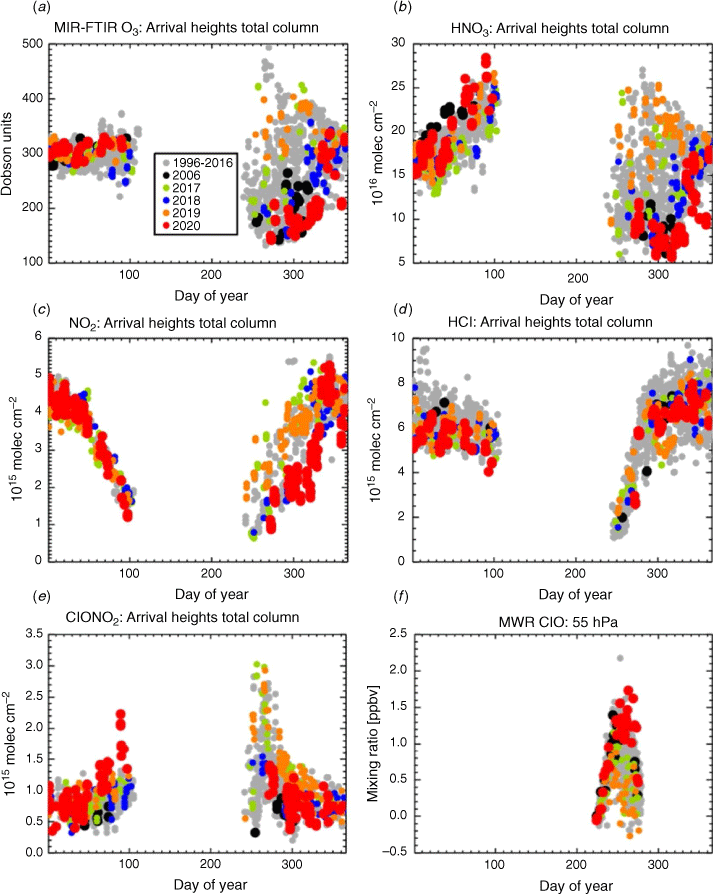
Fig. 3 presents trace gas measurements at Arrival Heights and Scott Base. The total column ozone measurements in the post-winter period were amongst the lowest values recorded since 1996 (Fig. 3a), with the ozone hole (values less than 220 DU) lasting into December. Persistence of PSC particles (hence heterogeneous ozone destruction) is indicated by the continued denitrification of the stratosphere observed in the reduction of gas-phase HNO3 (Fig. 3b) and NO2 (Fig. 3c) from the start of spring until December. Over the period of days 290–330, HNO3 was historically low, with abundances of ~5–10 × 1015 molec cm−2 compared to the historical average of ~15–17 × 1015 molec cm−2. Over the same time-period, NO2 was also low, averaging ~2 × 10¹⁵ molec cm−2 and well below the average of ~3 × 10¹⁵ molec cm−2. Such denitrification allows prolonged heterogeneous reactions on PSCs. Chlorine reservoir species (HCl and ClONO2) are converted into active forms on the surfaces of PSC particles. The HCl measurements prior to day 300 of 2020, although limited in number, tend to show values at the bottom of the observed range (~1–2 × 10¹⁵ molec cm−2; Fig. 3d) and we do not see the annual ClONO2 ‘spike’ over the narrow time frame of days 250–280 (Fig. 3e). This can be largely attributed to a lack of NO2 (anomalously low abundances of 1–2 × 10¹⁵ molec cm−2 over the ‘spike’ period). Such a spike could feasibly occur before day 260, the period where there were no measurements of ClONO2. However, given that cold conditions were present before day 260, we infer that a spike in ClONO2 was unlikely to have occurred. A lack of the annual ClONO2 spike indicates that chlorine was still activated. In 2020, ClO activation proceeded, as in previous years, up to ~day 270 then reached an anomalously high value of ~1.6 ppb (at 55 hPa) on ~day 275 (Fig. 3f) which was a week later than in any prior year. Overall, the species shown in Fig. 3 all suggest that strong heterogeneous ozone depletion chemistry occurred at southern high latitudes in the latter part of 2020. This chemistry was particularly active in early 2020/2021 summer and we infer that it persisted a lot longer than usual due to the anomalously low stratospheric temperatures.
Note in Fig. 3e the evidently high ClONO2 amounts in the immediate pre-winter period of 2020 compared with other years (that is, in the period up to the last observations around day 105 in mid-April). Even with a large uncertainty associated with the retrieval of ClONO2 at ~30% (other FTIR species uncertainty estimates are ~5%), the anomalously high values are nearly double those of other years. The source of stratospheric ClONO2 involves a three-body reaction also including ClO and NO2 (von Clarmann and Johansson 2018). Fig. 3c, d suggests that NO2 and HCl column abundance may have been slightly suppressed relative to other years in the last few observations prior to winter in 2020. The day-minus-night ClO column measurements around this time are essentially at the level of the background noise (not shown). Although no significantly anomalous ClO column abundances were measured, the ClONO2 enhancement and simultaneous reduction in HCl indicates anomalous chlorine reservoir partitioning. We conjecture that some form of heterogeneous chemistry was already taking place before the start of the winter (when, as we discuss in Section 3.4, no PSCs were detected in the polar cap). Around this time, the stratospheric smoke plume from the wildfires of the 2019/2020 summer was detected at high southern latitudes (Schwartz et al. 2020).
The total ozone column abundance at Arrival Heights just prior to and during the 2020 winter appeared unremarkable compared with earlier years (Fig. 3a). This is also apparent in Supplementary Fig. S1, which provides additional detail from Dobson spectrophotometer measurements at the site. If chlorine reservoir partitioning was occurring at this time due to the influence of the stratospheric smoke plume, then the chemical pathways differed to those observed in standard polar heterogeneous chemistry, as indicated by the lack of significantly enhanced ClO. Additionally, no obvious reduction appears to have occurred to the total column ozone concentration, particularly before the beginning of the polar night. Further study of the anomalous chlorine reservoir partitioning and its possible association with the smoke plume is needed.
Partial column ozone values from ozonesonde flights at Davis (Supplementary Fig. S2a), Macquarie Island (Supplementary Fig. S2b) and Broadmeadows (Supplementary Fig. S2c) further highlight that ozone concentrations in the lower stratosphere during October and November 2020 were relatively low in the latter part of the year, not only near the inside edge of the vortex (at Davis) but also outside the vortex.
3.3. Ultraviolet radiation measurements
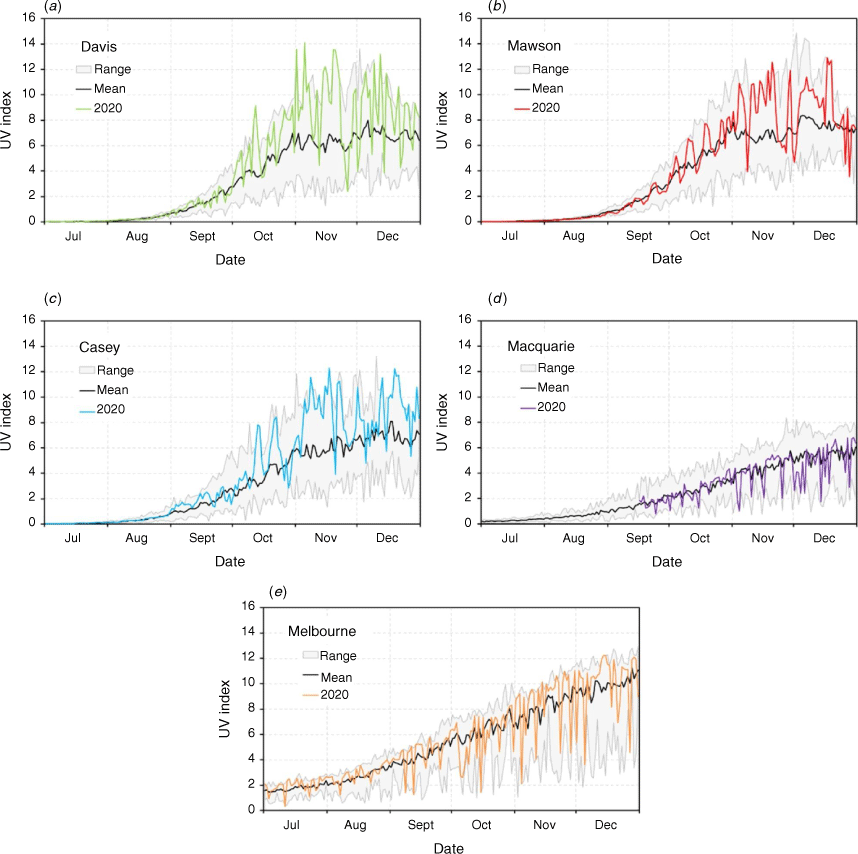
Fig. 4 shows UV Index measurements at the three Australian Antarctic stations of Davis, Mawson and Casey, sub-Antarctic Macquarie Island and Melbourne in southern Australia. The panels are ordered by decreasing southern latitude. In 2020, UVR levels at the Antarctic stations (Fig. 4a–c) were generally well above the 2007–2020 climatological mean from October to December, with new record extreme high values being set on some days, particularly in November and December. Based on satellite total column overpass observations by the Global Ozone Monitoring Experiment (GOME) for 1998–2001 and OMI since 2004 (ESA 2021), ozone hole days (defined as individual days when any of the satellite overpass coincidences at a particular site was less than 220 DU) were observed during November–December 2020 on a total of 35 days at Davis and 36 days at Mawson. These totals exceeded by more than 10 days the previous largest annual totals (~23 days in each of 1999, 2001, 2003, 2006, 2010 and 2015). The total number of events for each site for August–December 2020 was the largest observed, just eclipsing the totals for 2001 and 2006. Although Casey had more ozone hole events over August–December in 2006 (53 days) and 2015 (43 days) compared with 2020 (38 days), there were significantly more events in November 2020 (18 days) than in any other year (other notable totals were 8 days in 2001, 9 days in 2006 and 7 days in 2015). At Macquarie Island (Fig. 4d), UVR levels were not particularly notable, with the possible exception of slightly elevated levels for a few days near days 300 (26 October) and 320 (15 November) when ozonesonde measurements showed relatively low partial column values in the lower stratosphere (Supplementary Fig. S1b). By comparison, Melbourne (Fig. 4e) showed values near the climatological maximum on several occasions during November and December. The high UVR levels around 25 November (day 330) and 15 December (day 350) aligned with the relatively low partial column ozone values shown in Supplementary Fig. S1c.
3.4. Stratospheric conditions
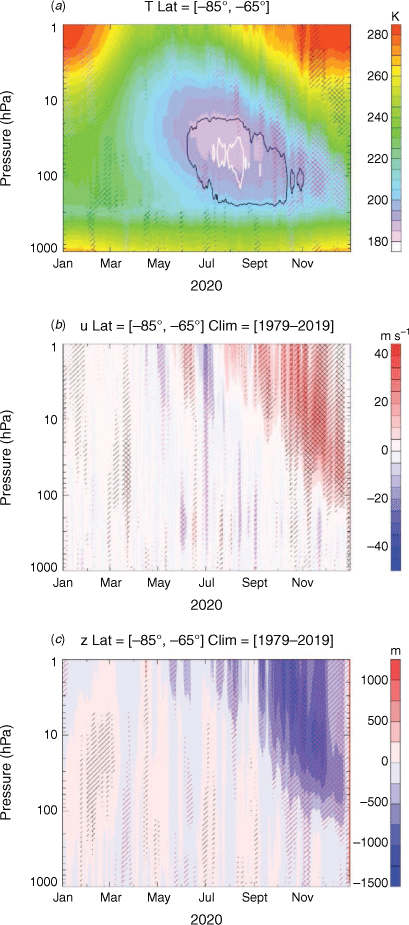
We now examine the prevailing meteorological conditions during 2020. Vertical cross-sections of temperature, zonal wind and geopotential height for the southern polar cap region are shown in Fig. 5. A particular feature of 2020 was that temperatures in the lower stratosphere of the southern polar cap during spring were significantly below average. This is shown by the regions of magenta cross-hatching in Fig. 5a at pressure levels mainly between 10 and 200 hPa at various times from September through to December. These regions represent record minimum average temperatures over the period since 1979. The polar cap temperature anomalies in spring showed a downward progression which tended to follow the overall time–height progression of the cold ‘core’ of the winter polar stratosphere (Fig. 6a). Generally, the descending cold anomalies (magenta hatching in Fig. 5a) were located below and preceded descending warm anomalies that developed in the upper-stratosphere from mid-October (black hatching in Fig. 5a). Over this latitude band, the proxy region for PSC occurrence (outlined contours in Fig. 5a) extended between June and October between ~30 hPa (~25 km altitude) and 200 hPa (~10 km altitude). This was much longer lasting than in 2019 and generally similar to the situation in 2018 (compare with fig. B1 in Klekociuk et al. (2021)).
In terms of the zonal wind (Fig. 5b) and geopotential height (Fig. 5c) in the polar cap, significant anomalies (hatched regions) developed in the upper levels mainly from August, which generally overlapped in the upper levels of the cold temperature anomalies (Fig. 5a). There were some relatively short-lived weakenings of the zonal circulation during winter and spring (blue contours with magenta hatching in Fig. 5b) – for a period of several days throughout the stratosphere during late June and early July, and in the lower stratosphere and upper troposphere around 1 June, 10 August, 1 September and 23 November. These weakenings relate to poleward heat transport events discussed below.
|
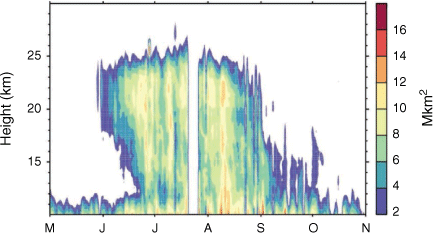
The observed PSC total area coverage poleward of 50°S during 2020 is shown in Fig. 6 (from CALIOP measurements). Due to the increasing sampling density of CALIOP towards 82°S (the lowermost latitude sampled), we follow Pitts et al. (2018) by dividing the region into 10 equal-area latitudinal bands, calculating PSC occurrence frequency and then multiplying by the area of each band. The total area covered by PSCs is the summation of these bands. We do not attempt to remove upper-tropospheric cirrus which are flagged as PSCs by the algorithm below around 12 km altitude. The results shown for winter 2020 in Fig. 6 follow the climatological pattern, with larger areal extent at high altitudes early in the winter, and the descent of the PSC areal coverage to lower altitudes late in the season. Note that the first detection of PSCs was around the beginning of June (~day 150), and much later than the enhanced ClONO2 discussed in Section 3.3 in relation to Fig. 3e (around day 100). The time–height region covered by PSCs in Fig. 6 is in reasonable agreement with that for the proxy nitric acid trihydrate PSC contour in Fig. 5a. The total PSC area coverage shown in Fig. 6 is similar to other recent cold winters with a stable vortex (e.g. 2015 and 2016 as shown in Pitts et al. (2018)) and noticeably larger than warm vortex years (such as 2010 and 2012).
|
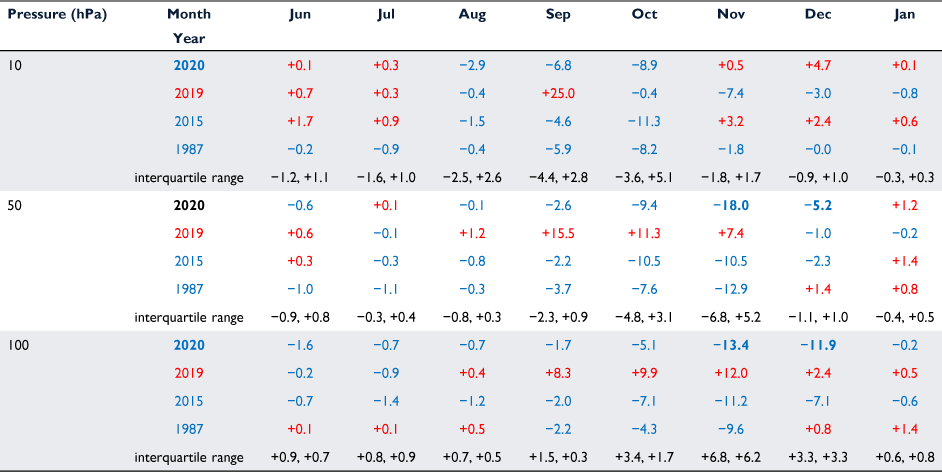
There was generally a mixture of warm and cold anomalies in the lower stratosphere during June and July that primarily gave way to cold conditions from August onwards (Supplementary Fig. S3). This is shown quantitatively in Table 2, where the monthly mean temperature anomalies are provided from the ERA5 reanalysis at three pressure levels. From June to August, at 50 hPa where significant PSC formation normally occurs, temperatures were not particularly outside of the long-term mean. However, record low average temperatures were set in November and December at 50 and 100 hPa.
Table 2 also provides monthly temperature anomalies for other selected years. Shown are conditions for 2019, which was notable for having a strongly disturbed and warm polar vortex (Klekociuk et al. 2021), and 2015 and 1987, that along with 2020, stand out as having the lowest September–November average temperature in the polar cap at 50 hPa since 1979. Similar to 2020, both 2015 and 1987 also showed a strong descending cold anomaly in the lower stratosphere, and a descending warm anomaly in the upper stratosphere. In particular, 2015 showed a very similar evolution of stratospheric temperature anomalies from winter to summer as in 2020, in addition to a similar evolution of ozone hole metrics which can be seen in the panels of Fig. 2 (Tully et al. 2019). These specific comparison years are discussed further in Section 3.6.
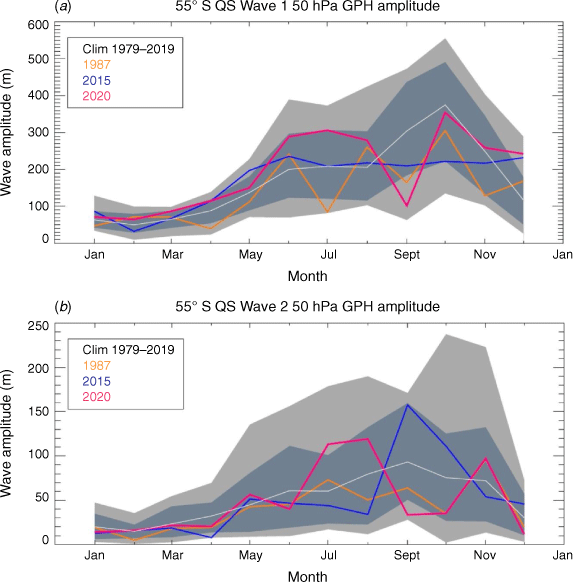
A key feature of 2020 was that the amplitude of quasi-stationary Rossby waves at the edge of the vortex showed reduced amplitudes in early spring (Fig. 7). For example, zonal wave number 1 at 55°S and 50 hPa (Fig. 7a) which was above the climatological mean in winter, was anomalously low in September. Zonal wave number 2 in this region (Fig. 7b) showed a similar reduction from winter to spring. More detail on the large-scale upward wave driving in the stratosphere is shown by the pressure–time cross section of eddy heat flux over the polar cap shown in Supplementary Fig. S5, and the horizontal wave flux shown in Supplementary Fig. S6.
|
As noted above, polar cap temperature averages for the winter months (June–August) were near average at 50 and 10 hPa, although at 100 hPa they were relatively low compared with the interquartile range (Table 2). Both Fig. 5a and Supplementary Fig. S3 indicate that, on shorter timescales, extreme low temperatures began to appear in the upper levels primarily from mid-winter and then tended to move down in altitude over the following months. Despite these temperature patterns, there were evidently some episodes of upward wave activity in the polar cap during winter (Supplementary Fig. S5) and stationary wave activity outside the vortex was generally above average (Fig. 7). Depending on the strength of the meridional temperature gradient between the polar cap and lower latitudes, the development of low temperatures in the upper vortex would tend to enhance the resilience of the vortex to the action of poleward wave activity. This could potentially occur through promotion of wave reflection and refraction (for example, Tung and Lindzen 1979) by the enhanced zonal jet at the equatorward edge of the vortex (Supplementary Fig. S4b), or dynamical forcing of diabatic descent in the vortex (Haynes et al. 1991). The cooling by subsequent ozone loss in spring would tend to reinforce the resilience of the vortex to wave action. However, the potential relationship of the winter vortex conditions to the anomalously stable situation that followed in spring is unclear and further work on this aspect is needed.
So why was the poleward wave driving weak in the early spring of 2020, which seems to be a contributing factor in the strong vortex conditions and resultant persistent ozone depletion that occurred at that time? Strong stratospheric vortex conditions in the southern hemisphere have been observed in connection with particular phases of the major climate modes. Importantly, the QBO tends to favour supressed poleward wave flux when it is in a westerly phase, and in the southern hemisphere this tends to promote colder winter temperatures in the polar stratosphere and a longer-lasting vortex (Baldwin and Dunkerton 1998). A similar, though stronger, influence of the westerly QBO phase is also seen for the northern hemisphere vortex (Holton and Tan 1980; Anstey and Shepherd 2014; Baldwin et al. 2021). Additionally, in the southern hemisphere, weak upward wave flux in winter and spring is favoured by La Niña or neutral ENSO conditions (Brahmananda Rao et al. 2004). A strong polar vortex is a characteristic of positive stratospheric SAM conditions, and this tends to be reinforced by positive tropospheric SAM conditions (Thompson et al. 2005). In the austral winter of 2020, the QBO transitioned from easterly to westerly conditions (NASA 2020), while as noted above, the ENSO was developing into La Niña conditions. The tropospheric SAM transitioned from the positive phase in May and June to negative conditions which reached a minimum of −2.2 standard deviations in September. Subsequently, the tropospheric SAM was positive from October through to the following February with a maximum of +2.3 standard deviations in December (BAS 2021). In general, the relevant climate mode indicators (QBO, ENSO, IOD and tropospheric SAM) were all unremarkable in terms of the magnitude of their indices compared with other extremes of recent years. Countering this, the stratospheric SAM in the spring and summer of 2020 was anomalously positive, in contrast to the strongly negative phase in 2019 (Supplementary Fig. S7).
An additional factor for the strong vortex is conceivably the timing of the shift of the QBO to the westerly phase (which occurred in August–September) and the appearance of La Niña ENSO surface conditions, both of which would be expected to suppress extra-tropical wave forcing of the vortex in spring–summer (Yang et al. 2018). We further discuss the relationship with the prevailing QBO and ENSO state in Section 3.6 below.
3.5. Comparison of ozone hole metrics
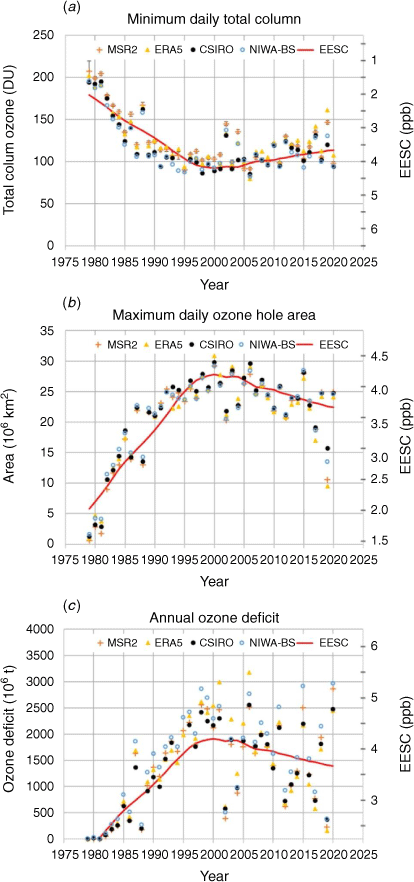
Fig. 8 shows a time series of the annual values of the ozone hole minimum total column value (Metric 4 of Table 1, Fig. 8a), the maximum ozone hole area (Metric 1; Fig. 8b) and the total annual ozone hole ozone mass deficit (Metric 6; Fig. 8c). Shown are values obtained by CSIRO, well as metrics obtained from MSR2, ERA5 and NIWA–BS total column ozone data (see Appendix A of Klekociuk et al. (2021) for details on the method used). The level of agreement between the different data sets in any particular year generally provides an indication of the uncertainty in each metric, particularly in years when the ozone hole is well exposed to the sunlight needed to make the underlying observations (generally from late September when the full polar cap is exposed). The annual mass deficit metric (Fig. 8c) has the largest relative difference across the data sets which likely reflects compounding effects of potential biases in total column values and ozone hole area. Also shown in each panel is the regression of the CSIRO metric to the Antarctic Equivalent Effective Stratospheric Chlorine (EESC) mixing ratio using data updated from Fraser et al. (2014). The regressions show the simple expectation of the relatively slow time progression of each metric under the assumption of a linear dependence with EESC. The fraction of variance explained by each regression is 53% for the minimum total column ozone metric (Fig. 8a), 65% for the maximum area metric (Fig. 8b) and 35% for the annual ozone mass deficit metric (Fig. 8c). Meteorological conditions strongly influence the variability of chemical ozone loss (Langematz et al. 2018), and a large fraction of the year-to-year variability in the ozone hole metrics is determined by the thermal state of the vortex (Tully et al. 2020) which was not taken into account in the regressions discussed above. Fig. 8c highlights that the value of the annual ozone mass deficit metric in 2020 was well-displaced from the expectation of the regression model, and strongly contrasted with the unusually low value in 2019. Other years that appear well above the regression curve (Fig. 8c) include 1987, 1998, 2001, 2006, 2011 and 2015.
|
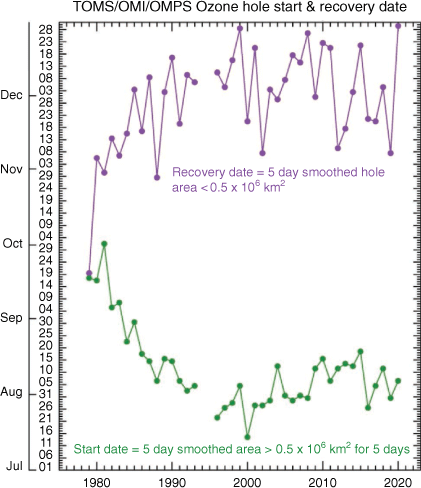
Fig. 9 shows the long-term time series of the annual ozone hole start and recovery date. For the period up to the mid-1990s, there was a tendency for the ozone hole to form earlier and end later in subsequent years. Since that period, the apparent trend in both dates tended to stabilise or slightly reversed toward the situation that occurred in the late-1980s. The recovery date (Metric 8 of Table 1) shows inter-annual variability of approximately 1–2 months, which is related to the year-to-year variability in the timing of the final stratospheric warming. Notably, the recovery date in 2020 was latest observed in our analysis, and similar to the timing in 2008 and 1999.
|
3.6. Links to southern hemisphere climate
As shown by several studies, the strength of the Antarctic vortex in spring has a bearing on surface climate in the southern hemisphere during late spring and summer (Polvani et al. 2011; Thompson et al. 2011; Lim et al. 2018; Kwon et al. 2020), with influences on the SAM leading to effects on surface temperature, precipitation, winds and sea ice. Lim et al. (2018) defined a stratosphere–troposphere (S–T) coupled mode index to measure the strength of the downward influence from the Antarctic polar vortex on near-surface circulation (Supplementary Fig. S8). The index measures the variance of the progressive downward deceleration in the zonal wind over 55–65°S as upward propagating Rossby waves deposit westward momentum in the polar night jet. Years of strong (weak) jet strength are characterised by negative (positive) values of the index.
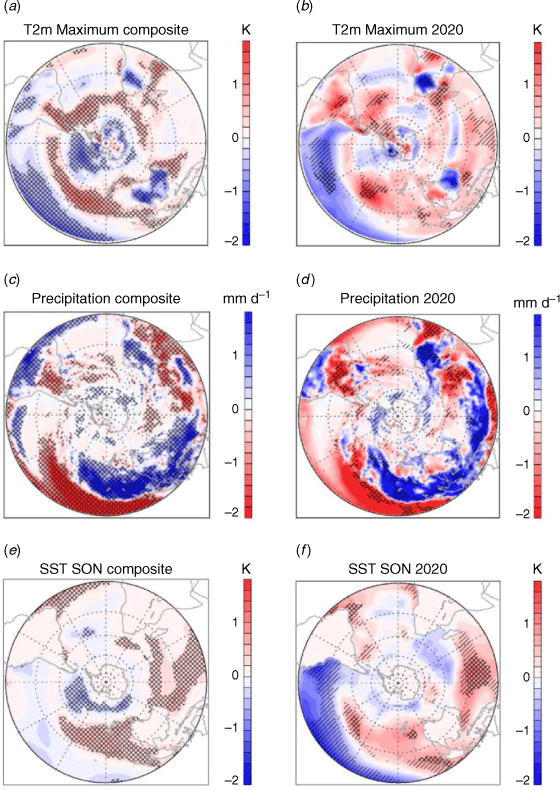
Fig. 10 compares surface climate conditions in 2020 with other strong vortex years, taking into consideration the ENSO phase. Fig. 10a shows the difference in mean composites for maximum daily 2 m (surface) air temperature anomaly (relative to the 1979–2016 climatology) averaged over November–February between the strong vortex years since 1979 with summer La Niña conditions (1998, 1999, 2008, 2010, 2011 and 2018 but excluding 2020) and the neutral vortex years (i.e. those years with S–T coupled mode index intermediate between the strong and weak thresholds). Lim et al. (2018) showed that the S–T coupling tends to maximise near the surface over the spring–summer period, and specifically considered the October–January period when examining the surface coupling. We show here analysis for the period November–February to account for the later descent of the coupling when the vortex is strong.
|
In Fig. 10, regions of significant cold (blue) anomalies occur over the Amundsen–Bellingshausen Sea region in the Pacific Ocean sector near Antarctica, in most of coastal Antarctica, in the sub-tropics of the Pacific Ocean and South America, and over Australia and the mid-latitudes of Africa. Significant warm (red) anomalies occur in central Antarctica, to the east of the Antarctic Peninsula, and the mid-latitudes of the oceans and South America. Similarities are apparent between Fig. 10a, b, which shows the situation for 2020 (with the composite for neutral vortex years subtracted). The notable exceptions to this are the lack of significant cold anomalies in eastern Australia and generally more extensive warm anomaly in the sub-tropical Indian Ocean.
The situation for precipitation is shown in Fig. 10c, d. Strong vortex conditions (Fig. 10c) tend to show a southward shift in wet (blue) anomalies at low- to mid-latitudes in the Australian sector, which is generally consistent with the behaviour seen for the positive SAM phase (Thompson et al. 2011). Over Australia, the southward shift in precipitation is associated with increased cloudiness, which reduces surface heating. In 2020 (Fig. 10d), largely similar patterns can be seen for the strong vortex years, except for dry (red) anomalies in eastern Australia where a warm anomaly is apparent in Fig. 10b. We also examined the situation for October–January (not shown) – the patterns were generally similar to those seen in Fig. 10a–d, although East Antarctica was markedly warmer, which suggests that the S–T coupling over this period was overall weaker.
Fig. 10e, f show September to November SST anomaly patterns for the La Niña strong vortex years and 2020, respectively (where the mean pattern for the neutral vortex years has been subtracted). In the spring of 2020, warm SST anomalies occurred broadly across the extra-tropical ocean (Fig. 10f). The warm anomalies were enhanced relative to the composite pattern (Fig. 10e) across various regions of the mid- and high-latitude ocean.
Overall, the surface climate patterns in the summer of 2020/2021 shown in Fig. 10b, d appear consistent with corresponding composite patterns for the strong vortex years. However, a particular difference is the warm anomaly in eastern Australia where otherwise cool conditions would tend to be favoured if downward coupling from the strong vortex was a key determinant. We cannot find a particular explanation for this but it potentially indicates that regional climate effects in that area dominated over previously seen effects of the coupling.
4. Summary and conclusions
We analysed the characteristics of the 2020 Antarctic ozone hole using a variety of ground-based, in situ, remote sensing and meteorological reanalysis data. The 2020 ozone hole reached a maximum area in October that was the 15th largest in our analysis spanning the 42 years from 1979. The maximum area was generally consistent with, though slightly above, the expectation based on regression of the ozone hole area metric with EESC since 2000 (around the time of the peak ozone hole size), and was in strong contrast to the anomalously small ozone hole in 2019. The minimum observed total column ozone value over the southern polar cap was 8th smallest in our analysis, and similar to values in other years of strong ozone depletion in the past three decades. The annual integrated ozone mass deficit was the second largest in our analysis, surpassed only by the value observed in 2006.
A notable feature of the 2020 ozone hole was its unusually large and persistent size during November and December, which set new observational records, including the latest breakdown date (28 December). In general, these features were also in common with the ozone hole of 2015 (Tully et al. 2019). The persistence and amount of ozone depletion in the early summer of 2020 was a key factor that produced anomalously high surface UVR levels in coastal East Antarctica at that time.
We found that the Antarctic stratosphere was anomalously cold in November and December 2020 which generally occurred at the time of reduced Rossby wave activity at lower latitudes. However, the overall mechanism responsible for the anomalous conditions in November and December 2020 is unclear and requires further investigation. As we noted, the weak Rossby wave activity in spring may have been influenced by the prevailing climatic conditions, most notably the transition of the QBO to a westerly phase, the development of La Niña conditions in the Pacific Ocean and the tendency for the tropospheric SAM to be in a positive state as the ozone hole began to form. However, none of these conditions in isolation appears to have had a determining influence on the polar atmosphere, particularly as the QBO and ENSO indices were unremarkable compared with other years in which the Antarctic vortex was similarly strong.
During the winter, cold anomalies occurred in the upper stratosphere over the polar cap and tended to move down in altitude and intensify, reaching the lower stratosphere during the latter part of the year. Additionally, the horizontal wave activity flux in the lowermost stratosphere at southern mid-latitudes in spring was generally directed equatorward. Taken together, these aspects suggest that processes governing diabatic descent in the vortex and their effect on the propagation of Rossby waves near or within the vortex, and their potential for interaction with the prevailing conditions set by the large-scale climate modes, deserve further study.
The strong positive state of the tropospheric SAM that occurred until early summer in 2020, and which was potentially enhanced by the anomalous strength of the polar vortex, affected climate patterns across large areas of the southern hemisphere. Specific effects consistent with those occurring in other years having strong vortex conditions were the appearance of warm anomalies in the Antarctic Peninsula and southern South America, and cool anomalies in the Amundsen–Bellingshausen Sea near Antarctica, coastal East Antarctica and in the western part of Australia.
It is clear that the 2019/2020 Australian wildfires affected the extratropical stratosphere of the southern hemisphere during 2020 (Allen et al. 2020; Khaykin et al. 2020; Schwartz et al. 2020; Yu et al. 2021). The anomalously high ClONO2 total column abundances reported here for Scott Base at the start of 2020 winter may indicate that enhanced early heterogeneous ozone depletion associated with effects of the wildfire smoke occurred at high southern latitudes. Although we have not attempted to demonstrate effects from the 2019/2020 fires on the ozone hole in 2020, further studies are needed to examine possible effects of heterogeneous chemistry and radiative heating associated with the smoke aerosols on the state of the polar vortex and ozone hole in 2020.
Data availability
The data that support this study are available in the article. The TOMS, OMI and OMPS data used in this study were provided by the National Aeronautics and Space Administration (NASA) Goddard Space Flight Center, Atmospheric Chemistry & Dynamics Branch, Code 613.3. The ERA5 reanalysis data were obtained from the Copernicus Climate Data Store (URL: https://cds.climate.copernicus.eu/). Extended Reconstructed SST dataset version 5 data were obtained from The National Centers for Environmental Information (https://www.ncei.noaa.gov/products/extended-reconstructed-sst). The OMI overpass and MSR2 data were obtained from the European Space Agency Tropospheric Emission Monitoring Internet Service (TEMIS; URL: https://www.temis.nl/protocols/o3col/overpass_omi.php and https://www.temis.nl/protocols/O3global.php, respectively). Davis, Macquarie Island and Broadmeadows ozonesonde measurements are available from the World Ozone and Ultraviolet Radiation Data Centre (URL: https://woudc.org). Arrival Heights and Scott Base measurements are available from the Network for the Detection of Atmospheric Composition Change (URL: https://www.ndaccdemo.org/). Part of this work was performed for Projects 4293 and 4115 of the Australian Antarctic Science program.
Conflicts of interest
The authors declare no conflicts of interest.
Declaration of funding
This research did not receive any specific funding.
Supplementary material
Supplementary material is available online.
Acknowledgements
We acknowledge the Australian Government Department of Agriculture, Water and the Environment for support of this work, and the assistance of the following people: Jeff Ayton and the Australian Antarctic Division’s Antarctic Medical Practitioners in collecting the solar UV data, BoM staff in collecting surface and upper air measurements at Cape Grim (used for EESC calculations), Macquarie Island and Davis, and Antarctica New Zealand expeditioners in collecting measurements at Arrival Heights and Scott Base. Measurements at Arrival Heights and Scott Base are core-funded by the National Institute of Water & Atmospheric Research (NIWA) through New Zealand’s Ministry of Business, Innovation and Employment.
References
Allen DR, Fromm MD, Kablick GP III, Nedoluha GE (2020) Smoke with Induced Rotation and Lofting (SWIRL) in the Stratosphere. Journal of the Atmospheric Sciences 77, 4297–4316.| Smoke with Induced Rotation and Lofting (SWIRL) in the Stratosphere.Crossref | GoogleScholarGoogle Scholar |
Anstey JA, Shepherd TG (2014) High-latitude influence of the quasi-biennial oscillation. Quarterly Journal of the Royal Meteorological Society 140, 1–21.
| High-latitude influence of the quasi-biennial oscillation.Crossref | GoogleScholarGoogle Scholar |
Anstey JA, Banyard TP, Butchart N, Coy L, Newman PA, Osprey S, Wright CJ (2021) Prospect of increased disruption to the QBO in a changing climate. Geophysical Research Letters 48, e2021GL093058
| Prospect of increased disruption to the QBO in a changing climate.Crossref | GoogleScholarGoogle Scholar |
Baldwin MP, Dunkerton TJ (1998) Quasi-biennial modulation of the southern hemisphere stratospheric polar vortex. Geophysical Research Letters 25, 3343–3346.
| Quasi-biennial modulation of the southern hemisphere stratospheric polar vortex.Crossref | GoogleScholarGoogle Scholar |
Baldwin MP, Ayarzagüena B, Thomas B, Neal B, Butler AH, Charlton‐Perez AJ, Daniela IVD, Garfinkel CI, Garny H, Gerber EP, Hegglin MI, Langematz U, Pedatella NM (2021) Sudden Stratospheric Warmings. Reviews of Geophysics 59, e2020RG000708
| Sudden Stratospheric Warmings.Crossref | GoogleScholarGoogle Scholar |
BAS (British Antarctic Survey) (2021) An observation-based Southern Hemisphere Annular Mode Index. Available at http://www.nerc-bas.ac.uk/icd/gjma/sam.html [Accessed 14 May 2021]
Bodeker GE, Kremser S (2021) Indicators of Antarctic ozone depletion: 1979 to 2019. Atmospheric Chemistry and Physics 21, 5289–5300.
| Indicators of Antarctic ozone depletion: 1979 to 2019.Crossref | GoogleScholarGoogle Scholar |
Bodeker GE, Shiona H, Eskes H (2005) Indicators of Antarctic ozone depletion. Atmospheric Chemistry and Physics 5, 2603–2615.
| Indicators of Antarctic ozone depletion.Crossref | GoogleScholarGoogle Scholar |
Bodeker GE, Nitzbon J, Tradowsky JS, Kremser S, Schwertheim A, Lewis J (2021) A Global Total Column Ozone Climate Data Record. Earth System Science Data 13, 3885–3906.
| A Global Total Column Ozone Climate Data Record.Crossref | GoogleScholarGoogle Scholar |
Brahmananda Rao V, Fernandez JPR, Franchito SH (2004) Quasi-stationary waves in the Southern Hemisphere during El Niño and La Niña events. Annales Geophysicae 22, 789–806.
| Quasi-stationary waves in the Southern Hemisphere during El Niño and La Niña events.Crossref | GoogleScholarGoogle Scholar |
Butler AH, Sjoberg JP, Seidel DJ, Rosenlof KH (2017) A sudden stratospheric warming compendium. Earth System Science Data 9, 63–76.
| A sudden stratospheric warming compendium.Crossref | GoogleScholarGoogle Scholar |
Chipperfield MP, Bekki S, Dhomse S, Harris NRP, Hassler B, Hossaini R, Steinbrecht W, Thiéblemont R, Weber M (2017) Detecting recovery of the stratospheric ozone layer. Nature 549, 211–218.
| Detecting recovery of the stratospheric ozone layer.Crossref | GoogleScholarGoogle Scholar | 28905899PubMed |
De Mazière M, Thompson AM, Kurylo MJ, Wild JD, Bernhard G, Blumenstock T, Braathen GO, Hannigan JW, Lambert JC, Leblanc T, McGee TJ, Nedoluha G, Petropavlovskikh I, Seckmeyer G, Simon PC, Steinbrecht W, Strahan SE (2018) The Network for the Detection of Atmospheric Composition Change (NDACC): history, status and perspectives. Atmospheric Chemistry and Physics 18, 4935–4964.
| The Network for the Detection of Atmospheric Composition Change (NDACC): history, status and perspectives.Crossref | GoogleScholarGoogle Scholar |
Dhomse SS, Kinnison D, Chipperfield MP, Salawitch RJ, Cionni I, Hegglin MI, Abraham NL, Akiyoshi H, Archibald AT, Bednarz EM, Bekki S, Braesicke P, Butchart N, Dameris M, Deushi M, Frith S, Hardiman SC, Hassler B, Horowitz LW, Hu RM, Jöckel P, Josse B, Kirner O, Kremser S, Langematz U, Lewis J, Marchand M, Lin M, Mancini E, Marécal V, Michou M, Morgenstern O, O’Connor FM, Oman L, Pitari G, Plummer DA, Pyle JA, Revell LE, Rozanov E, Schofield R, Stenke A, Stone K, Sudo K, Tilmes S, Visioni D, Yamashita Y, Zeng G (2018) Estimates of ozone return dates from Chemistry-Climate Model Initiative simulations. Atmospheric Chemistry and Physics 18, 8409–8438.
| Estimates of ozone return dates from Chemistry-Climate Model Initiative simulations.Crossref | GoogleScholarGoogle Scholar |
ESA (European Space Agency) (2021) Tropospheric Emission Monitoring Service (TEMIS) ozone overpas data based on OMI. Available at https://www.temis.nl/protocols/o3col/overpass_omi.php [Accessed 14 May 2021]
Fraser P, Krummel P, Steele P, Trudinger C, Etheridge D, O’Doherty S, Simmonds P, Miller B, Mühle J, Weiss R, Oram D, Prinn R, Wang R (2014) Equivalent effective stratospheric chlorine from Cape Grim Air Archive, Antarctic firn and AGAGE global measurements of ozone depleting substances. In ‘Baseline Atmospheric Program (Australia) 2009‐2010’. (Eds N Derek, P Krummel, S Cleland) pp. 17–23. (Australian Bureau of Meteorology and CSIRO Marine and Atmospheric Research: Melbourne, Australia)
Haynes PH, McIntyre ME, Shepherd TG, Marks CJ, Shine KP (1991) On the “Downward Control” of Extratropical Diabatic Circulations by Eddy-Induced Mean Zonal Forces. Journal of Atmospheric Sciences 48, 651–678.
| On the “Downward Control” of Extratropical Diabatic Circulations by Eddy-Induced Mean Zonal Forces.Crossref | GoogleScholarGoogle Scholar |
Hersbach H, Bell B, Berrisford P, Hirahara S, Horányi A, Muñoz-Sabater J, Nicolas J, Peubey C, Radu R, Schepers D, Simmons A, Soci C, Abdalla S, Abellan X, Balsamo G, Bechtold P, Biavati G, Bidlot J, Bonavita M, De Chiara G, Dahlgren P, Dee D, Diamantakis M, Dragani R, Flemming J, Forbes R, Fuentes M, Geer A, Haimberger L, Healy S, Hogan RJ, Hólm E, Janisková M, Keeley S, Laloyaux P, Lopez P, Lupu C, Radnoti G, de Rosnay P, Rozum I, Vamborg F, Villaume S, Thépaut J-N (2020) The ERA5 global reanalysis. , 146, 1999–2049.
| The ERA5 global reanalysis.Crossref | GoogleScholarGoogle Scholar |
Holton JR, Tan H-C (1980) The Influence of the Equatorial Quasi-Biennial Oscillation on the Global Circulation at 50 mb. Journal of Atmospheric Sciences 37, 2200–2208.
| The Influence of the Equatorial Quasi-Biennial Oscillation on the Global Circulation at 50 mb.Crossref | GoogleScholarGoogle Scholar |
Hu Y, Tian W, Zhang J, Wang T, Xu M (2021) Weakening of Antarctic Stratospheric Planetary Wave Activities in Early Austral Spring Since the Early 2000s: A Response to Sea Surface Temperature Trends. Atmospheric Chemistry and Physics Discussions 2021, 1–53.
Jucker M, Reichler T, Waugh DW (2021) How Frequent Are Antarctic Sudden Stratospheric Warmings in Present and Future Climate? Geophysical Research Letters 48, e2021GL093215
| How Frequent Are Antarctic Sudden Stratospheric Warmings in Present and Future Climate?Crossref | GoogleScholarGoogle Scholar |
Kablick III GP, Allen DR, Fromm MD, Nedoluha GE (2020) Australian PyroCb Smoke Generates Synoptic-Scale Stratospheric Anticyclones. Geophysical Research Letters 47, e2020GL088101
| Australian PyroCb Smoke Generates Synoptic-Scale Stratospheric Anticyclones.Crossref | GoogleScholarGoogle Scholar |
Kang MJ, Chun HY (2021) Contributions of equatorial planetary waves and small-scale convective gravity waves to the 2019/20 QBO disruption. Atmospheric Chemistry and Physics Discussions 2021, 1–33.
Kanzawa H, Kawaguchi S (1990) Large stratospheric sudden warming in Antarctic late winter and shallow ozone hole in 1988. Geophysical Research Letters 17, 77–80.
| Large stratospheric sudden warming in Antarctic late winter and shallow ozone hole in 1988.Crossref | GoogleScholarGoogle Scholar |
Khaykin S, Legras B, Bucci S, Sellitto P, Isaksen L, Tencé F, Bekki S, Bourassa A, Rieger L, Zawada D, Jumelet J, Godin-Beekmann S (2020) The 2019/20 Australian wildfires generated a persistent smoke-charged vortex rising up to 35 km altitude. Communications Earth & Environment 1, 22
| The 2019/20 Australian wildfires generated a persistent smoke-charged vortex rising up to 35 km altitude.Crossref | GoogleScholarGoogle Scholar |
Klekociuk AR, Tully MB, Krummel PB, Gies HP, Petelina SV, Alexander SP, Deschamps LL, Fraser PJ, Henderson SI, Javorniczky J, Shanklin JD, Siddaway JM, Stone KA (2014) The Antarctic ozone hole during 2011. Australian Meteorological and Oceanographic Journal 64, 293–311.
| The Antarctic ozone hole during 2011.Crossref | GoogleScholarGoogle Scholar |
Klekociuk AR, Tully MB, Krummel PB, Henderson SI, Smale D, Querel R, Nichol S, Alexander SP, Fraser PJ, Nedoluha G (2021) The Antarctic ozone hole during 2018 and 2019. Journal of Southern Hemisphere Earth Systems Science 71, 66–91.
| The Antarctic ozone hole during 2018 and 2019.Crossref | GoogleScholarGoogle Scholar |
Kohlhepp R, Ruhnke R, Chipperfield MP, De Mazière M, Notholt J, Barthlott S, Batchelor RL, Blatherwick RD, Blumenstock T, Coffey MT, Demoulin P, Fast H, Feng W, Goldman A, Griffith DWT, Hamann K, Hannigan JW, Hase F, Jones NB, Kagawa A, Kaiser I, Kasai Y, Kirner O, Kouker W, Lindenmaier R, Mahieu E, Mittermeier RL, Monge-Sanz B, Morino I, Murata I, Nakajima H, Palm M, Paton-Walsh C, Raffalski U, Reddmann T, Rettinger M, Rinsland CP, Rozanov E, Schneider M, Senten C, Servais C, Sinnhuber BM, Smale D, Strong K, Sussmann R, Taylor JR, Vanhaelewyn G, Warneke T, Whaley C, Wiehle M, Wood SW (2012) Observed and simulated time evolution of HCl, ClONO2, and HF total column abundances. Atmospheric Chemistry and Physics 12, 3527–3556.
| Observed and simulated time evolution of HCl, ClONO2, and HF total column abundances.Crossref | GoogleScholarGoogle Scholar |
Kramarova N, Newman PA, Nash ER, Strahan SE, Long CS, Johnson B, Pitts M, Santee ML, Petropavlovskikh I, Coy L, de Laat J (2020) 2019 Antarctic ozone hole [in “State of the Climate in 2019”]. Bulletin of the American Meteorological Society 101, S310–S312.
Krummel PB, Klekociuk AR, Tully MB, Gies HP, Alexander SP, Fraser PJ, Henderson SI, Schofield R, Shanklin JD, Stone KA (2019) The Antarctic ozone hole during 2014. Journal of Southern Hemisphere Earth Systems Science 69, 1–15.
| The Antarctic ozone hole during 2014.Crossref | GoogleScholarGoogle Scholar |
Kwon H, Choi H, Kim B-M, Kim S-W, Kim S-J (2020) Recent weakening of the southern stratospheric polar vortex and its impact on the surface climate over Antarctica. Environmental Research Letters 15, 094072
| Recent weakening of the southern stratospheric polar vortex and its impact on the surface climate over Antarctica.Crossref | GoogleScholarGoogle Scholar |
Langematz U, Kunze M (2006) An update on dynamical changes in the Arctic and Antarctic stratospheric polar vortices. Climate Dynamics 27, 647–660.
| An update on dynamical changes in the Arctic and Antarctic stratospheric polar vortices.Crossref | GoogleScholarGoogle Scholar |
Langematz U, Tully M, Calvo N, Dameris M, Laat J, Klekociuk A, Müller R, Young P (2018) Polar Stratospheric Ozone: Past, Present, and Future Chapter 4 in Scientific Assessment of Ozone Depletion: 2018, Global Ozone Research and Monitoring Project-Report No. 58, World Meteorological Organization, Geneva, Switzerland.
Lim EP, Hendon HH, Thompson DWJ (2018) Seasonal Evolution of Stratosphere-Troposphere Coupling in the Southern Hemisphere and Implications for the Predictability of Surface Climate. Journal of Geophysical Research: Atmospheres 123, 12,002–12,016.
| Seasonal Evolution of Stratosphere-Troposphere Coupling in the Southern Hemisphere and Implications for the Predictability of Surface Climate.Crossref | GoogleScholarGoogle Scholar |
Lim E-P, Hendon HH, Butler AH, Thompson DWJ, Lawrence Z, Scaife AA, Shepherd TG, Polichtchouk I, Nakamura H, Kobayashi C, Comer R, Coy L, Dowdy A, Garreaud RD, Newman PA, Wang G (2021) The 2019 Southern Hemisphere stratospheric polar vortex weakening and its impacts. Bulletin of the American Meteorological Society 102, E1150–E1171.
| The 2019 Southern Hemisphere stratospheric polar vortex weakening and its impacts.Crossref | GoogleScholarGoogle Scholar |
Milinevsky G, Evtushevsky O, Klekociuk A, Wang Y, Grytsai A, Shulga V, Ivaniha O (2020) Early indications of anomalous behaviour in the 2019 spring ozone hole over Antarctica. International Journal of Remote Sensing 41, 7530–7540.
| Early indications of anomalous behaviour in the 2019 spring ozone hole over Antarctica.Crossref | GoogleScholarGoogle Scholar |
NASA (National Aeronautics and Atmospheric Administration) (2020) Goddard Spaceflight Center Atmospheric Chemistry and Dynamics Laboratory (Code 614) – The Quasi-Biennial Oscillation (QBO). Available at https://acd-ext.gsfc.nasa.gov/Data_services/met/qbo/qbo.html [Accessed 14 May 2021]
NDACC (Network for the Detection of Atmospheric Composition Change) (2021) Stations. Available at http://www.ndaccdemo.org/stations [Accessed 25 october 2021]
Nedoluha GE, Connor BJ, Mooney T, Barrett JW, Parrish A, Gomez RM, Boyd I, Allen DR, Kotkamp M, Kremser S, Deshler T, Newman P, Santee ML (2016) 20 years of ClO measurements in the Antarctic lower stratosphere. Atmospheric Chemistry and Physics 16, 10725–10734.
| 20 years of ClO measurements in the Antarctic lower stratosphere.Crossref | GoogleScholarGoogle Scholar |
Newman PA, Nash ER (2005) The Unusual Southern Hemisphere Stratosphere Winter of 2002. Journal of the Atmospheric Sciences 62, 614–628.
| The Unusual Southern Hemisphere Stratosphere Winter of 2002.Crossref | GoogleScholarGoogle Scholar |
Newman PA, Kawa SR, Nash ER (2004) On the size of the Antarctic ozone hole. Geophysical Research Letters 31, L21104
| On the size of the Antarctic ozone hole.Crossref | GoogleScholarGoogle Scholar |
NOAA (National Oceanic and Atmospheric Administration) (2021) Teleconnection Pattern Calculation Procedures. Available at https://www.cpc.ncep.noaa.gov/products/precip/CWlink/daily_ao_index/history/method.shtml [Accessed 14 May 2021]
Pitts MC, Poole LR, Gonzalez R (2018) Polar stratospheric cloud climatology based on CALIPSO spaceborne lidar measurements from 2006 to 2017. Atmospheric Chemistry and Physics 18, 10881–10913.
| Polar stratospheric cloud climatology based on CALIPSO spaceborne lidar measurements from 2006 to 2017.Crossref | GoogleScholarGoogle Scholar |
Polvani LM, Waugh DW, Correa GJP, Son S-W (2011) Stratospheric Ozone Depletion: The Main Driver of Twentieth-Century Atmospheric Circulation Changes in the Southern Hemisphere. Journal of Climate 24, 795–812.
| Stratospheric Ozone Depletion: The Main Driver of Twentieth-Century Atmospheric Circulation Changes in the Southern Hemisphere.Crossref | GoogleScholarGoogle Scholar |
Rao J, Garfinkel CI, White IP, Schwartz C (2020) The Southern Hemisphere Minor Sudden Stratospheric Warming in September 2019 and its Predictions in S2S Models. Journal of Geophysical Research: Atmospheres 125, e2020JD032723
| The Southern Hemisphere Minor Sudden Stratospheric Warming in September 2019 and its Predictions in S2S Models.Crossref | GoogleScholarGoogle Scholar |
Robinson SA, Klekociuk AR, King DH, Pizarro Rojas M, Zúñiga GE, Bergstrom DM (2020) The 2019/2020 summer of Antarctic heatwaves. Global Change Biology 26, 3178–3180.
| The 2019/2020 summer of Antarctic heatwaves.Crossref | GoogleScholarGoogle Scholar | 32227664PubMed |
Schwartz MJ, Santee ML, Pumphrey HC, Manney GL, Lambert A, Livesey NJ, Millán L, Neu JL, Read WG, Werner F (2020) Australian New Year’s PyroCb Impact on Stratospheric Composition. Geophysical Research Letters 47, e2020GL090831
| Australian New Year’s PyroCb Impact on Stratospheric Composition.Crossref | GoogleScholarGoogle Scholar |
Smith KL, Polvani LM (2017) Spatial patterns of recent Antarctic surface temperature trends and the importance of natural variability: lessons from multiple reconstructions and the CMIP5 models. Climate Dynamics 48, 2653–2670.
| Spatial patterns of recent Antarctic surface temperature trends and the importance of natural variability: lessons from multiple reconstructions and the CMIP5 models.Crossref | GoogleScholarGoogle Scholar |
Solomon S, Garcia RR, Rowland FS, Wuebbles DJ (1986) On the depletion of Antarctic ozone. Nature 321, 755–758.
| On the depletion of Antarctic ozone.Crossref | GoogleScholarGoogle Scholar |
Solomon S, Bandoro J, Kinnison D, Garcia R (2015) Simulation of polar ozone depletion: An update. Journal of Geophysical Research D: Atmospheres 120, 7958–7974.
| Simulation of polar ozone depletion: An update.Crossref | GoogleScholarGoogle Scholar |
Stone KA, Solomon S, Kinnison DE, Pitts MC, Poole LR, Mills MJ, Schmidt A, Neely Iii RR, Ivy D, Schwartz MJ, Vernier J-P, Johnson BJ, Tully MB, Klekociuk AR, König-Langlo G, Hagiya S (2017) Observing the Impact of Calbuco Volcanic Aerosols on South Polar Ozone Depletion in 2015. Journal of Geophysical Research: Atmospheres 122, 11,862–11,879.
| Observing the Impact of Calbuco Volcanic Aerosols on South Polar Ozone Depletion in 2015.Crossref | GoogleScholarGoogle Scholar |
Takaya K, Nakamura H (2001) A Formulation of a Phase-Independent Wave-Activity Flux for Stationary and Migratory Quasigeostrophic Eddies on a Zonally Varying Basic Flow. Journal of the Atmospheric Sciences 58, 608–627.
| A Formulation of a Phase-Independent Wave-Activity Flux for Stationary and Migratory Quasigeostrophic Eddies on a Zonally Varying Basic Flow.Crossref | GoogleScholarGoogle Scholar |
Thompson PM, Grosbois V (2002) Effects of climate variation in seabird population dynamics. Direct Science 1, 50–52.
| Effects of climate variation in seabird population dynamics.Crossref | GoogleScholarGoogle Scholar |
Thomson DWJ, Solomon S (2002) Interpretation of recent southern hemisphere climate change. Science 296, 895–899.
| Interpretation of recent southern hemisphere climate change.Crossref | GoogleScholarGoogle Scholar |
Thompson DWJ, Baldwin MP, Solomon S (2005) Stratosphere–Troposphere Coupling in the Southern Hemisphere. Journal of the Atmospheric Sciences 62, 708–715.
| Stratosphere–Troposphere Coupling in the Southern Hemisphere.Crossref | GoogleScholarGoogle Scholar |
Thompson DWJ, Solomon S, Kushner PJ, England MH, Grise KM, Karoly DJ (2011) Signatures of the Antarctic ozone hole in Southern Hemisphere surface climate change. Nature Geoscience 4, 741–749.
| Signatures of the Antarctic ozone hole in Southern Hemisphere surface climate change.Crossref | GoogleScholarGoogle Scholar |
Tritscher I, Pitts MC, Poole LR, Alexander SP, Cairo F, Chipperfield MP, Grooß JU, Höpfner M, Lambert A, Luo BP, Molleker S, Orr A, Salawitch R, Snels M, Spang R, Woiwode W, Peter T (2021) Polar Stratospheric Clouds Satellite Observations, Processes, and Role in Ozone Depletion. Reviews of Geophysics 59, e2020RG000702
| Polar Stratospheric Clouds Satellite Observations, Processes, and Role in Ozone Depletion.Crossref | GoogleScholarGoogle Scholar |
Tully MB, Klekociuk AR, Deschamps LL, Henderson SI, Krummel PB, Fraser PJ, Shanklin JD, Downey AH, Gies HP, Javorniczky J (2008) The 2007 Antarctic ozone hole. Austraian Meterological Magazine 57, 279–298.
Tully MB, Klekociuk AR, Alexander SP, Dargaville RJ, Deschamps LL, Fraser PJ, Gies HP, Henderson SI, Javorniczky J, Krummel PB, Petelina SV, Shanklin JD, Siddaway JM, Stone KA (2011) The Antarctic ozone hole during 2008 and 2009. Australian Meteorological and Oceanographic Journal 61, 77–90.
| The Antarctic ozone hole during 2008 and 2009.Crossref | GoogleScholarGoogle Scholar |
Tully M, Klekociuk A, Krummel P, Gies H, Alexander S, Fraser P, Henderson S, Schofield R, Shanklin J, Stone K (2019) The Antarctic ozone hole during 2015 and 2016. Journal of Southern Hemisphere Earth Systems Science 69, 16–28.
| The Antarctic ozone hole during 2015 and 2016.Crossref | GoogleScholarGoogle Scholar |
Tully MB, Krummel PB, Klekociuk AR (2020) Trends in Antarctic ozone hole metrics 2001-2017. Journal of Southern Hemisphere Earth Systems Science 69, 52–56.
| Trends in Antarctic ozone hole metrics 2001-2017.Crossref | GoogleScholarGoogle Scholar |
Tung KK, Lindzen RS (1979) A theory of stationary long waves. Part I: A simple theory of blocking. Monthly Weather Review 107, 714–734.
| A theory of stationary long waves. Part I: A simple theory of blocking.Crossref | GoogleScholarGoogle Scholar |
Turner J, Barrand NE, Bracegirdle TJ, Convey P, Hodgson DA, Jarvis M, Jenkins A, Marshall G, Meredith MP, Roscoe H, Shanklin J, French J, Goosse H, Guglielmin M, Gutt J, Jacobs S, Kennicutt MC, Masson-Delmotte V, Mayewski P, Navarro F, Robinson S, Scambos T, Sparrow M, Summerhayes C, Speer K, Klepikov A (2014) Antarctic climate change and the environment: an update. Polar Record 50, 237–259.
| Antarctic climate change and the environment: an update.Crossref | GoogleScholarGoogle Scholar |
Uchino O, Bojkov RD, Balis DS, Akagi K, Hayashi M, Kajihara R (1999) Essential characteristics of the Antarctic-Spring Ozone Decline: Update to 1998. Geophysical Research Letters 26, 1377–1380.
| Essential characteristics of the Antarctic-Spring Ozone Decline: Update to 1998.Crossref | GoogleScholarGoogle Scholar |
van der A RJ, Allaart MAF, Eskes HJ (2015) Extended and refined multi sensor reanalysis of total ozone for the period 1970–2012. Atmospheric Measurement Techniques 8, 3021–3035.
| Extended and refined multi sensor reanalysis of total ozone for the period 1970–2012.Crossref | GoogleScholarGoogle Scholar |
von Clarmann T, Johansson S (2018) Chlorine nitrate in the atmosphere. Atmospheric Chemistry and Physics 18, 15363–15386.
| Chlorine nitrate in the atmosphere.Crossref | GoogleScholarGoogle Scholar |
WOUDC (World Ozone and Ultraviolet Radiation Data Centre) (2021) Data Search/Download. Available at https://woudc.org/data/explore.php [Accessed 25 October 2021]
Xia Y, Xu W, Hu Y, Xie F (2020) Southern-Hemisphere high-latitude stratospheric warming revisit. Climate Dynamics 54, 1671–1682.
| Southern-Hemisphere high-latitude stratospheric warming revisit.Crossref | GoogleScholarGoogle Scholar |
Yang S, Li Z, Yu J-Y, Hu X, Dong W, He S (2018) El Niño–Southern Oscillation and its impact in the changing climate. National Science Review 5, 840–857.
| El Niño–Southern Oscillation and its impact in the changing climate.Crossref | GoogleScholarGoogle Scholar |
Yu P, Davis SM, Toon OB, Portmann RW, Bardeen CG, Barnes JE, Telg H, Maloney C, Rosenlof KH (2021) Persistent Stratospheric Warming Due to 2019–2020 Australian Wildfire Smoke. Geophysical Research Letters 48, e2021GL092609
| Persistent Stratospheric Warming Due to 2019–2020 Australian Wildfire Smoke.Crossref | GoogleScholarGoogle Scholar |
Zhang Y, Li J, Zhou L (2017) The Relationship between Polar Vortex and Ozone Depletion in the Antarctic Stratosphere during the Period 1979–2016. Advances in Meteorology 2017, 3078079
| The Relationship between Polar Vortex and Ozone Depletion in the Antarctic Stratosphere during the Period 1979–2016.Crossref | GoogleScholarGoogle Scholar |

