Thermochemical conversion characteristics of biosolid samples from a wastewater treatment plant in Brisbane, Australia
San Shwe Hla A , Nuttaphol Sujarittam A and Alexander Ilyushechkin A *
A *
A CSIRO Energy, PO Box 883, Kenmore 4069, Australia.
Environmental Chemistry 19(6) 385-399 https://doi.org/10.1071/EN22074
Submitted: 7 July 2022 Accepted: 5 November 2022 Published: 18 January 2023
© 2022 The Author(s) (or their employer(s)). Published by CSIRO Publishing. This is an open access article distributed under the Creative Commons Attribution-NonCommercial-NoDerivatives 4.0 International License (CC BY-NC-ND)
Environmental context. Biosolids are nutrient-rich organic materials. They can be used as fertiliser and solid amendments in agriculture if treated according to regulatory requirements. If farming applications of biosolids decline due to potential pollution from their heavy metal content, an alternative to traditional methods of biosolid disposal is required. In this context, thermal processing of biosolids is an economically and environmentally suitable option to convert large quantities of biosolids into useful energy.
Rationale. Due to more stringent environmental regulations and frequently required long-distance transportation, the traditional disposal of biosolids from wastewater treatment plants in landfills and farms is becoming unsustainable. A potentially economical and environmental option is the thermochemical conversion of biosolids into energy and value-added products. This paper describes the chemical composition and energy content of a representative biosolid sample collected from a major wastewater-treatment plant in Queensland, Australia.
Methodology. The thermochemical behaviour and compositional changes in biosolids were investigated under a wide range of pyrolysis and gasification conditions using a horizontal tube furnace (HTF), a fixed-bed reactor and a thermogravimetric analyser (TGA). In terms of practical application of by-products, we describe mineral matter transformations in char and ashes during pyrolysis and volatilisation as well as under different gasification conditions.
Results. HTF experiments revealed that at pyrolysis below 800°C, mainly organic species were released, while losses of inorganic elements (phosphorus, magnesium and zinc) occurred at higher temperatures. In-situ gasification behaviour of biosolid chars in the TGA reactor showed that the gasification reaction of biosolid chars occurred rapidly at temperatures above 720°C, regardless of the pyrolysis temperatures at which those chars were produced. Mineral matter transformations began at temperatures above 600°C, and mainly involved the transformation of amorphous phases into crystalline oxide and phosphide forms. Under gasification conditions, all crystalline phases appeared as different phosphates and alumino-silicates.
Discussion. The methods described here provide different options for the disposal of biosolids from wastewater by adjusting and optimising thermochemical conversion processes.
Keywords: ash characteristics, biosolids, gasification, mineral matter, phase transformation, pyrolysis, sewage sludge, thermochemical conversion.
Introduction
Municipal wastewater contains more than 99% water. After a series of wastewater treatment (WWT) processes, such as screening, sedimentation, aeration, settling and filtration, treated waters are either recycled or discharged depending on their quality and standard classification. During treatment, microorganisms digest the sewage, breaking down the original organic solids. The residues generated in these wastewater treatment processes are called biosolids, also known as sewage sludge. Biosolids are semi-liquid waste containing 75–85% water, with the remaining solids typically made up of organic matter, macro-nutrients (e.g. nitrogen, phosphorus, potassium, sulfur), micro-nutrients (e.g. copper, zinc, calcium, magnesium, iron) and some inert matter (Darvodelsky 2011). As biosolids are nutrient-rich, organic materials, they can be used as fertiliser and solid amendments in agriculture if treated according to regulatory requirements (Gonzaga et al. 2017). However, farming applications of biosolids are declining due to potential pollution from their heavy metal content (Singh and Agrawal 2008; Gikas 2017). Some European countries have prohibited both using biosolids in agriculture and discarding them in landfill sites to prevent harmful elements entering the human food chain (Fytili and Zabaniotou 2008). In addition, handling biosolids can become a significant challenge for wastewater management industries if distances between WWT plants and permitted agricultural farms are too great for cost-effective transportation (Lundin et al. 2004; Donatello and Cheeseman 2013). As an alternative to traditional methods of biosolid disposal, thermal applications are considered to be economically and environmentally suitable options to convert large quantities of biosolids into useful energy at WWT sites (Lundin et al. 2004; Cui et al. 2006; Calvo et al. 2013; Gil-Lalaguna et al. 2014).
According to the Australian & New Zealand Biosolids Partnership, 327 000 tonnes of dry biosolids are generated from WWT plants in Australia each year, which is equivalent to 13.6 kg (dry) per person (ANZBP 2017). While European countries are shifting biosolids management methods from land disposal to thermal application, Australia still relies on land disposal: 75% in agriculture, 11% in land rehabilitation, 8% composting and the remaining 6% in stockpiling, landfilling and ocean discharge (ANZBP 2017). Queensland Urban Utilities, a major Australian WWT company, generated 150 000 wet tonnes of biosolids per year from their 28 WWT facilities in Queensland, Australia (Fenwick 2016). They spent approximately AU$10 million per year transporting biosolids to far-field agricultural land applications, with handling costs alone estimated to be AU$67 per tonne of wet biosolids. A report released in 2011 estimated the nationwide annual transport cost of biosolids at AU$60 million (Darvodelsky 2011). Due to high transport costs, increasing awareness of environmental impact and the possibility of more stringent regulations for land disposal methods in the near future, Australia’s WWT industries are searching for alternative appropriate solutions to biosolids management.
Extracting energy from biosolids has been regarded as an alternative to disposal, especially as availability and public acceptance of landfilling are decreasing, while the cost of disposal is rising (Nidheesh et al. 2021). Tyagi and Lo (2013) and Nidheesh et al. (2021) recently reviewed several options for energy recovery from biosolids via thermochemical conversion approaches, including both conventional and emerging methods: incineration and co-combustion, gasification, pyrolysis, supercritical (wet) oxidation and hydrothermal treatment. Of these, supercritical oxidation and hydrothermal treatment are considered to be in the research and development stage, with complexities in reactor design and operation usually associated with elevated capital and maintenance cost (Rulkens and Bien 2004; Tyagi and Lo 2013). Incinerating biosolids is usually seen by the public as a less favourable option due to concerns about possible harmful emissions. However, modern advanced flue gas-cleaning technologies can effectively reduce and remove all pollutant components and maintain them under regulatory limits (Roy et al. 2011). Incineration plants are economically more efficient at the large scale, although this requires higher investment costs. One recommended approach is to mix biosolids with other fuels, such as coal and woody biomass, and use them in existing combustors for heat and power generation (Roy et al. 2011; Skoglund et al. 2016; Syed-Hassan et al. 2017). Cartmell et al. (2006) and Roy et al. (2011) propose that co-combustion of biosolids with coal and wood pellets would be a cost-effective way to reduce the volume of biosolids while also recovering energy. Interest is growing in gasification, a promising alternative thermal application of biosolids suited to small and medium throughput, which has several advantages over conventional incineration (Saw et al. 2012; Tyagi and Lo 2013; Werle 2015). Pyrolysis is another favourable route to convert biosolids into energy and valuable chemicals (Shao et al. 2008).
The first stage of the thermochemical conversion process of any solid fuel is devolatilisation. Understanding this phenomenon is therefore important for predicting the behaviour of biosolids during the subsequent stages of combustion and gasification. Several researchers have investigated biosolid devolatilisation under different operating conditions. For instance, Gomez-Barea et al. (2010) characterised the devolatilisation behaviour of dried biosolid granulates at 750–900°C using a laboratory fluidised-bed reactor and determined the resulting kinetics parameters. Park et al. (2010) studied the product distribution of biosolids under fast pyrolysis conditions at 400–550°C. A similar study by Fairous et al. (2010) determined the optimum pyrolysis temperature for bio-oil yield. Fonts et al. (2008) examined the effects of operational parameters on pyrolysis product distributions of biosolids to maximise liquid yield. An empirical model developed by Jaramillo-Arango et al. (2016) used experimental data tested at 300–800°C to estimate the main pyrolysis products. Finally, Fan et al. (2014) used three different biosolid samples to study the yields and composition of gaseous and liquid products using a fixed-bed reactor at 300–700°C.
Despite some lingering technical issues, such as syngas cleaning and tar removal, gasification is usually considered an attractive option for thermochemical conversion of biomass (Tippayawong et al. 2013). The technology can be operated at small and medium scales for power generation with higher efficiency and product flexibility, with end products other than heat and power, such as chemicals and liquid fuels, able to be generated (Kirkels and Verbong 2011). The gasification performance of biosolids has been tested in different laboratory-scale gasifiers (Midilli et al. 2001; Dogru et al. 2002; de Andrés et al. 2011a; Arjharn et al. 2013; Calvo et al. 2013; Chun et al. 2013; Gil-Lalaguna et al. 2014; Werle and Dudziak 2014), and researchers have carried out fundamental studies of gasification reactions of biosolid chars produced under different pyrolysis conditions (Scott et al. 2005; Nowicki et al. 2011; Nilsson et al. 2012, 2013; Jayaraman and Gökalp 2015; Stylianou et al. 2020). Scott et al. (2005) compared the reactivity of char produced from dried biosolids with those derived from car tyres, bituminous coals and activated carbon at 800–1050°C, reporting that biosolid-derived char was the most reactive on the basis of both Brunauer–Emmett–Teller surface area and mass. Nilsson et al. (2012) used a laboratory fluidised-bed reactor to investigate the reactivity of biosolid char under different partial pressures of CO2 and H2O as reactants. The reaction with H2O was approximately three times faster than with CO2 at 800–900°C, while activation energies for both reactions were similar. The same group (Nilsson et al. 2013) extended their reactivity research on biosolid char using a mixture of CO2–H2O–N2 and found that char gasification rates for a gas mixture containing both reactants could be approximated as the sum of the individual rates measured separately with CO2 and H2O. In a study of the reactivity of biosolid-derived char using different gaseous agents containing CO2, O2 and H2O, Nowicki et al. (2011) found that biosolid-derived char reaction with CO2 and O2 could be interpreted using a shrinking core model, while expression of the char–steam reaction was more suited to first-order kinetics.
Biosolids cannot be totally eliminated via thermochemical conversion processes, because they contain a large percentage of mineral matter that remain as a form of ash or slag, depending on the thermochemical technologies applied (average value of ~44% in dry basis (db) (Syed-Hassan et al. 2017)). These ashes contain harmful substances and should be carefully disposed of in landfill, preventing the possibility of heavy metal leaching from the ashes to the soil–water system (Fytili and Zabaniotou 2008). However, unlike nutrient-poor coal ashes, biosolid ashes contain a large amount of nutrients, especially phosphorus (Donatello and Cheeseman 2013), which can be used in agricultural processes. There are several research and development efforts in the area of treating biosolid ashes to reduce heavy metals and transform the ash into marketable fertiliser products, or products for the construction industry (Donatello and Cheeseman 2013; Cieślik et al. 2015; Herzel et al. 2016). Inorganic species in biosolids can also cause serious problems to plant operation due to ash agglomeration, deposition and corrosion on boiler heat-transfer surfaces (Thy et al. 2006; Li et al. 2013). A better understanding of the release of the inorganic constituents and metals as well as the phase transformation of mineral matter during thermochemical conversion processes is important because biosolids contains harmful compounds and heavy metals. Hwang et al. (2007) studied the distribution of heavy metals, such as Cd, Cr, Pb and Zn, in pyrolysis residue (at 500°C) and incineration ash (simulated at 900–1000°C) of biosolids. Saveyn et al. (2011) monitored the metal distribution of biosolid chars during the gasification processes and found that minor elements of the inorganic portion of biosolids are expected to be partially or totally lost due to volatilisation or melting from the biosolids matrix. Similar studies on the transformation and evaporation of heavy metals during pyrolysis and gasification of biosolids have also been conducted (Lu et al. 2015; Jin et al. 2016; Li et al. 2018; Hedayati et al. 2021; Hannl et al. 2022).
In physical appearance, biosolids appear homogeneous, but their composition, chemical properties, speciation and concentration of heavy metals can vary widely depending on several factors. These include the percentage inclusion of industrial wastewater, the treatment system used at WWT plants, local environmental regulations and seasonal variation (Spanos et al. 2016; Tytła et al. 2016; Syed-Hassan et al. 2017). Although many overseas researchers have studied behaviour of biosolids under different thermal processes and conditions, work in this area is still limited in Australia, likely due to the lack of industrial practice in converting biosolids to useful energy via thermochemical conversion routes. In this study, we examined the chemical composition and energy content of biosolid samples collected from a major WWT plant in Queensland, Australia. We investigated the compositional changes of biosolids during pyrolysis under a wide range of operating temperatures, gasification characteristics of pyrolysed biosolids using CO2 and H2O as gasifying agents, and mineral matter transformation and volatilisation under different operating temperatures.
Experimental
Biosolid sample collection and preparation
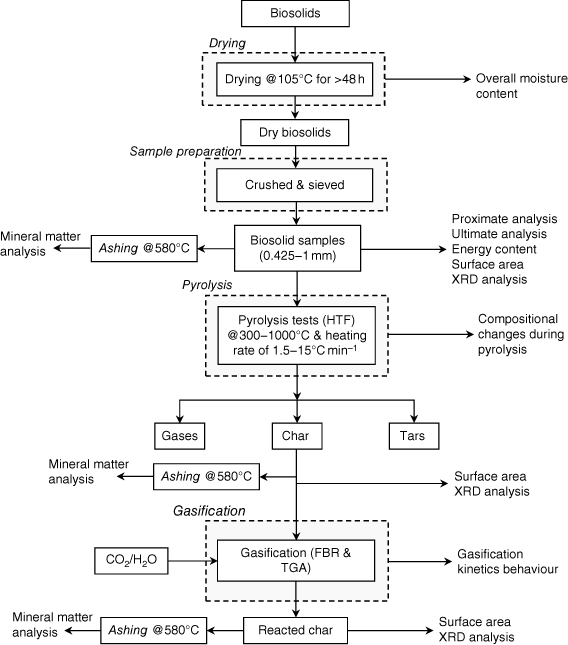
Biosolid samples were obtained from Oxley Creek WWT plant, a major sewage treatment facility in Brisbane operated by Queensland Urban Utilities. More than 12 kg of biosolids were collected at the end-point of the entire retreatment processes, once the biosolids had been stabilised and were ready to be transported to farmlands more than 100 km from the plant. Several batches (each batch containing approximately 2 kg of biosolids) were dried in a laboratory oven, with total moisture content measured according to European Standard method ISO 18134-3:2015, which requires the oven temperature to be maintained at 105°C (ISO 2015). To ensure the samples were completely dried, they were initially left in the oven for more than 48 h. After drying, trays of samples were put in a large desiccator to cool to room temperature. They were then weighed immediately to prevent moisture absorption from the atmosphere. The processes of heating, drying, cooling and checking weight were repeated until a total weight change of <0.2% was achieved. The moisture content (wet basis) of the biosolid samples was calculated using the differences in measured sample weight before and after drying. Dry samples were then crushed into particles using a mortar and pestle and sieved to achieve a consistent size range between 425 μm and 1 mm. Sized samples were sent to the laboratory for chemical analysis (proximate and ultimate analyses and energy content). In this study, we investigated biosolid properties after pyrolysis and gasification, together with surface area changes in biosolid chars and compositional changes in mineral matter. The sequences and source of samples for the experimental investigations are shown in Fig. 1.
|
Experimental rig for pyrolysis test and procedure
Biosolids were pyrolysed using a horizontal tube furnace (HTF) that can be operated at up to 1100°C. Samples prepared as described above were loaded into two to three laboratory ceramic crucibles located inside a HTF, as shown in Fig. 2. Each tray can be loaded with approximately 10 g of biosolid samples. The reactor was then electrically heated from room temperature to the targeted temperature (300–1000°C) at either a slow heating rate of 1.5°C min−1 or a median heating rate of 15°C min−1 (maximum heating rate applicable for HTF), and was maintained at the targeted temperature for 1 h to ensure devolatilisation products were totally removed from the reactor tube. The entire process was conducted under a constant flow (1 L min−1) of nitrogen at atmospheric pressure. As shown in Fig. 2, three K-type thermocouples were placed in the left, middle and right sections of the HTF to ensure consistent temperature distribution. After 1 h at the targeted pyrolysis temperature, the reactor was cooled and the final weight of solid remaining in the crucibles was measured.
Volatile matter released during the experiments was forced out with N2 flow from the furnace into a series of gas-washing bottles (impingers) filled with a minimum of 150 mL of isopropanol as a sorbent along with laboratory glass beads, as shown in Fig. 2. The impingers were submerged in water cooled by a salt and ice bath. The set up was adapted from the tar protocol defined by the European Committee for Standardization from 2003 to 2005 (Good et al. 2005). After each experimental run, the mixture of solvent and condensate from all impingers was rinsed with solvent and mixed in one container. Solvents were then removed under a moderate vacuum of ~10 kPa (abs) at 55°C using a rotary evaporator following the step-by-step procedures described in the tar protocol (Good et al. 2005). After evaporation was complete, the total amount of gravimetric tar was calculated using the measured weights of the empty flask and the total weight after solvent evaporation. The total amount of non-condensable gases released during the pyrolysis experiment was calculated using measured solid yield and tar yield.
Char gasification reactivity tests
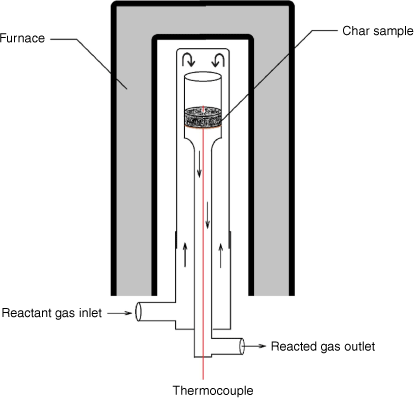
A fixed-bed reactor was used for intrinsic reactivity measurement at atmospheric pressure. As shown in Fig. 3, the reactant gases flow through a fixed bed of sample (~1–2 g) supported in a quartz reaction tube by a sintered glass grit. A K-type thermocouple in the bed was used to monitor sample temperatures. After loading the sample as shown in Fig. 3, the reactor was heated by an electric furnace until the targeted reacting temperature was reached. During the test, operating conditions (reaction temperatures and level of gasification rate targeted) were set to yield about 0.5–0.9% CO to maintain a differential reactor operating mode, where reaction rates are controlled solely by chemical processes without inhibition effects from the products.
|
For CO2-gasification reaction tests, high-purity CO2 was used to deliver a constant flow of approximately 750 mL min−1. For steam-gasification reaction experiments, steam was generated by passing ultra-high purity (99.999%) hydrogen gas over CuO (oxidised Cu wire) heated to 315°C, which oxidised the H2 to H2O as per reaction 1:

One of the advantages of using this method is an ability to control the desired steam flow rate effectively with better accuracy. This method has been successfully and extensively applied in previous research (Roberts and Harris 2000; Hodge 2009). After each experiment, the copper wire was regenerated by heating in air at 315°C for 1–2 h to produce CuO.
The flow rates of reactant gases (N2, CO2 and H2O) were controlled by a series of mass flow controllers, each with a maximum flow rate of approximately 1 L−1 min. Product gas flow was measured with a volumetric gas flow meter, and this, along wh the concentration of CO measured using a non-dispersive infrared analyser, was used to calculate the reaction rate. Reaction rates were then calculated from the composition of the feed and product gases and the measured gas flow rates into and out of the reactions, and the mass of the sample before and after reaction. Specific reaction rates in this study were defined as the units of grams of carbon reacting per gram of carbon remaining per second (g g−1 s−1). The procedure and formulas used to estimate reaction rates and kinetic parameters are described in our previous publication (Hla et al. 2016).
Surface area measurement
The surface area of char samples from pyrolysis experiments and gasification tests was determined using adsorption of CO2 at 273 K and analysis using the Dubinin–Radushkevich equation (Dubinin 1966) and density functional theory model. These measurements are used to calculate the intrinsic reaction rates (defined as the specific rate per unit char surface area) to differentiate the impacts of physical properties of the char samples from those intrinsic to the chemistry of char structure. This approach provides further insights into the gasification behaviour of biosolid chars.
Thermogravimetric analyser
To understand the in-situ transformation under CO2 gasification conditions, a thermogravimetric analyser (TGA) was used to monitor the changes in mass of different biosolid-derived chars as a function of time and temperature under atmospheric pressure. Different types of biosolid char samples (produced under pyrolysis conditions at 800, 900 and 1000°C) were loaded in a metal mesh basket (mesh size 100 µm) and suspended in an electrically heated furnace. Their weights were then measured and recorded every 10 s, while a K-type thermocouple located a few millimetres below the sample basket was used to measure and monitor the samples’ temperature. Depending on the nature of investigation, a constant flow of CO2 at 0.3 L min−1 was supplied either when the reactor’s temperature stabilised or during the ramping up to a specific temperature under a heating rate of 1.0°C min−1. The raw experimental data, which consisted of time, sample mass and sample temperature, were smoothed and differentiated using software to provide the results at a specific rate (g g−1 s−1).
Ashing and X-ray diffraction analysis
A large portion of dry biosolids is mineral matter. To investigate the transformation of mineral matter during pyrolysis, all char samples produced at different temperatures were oxidised in a high-temperature muffle furnace to determine the ash content following the European Standard method BS EN 14775 (BSI 2010). X-ray powder diffraction with copper Kα radiation (λ = 1.5406 Å) was used to identify mineral phases in dry biosolids and biosolid-derived chars under different pyrolysis conditions before and after exposure to gasification tests, and in ash samples produced from dry biosolids and biosolid chars. The X-ray diffraction (XRD) analysis allowed identification of compositional changes in biosolids throughout the thermochemical conversion processes.
Results and discussion
Chemical properties of biosolids
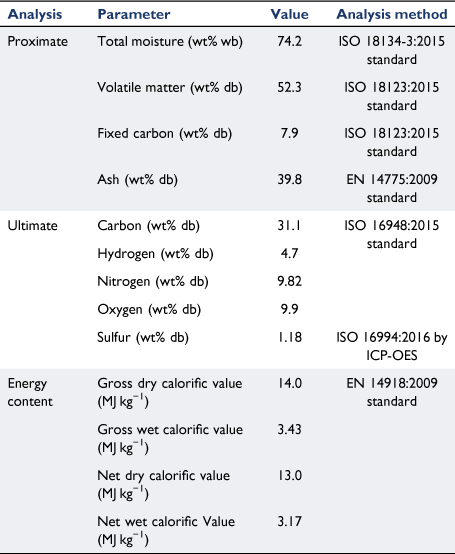
The chemical properties of biosolid samples and the standard methods used in this study are listed in Table 1. As described in the experimental section, a large biosolid sample was used to measure the moisture content of biosolid collected from a WWT plant in Brisbane using an international standard method. The results from different batches of drying tests were consistent, with an average value of 74.2% moisture content on a wet basis. This value falls within the typical range of other studies, indicating that raw biosolids contain high levels of water ranging from 71 to 88% (Cartmell et al. 2006; Cui et al. 2006; Roy et al. 2011; Arjharn et al. 2013; Chen et al. 2013; Moon et al. 2015; Gong et al. 2016; Skoglund et al. 2016; Syed-Hassan et al. 2017; Raheem et al. 2018). As explained in Fig. 1, representative biosolid samples were crushed and sieved to a selected size (0.425–1.0 mm) and sent to the laboratory for chemical analysis. The proximate analysis listed in Table 1 show that the biosolids contained 7.9% fixed carbon and 52.3% volatile matter. These values are similar to those reported by other studies, which listed fixed carbon of 4.4–7.1% and volatile matter content of 46.6–55% (Fonts et al. 2008; Atienza-Martínez et al. 2013; Calvo et al. 2013). The ash content of biosolid samples was 39.8%, significantly higher than other forms of biomass, especially agriculture-derived biomass residue and waste such as rice husk (Quispe et al. 2017; Liu et al. 2020; Zheng et al. 2020) and green waste (Hla and Roberts 2015; Shao et al. 2020), which usually contains a high level of mineral matter. The high ash content of biosolids could cause significant challenges for application in thermochemical conversion systems such as combustion and gasification processes. This is because most facilities are designed for typical woody biomass with low mineral matter that do not require frequent ash removal, and do not cause problems associated with sintering and clinker formation in high-temperature combustion zones (Boström et al. 2012; Arjharn et al. 2013; Skoglund et al. 2016).
|
From the ultimate analysis described in Table 1, biosolids contained 31% carbon on a dry basis, similar to other studies (Cartmell et al. 2006; Fonts et al. 2008; de Andrés et al. 2011b; Atienza-Martínez et al. 2013; Fuentes-Cano et al. 2013). The carbon content in biosolids is significantly lower than in most biomass and wastes, which contain well above 40% carbon on a dry basis (Hla et al. 2020). The nitrogen content of biosolids was 9.8%, much higher than that of most biomass and wastes (usually <1% on a dry basis) (Hla et al. 2020). The high nitrogen content in biosolids provides fertilising benefits, as it is a major source of plant nutrients (Fytili and Zabaniotou 2008; Gonzaga et al. 2017). The higher heating and lower heating values of biosolid samples are also listed in Table 1 on a wet and dry basis. The high moisture content significantly affects the energy content: while heating values were within a medium range on a dry basis, they were very low when moisture content was included on wet basis. Even on a dry basis, the energy content of biosolids was lower than that of most biomass, especially woody material, which usually contains higher than 18 MJ kg−1 (Hla et al. 2020). This low energy content is mainly due to the high level of mineral matter in biosolids.
Pyrolysis behaviour of biosolids
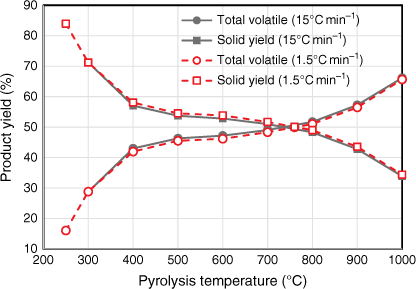
Yields of total volatile and total solid products were measured under a range of temperature at two different heating rates (Fig. 4). The trend and percentage yields tested under both heating rates were almost identical. The total volatile yield under 15°C min−1 was slightly higher than that tested under 1.5°C min−1 for all pyrolysis temperatures; consequently, total solid yield under 15°C min−1 was slightly less than that tested under 1.5°C min−1 for all pyrolysis temperatures. One possible explanation is that heating elements in the HTF tended to overshoot the targeted pyrolysis temperatures while testing under the higher heating rate of 15°C min−1. These slight variations in product yields are minor – even though the two heating rates varied by an order of magnitude, they both fell well within the slow heating rate category. Due to the design of HTF used in this study, the heating rate could not be increased beyond 15°C min−1.
|
The pyrolysis behaviour of biosolids can be described in three stages: the volatile yield increased significantly between 250 and 400°C, followed by slight increases at 400–800°C, and another significant increase at 800–1000°C (Fig. 4).
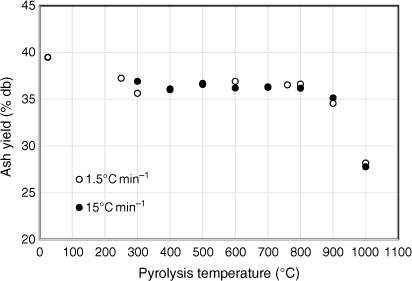
While the total volatiles released from biosolids during the first two stages of pyrolysis were mainly from organic matter, those released above 800°C originated from both inorganic and organic matter. This is verified by Fig. 5, which shows the variation in ash contents of biosolids measured by ashing the chars produced under different pyrolysis temperatures. These values were calculated using total solid yields measured under each pyrolysis condition using Eqn 2:

Fig. 5 shows that ash content measured in biosolid chars produced at 300°C was smaller than that of fresh biosolids. This might be due to release of some inorganic matter under low-temperature pyrolysis conditions. Due to non-oxidising pyrolysis conditions, some mineral matter devolatilised before being converted into oxide phases during ashing, while fresh biosolids under continuous oxidation react with oxygen in the air and form more stable oxides, thus preventing elements from devolatilising. Fig. 5 also reveals that ash yields did not change significantly for biosolid chars produced under pyrolysis temperatures of 300–800°C under both heating rates, but dropped significantly for those biosolid chars produced under pyrolysis temperature above 800°C.
|
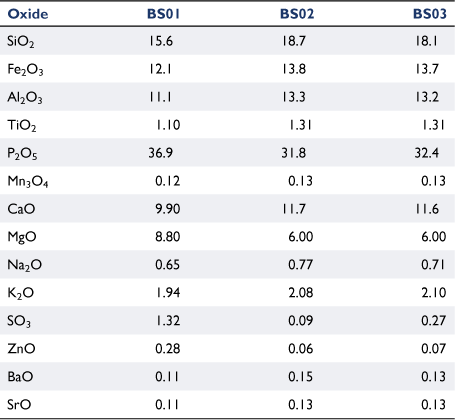
Table 2 lists the chemical composition of ashes from fresh biosolids ashed at 580°C, and from biosolid-derived chars produced at 900°C ashed at 580 or 815°C. The relative content of four oxides (P2O5, MgO, SO3 and ZnO) decreased significantly in chars produced at 900°C and was not affected by ashing temperature. The transformation of mineral matter of carbonaceous fuels into gas phases during thermochemical processes has been reported in other studies (Jensen et al. 2000; Bläsing and Müller 2013; Gil-Lalaguna et al. 2014). The loss of mineral matter under high-temperature pyrolysis conditions is associated with volatilisation of some elements at reducing conditions; this will be discussed further in ‘mineral matter transformation’ section.
|
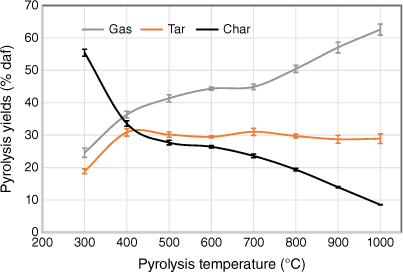
To check the yields of three major products (gas, tar and char) under different pyrolysis conditions without including the effects of variation of ash content, gas, liquid and solid product yields were plotted on a dry ash-free basis as a function of pyrolysis temperature (Fig. 6). As discussed earlier, the data from two set of experiments tested under two different heating rates were small, so only one set of data are shown, including error bars. Gaseous product yields increased as pyrolysis temperatures rose, but at different rates; yields increased significantly at 300–500°C but only slightly at 500–700°C. Beyond 700°C, gas yields increased sharply, due to a combination of devolatilisation of organic matter and transformation of inorganic matter. Liquid yields initially rose with increasing temperature, remained nearly constant at 500–800°C and decreased slightly above 800°C. This decrease is probably due to the occurrence of secondary reactions of volatiles, such as thermal cracking under high-temperature operating conditions (Fuentes-Cano et al. 2013; Fan et al. 2014; Sattar et al. 2014; Jaramillo-Arango et al. 2016). In contrast to gaseous yield, char yield fell sharply at 300–500°C and then decreased slowly at 500–700°C. Interestingly, char yield decreased significantly beyond 700°C, even to 1000°C, indicating that pyrolysis did not seem to be complete. The remnants of volatile matter in biosolid chars derived from high-temperature pyrolysis has also been reported in other studies (Inguanzo et al. 2001; Shao et al. 2008; Gomez-Barea et al. 2010).
|
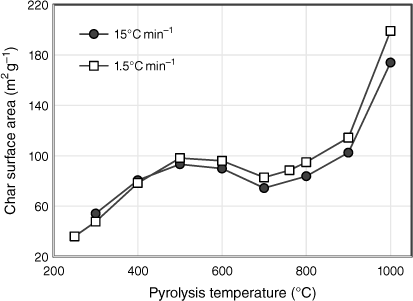
The total surface areas of biosolid char samples are plotted in Fig. 7 as a function of pyrolysis temperature for both sets of experiments tested under different heating rates. In general, the surface area increased with pyrolysis temperature, with the exception of stabilising between 500 and 800°C and decreasing slightly at 700°C. During the first stage of pyrolysis, the surface area increased almost threefold from 36 m² g−1 at 250°C to 98 m² g−1 at 500°C. This is attributed to changes in the chemical structure of fresh biosolids, such as an increase in aromaticity, which generates micro and mesopores related to higher surface areas (Agrafioti et al. 2013). The trends seen in Fig. 7 reflect the pyrolysis behaviour of biosolids. When the release of volatile matter slowed between 500 and 800°C, the surface areas were unchanged, except for the slight decrease at 700°C. One possible explanation for the reduction in pore size is that due to the change in phase of some elements in the ash which expanded, the accessible micropore area decreased, and consequently the porosity of the samples decreased (Inguanzo et al. 2001). This explanation corresponds to the formation of identified crystalline structures above 600°C in the XRD results (see ‘mineral matter transformation’ section). From 800 to 1000°C, as solid yield fell due to the combined effects of transformation of inorganic matter into gaseous phases and devolatilisation of organic matter, the surface areas of the remaining chars doubled. However, this significant increase is insufficient for biosolids to develop surface areas large enough for practical application. The surface areas of biosolid chars in this study are much lower than those associated with commercial activated carbons (often in the order of 1000 m² g−1) (Xu et al. 2017). This is mainly due to the high ash content of biosolids, which hinders the formation of larger surface areas by filling and blocking access to the chars’ micropores (Song and Guo 2012; Agrafioti et al. 2013).
|
Gasification behaviour of biosolids
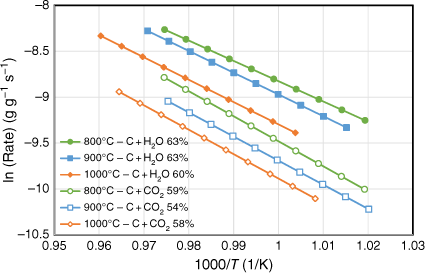
The gasification behaviour of biosolid chars produced under three different pyrolysis temperatures (800, 900 and 1000°C) was investigated using a fixed-bed reactor with CO2 and H2O as reactant gases. All experiments were tested at well under 800°C to exclude the effects of devolatilisation during gasification reactions. For each biosolid char sample, at least three gasification experimental runs were conducted to obtain different carbon conversion levels. Arrhenius plots of the rate data were obtained as samples cooled at the end of each run; the reactivity profiles are shown in Fig. 8. Note this figure only shows the plots that represent char conversion levels between 54 and 63% consumed under the specific gasification reaction tested for those samples. Gasification reaction rates were slower for those samples produced under higher pyrolysis temperatures for both gasification reactions (C + CO2, C + H2O) investigated. This is probably due to changes in crystalline structure of the chars produced at higher pyrolysis temperatures, which provides a catalytic effect favouring the metal oxidation reactions competing with char gasification reactions. As we discuss in the next section, some crystalline structures formed for those chars produced at pyrolysis of 760°C and more crystalline phases formed with increasing pyrolysis temperatures above 760°C. The gasification reactant gases may therefore tend to react with these crystalline structures, and not just with the carbon from chars. Consequently, this phenomenon will slow the gasification reactions, especially for those chars produced at high temperatures (900 and 1000°C).
|
The Arrhenius plots of the rate data presented in Fig. 8 were taken from the experimental runs for the char–CO2 reaction with 100% CO2 or 30% H2O as reactants. We did not determine the reaction order of H2O, as it was outside the scope of this study. Thus, these two sets of experimental results cannot be directly compared. Nevertheless, even with only 30% H2O, it was clear that like other biomasses, biosolid chars are more reactive with H2O than with CO2 (Nowicki et al. 2011). Table 3 lists the kinetic parameters measured for six sets of gasification experiments. The activation energies were in a narrow range of 184–202 kJ mol−1 for the char–H2O reaction and 218–227 kJ mol−1 for the char–CO2 reaction.

|
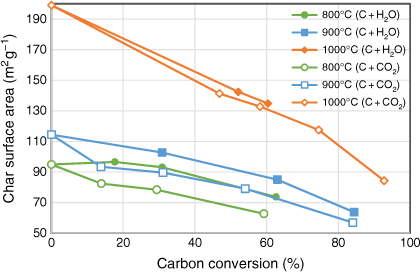
The trend of char surface areas changes during the two gasification reactions is shown in Fig. 9. Char surface area was measured after each gasification experiment using a fixed-bed reactor, which provided changes in the profile of char structure at different levels of carbon conversion. During both gasification reactions, char surface area did not significantly increase; instead, it decreased monotonically as conversion increased for all cases. This is consistent with the expectation discussed in the previous section that these chars have low porosity, particularly lacking micropores, due to the high mineral matter of biosolids blocking the formation of porous structures. Decreases of char surface area during the char–H2O reaction were more gradual than in the char–CO2 reaction, but these differences were minor.
|
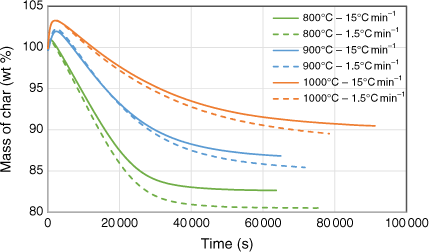
Biosolid char samples were also tested in two different sets of TGA runs using CO2 as a reactant to understand in-situ transformation under gasification conditions. The first set tested the gasification behaviour of samples produced under pyrolysis conditions at 800, 900 and 1000°C under a constant, stable gasification temperature of 750°C. The second set investigated gasification behaviour of samples while ramping the temperature up to a specific targeted value under a constant heating rate of 1.0°C min−1. During this set, the maximum gasification temperature was maintained well below the pyrolysis temperature at which respective char sample was produced to avoid devolatilisation effects during gasification. Fig. 10 shows the changes in mass as a function of temperature under a constant gasification temperature of 750°C. At the beginning of the TGA runs, the mass of the samples increased before falling due to the char–CO2 gasification reaction. The higher the pyrolysis temperature at which the char sample was generated, the more apparent the initial increase at the beginning of the run. This phenomenon is uncommon in TGA tests for chars with low ash content, but can be explained by XRD analysis of the samples before and after gasification reactions. This showed that char generated at higher pyrolysis temperatures had a higher percentage of ashes and favoured the metal oxidising reaction, which increased the mass before the gasification reaction could occur. A similar finding was reported in a study of the kinetics of gasification for char derived from sewage sludge (Nowicki et al. 2011). Fig. 10 shows that weight loss percentage at the end of the TGA runs was smaller for those chars produced under a higher heating rate (15°C min−1) than those produced under a lower heating rate (1.5°C min−1). This phenomenon could be explained by the marginally smaller total solid yield produced under the higher heating rate, due to a possible slight overshoot of the targeted temperatures during pyrolysis experiments (see the previous section).
|
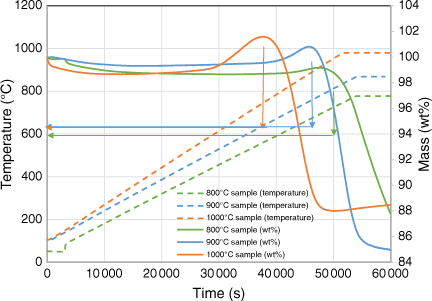
Fig. 11 shows the in-situ gasification behaviour of biosolid chars at increasing temperatures in the TGA reactor. The biosolid chars began to rapidly undergo gasification at temperatures above 720°C, regardless of the pyrolysis temperatures at which those chars were produced. As shown by the XRD analysis as discussed in the next section, the metal oxidisation reaction started at a lower temperature of around 600°C, meaning it has a lower activation energy, and is thus expected to occur faster than the gasification reaction. This might be why the metal oxidation reaction dominated the beginning of the gasification experiment, as shown in Fig. 10, thereby increasing the mass of char samples. After the metals in the samples had been oxidised, the overall reaction would lean towards gasification, explaining why the total mass started decreasing gradually after a short period.
|
Mineral matter transformation under thermochemical conversion of biosolids
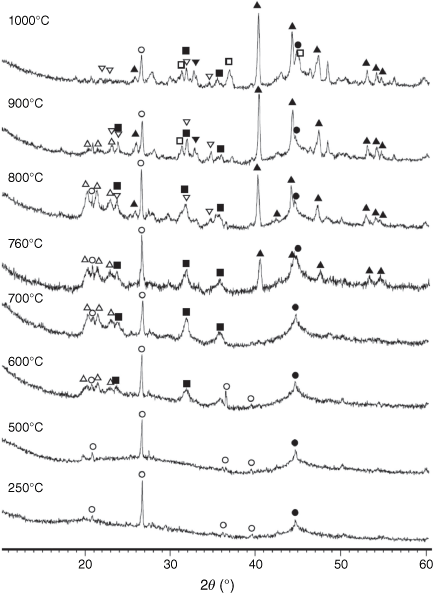
In original dried biosolids, similar to other types of biomass, most inorganic matter consists of amorphous inorganic phases and poorly crystallised mineraloids from various groups and classes (Vassilev et al. 2012). While volatiles are released during biosolid pyrolysis reactions, several crystalline phases are formed in biosolid chars as a result of decomposition of salts and hydrocarbons, particularly at high temperatures. The XRD spectra of chars processed at different pyrolysis temperatures are shown in Fig. 12.
|
Mineral matters in chars at low temperatures were mainly present in an amorphous form. At T < 600°C, only SiO2 is present in crystalline phase as quartz. At pyrolysis temperatures of 600°C and above, AlPO4 and Al2CaSi2O8 began to form. Fe2P started to form above 700°C and became a dominant phase at higher temperatures. Some phosphorus appeared in oxide form as stanfieldite at 900°C and above. At these temperatures spinel and possibly hematite were formed, while AlPO4 disappeared in char prepared at 1000°C.
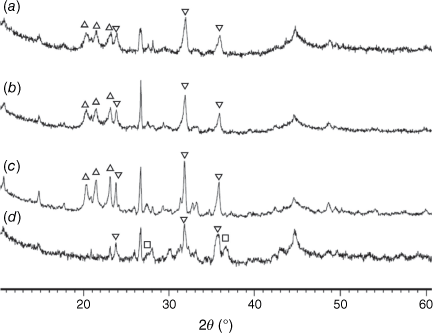
Fig. 13 shows the XRD patterns for pyrolysis chars prepared at 760–1000°C and then processed in CO2 (fixed-bed reactor). As indicated, Fe2P peaks diminished during gasification, especially in chars prepared at 760 and 800°C, while stanfieldite Ca4Mg5(PO4)6 and AlPO4 phases increased in processed chars with temperature. As Fe2P content was highest in chars prepared at 900°C, the highest Ca4(Mg5(PO4)6 and AlPO4 peaks were observed in chars gasified in CO2 at 900°C accordingly. Crystallinity in gasified chars processed at pyrolysis temperature of 1000°C was lower than in gasified chars processed at lower pyrolysis temperatures. The AlPO4 phase disappeared in gasified chars processed at 1000°C.
|
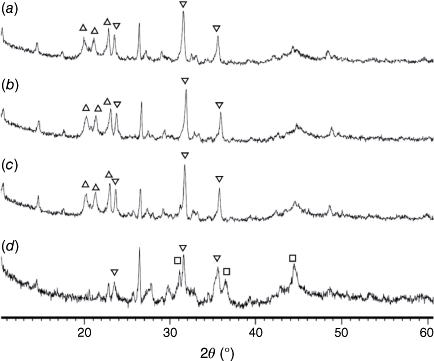
Fig. 14 shows the phase compositions of pyrolysis chars prepared at 760–1000°C and processed in H2O (FBR reactor). Fe2P peaks were not detected in any of these chars, and the crystallinity of oxide phases did not change at 750–900°C. Overall, very similar crystalline structures were observed in chars processed with CO2 and H2O as reactant gases. Chars prepared at 760 and 800°C and gasified with H2O had higher crystallinity in formed oxide phases (Fig. 14a, b) than in chars processed in CO2 (Fig. 13a, b), indicating more reactive gasification conditions in the presence of H2O.
|
During pyrolysis, gaseous oxygen is unavailable and there is insufficient oxygen from volatile species to form all minerals in crystalline oxide form. Only some Si, Al or Ca starts to form calcium-alumino silicate, alumino or alumino-magnesium phosphate fine particles (as demonstrated by the broad XRD peaks in Fig. 12). Only a small part of Fe forms spinel and hematite above 900°C, while most Fe and P are not oxidised and instead form iron phosphide, Fe2P. The appearance of Fe2P in chars obtained from pyrolysis of sewage sludge at 950°C has been reported (Seredych and Bandosz 2007), and the degree of crystallisation in processed chars increased with temperature and pyrolysis time. This indicates that the kinetics of crystallised mineral formation is important in terms of the appearance of different phases of solid products from pyrolysis and gasification processes. Further investigation is necessary to explore this phenomenon in more detail.
When gasification reactions begin, sufficient oxygen is available to oxidise phosphide and transfer minerals to Ca4Mg5(PO4)6 and AlPO4 phases by reacting with Ca and Mg from amorphous phases and possibly from existing crystalline phases. In gasification reactions, the crystallinity of Ca4Mg5(PO4)6 and AlPO4 phases increases slightly compared with other crystalline phases. This might indicate that more cations are available from the amorphous phase while chars are processed under gasification conditions. The crystallinity of phases in chars processed at 1000°C are lower and could be associated with losses of P at this temperature.
As mentioned earlier, processing chars at temperatures above 900°C results in some losses of inorganic elements, particularly, P, Zn and Mg, which could bond with volatile phases. However, P and Zn could be potentially recaptured from (migrated to) ashes produced under real gasification conditions depending on the type of solid by-products and the sewage sludge used (Werle and Dudziak 2014).
For practical application of thermochemically processed biosolids and their by-products, subsequent studies will aim to understand the specific conditions for the formation of particular inorganic species (e.g. those containing phosphorus), and to identify how their key characteristics are affected by different processing conditions.
Conclusions
In this study, biosolid samples collected from a major WWT plant in Queensland, Australia were thermochemically treated and subsequently characterised under a wide range of operating conditions. The unique properties of biosolids include significantly high moisture content and mineral matter compared with other biomasses and wastes. Biosolid carbon content is lower than most other biomass and wastes, although their nitrogen content (9.8%) is much higher, making them potentially suitable for use in fertilisers. The energy content of biosolids is low, mainly due to their high level of mineral matter, which also affects gasification reactions in biosolid chars. Gas yield during pyrolysis increased significantly from 300–500 to 800–1000°C, while char yield decreased accordingly in the same temperature ranges. Pyrolysis temperature also affects the organic and inorganic matter released from biosolids. Below 800°C, mainly organic species were released, while at higher temperatures losses of phosphorus, magnesium and zinc occurred. Mineral matter in chars pyrolysed at temperatures below 600°C appears in an amorphous form, but at higher temperatures it is transformed into crystalline phases as oxides and phosphides. Like other carbonaceous solid fuels, biosolid chars are more reactive with H2O than CO2. Under gasification conditions, all crystalline phases in chars appear in oxide forms and their crystallinity is higher in the presence of H2O, indicating more oxidised conditions. Phosphorus appeared in different forms in biosolid chars under pyrolysis and gasification conditions. The findings from this study clearly show the significance of operating parameters and conditions on the properties of the produced biosolid chars and ashes. Our extensive analyses demonstrate the possibility that by modifying and optimising thermochemical conversion processes, the properties of by-products from biosolids could be adjusted for potential practical application. Future studies should investigate the kinetics of mineral crystallisation and the possible catalytic effect of some minerals in biosolids on gas-phase reactions.
Data availability
The data that support this study are available in the article.
Conflicts of interest
The authors declare no conflicts of interest.
Declaration of funding
This research did not receive any specific grant from funding agencies in the public, commercial, or not-for-profit sectors.
Acknowledgements
The authors are grateful to Queensland Urban Utilities for their assistance and arrangement for collection of biosolid samples. We acknowledge Mr Mark Kochanek for his guidance and assistance with the operation of experimental equipment used in this study.
References
Agrafioti E, Bouras G, Kalderis D, Diamadopoulos E (2013). Biochar production by sewage sludge pyrolysis. Journal of Analytical and Applied Pyrolysis 101, 72–78.| Biochar production by sewage sludge pyrolysis.Crossref | GoogleScholarGoogle Scholar |
ANZBP (2017) Australian Biosolids Statistics: Biosolids production in Australia - 2017. Available at https://www.biosolids.com.au/guidelines/australian-biosolids-statistics/ [verified on 9 December 2022]
Arjharn W, Hinsui T, Liplap P, Raghavan GSV (2013). Evaluation of an Energy Production System from Sewage Sludge Using a Pilot-Scale Downdraft Gasifier. Energy & Fuels 27, 229–236.
| Evaluation of an Energy Production System from Sewage Sludge Using a Pilot-Scale Downdraft Gasifier.Crossref | GoogleScholarGoogle Scholar |
Atienza-Martínez M, Fonts I, Ábrego J, Ceamanos J, Gea G (2013). Sewage sludge torrefaction in a fluidized bed reactor. Chemical Engineering Journal 222, 534–545.
| Sewage sludge torrefaction in a fluidized bed reactor.Crossref | GoogleScholarGoogle Scholar |
Bläsing M, Müller M (2013). Release of alkali metal, sulphur, and chlorine species from high temperature gasification of high- and low-rank coals. Fuel Processing Technology 106, 289–294.
| Release of alkali metal, sulphur, and chlorine species from high temperature gasification of high- and low-rank coals.Crossref | GoogleScholarGoogle Scholar |
Boström D, Skoglund N, Grimm A, Boman C, Öhman M, Broström M, Backman R (2012). Ash Transformation Chemistry during Combustion of Biomass. Energy & Fuels 26, 85–93.
| Ash Transformation Chemistry during Combustion of Biomass.Crossref | GoogleScholarGoogle Scholar |
BSI (2010) BS EN 14775:2009 − Solid biofuels. Determination of ash content. The BritishStandards Institution.
| Crossref |
Calvo LF, García AI, Otero M (2013). An Experimental Investigation of Sewage Sludge Gasification in a Fluidized Bed Reactor. The Scientific World Journal 2013, 479403
| An Experimental Investigation of Sewage Sludge Gasification in a Fluidized Bed Reactor.Crossref | GoogleScholarGoogle Scholar |
Cartmell E, Gostelow P, Riddell-Black D, Simms N, Oakey J, Morris J, Jeffrey P, Howsam P, Pollard SJ (2006). Biosolids—A Fuel or a Waste? An Integrated Appraisal of Five Co-combustion Scenarios with Policy Analysis. Environmental Science & Technology 40, 649–658.
| Biosolids—A Fuel or a Waste? An Integrated Appraisal of Five Co-combustion Scenarios with Policy Analysis.Crossref | GoogleScholarGoogle Scholar |
Chen Y, Guo L, Jin H, Yin J, Lu Y, Zhang X (2013). An experimental investigation of sewage sludge gasification in near and super-critical water using a batch reactor. International Journal of Hydrogen Energy 38, 12912–12920.
| An experimental investigation of sewage sludge gasification in near and super-critical water using a batch reactor.Crossref | GoogleScholarGoogle Scholar |
Chun YN, Ji DW, Yoshikawa K (2013). Pyrolysis and gasification characterization of sewage sludge for high quality gas and char production. Journal of Mechanical Science and Technology 27, 263–272.
| Pyrolysis and gasification characterization of sewage sludge for high quality gas and char production.Crossref | GoogleScholarGoogle Scholar |
Cieślik BM, Namieśnik J, Konieczka P (2015). Review of sewage sludge management: standards, regulations and analytical methods. Journal of Cleaner Production 90, 1–15.
| Review of sewage sludge management: standards, regulations and analytical methods.Crossref | GoogleScholarGoogle Scholar |
Cui H, Ninomiya Y, Masui M, Mizukoshi H, Sakano T, Kanaoka C (2006). Fundamental Behaviors in Combustion of Raw Sewage Sludge. Energy & Fuels 20, 77–83.
| Fundamental Behaviors in Combustion of Raw Sewage Sludge.Crossref | GoogleScholarGoogle Scholar |
Darvodelsky P (2011) Biosolids snapshot. The Department of Sustainability, Environment, Water, Population and Communities. Australia. https://www.agriculture.gov.au/sites/default/files/documents/biosolids-snapshot.pdf/ [verified on 9 December 2022]
de Andrés JM, Narros A, Rodríguez ME (2011a). Air-steam gasification of sewage sludge in a bubbling bed reactor: Effect of alumina as a primary catalyst. Fuel Processing Technology 92, 433–440.
| Air-steam gasification of sewage sludge in a bubbling bed reactor: Effect of alumina as a primary catalyst.Crossref | GoogleScholarGoogle Scholar |
de Andrés JM, Narros A, Rodríguez ME (2011b). Behaviour of dolomite, olivine and alumina as primary catalysts in air–steam gasification of sewage sludge. Fuel 90, 521–527.
| Behaviour of dolomite, olivine and alumina as primary catalysts in air–steam gasification of sewage sludge.Crossref | GoogleScholarGoogle Scholar |
Dogru M, Midilli A, Howarth CR (2002). Gasification of sewage sludge using a throated downdraft gasifier and uncertainty analysis. Fuel Processing Technology 75, 55–82.
| Gasification of sewage sludge using a throated downdraft gasifier and uncertainty analysis.Crossref | GoogleScholarGoogle Scholar |
Donatello S, Cheeseman CR (2013). Recycling and recovery routes for incinerated sewage sludge ash (ISSA): a review. Waste Management 33, 2328–2340.
| Recycling and recovery routes for incinerated sewage sludge ash (ISSA): a review.Crossref | GoogleScholarGoogle Scholar |
Dubinin MM (1966) Porous structure and adsorption properties of active carbons. In ‘Chemistry and Physics of Carbon. Vol. 2’. (Ed. PJ Walker Jr) pp. 51–120. (Marcel Dekker: New York)
Fairous S, Rusnah S, Maryam H (2010) Potential source of bio-fuel from pyrolysis of treated sewage sludge. In ‘2010 International Conference on Science and Social Research (CSSR 2010)’, 5–7 December 2010, Kuala Lumpur, Malaysia. pp. 1272–1277 (IEEE)
| Crossref |
Fan H, Zhou H, Wang J (2014). Pyrolysis of municipal sewage sludges in a slowly heating and gas sweeping fixed-bed reactor. Energy Conversion and Management 88, 1151–1158.
| Pyrolysis of municipal sewage sludges in a slowly heating and gas sweeping fixed-bed reactor.Crossref | GoogleScholarGoogle Scholar |
Fenwick G (2016) Achiving the biosolids strategy at Sandgate Sewage Treatment Plant. In ‘79th Annual WIOA Victorian Water Industry Operations Conference and Exhibition’. 31 August–1 September 2016, Bendigo, VIC, Australia. (Water Industry Operators Association of Australia (WIOA)). Available at http://www.wioa.org.au/conference_papers/2016_vic/documents/Gary_Fenwick.pdf
Fonts I, Juan A, Gea G, Murillo MB, Sánchez JL (2008). Sewage Sludge Pyrolysis in Fluidized Bed, 1: Influence of Operational Conditions on the Product Distribution. Industrial & Engineering Chemistry Research 47, 5376–5385.
| Sewage Sludge Pyrolysis in Fluidized Bed, 1: Influence of Operational Conditions on the Product Distribution.Crossref | GoogleScholarGoogle Scholar |
Fuentes-Cano D, Gómez-Barea A, Nilsson S, Ollero P (2013). The influence of temperature and steam on the yields of tar and light hydrocarbon compounds during devolatilization of dried sewage sludge in a fluidized bed. Fuel 108, 341–350.
| The influence of temperature and steam on the yields of tar and light hydrocarbon compounds during devolatilization of dried sewage sludge in a fluidized bed.Crossref | GoogleScholarGoogle Scholar |
Fytili D, Zabaniotou A (2008). Utilization of sewage sludge in EU application of old and new methods—A review. Renewable and Sustainable Energy Reviews 12, 116–140.
| Utilization of sewage sludge in EU application of old and new methods—A review.Crossref | GoogleScholarGoogle Scholar |
Gikas P (2017). Ultra high temperature gasification of municipal wastewater primary biosolids in a rotary kiln reactor for the production of synthesis gas. Journal of Environmental Management 203, 688–694.
| Ultra high temperature gasification of municipal wastewater primary biosolids in a rotary kiln reactor for the production of synthesis gas.Crossref | GoogleScholarGoogle Scholar |
Gil-Lalaguna N, Sánchez JL, Murillo MB, Rodríguez E, Gea G (2014). Air–steam gasification of sewage sludge in a fluidized bed. Influence of some operating conditions. Chemical Engineering Journal 248, 373–382.
| Air–steam gasification of sewage sludge in a fluidized bed. Influence of some operating conditions.Crossref | GoogleScholarGoogle Scholar |
Gomez-Barea A, Nilsson S, Vidal Barrero F, Campoy M (2010). Devolatilization of wood and wastes in fluidized bed. Fuel Processing Technology 91, 1624–1633.
| Devolatilization of wood and wastes in fluidized bed.Crossref | GoogleScholarGoogle Scholar |
Gong M, Zhu W, Fan Y, Zhang H, Su Y (2016). Influence of the reactant carbon–hydrogen–oxygen composition on the key products of the direct gasification of dewatered sewage sludge in supercritical water. Bioresource Technology 208, 81–86.
| Influence of the reactant carbon–hydrogen–oxygen composition on the key products of the direct gasification of dewatered sewage sludge in supercritical water.Crossref | GoogleScholarGoogle Scholar |
Gonzaga MIS, Mackowiak CL, Comerford NB, Moline EFdV, Shirley JP, Guimaraes DV (2017). Pyrolysis methods impact biosolids-derived biochar composition, maize growth and nutrition. Soil and Tillage Research 165, 59–65.
| Pyrolysis methods impact biosolids-derived biochar composition, maize growth and nutrition.Crossref | GoogleScholarGoogle Scholar |
Good J, Ventress L, Knoef H, Zielke U, Hansen PL, Kamp WVD, Wild PD, Coda B, Paasen SV, Kiel J, Sjöström K, Liliedahl T, Unger C, Neeft J, Suomalainen M, Simell P (2005) Sampling and analysis of tar and particles in biomass producer gases, Technical Report prepared under CEN BT/TF 143 “Organic contaminants (“tar”) in biomass producer gases”. Available at http://www.eeci.net/results/pdf/Technical-Report-version-3_8-final.pdf [verified May 2018]
Hannl TK, Häggström G, Hedayati A, Skoglund N, Kuba M, Öhman M (2022). Ash transformation during single-pellet gasification of sewage sludge and mixtures with agricultural residues with a focus on phosphorus. Fuel Processing Technology 227, 107102
| Ash transformation during single-pellet gasification of sewage sludge and mixtures with agricultural residues with a focus on phosphorus.Crossref | GoogleScholarGoogle Scholar |
Hedayati A, Lindgren R, Skoglund N, Boman C, Kienzl N, Öhman M (2021). Ash Transformation during Single-Pellet Combustion of Agricultural Biomass with a Focus on Potassium and Phosphorus. Energy & Fuels 35, 1449–1464.
| Ash Transformation during Single-Pellet Combustion of Agricultural Biomass with a Focus on Potassium and Phosphorus.Crossref | GoogleScholarGoogle Scholar |
Herzel H, Krüger O, Hermann L, Adam C (2016). Sewage sludge ash — A promising secondary phosphorus source for fertilizer production. Science of the Total Environment 542, 1136–1143.
| Sewage sludge ash — A promising secondary phosphorus source for fertilizer production.Crossref | GoogleScholarGoogle Scholar |
Hla SS, Roberts D (2015). Characterisation of chemical composition and energy content of green waste and municipal solid waste from Greater Brisbane, Australia. Waste Management 41, 12–19.
| Characterisation of chemical composition and energy content of green waste and municipal solid waste from Greater Brisbane, Australia.Crossref | GoogleScholarGoogle Scholar |
Hla SS, Lopes R, Roberts D (2016). The CO2 gasification reactivity of chars produced from Australian municipal solid waste. Fuel 185, 847–854.
| The CO2 gasification reactivity of chars produced from Australian municipal solid waste.Crossref | GoogleScholarGoogle Scholar |
Hla SS, Ilyushechkin A, Ord L, Roberts D (2020) Database of chemical properties of Australian biomass and waste, v13, CSIRO Data Collection. Available at https://sc-63-cdc.it.csiro.au/content/19/ [verified December 2020]
Hodge EM (2009) The coal char–COreaction at high temperature and high pressure. PhD thesis, School of Chemical Engineering and Industrial Chemistry, University of New South Wales, Sydney, Australia.
Hwang IH, Ouchi Y, Matsuto T (2007). Characteristics of leachate from pyrolysis residue of sewage sludge. Chemosphere 68, 1913–1919.
| Characteristics of leachate from pyrolysis residue of sewage sludge.Crossref | GoogleScholarGoogle Scholar |
Inguanzo M, Menéndez JA, Fuente E, Pis JJ (2001). Reactivity of pyrolyzed sewage sludge in air and CO2. Journal of Analytical and Applied Pyrolysis 58–59, 943–954.
| Reactivity of pyrolyzed sewage sludge in air and CO2.Crossref | GoogleScholarGoogle Scholar |
ISO (2015) ISO 18134-3:2015 Solid biofuels — Determination of moisture content —Oven dry method — Part 3: Moisture in general analysis sample, https://www.iso.org/standard/61637.html/ [verified on 9 December 2022]
Jaramillo-Arango A, Fonts I, Chejne F, Arauzo J (2016). Product compositions from sewage sludge pyrolysis in a fluidized bed and correlations with temperature. Journal of Analytical and Applied Pyrolysis 121, 287–296.
| Product compositions from sewage sludge pyrolysis in a fluidized bed and correlations with temperature.Crossref | GoogleScholarGoogle Scholar |
Jayaraman K, Gökalp I (2015). Pyrolysis, combustion and gasification characteristics of miscanthus and sewage sludge. Energy Conversion and Management 89, 83–91.
| Pyrolysis, combustion and gasification characteristics of miscanthus and sewage sludge.Crossref | GoogleScholarGoogle Scholar |
Jensen PA, Frandsen FJ, Dam-Johansen K, Sander B (2000). Experimental Investigation of the Transformation and Release to Gas Phase of Potassium and Chlorine during Straw Pyrolysis. Energy & Fuels 14, 1280–1285.
| Experimental Investigation of the Transformation and Release to Gas Phase of Potassium and Chlorine during Straw Pyrolysis.Crossref | GoogleScholarGoogle Scholar |
Jin J, Li Y, Zhang J, Wu S, Cao Y, Liang P, Zhang J, Wong MH, Wang M, Shan S, Christie P (2016). Influence of pyrolysis temperature on properties and environmental safety of heavy metals in biochars derived from municipal sewage sludge. Journal of Hazardous Materials 320, 417–426.
| Influence of pyrolysis temperature on properties and environmental safety of heavy metals in biochars derived from municipal sewage sludge.Crossref | GoogleScholarGoogle Scholar |
Kirkels AF, Verbong GPJ (2011). Biomass gasification: Still promising? A 30-year global overview. Renewable and Sustainable Energy Reviews 15, 471–481.
| Biomass gasification: Still promising? A 30-year global overview.Crossref | GoogleScholarGoogle Scholar |
Li QH, Zhang YG, Meng AH, Li L, Li GX (2013). Study on ash fusion temperature using original and simulated biomass ashes. Fuel Processing Technology 107, 107–112.
| Study on ash fusion temperature using original and simulated biomass ashes.Crossref | GoogleScholarGoogle Scholar |
Li M, Tang Y, Lu XY, Zhang Z, Cao Y (2018). Phosphorus speciation in sewage sludge and the sludge-derived biochar by a combination of experimental methods and theoretical simulation. Water Research 140, 90–99.
| Phosphorus speciation in sewage sludge and the sludge-derived biochar by a combination of experimental methods and theoretical simulation.Crossref | GoogleScholarGoogle Scholar |
Liu H, Wang Y, Hu H, Fu B, Yao H, Wendt JOL (2020). Enrichment mechanism of arsenic in fine ash deposits during co-combustion of rice husk and coal. Fuel 281, 118712
| Enrichment mechanism of arsenic in fine ash deposits during co-combustion of rice husk and coal.Crossref | GoogleScholarGoogle Scholar |
Lu T, Yuan H, Wang Y, Huang H, Chen Y (2015). Characteristic of heavy metals in biochar derived from sewage sludge. Journal of Material Cycles and Waste Management 18, 725–733.
| Characteristic of heavy metals in biochar derived from sewage sludge.Crossref | GoogleScholarGoogle Scholar |
Lundin M, Olofsson M, Pettersson GJ, Zetterlund H (2004). Environmental and economic assessment of sewage sludge handling options. Resources, Conservation and Recycling 41, 255–278.
| Environmental and economic assessment of sewage sludge handling options.Crossref | GoogleScholarGoogle Scholar |
Midilli A, Dogru M, Howarth CR, Ling MJ, Ayhan T (2001). Combustible gas production from sewage sludge with a downdraft gasifier. Energy Conversion and Management 42, 157–172.
| Combustible gas production from sewage sludge with a downdraft gasifier.Crossref | GoogleScholarGoogle Scholar |
Moon J, Mun T-Y, Yang W, Lee U, Hwang J, Jang E, Choi C (2015). Effects of hydrothermal treatment of sewage sludge on pyrolysis and steam gasification. Energy Conversion and Management 103, 401–407.
| Effects of hydrothermal treatment of sewage sludge on pyrolysis and steam gasification.Crossref | GoogleScholarGoogle Scholar |
Nidheesh PV, Gopinath A, Ranjith N, Praveen Akre A, Sreedharan V, Suresh Kumar M (2021). Potential role of biochar in advanced oxidation processes: A sustainable approach. Chemical Engineering Journal 405, 126582
| Potential role of biochar in advanced oxidation processes: A sustainable approach.Crossref | GoogleScholarGoogle Scholar |
Nilsson S, Gómez-Barea A, Cano DF (2012). Gasification reactivity of char from dried sewage sludge in a fluidized bed. Fuel 92, 346–353.
| Gasification reactivity of char from dried sewage sludge in a fluidized bed.Crossref | GoogleScholarGoogle Scholar |
Nilsson S, Gómez-Barea A, Ollero P (2013). Gasification of char from dried sewage sludge in fluidized bed: Reaction rate in mixtures of CO2 and H2O. Fuel 105, 764–768.
| Gasification of char from dried sewage sludge in fluidized bed: Reaction rate in mixtures of CO2 and H2O.Crossref | GoogleScholarGoogle Scholar |
Nowicki L, Antecka A, Bedyk T, Stolarek P, Ledakowicz S (2011). The kinetics of gasification of char derived from sewage sludge. Journal of Thermal Analysis and Calorimetry 104, 693–700.
| The kinetics of gasification of char derived from sewage sludge.Crossref | GoogleScholarGoogle Scholar |
Park HJ, Heo HS, Park Y-K, Yim J-H, Jeon J-K, Park J, Ryu C, Kim S-S (2010). Clean bio-oil production from fast pyrolysis of sewage sludge: Effects of reaction conditions and metal oxide catalysts. Bioresource Technology 101, S83–S85.
| Clean bio-oil production from fast pyrolysis of sewage sludge: Effects of reaction conditions and metal oxide catalysts.Crossref | GoogleScholarGoogle Scholar |
Quispe I, Navia R, Kahhat R (2017). Energy potential from rice husk through direct combustion and fast pyrolysis: A review. Waste Management 59, 200–210.
| Energy potential from rice husk through direct combustion and fast pyrolysis: A review.Crossref | GoogleScholarGoogle Scholar |
Raheem A, Sikarwar VS, He J, Dastyar W, Dionysiou DD, Wang W, Zhao M (2018). Opportunities and challenges in sustainable treatment and resource reuse of sewage sludge: A review. Chemical Engineering Journal 337, 616–641.
| Opportunities and challenges in sustainable treatment and resource reuse of sewage sludge: A review.Crossref | GoogleScholarGoogle Scholar |
Roberts DG, Harris DJ (2000). Char Gasification with O2, CO2 and H2O: Effects of Pressure on Intrinsic Reaction Kinetics. Energy & Fuels 14, 483–489.
| Char Gasification with O2, CO2 and H2O: Effects of Pressure on Intrinsic Reaction Kinetics.Crossref | GoogleScholarGoogle Scholar |
Roy MM, Dutta A, Corscadden K, Havard P, Dickie L (2011). Review of biosolids management options and co-incineration of a biosolid-derived fuel. Waste Management 31, 2228–2235.
| Review of biosolids management options and co-incineration of a biosolid-derived fuel.Crossref | GoogleScholarGoogle Scholar |
Rulkens WH, Bien JD (2004). Recovery of energy from sludge – Comparison of the various options. Water Science and Technology 50, 213–221.
| Recovery of energy from sludge – Comparison of the various options.Crossref | GoogleScholarGoogle Scholar |
Sattar A, Leeke GA, Hornung A, Wood J (2014). Steam gasification of rapeseed, wood, sewage sludge and miscanthus biochars for the production of a hydrogen-rich syngas. Biomass and Bioenergy 69, 276–286.
| Steam gasification of rapeseed, wood, sewage sludge and miscanthus biochars for the production of a hydrogen-rich syngas.Crossref | GoogleScholarGoogle Scholar |
Saveyn H, Ferrasse JH, Hernandez AB, Rose J, Meeren PVd, Roche N (2011). The Distribution of Heavy Metals Following Sewage Sludge Gasification. Journal of Residuals Science and Technology 8, 61–66.
Saw W, McKinnon H, Gilmour I, Pang S (2012). Production of hydrogen-rich syngas from steam gasification of blend of biosolids and wood using a dual fluidised bed gasifier. Fuel 93, 473–478.
| Production of hydrogen-rich syngas from steam gasification of blend of biosolids and wood using a dual fluidised bed gasifier.Crossref | GoogleScholarGoogle Scholar |
Scott SA, Davidson JF, Dennis JS, Fennell PS, Hayhurst AN (2005). The rate of gasification by CO2 of chars from waste. Proceedings of the Combustion Institute 30, 2151–2159.
| The rate of gasification by CO2 of chars from waste.Crossref | GoogleScholarGoogle Scholar |
Seredych M, Bandosz TJ (2007). Sewage sludge as a single precursor for development of composite adsorbents/catalysts. Chemical Engineering Journal 128, 59–67.
| Sewage sludge as a single precursor for development of composite adsorbents/catalysts.Crossref | GoogleScholarGoogle Scholar |
Shao J, Yan R, Chen H, Wang B, Lee DH, Liang DT (2008). Pyrolysis Characteristics and Kinetics of Sewage Sludge by Thermogravimetry Fourier Transform Infrared Analysis. Energy & Fuels 22, 38–45.
| Pyrolysis Characteristics and Kinetics of Sewage Sludge by Thermogravimetry Fourier Transform Infrared Analysis.Crossref | GoogleScholarGoogle Scholar |
Shao Y, Tan H, Shen D, Zhou Y, Jin Z, Zhou D, Lu W, Long Y (2020). Synthesis of improved hydrochar by microwave hydrothermal carbonization of green waste. Fuel 266, 117146
| Synthesis of improved hydrochar by microwave hydrothermal carbonization of green waste.Crossref | GoogleScholarGoogle Scholar |
Singh RP, Agrawal M (2008). Potential benefits and risks of land application of sewage sludge. Waste Management 28, 347–358.
| Potential benefits and risks of land application of sewage sludge.Crossref | GoogleScholarGoogle Scholar |
Skoglund N, Bäfver L, Fahlström J, Holmén E, Renström C (2016). Fuel design in co-combustion of demolition wood chips and municipal sewage sludge. Fuel Processing Technology 141, 196–201.
| Fuel design in co-combustion of demolition wood chips and municipal sewage sludge.Crossref | GoogleScholarGoogle Scholar |
Song W, Guo M (2012). Quality variations of poultry litter biochar generated at different pyrolysis temperatures. Journal of Analytical and Applied Pyrolysis 94, 138–145.
| Quality variations of poultry litter biochar generated at different pyrolysis temperatures.Crossref | GoogleScholarGoogle Scholar |
Spanos T, Ene A, Styliani Patronidou C, Xatzixristou C (2016). Temporal variability of sewage sludge heavy metal content from Greek wastewater treatment plants. Ecological Chemistry and Engineering S 23, 271–283.
| Temporal variability of sewage sludge heavy metal content from Greek wastewater treatment plants.Crossref | GoogleScholarGoogle Scholar |
Stylianou M, Christou A, Dalias P, Polycarpou P, Michael C, Agapiou A, Papanastasiou P, Fatta-Kassinos D (2020). Physicochemical and structural characterization of biochar derived from the pyrolysis of biosolids, cattle manure and spent coffee grounds. Journal of the Energy Institute 93, 2063–2073.
| Physicochemical and structural characterization of biochar derived from the pyrolysis of biosolids, cattle manure and spent coffee grounds.Crossref | GoogleScholarGoogle Scholar |
Syed-Hassan SSA, Wang Y, Hu S, Su S, Xiang J (2017). Thermochemical processing of sewage sludge to energy and fuel: Fundamentals, challenges and considerations. Renewable and Sustainable Energy Reviews 80, 888–913.
| Thermochemical processing of sewage sludge to energy and fuel: Fundamentals, challenges and considerations.Crossref | GoogleScholarGoogle Scholar |
Thy P, Jenkins B, Grundvig S, Shiraki R, Lesher C (2006). High temperature elemental losses and mineralogical changes in common biomass ashes. Fuel 85, 783–795.
| High temperature elemental losses and mineralogical changes in common biomass ashes.Crossref | GoogleScholarGoogle Scholar |
Tippayawong N, Chaichana C, Promwungkwa A, Rerkkriangkrai P (2013). Investigation of a Small Biomass Gasifier–engine System Operation and Its Application to Water Pumping in Rural Thailand. Energy Sources, Part A: Recovery, Utilization, and Environmental Effects 35, 476–486.
| Investigation of a Small Biomass Gasifier–engine System Operation and Its Application to Water Pumping in Rural Thailand.Crossref | GoogleScholarGoogle Scholar |
Tyagi VK, Lo S-L (2013). Sludge: A waste or renewable source for energy and resources recovery?. Renewable and Sustainable Energy Reviews 25, 708–728.
| Sludge: A waste or renewable source for energy and resources recovery?.Crossref | GoogleScholarGoogle Scholar |
Tytła M, Widziewicz K, Zielewicz E (2016). Heavy metals and its chemical speciation in sewage sludge at different stages of processing. Environmental Technology 37, 899–908.
| Heavy metals and its chemical speciation in sewage sludge at different stages of processing.Crossref | GoogleScholarGoogle Scholar |
Vassilev SV, Baxter D, Andersen LK, Vassileva CG, Morgan TJ (2012). An overview of the organic and inorganic phase composition of biomass. Fuel 94, 1–33.
| An overview of the organic and inorganic phase composition of biomass.Crossref | GoogleScholarGoogle Scholar |
Werle S (2015). Gasification of a Dried Sewage Sludge in a Laboratory Scale Fixed Bed Reactor. Energy Procedia 66, 253–256.
| Gasification of a Dried Sewage Sludge in a Laboratory Scale Fixed Bed Reactor.Crossref | GoogleScholarGoogle Scholar |
Werle S, Dudziak M (2014). Gaseous fuels production from dried sewage sludge via air gasification. Waste Management & Research 32, 601–607.
| Gaseous fuels production from dried sewage sludge via air gasification.Crossref | GoogleScholarGoogle Scholar |
Xu M, Li D, Yan Y, Guo T, Pang H, Xue H (2017). Porous high specific surface area-activated carbon with co-doping N, S and P for high-performance supercapacitors. RSC Advances 7, 43780–43788.
| Porous high specific surface area-activated carbon with co-doping N, S and P for high-performance supercapacitors.Crossref | GoogleScholarGoogle Scholar |
Zheng S, Yang Y, Li X, Liu H, Yan W, Sui R, Lu Q (2020). Temperature and emissivity measurements from combustion of pine wood, rice husk and fir wood using flame emission spectrum. Fuel Processing Technology 204, 106423
| Temperature and emissivity measurements from combustion of pine wood, rice husk and fir wood using flame emission spectrum.Crossref | GoogleScholarGoogle Scholar |


 = AlPO4, ◼ = Al2CaSi2O8,
  = stanfieldite, Ca4Mg5(PO4)6, ◻ = spinel, MgxFe1−xAl2O4, ▼ = Fe2O3, ● = carbon.