Data quality improvement for field-portable gas chromatography-mass spectrometry through the use of isotopic analogues for in-situ calibration
Anthony Qualley A C , Geoffrey T. Hughes A and Mitchell H. Rubenstein B
A UES, Inc., Air Force Research Laboratory, 711th Human Performance Wing/RHMO, 2510 Fifth Street, Area B, Building 840, Wright-Patterson AFB, OH 45433, USA.
B United States Air Force 711th Wing – Air Force Research Laboratory, 711th Human Performance Wing/RHMO, 2510 Fifth Street, Area B, Building 840, Wright-Patterson AFB, OH 45433, USA.
C Corresponding author. Email: anthony.qualley.ctr@us.af.mil
Environmental Chemistry 17(1) 28-38 https://doi.org/10.1071/EN19134
Submitted: 13 May 2019 Accepted: 7 August 2019 Published: 12 September 2019
Journal Compilation © CSIRO 2020 Open Access CC BY-NC-ND
Environmental context. Quantitative field-based sampling of airborne volatile organics continues to be a challenge because of the absence of laboratory supplies and facilities. Approaches are required to overcome poor data arising from difficulties with calibration of fielded instruments. This method normalises responses across portable thermal desorption gas-chromatography mass spectrometers and requires no advance calibration, enabling accurate and precise use of previously established response factors ported from the laboratory to fielded instruments.
Abstract. Sorbent capture provides a process for collecting airborne volatile organic compounds (VOCs) for analysis by thermal desorption gas chromatography-mass spectrometry (TD-GC-MS). Under typical laboratory conditions, analytical standards are readily available and calibration of instrumentation is a routine process. In contrast, field-portable instruments are standardised using a representative curve prepared on a limited number of instruments and then applied to fielded units. The performance of field-portable TD-GC-MS systems when deployed to multiple remote sites was studied, and a large variability in sensitivity and performance was observed when using the manufacturer-prescribed methods for calibration of instruments and normalisation of the data. This variability was remedied by the implementation of a non-interfering calibration that is pre-incorporated onto the sorbent media. Use of an in-situ calibration curve constructed using stable isotope labelled standards provided robust quantification, accuracy of measurement and diagnostic capabilities for malfunctioning fielded equipment. Pre-incorporation of isotopic analogues onto thermal desorption tubes in advance of field distribution greatly improves the accuracy and reproducibility of analyses and demonstrates, for the first time, definitive quantification of target analytes using field-portable GC-MS in an operational theatre.
Introduction
Technological advances in instrumentation have revolutionised analytical chemistry whilst increasing the dependency upon laboratory infrastructure to leverage such innovations. Mechanisation has simplified control over gas and liquid chromatographs while providing robotic sample preparation and injection. Chemical standards are available online from vast repositories with rapid fulfillment. High-purity generators and uninterruptible power supplies deliver consistent and clean gasses and electricity to sensitive benchtop equipment. Sophisticated data collection and analysis tools simplify and automate batch processing of quantitative sample analyses. Although these tools are common to modern laboratories, field-portable instrumentation lacks such amenities and protocols must be adapted for austere environments.
Field-portable instrumentation for gas chromatography-mass spectrometry (GC-MS) is now at a level of maturity that its deployment is fairly commonplace. Commercially available instrumentation now exists that is usable in trailers and rugged vehicles, and can even be powered by rechargeable batteries and worn on the operator’s back. Despite the obvious benefits, all of the advantages of a controlled laboratory environment are traded for portability, which lead to difficulties in calibration, less than reliable quantification, unnoticed instrument malfunctions, and other problems yielding poor data that are difficult to reproduce (Smith et al. 2004). This is especially unfortunate because most field-portable instrumentation is used in situations of urgency that necessitate near real-time chemical analysis readout (Sekiguchi et al. 2006). Chemical spills assessment, explosives detection, detection of chemical warfare agents and many other deadly scenarios play out at a pace excluding the possibility of reach-back laboratory support, and result in a huge deployment of field-portable GC-MS equipment by governments.
The HAPSITE (Hazardous Air Pollutants on Site) portable GC-MS is used extensively for risk and safety assessments worldwide by first responders and bioenvironmental engineers. While the HAPSITE has undergone several iterations over the years, the most current model, the extended range HAPSITE-ER includes capabilities allowing for extremely sensitive detection and quantification of trace volatiles collected on thermal desorption (TD) tubes. Previously, our laboratories have investigated the TD capabilities of the HAPSITE-ER in comparison to the legacy probe-type design, which has illustrated that shortcomings exist in the probe sampler concerning semi-volatiles and those VOCs having lower vapor pressures (Kwak et al. 2014). To further evaluate TD as a technique suitable for use in the field, researchers showed the physical robustness of TD tubes in conditions approximating the most challenging environments often encountered in a militarily relevant field setting (Harshman et al. 2015).
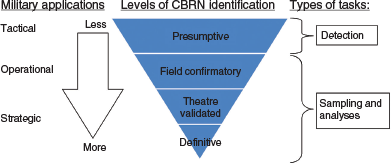
To add robustness to TD analyses, the HAPSITE-ER-TD (hereafter referred to as HER) automatically incorporates bromopentafluorobenzene (BPFB) internal standard (IS#2) as a means of data normalisation. Though these capabilities are a tremendous advantage, the additional complexity of the instrumentation once again reminds us that performing complex chemical analysis in the field is a formidable challenge. Field instruments rely on a calibration performed at the factory or in a reach-back laboratory, often months or years in advance, which limits the flexibility of the analytical method to address variability in instrument performance. The calibration curve is integrated into the software with little to no verification for individual instruments. This approach differs from laboratory practice where chemical-specific standards are frequently run in accordance with a quality assurance program. Our goal is to improve the quality of the data from presumptive to definitive as presented in Fig. 1 (Joint Environmental Surveillance Work Group 2009). Our approach will be discussed in this paper.
|
Recently, extensive testing of the HER was performed to identify the limitations of this portable GC-MS system that are problematic during field experiments (Harshman et al. 2017). It was observed that a few select units showed extreme variability in the measured response to IS#2, which lead to a greater variability in normalised data when compared with non-normalised data. While those experiments demonstrated the capability of obtaining minimum detection limits (MDLs) comparable to gold-standard (benchtop) instrumentation (Martin et al. 2016), issues of inter-instrument variability have been observed that suggest the typical practice of applying relative response factors (RRfs) obtained from one or more representative units across a broad swath of deployed field instruments is likely to generate unacceptable errors in quantification (Harshman et al. 2017). Thus, the US Environmental Protection Agency (EPA)-prescribed practice of using an internal standard compound for normalising instrument responses is unreliable on this instrumentation because of the lack of on-site calibration (US Environmental Protection Agency 1999). Likewise, the protocol described in the HER operations manual is in need of augmentation: ‘Combining calibration data from three different HAPSITE units resulted in calibration curve RSDs averaging 34 %. As a result, these curves are considered to be portable and are usable with any HAPSITE when on-site calibration curve creation is not possible’ (Inficon 2006). Such data is only field confirmatory and insufficient where quantitative analyses are required and falls outside of the established EPA criteria in the TO-17 method calling for ‘Duplicate (analytical) precision within 20 % on synthetic samples of a given target gas or vapor in a typical target gas or vapor mix in humidified zero air’ (US Environmental Protection Agency 1999).
To address issues observed in quantification while using the HER (as well as any other GC-MS instruments having TD capabilities), we tested the efficacy of incorporating isotopic analogues of diethyl malonate (DEM), a chemical warfare agent simulant for soman and sarin nerve agents onto TD tubes before any sampling or analysis as a method of normalisation and/or in situ calibration. This approach represents a novel adaptation of isotope dilution quantification suitable for use with VOC sampling in a field setting. Though a similar methodology is used for analysing VOCs from solid-phase microextraction samples (Frank et al. 2019; Duhamel et al. 2018; Liao et al. 2016) and with stir-bar sorptive extraction (Bridoux et al. 2015), our approach differs in that sorbent media is pre-loaded with a stable isotope labelled standard before sample collection. Our experimental data shows that pre-incorporating isotope analogues of DEM allows an extremely precise, accurate and reliable methodology for quantification from TD-GC-MS data when compared with more traditional methods, especially when using IS#2 for normalisation as prescribed for the HER. DEM was chosen for this experiment owing to the availability of labelled standards, in contrast to stable isotope labelled BPFB that would have required custom synthesis. Additionally, as a semi-volatile compound, DEM is a better surrogate for chemical warfare agents and a relevant target analyte for the HER. To test the efficacy of this practice in the most challenging of scenarios, sample tubes were pre-loaded with unlabelled DEM at varying concentrations alongside three isotopic analogues of DEM at fixed, titrated concentrations. Samples were deployed to eight field locations across the continental USA for analysis by multiple instruments (one location was unable to submit results owing to improperly operating equipment), conducted by personnel having a broad range of user experience operating the HER. Potential confounding factors that tested the robustness of our proposed normalisation and calibration methods included operator experience, intra- and inter-instrumental variation, sample tube shipping and storage for up to 150 days, environmental conditions at the site of analysis and variability of IS#2. Data from the field study that is presented here shows how use of these normalisation and calibration compounds as an innate component of each sample tube allowed the HER to meet or exceed EPA-established quality assurance and quality control (QA/QC) thresholds for the TO-17 compendium method (<40 % relative standard deviation (s.d.), 60–140 % recovery) and with far greater quantitative accuracy than is otherwise obtainable. To avoid confusion with the HER BFPB internal standard, the DEM isotopic analogues are hereafter referred to as focusing agents (FAs) (Rubenstein 2017). This is the only study of its kind, not only evaluating the practical performance of a field portable TD-GC-MS in the hands of the end-users but also testing a novel and facile method for correcting and normalising data received from 12 uncalibrated instruments. We propose that the practice of using appropriate focusing agents with any TD-equipped GC-MS instrumentation should drastically improve the reliability of such equipment and reduce the maintenance and calibration intervals currently required to meet established QA/QC standards, which will greatly improve the throughput for the production laboratory setting.
Experimental
Supplies and reagents
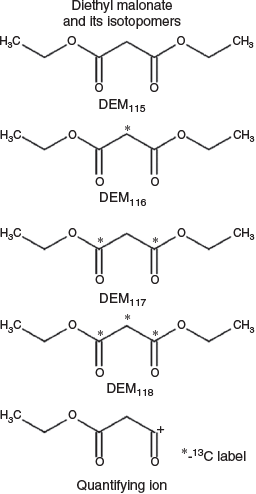
Analytes measured in these experiments included IS#2 and four isotopic analogues of DEM, whose structures and designations herein are indicated in Fig. 2. All variants of DEM were purchased from Sigma-Aldrich and had an isotopic purity of 99 %. Stainless steel tubes, 3.5″ × 0.25″, packed with TENAX-TA 35/60 mesh, were purchased from Markes International (Sacramento, CA, USA). HER systems with thermal desorption sampling systems (TDSS), concentrators, compressed canisters of nitrogen and ISTD mixture were obtained from Inficon (East Syracuse, NY, USA). All TD tubes were conditioned before use as described by the manufacturer.
|
External calibration – RRf determination
Prior to conducting field tests, two HER units were used to obtain RRf values for DEM, using IS#2 and the three labelled DEM standards as normalisation factors (raw data included in Table S1, Supplementary Material). Data from HER units 112 and 121 were averaged and RRf values against IS#2 were determined (2.588 ± 0.415). RRf values between unlabelled DEM and its isotopic analogues were verified to be at or very near 1 (0.9622 ± 0.0556). All RRf values were determined using the formula:

where RRf = relative response factor, Ax = area of the primary ion for the compound to be measured (counts), Ais = area of the primary ion for the internal standard (counts), Cis = amount of internal standard or FA loaded (ng) and Cx = amount of the DEM115 in the calibration standard (ng).
To calculate RRfs using the HER IS#2 compound, it was helpful to determine the static amount of IS#2 that was injected onto the GC-MS for each run as this is not provided by the instrument manufacturer. To calculate this, stable isotope labelled BPFB was pre-loaded onto TD tubes and the IS#2 concentration was determined relative to the response of known quantities of labelled BPFB. A total of seven samples were analysed using three different HER units, which yielded a value of 50 ng per sample with a s.d. of <3 ng. IS#2 was quantified using the extracted ion chromatogram for m/z 117 and DEM peak areas were determined using extracted ion chromatograms based upon the primary fragment in electron ionization mass spectrometry (EI-MS; see Fig. 2), which corresponded to m/z values of 115, 116, 117 and 118 for the four respective isotopic analogues of DEM.
Sample preparation
TD tube samples were prepared at Wright-Patterson Air Force Base (WPAFB) for deployment to the seven remote field locations. Tubes were pre-loaded with DEM115 and three isotopic analogues (DEM116, DEM117 and DEM118) having 1–3 13C atoms to allow for their distinction by the mass spectrometers (Fig. 2). DEM116, DEM117 and DEM118 were pre-diluted to desired concentrations using acetonitrile and loaded onto the tubes using a calibration solution-loading rig (Markes International; Sacramento, CA, USA) with a static flow of nitrogen at 50 mL min−1. Each three-point in situ curve was composed of DEM116, DEM117 and DEM118 at 25, 49.7 and 75.5 ng, respectively. After loading, acetonitrile was purged by holding the tubes at 50 °C and flushing with N2 for 90 min at 50–75 mL min−1. DEM115 was diluted into methanol and loaded at varying concentrations using the same methodology. Post-analysis, linear regression was performed on each three-point calibration independently and the derived equation used to calculate the amount of DEM115 measured from each tube.
Sample distribution
Conducted over six months in total, a set of three pre-loaded tubes plus one blank was sent to each of seven field locations throughout the continental United States and one set was retained at WPAFB as a control sample set. Upon receipt, tubes were stored at ambient temperature before analysis. This was done on a bi-monthly basis for a total of three times to complete the field study. Accompanying each sample set was a cover letter (Fig. S1, Supplementary Material), with written and graphic instructions for installation and use of the TDSS, a factory-preconfigured HER method (CWA method; TD_Tenax_Tribed_310C; Inficon) with an Excel spreadsheet configured for extracted ion chromatograms of the target compounds, as well as two slide decks giving instructions on returning data input and spreadsheet generation (materials available upon request). Unfortunately, as discussed below, one field location was omitted from the study owing to equipment failure. Therefore, all external field locations are hereafter referred to as FL# 1–6.
Analytical methods
Samples were analysed within 1 to 134 days after loading. Metadata collected at the time of analyses requested the date, barometric pressure, ambient temperature, and location altitude (Table S2, Supplementary Material). GC-MS conditions were based upon the factory method for TO-17 analysis and used a 100 % polydimethylsiloxane column (15 m × 0.25 mm ID; 1.0 µm film thickness). The column temperature, membrane and valve oven were set at 60, 120 and 120 °C respectively, and the temperature of the TDSS was set to 310 °C. The TDSS was initiated at 40 °C and ramped to the maximum temperature at 1.5 °C s−1. Total TDSS desorption time was 10 min. The initial GC oven temperature was 60 °C for 1.25 min and was increased to 90 °C at a rate of 8 °C min−1 followed by an increase to 200 °C at 25 °C min−1. This was held for 6.1 min, which resulted in a total GC run of 15.3 min. Nitrogen (N2) carrier gas was run in a constant pressure mode (88 kPa). The mass spectrometer was operated in electron impact ionisation mode with a collisional energy of 70 eV and a scanning range of 45–300 m/z with a dwell time of 300 µs, which resulted in a scan rate of 0.765 scan s−1. HER internal standards 1,3,5-tris(trifluoromethyl)benzene (IS#1, 10.7 ppm) and bromopentafluorobenzene (IS#2, 5.5 ppm) were added automatically to the sample inlet flow at a 1 : 10 split ratio during each cycle.
Data analysis
All data acquisition and peak area determinations were done using the HAPSITE-ER IQ software package (v. 2.32, Inficon). Tentative compound identifications were found using the HAPSITE-ER IQ software. Data analysis were performed in Prism GraphPad (GraphPad Software Inc., La Jolla, CA, USA) and Microsoft Excel 2016 (Redmond, WA, USA). Datasets were analysed for statistical outliers using the Prism GraphPad ROUT algorithm with a false discovery rate (Q value) of 1 %.
Results and discussion
The goal of this study was to improve the reliability of field-portable TD-GC-MS instrumentation for quantitative analysis. Our study contrasts typical calibration methods with a novel concept of using one or more isotopically labelled compounds pre-loaded onto TD tubes before sampling as additional normalisation factors to compensate for the variability of automated ISTD addition, desorption efficiency, operator interface and instrumental drift. The net result is a comparison of analyte recovery values using four calibration schemes using previously established curves as follows:
-
RRf calibration using HAPSITE-ER IS#2 – IS#2 RRf
-
External calibration run on representative instruments – external calibration
-
Isotopic standard curves pre-loaded on each TD tube – isotopic calibration
-
RRf calibration using DEM116–118 – DEM116 RRf, DEM117 RRf and DEM118 RRf
A note about the HER
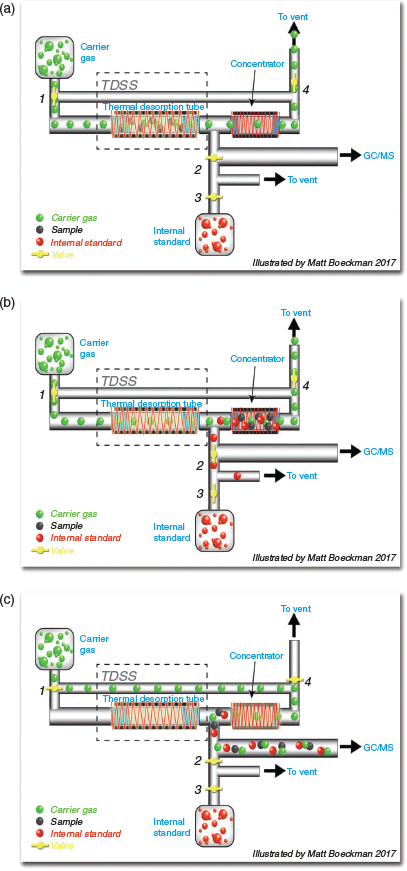
It is difficult to discuss variabilities observed in this data without first reviewing the operation of the instrumentation itself as this differs somewhat from the more typical TD-GC-MS instruments. The TD mode of the HER is depicted in Fig. 3a. Nitrogen flows through the TD tube and the system is ready for desorption. In the conventional mode, the TD tube has been used for collection and the only constituents of the TD tube are the TD packing and the sample (including FA, if used). In the desorption mode (Fig. 3b), the TD tube is heated and the sample is transferred to the concentrator. This is accomplished by heating the TD tube while the ISTD valve is opened simultaneously. The ISTD travels a separate path and is split 1 : 3; 1 part is transferred onto the concentrator tube and 3 parts (75 %) are vented. Once the tube is desorbed, the concentrator is heated and the ISTD and sample are transferred to the GC column (Fig. 3c).
|
The ISTD supplied by the HER can be problematic. There are several valves that perform the 1 : 3 split (see Fig. 3) to the concentrator, with the split augmented by backpressure created from the TD tube desorption flow path. Consequentially, leaks in the TD path or the concentrator have severe effects on the IS#2 concentration. Additionally, the ISTD is on a separate flow path from the sample and offers no control for anomalies in the thermal desorption process. This is in contrast to other instrumentation that has the capability of automatically incorporating ISTD compounds directly onto the TD tube to allow simultaneous desorption and concentration of ISTD and analytes, more accurately accounting for variability in instrument operations. Therefore, problems can occur with valve operation, sealing of the flow-path and sub-standard canister pressures of ISTD or carrier gas, the latter being somewhat common as each canister is adequate for only ~3–4 analyses. When pre-incorporated onto the TD tube, the FA is co-resident with the sample and provides accounting of failures during sample transfer to the pre-concentrator. As a result, the data offer diagnostic information useful in deducing the nature of instrument malfunction.
HER malfunction may result in various data defects. Some examples of malfunctions and their indicators are:
-
Leaks
-
TDSS: If the TDSS is leaking (from o-ring or ferrule), it will result in an increased area count of IS#2 and poor recovery of the target compound.
-
Concentrator: If the concentrator is poorly installed or cracked, it will result in a decrease of IS#2.
-
-
Heating: If the TDSS ceramic heater malfunctions, there will be poor recovery of the target analytes. Per the manufacturer (Inficon), the TDSS is considered a consumable part and needs total replacement.
-
Excess IS#2: The lack of a sample loop for IS#2 leaves the loading quantity determination entirely dependent on the valving systems (Fig. 3), which appear to be prone to sticking.
-
Other: Elevated baseline possibly resulting from contamination and/or a failing non-evaporable getter pump will yield low responses for all analytes and standards.
Incorporation of FA onto TD tubes provides a ratio value against IS#2 and aids in determining that a HER is malfunctioning and provides some diagnostic information that may be useful in the field for returning those instruments to functional status and salvaging a field sampling experiment.
Raw data
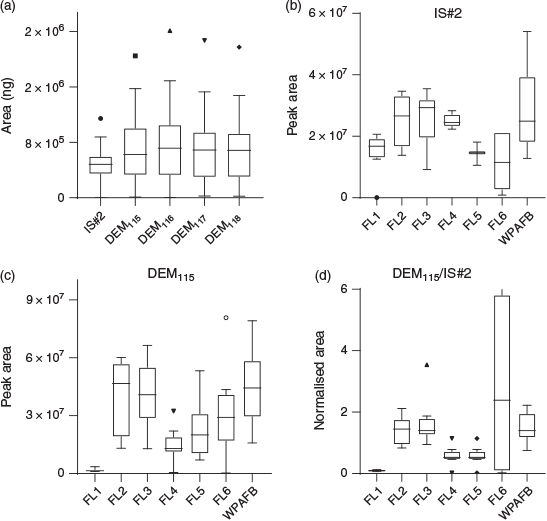
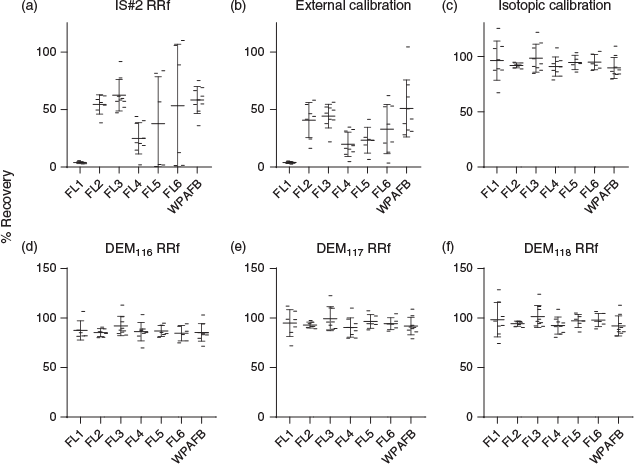
A table containing all raw data from TD-GC-MS analysis of samples is included as part of the Supplementary Material (Table S2, Supplementary Material). Fig. S2A (Supplementary Material) displays the distribution of peak areas for each analyte, which illustrate the frequent disparities observed in the IS#2 response. Though IS#2 showed a minimal interquartile range, instances when the HAPSITE failed to deliver the intended amount of this calibrant led to a large number of outliers. Owing to the distortion of the y-axis resulting from IS#2 variability, moderate stringency outlier analysis (Q = 1 %) was conducted on all sets of raw peak areas using the ROUT algorithm, which identified six outliers for IS#2 and no outliers for the other analytes. When the outliers were removed, a better representation of the actual distributions appeared. The ‘ladder’ effect present in responses arose from the loading of ~25, 50 and 75 ng for DEM116, DEM117 and DEM118 respectively (Fig. S2B, Supplementary Material). For normalisation purposes, response factors for all analytes were calculated by dividing the peak area by the amount (ng) loaded with each sample (Fig. 4a), which yielded an improved representation of the responses when the data from multiple instruments were plotted together. This transformation allowed comparison of the distribution of responses for each isotopic analogue, regardless of the amount loaded. Distribution of IS#2 responses for each field location (outliers removed) is shown in Fig. 4b. With outliers included (Fig. S2C, Supplementary Material), it was easy to identify instruments with problematic IS#2 dosing. This analysis allowed the observation that while the FL#5 data were produced by two instruments, one of the two was not functioning properly and apparently dispensed more than 10-fold the average amount of IS#2 (Table S2, Supplementary Material). This anomaly was not the result of detector variability as no other peak area values showed the same difference between the two instruments. Regardless, the use of FA eliminated any negative impact of this anomaly on the calculated recovery values (see the discussion on recoveries below). Peak area distributions for each analyte grouped by field sampling location (Fig. 4C; Fig. S2D–F, Supplementary Material) illustrated a variable detector response to identical samples; greater than 60 % overlap between instrument response ranges were observed between each calibration level (the three isotopic analogues of DEM; Fig. S2B, Supplementary Material), despite the fact that the analogues should present identical response factors. Note, however, that the response ranges on any given instrument were similar for all isotopic analogues of DEM. These data highlight the difficulty in obtaining accurate quantification using the typical factory calibrations included in the software sold with portable instrumentation. Fig. 4d illustrates the result of normalising the responses of analytes by IS#2. In most cases IS#2 was capable of imparting a level of stability to the analyte data. Reliance on this method for normalisation requires a level of fidelity not observed on the HER. Additionally, we observed that the s.d. between IS#2 RRfs for two instruments (16.0 %) guaranteed a minimum distortion of the quantitative data that was nearly unacceptable without accounting for additional sources of error that are typical in field experiments. Furthermore, in instances when anomalies were observed in both IS#2 and DEM115 responses, the FL#6 normalised data were heavily skewed (Fig. 4d) despite all of the sample data from that location being generated from one instrument. Figs 4d and 5a illustrate the variability of IS#2 for each field location and corroborate suggestions of malfunctioning equipment being run at FL-5 and FL-6. Fig. 5a also demonstrates how a disparity in the mean IS#2 peak areas between fielded instruments can lead to additional discrepancies between derived and actual recoveries when an RRf that has been calculated by reach-back laboratory facilities is employed.
|
|
Calculation of recovery
While analysis of the raw peak area data generated using multiple approaches provides an expanded view of the HAPSITE performance and reproducibility, transformation of those data points into recovery values for each loaded compound allows for a better comparison of the tested calibration methods. Here, the FA included on TD tubes differed from the more typical internal standards in that they were added to sorbent tubes before any handling in the field and therefore were capable of providing compensation for the entire range of conditions that typically degrade the recovery of sampled volatiles. The data below illustrate how incorporation of FA is capable of overcoming problems inherent in field instrumentation and yields meaningful data despite all but the most severe of equipment malfunctions. All discussed values related to recovery are provided in Tables 1 and 2.

|

|
Recoveries – untreated data (n = 56)
The mean recovery value calculated using the IS#2 RRf was 90.0 %; however, the s.d. and range values were 248.7 % and 1733 % respectively. Closer inspection of the sample recovery statistics in the tables provided demonstrated that a handful of outliers nearly doubled the mean recovery value.
Recoveries computed using external standard calibration averaged 31.38 % and had a s.d. and range of 21.4 % and 101.9 % respectively. The danger implied by this type of result is that potentially hazardous substances may be underestimated in the field and lead to toxic exposures or ignorance of potentially hazardous concentrations of VOCs.
Mean recoveries calculated using isotopic calibration, DEM116 RRf, DEM117 RRf and DEM118 RRf were 93.4 ± 18.3 %, 94.5 ± 64.9 %, 93.9 ± 16.9 % and 95.2 ± 17.2 % respectively. It is notable that the large range and s.d. values for recoveries calculated using DEM116 RRf were heavily skewed by a single outlier having a value of 556.3 %. Nonetheless, these recovery values were more than acceptable in a deployed setting and provided definitive quantitative measurements from this portable instrument without more complex statistical analyses. However, comparison of recoveries between each field location summarised the lack of consistency in IS#2 responses for the IS#2 RRf method (Fig. 5a) and quantification using an external calibration (Fig. 5b) in contrast to the more robust, relatively stable responses obtained using the isotopic calibration (Fig. 5c). This was further illustrated when the data were normalised by only one of the isotope-labelled standards (Fig. S3A–C, Supplementary Material).
Recoveries – outliers removed
In the field, it is highly unlikely that the bioenvironmental engineer or technician user of the HER will perform an outlier analysis on the entire dataset they have produced. For the purposes of illustrating that FA pre-incorporation onto sampling tubes provides highly robust data, this section analyses our result once the statistical outliers were removed. Not surprisingly, with outliers removed, the descriptive statistics showed much improved stability, which allowed for a more accurate comparison of the calibration methods. All descriptive statistics for percent recovery values with and without outlier values are shown in Tables 1 and 2. Outlier analysis resulted in removal of three values for IS#2 RRf, isotopic curve and DEM117 RRf datasets, six outliers removed from the DEM116 RRf set and two removed from DEM118 RRf data. No outliers were identified in the percent recovery data obtained from external calibration. These data are provided in Tables 1 and 2. Interestingly, IS#2 RRf mean recoveries were artificially inflated by the outliers, though this analysis would typically not be available on-site for the end user of field portable instrumentation.
While removal of the outlier values greatly improved the consistency of the IS#2 RRf data, the poor recoveries were revealed (mean = 42.8 ± 30.4 %). External calibration data were unchanged as no outliers were identified. Mean recoveries calculated using isotopic calibration, DEM116 RRf, DEM117 RRf and DEM118 RRf calibrations averaged 93.8 ± 10.5 %, 86.5 ± 7.4 %, 94.2 ± 9.4 % and 96.1 ± 10.3 %, which were relatively unchanged from the original values. This effectively highlighted the effectiveness of FA when used by field personnel for whom such statistical analyses would be unavailable.
In situ isotopic calibration
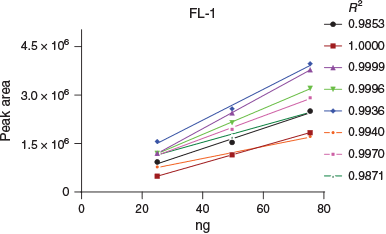
Since each TD tube included an isotopic DEM standard curve, it was possible to calibrate each HER individually, on a per-sample basis. An example plot of linear regression is shown for one location alongside the calculated R2 value (Fig. 6). While having only a few calibration points somewhat limits the use of regression analysis, the data support the practice of using as little as three calibration levels for in situ calibration. Regressions from the remaining locations as well as descriptive statistics of calculated R2 values are provided in Fig. S4A–F and Table S3 (Supplementary Material) respectively. The lowest mean R2 value (0.9981) with the highest s.d. (0.0342) was observed from FL-4, where one TD tube yielded extremely low responses from all of the DEM isotopic analogues despite a typical IS#2 response, which likely indicated a leak at the TDSS. While most calculated recoveries from this sample were entirely aberrant from the norm, recoveries calculated from isotopic calibration (135.6 %), DEM117 RRf calibration (79.7 %) and DEM118 RRf calibration (96.1 %) still provided useful data from this sample. It is notable that the prescribed method using IS#2 estimated DEM115 recovery at 1.9 %. This is important because of how the HER functions with respect to IS#2 loading and tube desorption wherein a leak at the TDSS leads to reduced analyte responses versus a greatly increased IS#2.
|
Comparison of calibration methods
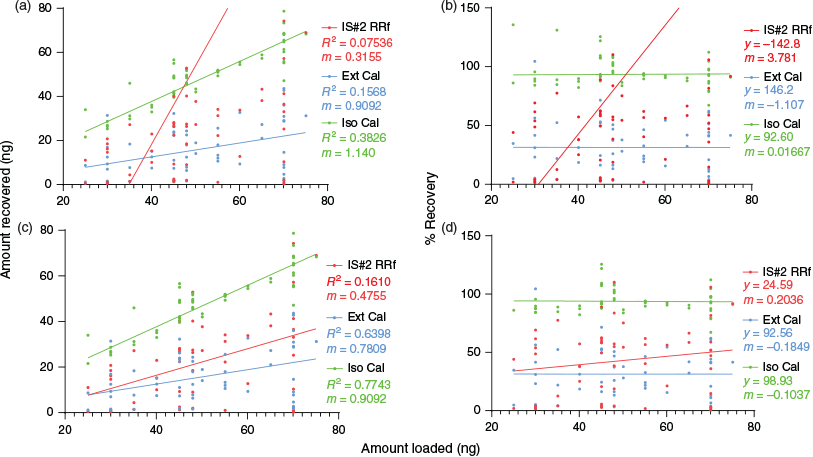
Linear regression analyses provided a useful method for comparing the calibration methods. Fig. 7a, b displays scatter plots setting amount loaded versus amount recovered (Fig. 7a) and amount loaded versus percent recovered (Fig. 7b) containing all 56 data points. In these graphics, the skewing of IS#2 recoveries was dramatic, as was the impact on the slope of DEM116 arising from the presence of the outliers (Fig. 7a). Note that in typical field sampling settings, especially when used by first responders and in military applications, these outliers would be treated as prima facie evidence of the quantities and exposure levels for potentially hazardous substances. This is particularly troubling when IS#2 RRf calibration is employed since all six of those outliers, which showed abnormally elevated peak area values for IS#2, would result in a drastic underestimation of analyte concentrations. External calibration did not show the variability of IS#2 RRf, but did show a poor average recovery (31.4 %), again potentially underestimating the concentration of target analytes. In Fig. 7a, c, the regression analysis gave a broader view of the comparison as the perfect calibration would show an R2 value of 1 (high level of agreement between replicate values) and the slope (m) would represent a 1 : 1 ratio between amount loaded and amount recovered. In Fig. 7b, d, the slope and y-intercept values provided another comparison, as the y-intercept approximates average recovery while the slope indicates deviation from 100 % recovery dependent on the loaded concentration. Thus, for an ideal analysis (recovery is 100 %), the slope (m) value is 0 and the y-intercept value is 100. This analysis, done on DEM116–118 RRf recoveries, is depicted in Fig. S5A–D (Supplementary Material).
Perhaps the most striking feature of the data imaged in Fig. 7 is the stability obtained using the FA method when comparing the data with and without the outliers removed; while large shifts in the regressions were observed with the IS#2 methods, the FA approach provided consistent results with values very near 100 % for recovery.
Storage effects
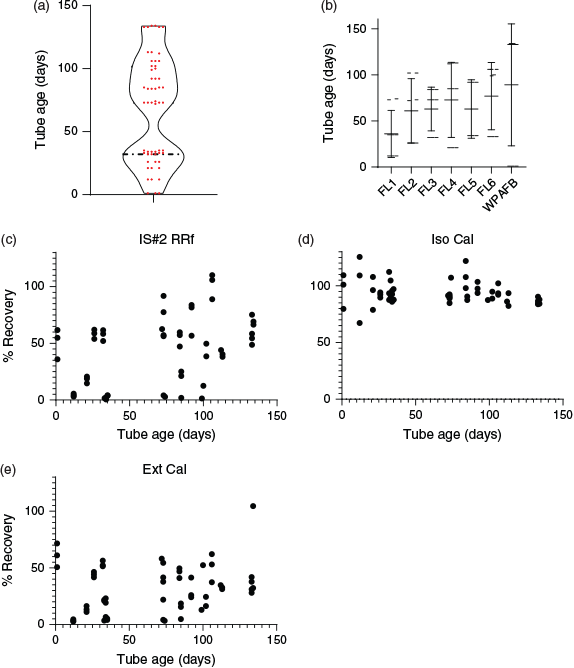
Field-deployed TD tubes were stored on average for 67 days before desorption and analysis. Distribution of storage periods across all tubes was illustrated with a violin plot (Fig. 8a) and sample tube age for each field location is depicted in Fig. 8b.
|
During sample preparation, tubes were first loaded with isotopically labelled DEM at three concentrations followed by a treatment of the tubes at 50 °C with a moderate flow of N2 (50–75 mL min−1) for 90 min, which was used to remove potential interferences arising from the acetonitrile diluent and to simulate the upper end of tube storage and handling conditions experienced in the field. Calculated recoveries of DEM115 verified that there was no loss of DEM during treatment, which demonstrated the stability of FA on TD tubes under elevated temperatures of storage and transport, as loss of the isotopically labelled analytes would have manifested values exceeding 100 % recovery in calculations using FA as a normalising factor. Plots depicted in Fig. 8c–e illustrate the relationship between tube age and calculated recovery for IS#2 RRf, Ext Cal and Iso Cal methods and showed no significant correlation between computed values and tube storage duration.
Omitted data
The initial study plan included analysis of nine samples for each of eight field locations, which theoretically led to the analysis of 72 total samples, though the bulk of the data analysis presented here included only 56 total samples. Of the 16 samples omitted from these analyses, nine represented one field location dropped entirely from the study owing to a total malfunction of the HER unit early on. Only two samples yielded data from this field location while the remainder of the data were completely lost owing to an instrument failure that went undetected by the operators. It was decided to strike all nine data points from this location because a representative sample set was not obtainable and thus that location was not assigned a FL# in this study. A single data point from FL#1 was lost owing to a depletion of carrier gas during the sample analysis. From the FL#5 data, two samples were omitted because of instrument malfunctions that resulted in missing values for DEM115, which rendered data analysis impossible. Additionally, four samples yielding aberrant yet complete data were omitted from the analysis, which totalled 16 data points not shown in the full analysis described above. Based upon experience with the HER, we believe that the deviant values seen in those six samples were likely the result of flow path leaks that caused incomplete loading of the analytes onto the concentrator or GC column. Regardless of the cause, it was interesting to note that the FA provided better accuracy in calculating the recoveries for these samples than IS#2 RRf or external calibration in all cases.
Conclusion
This study describes data quality improvement for the calibration of field equipment using in-situ calibration with isotopic analogues. The approach yields greatly improved performance and data approximating that produced by fixed-base laboratories. While RRf-based quantification is not ideal when the internal standard is metered onto sampling tubes by the HER (in its current iteration), pre-incorporation of standards onto TD tubes before field deployment allows accurate and reproducible quantification through RRf and compensates for problems that arise using workflows employed for mobile TD-GC-MS instrumentation in the field. We plan to extend this approach to a variety of key target compounds of concern. Use of FA has demonstrated the ability to overcome common problems that arise using workflows employed in field portable use of TD-GC-MS instrumentation and extends the capabilities of such equipment while reducing the need for on-site analytical expertise. This approach is currently being used to establish relative response factors to chemical warfare agents to allow the field quantification of these highly toxic compounds without the need to handle the agents themselves.
Supplementary material
The supplementary material includes all raw data from experiments as well as quotidian data analysis outputs to show efficacy of the approach. In addition, materials disseminated to participants in the fielded study are included for procedural transparency.
Conflicts of interest
The authors declare no conflicts of interest.
Case Number: 88ABW-2019–2001.
Acknowledgements
Disclaimer: The views expressed in this article are those of the author and do not reflect the official policy or position of the United States Air Force, Department of Defence, or the USA Government. Financial support from this study came from the 711th Human Performance Wing, Wright-Patterson Air Force Base, Ohio. Additional funding came from Joint Program Command, 6.7 Funding. We would like to thank Drs Darrin Ott and Claude C. Grigsby for submission of the original proposal and Mr Wil Bell who provided program and financial management. Finally, we would like to thank Dr Thomas Malloy and Mr Tedeusz Piatkowski, Battelle, for preparation of the DEM curves used for this study.
References
Bridoux M, Malandain H, Leprince F, Progent F, Machuron-Mandard X (2015). Quantitative analysis of phosphoric acid esters in aqueous samples by isotope dilution stir-bar sorptive extraction combined with direct analysis in real time (DART)-Orbitrap mass spectrometry. Analytica Chimica Acta 869, 1–10.| Quantitative analysis of phosphoric acid esters in aqueous samples by isotope dilution stir-bar sorptive extraction combined with direct analysis in real time (DART)-Orbitrap mass spectrometryCrossref | GoogleScholarGoogle Scholar | 25818134PubMed |
Duhamel N, Slaghenaufi D, Pilkington LI, Herbst-Johnstone M, Larcher R, Barker D, Fedrizzi B (2018). Facile gas chromatography-tandem mass spectrometry stable isotope dilution method for the quantification of sesquiterpenes in grape. Journal of Chromatography A 1537, 91–98.
| Facile gas chromatography-tandem mass spectrometry stable isotope dilution method for the quantification of sesquiterpenes in grapeCrossref | GoogleScholarGoogle Scholar | 29352581PubMed |
Frank S, Hoffman T, Schieberle P (2019). Quantitation of benzene in flavourings and liquid foods containing added cherry-type flavour by a careful work-up procedure followed by a stable isotope dilution assay. European Food Research and Technology
| Quantitation of benzene in flavourings and liquid foods containing added cherry-type flavour by a careful work-up procedure followed by a stable isotope dilution assayCrossref | GoogleScholarGoogle Scholar |
Harshman SW, Dershem VL, Fan M, Watts BS, Slusher GM, Flory LE, Grigsby CC, Ott DK (2015). The stability of Tenax TA thermal desorption tubes in simulated field conditions on the HAPSITE ER. International Journal of Environmental Analytical Chemistry 95, 1014–1029.
| The stability of Tenax TA thermal desorption tubes in simulated field conditions on the HAPSITE ERCrossref | GoogleScholarGoogle Scholar |
Harshman SW, Rubenstein MH, Qualley AV, Fan M, Geier BA, Pitsch RL, Slusher GM, Hughes GT, Dershem VL, Grigsby CC, Ott DK, Martin JA (2017). Evaluation of thermal desorption analysis on a portable GC-MS system. International Journal of Environmental Analytical Chemistry 97, 247–263.
| Evaluation of thermal desorption analysis on a portable GC-MS systemCrossref | GoogleScholarGoogle Scholar |
Inficon (2006). HAPSITE application note – HAPSITE smart portable GCMS: calibration curves for 52 volatile organic compounds in water or soil (Inficon: East Syracuse, NY). Available at http://products.inficon.com/GetAttachment.axd?attaName=9f203c0b-f432-4ab0-bbbb-a3c594a8f0d3 [verified 22 August 2019]
Joint Environmental Surveillance Work Group (2009). Doctrinal definitions for detection, identification, and analysis (version 3.1, 11 August 2009). Available at https://armypubs.army.mil/epubs/DR_pubs/DR_a/pdf/web/ARN12082_ATP%203-37x11%20FINAL%20WEB.pdf [verified 22 August 2019]
Kwak J, Fan M, Geier BA, Grigsby CC, Ott DK (2014). Comparison of sampling probe and thermal desorber in HAPSITE ER for analysis of TO-15 compounds. Journal of Analytical & Bioanalytical Techniques S2, 008
| Comparison of sampling probe and thermal desorber in HAPSITE ER for analysis of TO-15 compoundsCrossref | GoogleScholarGoogle Scholar |
Liao W, Ghabour M, Draper WM, Chandrasena E (2016). Lowering detection limits for 1,2,3-trichloropropane in water using solid phase extraction coupled to purge and trap sample introduction in an isotope dilution GC-MS method. Chemosphere 158, 171–176.
| Lowering detection limits for 1,2,3-trichloropropane in water using solid phase extraction coupled to purge and trap sample introduction in an isotope dilution GC-MS methodCrossref | GoogleScholarGoogle Scholar | 27262687PubMed |
Martin J, Kwak J, Harshman SW, Chan K, Fan M, Geier BA, Grigsby CC, Ott DK (2016). Field sampling demonstration of portable thermal desorption collection and analysis instrumentation. International Journal of Environmental Analytical Chemistry 96, 299–319.
| Field sampling demonstration of portable thermal desorption collection and analysis instrumentationCrossref | GoogleScholarGoogle Scholar |
Rubenstein HM (2017). Focusing agents and methods of using same. Patent pending, application filed 7 March 2017 and accorded serial number 15/451,438.
Sekiguchi H, Matsushita K, Yamashiro S, Sano Y, Seto Y, Okuda T, Sato A (2006). On-site determination of nerve and mustard gases using a field-portable gas chromatograph-mass spectrometer. Forensic Toxicology 24, 17–22.
| On-site determination of nerve and mustard gases using a field-portable gas chromatograph-mass spectrometerCrossref | GoogleScholarGoogle Scholar |
Smith PA, Jackson Lepage CR, Koch D, Wyatt HDM, Hook GL, Betsinger G, Erickson RP, Eckenrode BA (2004). Detection of gas-phase chemical warfare agents using field-portable gas chromatography–mass spectrometry systems: instrument and sampling strategy considerations. Trends in Analytical Chemistry 23, 296–306.
| Detection of gas-phase chemical warfare agents using field-portable gas chromatography–mass spectrometry systems: instrument and sampling strategy considerationsCrossref | GoogleScholarGoogle Scholar |
US Environmental Protection Agency (1999). Compendium Method TO-17 Determination of Volatile Organic Compounds in Ambient Air Using Active Sampling onto Sorbent Tubes, EPA/625/R-96/101b. Available at www3.epa.gov/ttnamti1/files/ambient/airtox/to-17r.pdf [verified 17 February 2016]


