

Patterns of mixed virus infections: a 3-year study of symptomatic cereal and grass hosts in Australia
Narelle Nancarrow A B * , Brendan Rodoni C D , Shu Kee Lam A and Piotr Trębicki A E
A
B
C
D
E
Abstract
Yellow dwarf viruses (YDVs) form a complex of economically important pathogens that can significantly reduce grain yield in cereals. Mixed infections, or infection with two or more YDV species, can be particularly damaging.
We aimed to examine the proportion of single and multiple virus infections present in symptomatic cereal and grass plants in Victoria, south-eastern Australia.
Over 3 years (2020–2022), symptomatic cereal and grass plants from within and around cereal fields in Victoria, Australia were individually tested using tissue-blot immunoassay (TBIA) for barley yellow dwarf virus PAV, barley yellow dwarf virus MAV, cereal yellow dwarf virus RPV, wheat streak mosaic virus, and with a generic TBIA test that can detect multiple luteovirus and/or polerovirus species.
Across 2020–2021, 34% of virus-positive plants were infected with multiple YDV species. The proportion of mixed infections was similar in each individual year. However, higher proportions of wheat (Triticum aestivum, 47%) and wild oat (Avena fatua, 36%) plants were infected with multiple YDV species compared to barley (Hordeum vulgare, 8%) and brome grass (Bromus spp.,17%).
The proportion of virus-positive plants infected with multiple YDV species found was almost four times higher than previously reported in a similar study in Victoria, Australia in 1985. The proportion of plants infected with multiple YDV species varied more with host type than between individual years.
These findings demonstrate the complex epidemiology of these damaging viruses, and the challenges associated with developing virus-resistant cereal cultivars, while also highlighting the importance of regular surveillance over multiple years.
Keywords: aphid-transmitted viruses, barley (Hordeum vulgare), cereals, epidemiology, oats (Avena sativa), surveillance, viruses of plants, wheat (Triticum aestivum).
Introduction
Cereals such as wheat (Triticum aestivum), barley (Hordeum vulgare), oat (Avena sativa), and triticale (Triticum sp × Secale cereale) are a critical human and animal food source worldwide. In Australia, cereals are the largest grain commodity by volume, with an average annual production of 52 million tonnes during 2020–2022, compared to 6.6 million tonnes of canola and 3.9 million tonnes of pulses (ABARES 2023). Yellow dwarf viruses (YDVs) are damaging pathogens of cereals that cause significant yield and quality losses worldwide. Yield losses of up to 84% in wheat and 64% in barley have been caused by artificial inoculation with a barley yellow dwarf virus (BYDV) isolate in south-eastern Australia (Nancarrow et al. 2021), where YDV incidences of up to 58% have been observed in individual cereal fields (Nancarrow et al. 2018). Grain yield is reduced with every 1% increase in YDV infection (Gill 1980; Smith and Sward 1982; McKirdy et al. 2002; Nancarrow et al. 2021). Virus infection can be particularly damaging when more than one virus species is present within a plant; however, the relationships and interactions between different virus species, their aphid vectors and their plant hosts can be both complex and specific (Baltenberger et al. 1987; Wen et al. 1991; Haber 1995; Leclercq-Le Quillec et al. 2000; Hall and Little 2013; Lacroix et al. 2014; Malmstrom et al. 2017).
YDVs have a wide host range and can infect more than 150 species belonging to the Poaceae family (D’Arcy 1995), including cultivated cereal hosts such as wheat, barley, oat, maize (Zea mays), rice (Oryza sativa) and many wild grass species (Oswald and Houston 1951; Watson and Mulligan 1960; Guy et al. 1987). YDVs are transmitted from plant to plant by aphids (Hemiptera: Aphididae) (Oswald and Houston 1951). The most common and important vectors of YDVs in south-eastern Australia are Rhopalosiphum padi (bird cherry-oat aphid), Rhopalosiphum maidis (corn aphid), and Metopolophium dirhodum (rose grain aphid) (Waterhouse and Helms 1985; Guy et al. 1987; Sward and Lister 1988; McKirdy and Jones 1996; Thackray et al. 2005). Typical symptoms of YDV infection include stunted plant growth and yellow and/or red leaf discolouration (Oswald and Houston 1951).
Currently, at least 12 YDV related species that can infect cereals or grasses are formally recognised by the International Committee on Taxonomy of Viruses (ICTV) (Sõmera et al. 2021a; Walker et al. 2021). This includes luteoviruses (family Tombusiviridae), such as barley yellow dwarf virus PAV (BYDV PAV, Luteovirus pavhordei), barley yellow dwarf virus PAS (BYDV PAS, Luteovirus pashordei) and barley yellow dwarf virus MAV (BYDV MAV, Luteovirus mavhordei), and poleroviruses (family Solemoviridae) such as cereal yellow dwarf virus RPV (CYDV RPV, Polerovirus CYDVRPV), cereal yellow dwarf virus RPS (CYDV RPS, Polerovirus CYDVRPS), maize yellow dwarf virus RMV (MYDV RMV, Polerovirus MYDVRMV) and barley virus G (BVG, Polerovirus BVG).
While BYDV was reported in Australia for the first time in 1957 (Smith 1957), the YDV species BYDV PAV, BYDV MAV, CYDV RPV, and MYDV RMV were distinguished from each other serologically and reported in Australia during the 1980s (Waterhouse and Helms 1985; Guy et al. 1986; Guy et al. 1987; Sward and Lister 1987, 1988) and are regularly found in Australia (McKirdy and Jones 1993; Hawkes and Jones 2005; Milgate et al. 2016; Trębicki et al. 2017; Nancarrow et al. 2018). BVG, CYDV RPS, and BYDV PAS have recently been reported in Australia based on molecular identification (Nancarrow et al. 2019, 2023, 2024); however, their incidence and geographic distribution in Australia is yet to be determined.
Wheat streak mosaic virus (WSMV) (Tritimovirus tritici, family Potyviridae) also occurs with high incidence, and has resulted in substantial yield losses, in wheat fields in some regions of Australia (Jones and Burges 2006; Coutts et al. 2008b). WSMV is transmitted by the wheat curl mite (WCM, Aceria tosichella Keifer) (Slykhuis 1955; Singh et al. 2018), which is present throughout the major grain growing regions of Australia (Halliday and Knihinicki 2004; Carew et al. 2009). WSMV was found in Australia for the first time in 2002 in the Australian Capital Territory (ACT) (Ellis et al. 2003a); and subsequently detected in other Australian states, including Victoria (Ellis et al. 2003b; Jones et al. 2005; Coutts et al. 2008a). More recently, WSMV was found with BVG in volunteer cereals in Victoria between growing seasons (Nancarrow et al. 2019); however, little information is available about its occurrence more broadly in commercial cereal fields in the region.
The primary aim of this study was to examine the proportion of single and multiple virus species in individual symptomatic cereal and grass plants within and around commercial cereal fields. This information is critical for the development of more effective virus-resistant cereal cultivars and enhances our understanding of cereal virus epidemiology. Data on the occurrence and distribution of BYDV PAV, BYDV MAV, CYDV RPV, and WSMV in south-eastern Australia is also reported.
Materials and methods
Field locations
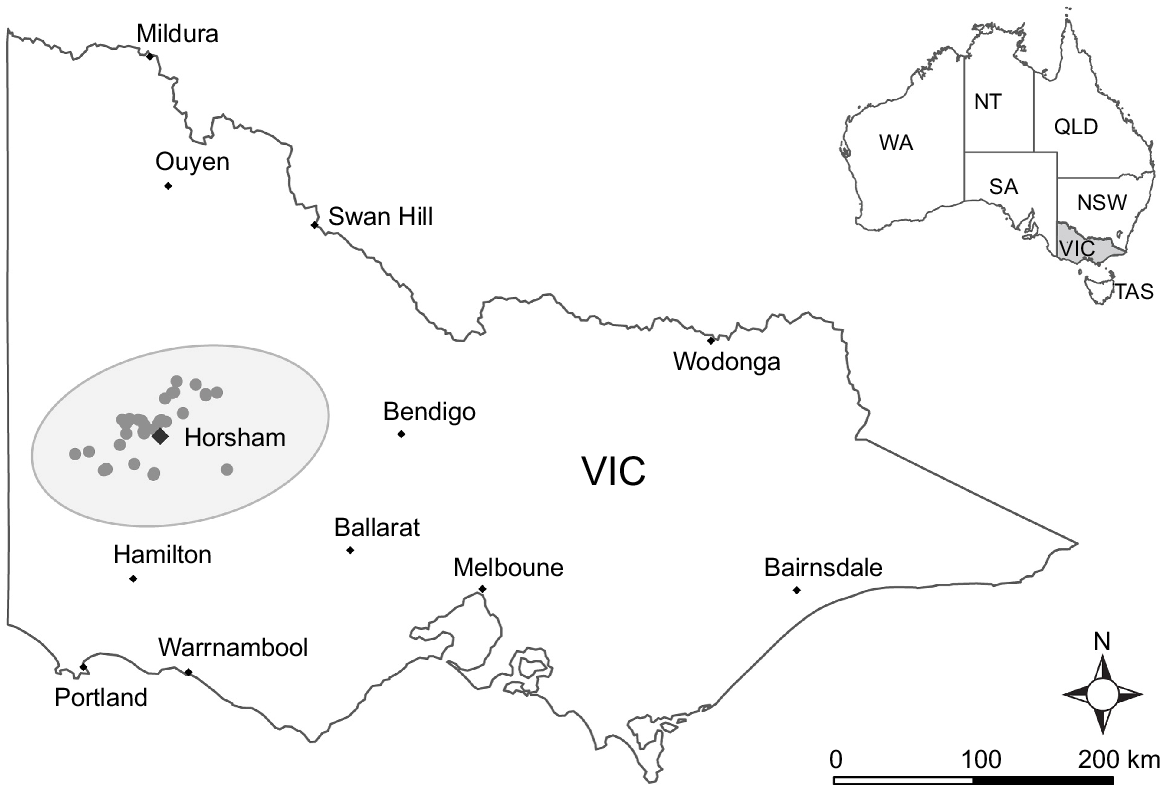
Plant samples were collected from around and within the town of Horsham, Victoria, Australia (36°43′0.0012″S, 142°11′59.9892″E) (Fig. 1). The long-term (1998–2022) annual mean maximum temperature and rainfall, measured at the Horsham aerodrome weather station (79100), are 22.1°C and 378 mm, respectively. The annual mean maximum temperature was below average during each year of this study, while annual rainfall was close to average during 2020 and 2021 but well above average during 2022 (Table 1) (www.bom.gov.au).
Map of the 42 locations (grey points) in Victoria (Vic), Australia, where symptomatic plants were sampled during 2020, 2021, and 2022. The inset map of Australia shows the location of the following Australian states and territories: Western Australia (WA), Northern Territory (NT), South Australia (SA), Queensland (Qld), New South Wales (NSW), Victoria (Vic), and Tasmania (Tas).
| Year | Jan–Mar | Apr–Jun | Jul–Sep | Oct–Dec | Annual | ||
|---|---|---|---|---|---|---|---|
| Rainfall (mm) | 2019 | 15 | 125 | 93 | 40 | 273 | |
| 2020 | 77 | 122 | 106 | 94 | 399 | ||
| 2021 | 58 | 94 | 134 | 81 | 366 | ||
| 2022 | 111 | 119 | 230 | 209 | 670 | ||
| Long-term mean rainfall (mm) | 1998–2022 | 64 | 103 | 122 | 90 | 378 | |
| Temperature (°C) | 2019 | 31.1 | 18.6 | 15.1 | 26.3 | 22.8 | |
| 2020 | 28.4 | 17.1 | 15.5 | 25.3 | 21.6 | ||
| 2021 | 28.4 | 18.3 | 15.8 | 24.7 | 21.8 | ||
| 2022 | 29.8 | 17.7 | 14.8 | 22.5 | 21.2 | ||
| Long-term mean temperature (°C) | 1998–2022 | 29.5 | 18.1 | 15.6 | 25.4 | 22.1 |
Collection of plant material
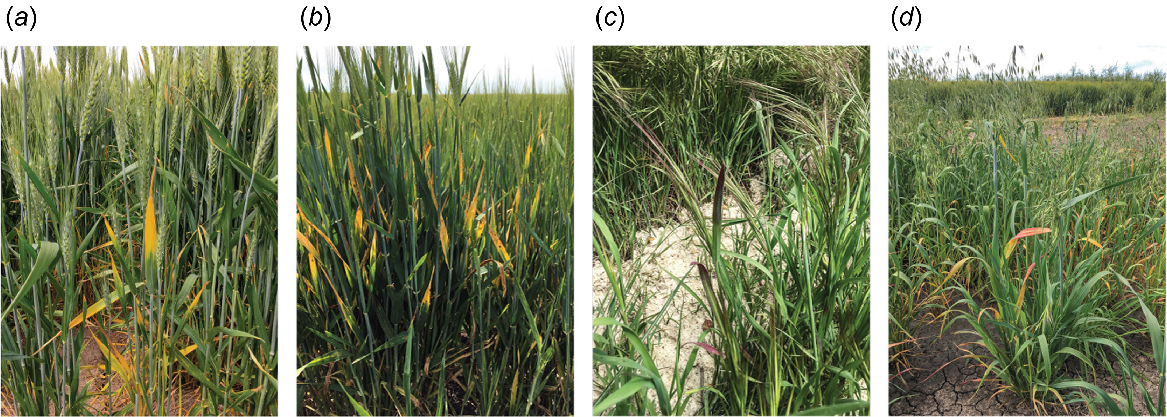
During October–November in 2020, 2021, and 2022, samples were collected from 1313 symptomatic plants from 42 locations in the major cereal production region of south-eastern Australia. Samples were collected from symptomatic cereal plants from 40 cereal fields (wheat (Triticum aestivum L.), barley (Hordeum vulgare L.), oats (Avena sativa L.)) and from symptomatic grass and/or volunteer cereal plants from 31 of the 40 cereal fields, as well as a roadside and a riverside location (Table 2; see Supplementary Table S1). Targeted symptoms included yellow and/or red-purple leaf discolouration and stunted plant growth, which are common indicators of virus infection in cereals and grasses (Fig. 2). While wheat and barley fields were primarily targeted for sample collection, symptomatic wild oat (Avena fatua L.) and brome grass (Bromus spp.) plants were regularly observed either within or around (i.e. near to the fence line) the targeted fields. Samples were collected from these four hosts in each year of the study, along with volunteer wheat plants from one barley field in 2020, and volunteer barley plants from two wheat fields in 2021. Samples were also collected from symptomatic plants from oat fields in 2021 and 2022, and symptomatic phalaris (Phalaris spp.) and rye grass (Lolium perenne L.) plants from along the fence lines of three wheat fields during 2022. Additionally, samples were collected from symptomatic brome grass plants from alongside the Wimmera River in the Horsham township and from a roadside near Horsham during 2022. Each sampling location, which will be referred to as a field from this point on, was recorded using GPS coordinates. A single tiller was collected from each symptomatic plant, placed into a plastic bag (one bag per field), and stored at 4°C until processed.
| Host | 2020 | 2021 | 2022 | Overall | |||||
|---|---|---|---|---|---|---|---|---|---|
| Number of fields | Number of samples | Number of fields | Number of samples | Number of fields | Number of samples | Number of fields | Number of samples | ||
| Wheat (Triticum aestivum) | 7 | 261 | 10 | 130 | 11 | 239 | 28 | 620 | |
| Barley (Hordeum vulgare) | 5 | 179 | 4 | 63 | 1 | 18 | 10 | 260 | |
| Oat (Avena sativa) | 0 | 0 | 1 | 17 | 1 | 30 | 2 | 47 | |
| Brome grass (Bromus spp.) | 7 | 21 | 12 | 43 | 6 | 85 | 25 | 149 | |
| Wild oat (Avena fatua) | 8 | 103 | 7 | 54 | 7 | 52 | 22 | 209 | |
| Phalaris (Phalaris spp.) | 0 | 0 | 0 | 0 | 3 | 11 | 3 | 11 | |
| Rye grass (Lolium perenne) | 0 | 0 | 0 | 0 | 3 | 7 | 3 | 7 | |
Virus testing by tissue blot immunoassay
Each individual tiller was cut with a sterile scalpel blade and sap from the tiller was immediately blotted onto a nitrocellulose membrane (Whatman Protran, 0.45 μm, ThermoFisher Scientific, USA). Sap from each tiller was blotted onto five individual membranes, then one membrane per virus test was used. Membranes were tested by tissue blot immunoassay (TBIA) using polyclonal antibodies for barley yellow dwarf virus PAV (BYDV PAV, Agdia 27500), barley yellow dwarf virus MAV (BYDV MAV, DSMZ AS-0540), cereal yellow dwarf virus RPV (CYDV RPV, DSMZ AS-0539) and wheat streak mosaic virus (WSMV, DSMZ AS-0544), and a monoclonal antibody (DSMZ AS-0227/1) that can detect a range of luteovirus and/or polerovirus species, as described previously (Trębicki et al. 2017; Nancarrow et al. 2019). After testing was completed in 2021, the BYDV MAV antibody was no longer available; therefore testing for BYDV MAV was not included in 2022. After processing, membranes were examined using a dissecting microscope, where a plant sample was considered positive if dark purple staining was observed in the phloem, or negative if dark purple staining was not present.
Data analysis
The proportion of virus-positive plants within the population being evaluated was calculated using the formula [number of infected plants/number of plants tested] × 100. The co-occurrence of virus species was estimated using the Jaccard index of similarity. Sum totals of virus positive plant samples were calculated using GenStat 22nd Edition (VSN International Ltd, Hemel Hempstead, UK). R ver. 4.2.1 (R Foundation for Statistical Computing, Vienna, Austria) was used to calculate Jaccard similarity index coefficients and to generate maps, graphs and area proportional Euler diagrams.
Results
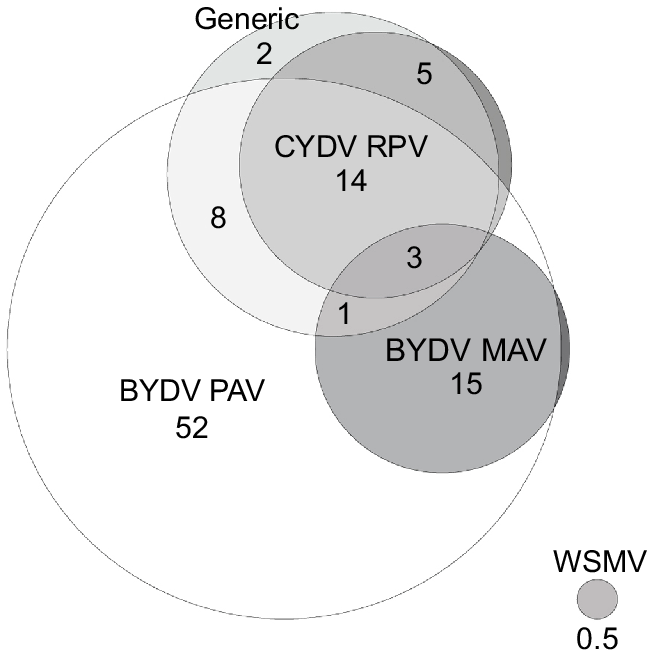
Only virus-positive plant samples were used to examine the proportions of symptomatic plants infected with single or multiple viruses. A relatively large proportion (46%) of the 639 virus-positive samples across 2020–2021 was positive with more than one of the five virus tests, while a small proportion (3%) was positive with all four of the BYDV PAV, BYDV MAV, CYDV RPV, and generic tests (Fig. 3, Table 3a). Of the 639 virus-positive samples, all of which included testing for BYDV MAV, approximately half (52%) contained single infections of BYDV PAV; a third (33%) were positive with the generic test; 22% were positive for CYDV RPV, and a quarter (26%) were positive with both the BYDV PAV and generic tests (Fig. 3). The proportion of plant samples infected with both BYDV PAV and BYDV MAV (19%) was similar to the proportion infected with both BYDV PAV and CYDV RPV (17%) (Fig. 3, Table 4). Additionally, 34% of the plant samples that were positive with at least one of the three YDV specific tests (BYDV PAV, BYDV MAV, and CYDV RPV) across 2020 and 2021 were infected with multiple YDV species (Table 3b). Interestingly, only one of the 117 BYDV MAV-positive plant samples detected during this study occurred as a single infection.
A Euler diagram showing the proportion (%) of virus-positive plants infected with single and multiple cereal viruses overall across 2020 and 2021 (n = −639). Proportions of less than 1% are not labelled (excluding WSMV). ‘Generic’ refers to the generic test that can detect multiple luteovirus and/or polerovirus species.
| Percentage (%) of positive samples | |||||||
|---|---|---|---|---|---|---|---|
| 2020 | 2021 | Overall (2020–2021) | |||||
| (a) | Number of viruses | ||||||
| 1 | 53 | 58 | 54 | ||||
| 2 | 27 | 30 | 28 | ||||
| 3 | 17 | 9 | 15 | ||||
| 4 | 3 | 2 | 3 | ||||
| 5 | 0 | 0 | 0 | ||||
| Number of samples | 476 | 163 | 639 | ||||
| Number of fields | 12 | 14 | 26 | ||||
| (b) | Number of viruses | ||||||
| 1 | 64 | 73 | 66 | ||||
| 2 | 33 | 25 | 31 | ||||
| 3 | 3 | 3 | 3 | ||||
| Number of samples | 468 | 155 | 623 | ||||
| Number of fields | 12 | 14 | 26 | ||||
| Barley | Bromegrass | Wheat | Wildoat | Overall(2020–2021) | |||
| (c) | Number of viruses | ||||||
| 1 | 92 | 83 | 53 | 65 | 66 | ||
| 2 | 8 | 17 | 42 | 34 | 31 | ||
| 3 | 0 | 0 | 5 | 2 | 3 | ||
| Number of samples | 159 | 24 | 311 | 113 | 607 | ||
| Number of fields | 7 | 13 | 16 | 12 | 25 | ||
| Number of samples | Number of fields | Co-infection (virus species per test) | ||||||||
|---|---|---|---|---|---|---|---|---|---|---|
| BYDV PAV and BYDV MAV | BYDV PAV and CYDV RPV | BYDV PAV and generic test | BYDV MAV and CYDV RPV | BYDV MAV and generic test | CYDV RPV and generic test | |||||
| (a) | Overall (2020–2021) | 620 | 26 | 0.20 | 0.17 | 0.26 | 0.08 | 0.08 | 0.63 | |
| (b) | 2020 | 476 | 12 | 0.19 | 0.20 | 0.29 | 0.08 | 0.08 | 0.61 | |
| 2021 | 144 | 14 | 0.21 | 0.10 | 0.13 | 0.08 | 0.07 | 0.73 | ||
| (c) | Barley | 165 | 8 | 0 | 0.08 | 0.20 | 0 | 0 | 0.33 | |
| Brome grass | 26 | 14 | 0 | 0.17 | 0.15 | 0 | 0 | 0.75 | ||
| Wheat | 312 | 16 | 0.35 | 0.18 | 0.23 | 0.10 | 0.11 | 0.73 | ||
| Wild oat | 117 | 12 | 0.07 | 0.31 | 0.44 | 0.04 | 0.04 | 0.68 | ||
Co-occurrence coefficients greater than 0.30 are shaded in grey.
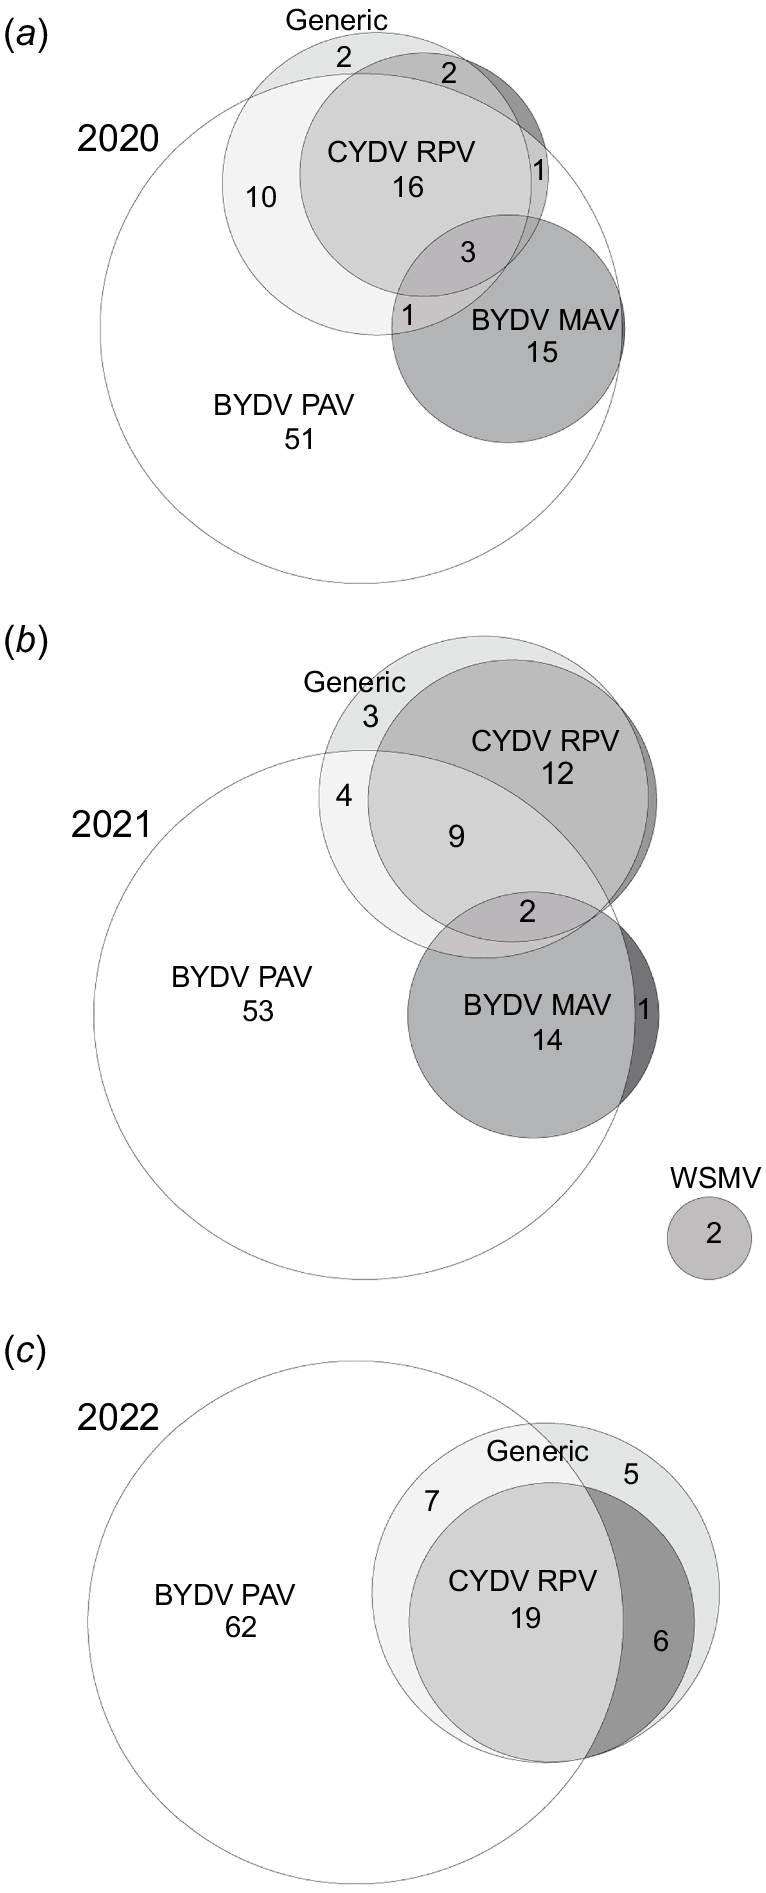
The proportion of symptomatic plants infected with multiple cereal viruses was similar between years, with a similar proportion of plant samples positive with the CYDV RPV and/or generic tests in 2020 (35%), 2021 (30%), and 2022 (37%) (Fig. 4). However, a somewhat higher proportion of those samples was infected with BYDV PAV as well in 2020 (30%) and 2022 (26%) than 2021 (15%). Additionally, fewer of the total 1313 plant samples were positive with at least one virus test in 2021 (53%) than 2020 (84%) and 2022 (79%), although WSMV was only detected in 2021 (Table 5). Furthermore, fewer symptoms of virus infection were observed and therefore, fewer samples were collected, during 2021 than 2020 and 2022 (Table 5). In each year, a higher proportion of plant samples was infected with BYDV PAV than any other virus (Table 5), with 51% and 53% of samples infected with only BYDV PAV during 2020 and 2021, respectively (Fig. 4).
Euler diagrams showing the proportion (%) of virus-positive plants infected with single and multiple cereal viruses during (a) 2020 (n = 476), (b) 2021 (n = 163), and (c) 2022 (n = 348). Proportions of less than 1% are not labelled. Plant samples collected during 2022 were not tested for BYDV MAV. ‘Generic’ refers to the generic test that can detect multiple luteovirus and/or polerovirus species.
| Number of samples | Number of fields | Number of samples tested for BYDV MAV | Proportion (%) of virus-positive plants | ||||||||||
|---|---|---|---|---|---|---|---|---|---|---|---|---|---|
| BYDV PAV | CYDV RPV | Generic | Average | BYDV MAV | WSMV | Positive with at least one virus test | No virus detected | ||||||
| (a) | Overall (2020–2022) | 1313 | 42 | 871 | 69 | 17 | 26 | 37 | 13 | <1 | 75 | 25 | |
| (b) | 2020 | 564 | 12 | 564 | 81 | 18 | 28 | 42 | 16 | 0 | 84 | 16 | |
| 2021 | 307 | 15 | 307 | 44 | 13 | 16 | 24 | 9 | 1 | 53 | 47 | ||
| 2022 | 442 | 15 | 0 | 70 | 20 | 30 | 40 | N/A | 0 | 79 | 21 | ||
| (c) | Wheat | 620 | 29 | 381 | 80 | 18 | 24 | 41 | 29 | <1 | 83 | 17 | |
| Barley | 270 | 12 | 252 | 63 | 6 | 17 | 29 | 0 | 0 | 66 | 34 | ||
| Brome grass | 149 | 25 | 64 | 59 | 9 | 14 | 27 | 0 | 0 | 64 | 36 | ||
| Wild oat | 209 | 22 | 157 | 61 | 29 | 43 | 44 | 4 | 0 | 75 | 25 | ||
| Oat | 47 | 2 | 17 | 38 | 45 | 60 | 48 | 0 | 0 | 77 | 23 | ||
| Phalaris | 11 | 3 | 0 | 0 | 36 | 45 | 27 | N/A | 0 | 45 | 55 | ||
| Rye grass | 7 | 3 | 0 | 29 | 0 | 0 | 10 | N/A | 0 | 29 | 71 | ||
The average includes BYDV PAV, CYDV RPV and the generic test and excludes BYDV MAV and WSMV. Plant samples collected during 2022 were not tested for BYDV MAV. ‘Generic’ refers to the generic test that can detect multiple luteovirus and/or polerovirus species.
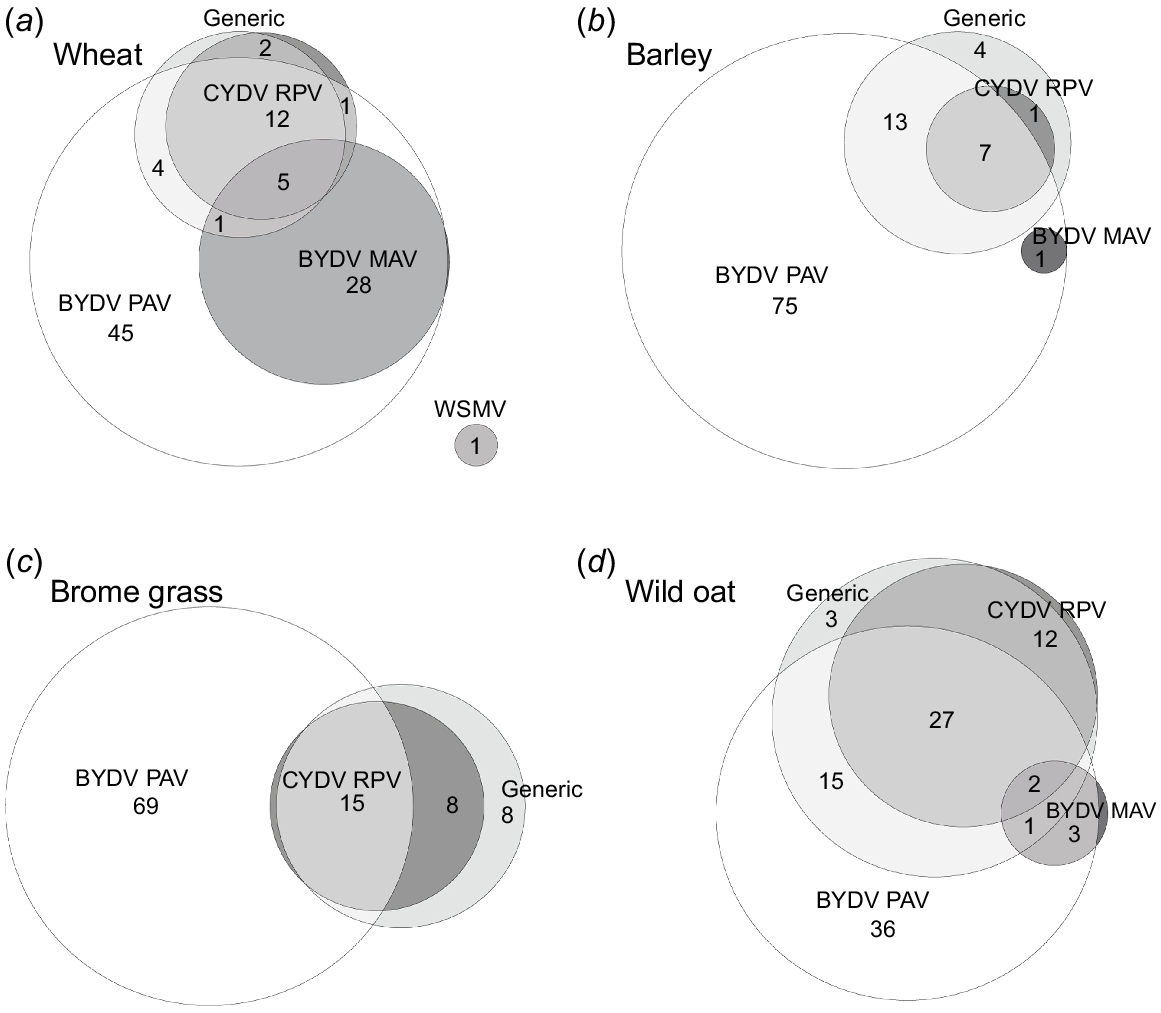
The proportion of symptomatic plants infected with multiple cereal viruses varied with host (Fig. 5, Table 4). In each year, virus symptoms were observed in wheat, barley, brome grass, and wild oat. Therefore, the majority of plant samples were collected from these hosts. A higher proportion of single infections of BYDV PAV was observed in barley (75%) and brome grass (69%) than wheat (45%) and wild oat (36%), while a higher proportion of wheat plants (34%) were infected with both BYDV PAV and BYDV MAV than wild oat (6%), barley (1%), and brome grass (0%) (Table 4c, Fig. 5). Additionally, a higher proportion of wild oat (29%) plants were positive with both BYDV PAV and CYDV RPV than wheat (17%), brome grass (15%), and barley (7%), and a higher proportion of virus-infected barley (79%) and brome grass (77%) plants were positive with only one of the five virus tests compared to wheat (47%) and wild oat (39%) (Table 4c, Fig. 5). Furthermore, the proportion of plants that tested positive with the generic test that were also positive for CYDV RPV was lower in barley (32%) than wheat (80%), brome grass (74%), and wild oat (68%) (Table 4c, Fig. 5). When analysing only the plant samples that were positive with at least one of the BYDV PAV, BYDV MAV, and CYDV RPV tests across 2020 and 2021, a higher proportion of wheat (47%) and wild oat (36%) than barley (8%) and brome grass (17%) plants were infected with more than one of the three YDV species (Table 3c). While only two oat fields were sampled across the 3 years, a higher proportion of oat plants were positive with the CYDV RPV (45%) and generic (60%) tests than any other host (Table 5). Although BYDV PAV and CYDV RPV were detected in wheat, barley, wild oat, brome grass, and oat, BYDV MAV was most often detected in wheat (29%), but was only found at low levels, or was not found at all, in the other four hosts (Table 5). Additionally, while some of the 11 samples collected from symptomatic phalaris plants were positive for CYDV RPV (36%) and with the generic test (45%), none were positive for BYDV PAV (Table 5). In contrast, none of the seven symptomatic rye grass plants were positive with the CYDV RPV or generic tests, although 29% were positive for BYDV PAV (Table 5).
Euler diagrams showing the proportions (%) of virus-positive (a) wheat (n = 315), (b) barley (n = 165), (c) brome grass (n = 26), and (d) wild oat (n = 117) plants infected with single and multiple cereal viruses across 2020 and 2021. Proportions of less than 1% are not labelled. ‘Generic’ refers to the generic test that can detect multiple luteovirus and/or polerovirus species.
Only three of the 1313 samples (less than 1%) were positive for WSMV; these three samples were all collected from the same wheat field on the same day in 2021 and were not positive with any of the other four virus tests. However, viruses other than WSMV were also detected at this field (Field 19, Supplementary Fig. S1). Although 75% of the 1313 symptomatic plants were positive with at least one virus test, the remaining 25% were not positive with any test, despite displaying symptoms of virus infection at the time of collection (Table 5a). At least one virus was detected at each of the 42 fields examined, with BYDV PAV detected at all fields except for one (98%), CYDV RPV detected at 88% of fields, WSMV detected at 2% of fields, while samples from 90% of fields were positive with the generic test; BYDV MAV was detected at 63% of the 27 fields that were examined (Supplementary Fig. S1). Almost 10% of the 339 plant samples that were positive using the generic test did not test positive with any of the other four virus tests. While almost all (98%) of the 228 CYDV RPV-positive plant samples were also positive with the generic test, only 29% of the 902 BYDV PAV-positive samples, and 19% of the 117 BYDV MAV-positive samples, were also positive with the generic test.
BYDV PAV was the most commonly detected species in the 1313 plant samples that were tested; 69% were positive for BYDV PAV, 17% were positive for CYDV RPV, 26% were positive using the generic test while 13% of the 871 plant samples that were tested for BYDV MAV were positive (Table 4). Furthermore, of the 987 virus-positive plant samples collected across the 3 years, 91% were positive for BYDV PAV, 23% for CYDV RPV, <1% for WSMV and 34% were positive using the generic TBIA test. BYDV MAV was detected in 18% of the 639 virus-positive plant samples that were tested for that virus species.
Discussion
The proportion of single and multiple virus species present in 1313 symptomatic cereal and grass plants from south-eastern Australia during 2020–2022 was examined and quantified. Overall, 34% of the virus-positive plants from 2020–2021 were infected with more than one of the three YDV species (BYDV PAV, BYDV MAV, and CYDV RPV) included in the study. This proportion is almost four times higher than the 9% previously reported by Sward and Lister (1988) when they tested 200 individual cereal and grass plants in one of the few similar published surveys conducted in the region (i.e. Victoria, south-eastern Australia) during 1985. Furthermore, Sward and Lister (1988) reported that mixed infections of BYDV PAV and CYDV RPV were the most common, while two mixed infection combinations were similarly common in our study: (1) BYDV PAV and CYDV RPV; and (2) BYDV PAV and BYDV MAV. Infection with two or more YDV species can have a particularly damaging effect on grain yield (Baltenberger et al. 1987) and can also challenge the effectiveness and development of virus-resistant cereal cultivars. These marked differences between the results of our study and those of Sward and Lister (1988) demonstrate the importance of regularly conducting epidemiological studies such as these. Relying on outdated or incomplete data can lead to misleading conclusions about the epidemiology and importance of these viruses.
Despite differences in environmental conditions during the 3 years, and the presence of more virus symptoms in some years compared to others, the relative proportions of almost all mixed infection combinations were similar in each year of the study. In contrast, host differences related to particular YDV species were much more pronounced. For example, a higher proportion of oat plants were positive with the CYDV RPV and generic tests compared to wheat and barley. Host differences were also observed by Pereira (1993) in Portugal in 1988 where a higher proportion of mixed infections of BYDV PAV and CYDV RPV was observed in oats than in wheat, triticale or barley. Similar to this study, Pereira (1993) also found a relatively high proportion of wheat plants were infected with both BYDV PAV and BYDV MAV. Eagling et al. (1989) showed that BYDV PAV was prevalent in several cultivars of perennial ryegrass while BYDV MAV and CYDV RPV were found in some cultivars but not others. When Guy et al. (1987) tested poaceous plants from Tasmania, Australia, for BYDV PAV and CYDV RPV, they found that a higher proportion of plants from the subfamilies Arundinoideae and Panicoideae were infected with CYDV RPV than BYDV PAV, while a higher proportion of plants from the subfamily Pooideae were infected with BYDV PAV than CYDV RPV. Given these differences, the varying proportions of hosts collected in each year of this study may also help to explain why fewer plants were positive with all three of the BYDV PAV, CYDV RPV, and generic tests in 2021 than 2020 and 2022. The occurrence and distribution of YDV species is directly related to the populations and activity of the aphids that transmit them. Previously published transmission studies from Australia showed that R. padi was an efficient vector of BYDV PAV, BYDV MAV and CYDV RPV, R. maidis was an efficient vector of MYDV RMV, while M. dirhodum was a moderately efficient vector of BYDV PAV and BYDV MAV but did not transmit CYDV RPV or MYDV RMV (Waterhouse and Helms 1985; Sward and Lister 1988). The occurrence and prevalence of aphid species were not monitored throughout this study but will be the focus of future research of YDV disease in south-eastern Australia.
In contrast to the YDVs, and to the relatively high incidence of WSMV found in volunteer cereals at one particular field in Victoria outside of the growing season in 2018 (Nancarrow et al. 2019), WSMV was found in only three of the 1313 plants that were tested. Yield losses caused by WSMV infection can range from minimal up to almost 100% (Shahwan and Hill 1984; Edwards and McMullen 1987). In Australia, WSMV infection has caused particularly significant damage to irrigated wheat fields and early-sown wheat in New South Wales (Jones and Burges 2006; Dwyer et al. 2007; Coutts et al. 2008b) and has been detected with high incidence in commercial wheat fields in Western Australia (Coutts et al. 2008a). Although WSMV was reported as being present in Victoria for the first time in 2003 (Ellis et al. 2003b), little information has been published about its occurrence and distribution in commercial cereal fields in the region since it was first reported. The results of this study suggest that although WSMV is present, YDVs were the more important cereal viruses in the fields examined.
One quarter of the symptomatic plants did not test positive for any virus. It is possible that these were virus-infected but the virus concentration was too low to be detected by the TBIA tests, which are typically less sensitive than molecular methods. It is also possible that they were positive for YDV species or isolates that were not detected by the antibodies present in the TBIA assays used in this study. This possibility was illustrated by Malmstrom et al. (2017) when they observed that a CYDV RPS isolate collected from a non-crop perennial grass was not reliably detected by a serological test that targeted CYDV RPV, even though CYDV RPV and CYDV RPS are closely related. Given that CYDV RPS was recently reported for the first time in Australia (Nancarrow et al. 2023), it is possible that some of the plants that did not test positive for any virus were infected with a CYDV RPS isolate that was not detected by the CYDV RPV TBIA test. However, since it is difficult to diagnose plants based on symptoms alone, it is also possible that the plants that did not test positive for any virus were not infected with any virus. The symptoms observed throughout the study varied in severity. Some symptoms were obviously related to virus infection while others were less so. Moreover, more samples were collected from plants with ‘less obvious’ symptoms during 2021 when fewer symptomatic plants were available. Regardless, these ‘virus-negative’ plant samples require further investigation.
Almost 10% of the samples that were positive with the generic test were not positive with any of the three YDV specific tests, indicating that other YDV species are circulating in the surveyed area. Additionally, only 33% of the virus-positive samples were detected with the generic test. Previously, this generic TBIA test detected BVG in cereal samples collected from south-eastern Australia (Nancarrow et al. 2019); therefore, it is likely that some plants that were positive with the generic test were infected with BVG. Interestingly, given that the proportion of plants that tested positive with the generic test that also tested positive for CYDV RPV was lower in barley than wheat, brome grass, and wild oat, it is also likely that a higher proportion of barley plants were infected with BVG than the other hosts. Furthermore, 98% of the CYDV RPV-positive plants were detected by the generic test. In contrast, excluding the CYDV RPV-positive plants, only a small proportion of the plants that were positive with the generic test were also positive for BYDV PAV and/or BYDV MAV, thus the generic test did not reliably detect these two YDV species. Therefore, although the generic test detects more than one YDV species, it is still not entirely clear which species it detects; this will only be clarified when molecular analysis is conducted on the samples collected during this study.
Across the 3 years, more plants were infected with BYDV PAV than any other virus species. This result is similar to many other published YDV surveys that have also shown that BYDV PAV is the most commonly detected YDV species in Australia (Guy et al. 1987; Sward and Lister 1987, 1988; Jones et al. 1990; Henry et al. 1992; McKirdy and Jones 1993; Trębicki et al. 2017; Nancarrow et al. 2018). In the survey conducted by Sward and Lister (1988), 79% of samples were positive for BYDV PAV, 11% were positive for BYDV MAV, 19% were positive for CYDV RPV, and 2% were positive for MYDV RMV. Excluding detections of MYDV RMV, which was not included in our study, these findings were similar to those reported here. Additionally, at least one virus species was detected at all fields, and almost half of the virus-infected plants were positive with more than one virus test, further confirming that YDVs are widespread in south-eastern Australia. However, since symptomatic plants were targeted and plant samples were not randomly collected, this data cannot be considered representative of virus incidence more generally within a field or region.
Although serological tests such as TBIA and enzyme-linked immunosorbent assay (ELISA) are important tools for high-throughput virus testing and survey purposes, there are limitations with their use: these assays are unable to differentiate between some of the more closely related YDV species, they are less sensitive than molecular tests, are not available for the detection of all YDV species, antibodies from different sources can have different levels of cross-reactivity with other YDV species, and it can be difficult to continuously source some specific antibodies, which was demonstrated by the discontinued production of the BYDV MAV antibody that was used in the first 2 years of this study. However, in addition to the ease and efficiency with which serological tests can examine large volumes of samples, these methods are particularly effective initial screening tools because of their ability to detect a broad range of YDV isolates and their inability to distinguish between closely related YDV species. With the rapid increase in the description of new YDV species using molecular assays and viral genome sequencing, the required species resolution provided by the available serological assays is becoming a limiting factor, and these assays should be used in conjunction with more specific testing methods when identification of YDVs to species level is required.
With advances in molecular diagnostic technologies such as high-throughput sequencing (HTS), recent studies using these methods have shown that YDV diversity is greater than previously thought (Jo et al. 2018; Hodge et al. 2020; Welgemoed et al. 2020; Sõmera et al. 2021b). This is also the case in Australia, where polymerase chain reaction (PCR) and HTS were used to demonstrate for the first time that CYDV RPS and BYDV PAS are also present in Australia (Nancarrow et al. 2023, 2024). Therefore, with the previously mentioned limitations of virus testing using TBIA, it is likely that some of the plants identified with the CYDV RPV TBIA test were infected with CYDV RPS, and some of the plants identified with the BYDV PAV TBIA test were infected with BYDV PAS. Several studies have shown that when serological testing indicated that BYDV PAV was present, further molecular testing showed that BYDV PAS was often also present, and that it was usually more prevalent than BYDV PAV (Robertson and French 2007; Kundu 2008; Kundu et al. 2009; Sõmera et al. 2021b). Additionally, several studies have shown that BYDV PAS can cause more severe damage than BYDV PAV and that some sources of virus resistance that are effective against BYDV PAV can be overcome by BYDV PAS (Chay et al. 1996; Bencharki et al. 1999; Robertson and French 2007). However, Jarošová et al. (2013) found that BYDV PAV was more damaging than BYDV PAS in the Czech Republic, which further demonstrates the complex epidemiology of these viruses. Given these findings and the recent detection of BYDV PAS in Australia, further work is needed to determine the distribution, prevalence and impact of BYDV PAS in cereals in Australia. While BYDV PAV has been the main focus of screening for BYDV resistance in Australia (Zhou et al. 2015; Choudhury et al. 2018; Choudhury et al. 2019; Hu et al. 2019), the presence of these more recently reported YDV species, such as BYDV PAS, in Australia suggests that the epidemiology and management of these viruses in Australia is more complex than it is currently thought to be.
Data availability
The data that support this study are available in the article and accompanying online supplementary material.
Declaration of funding
This work was funded by an Australian Government Research Training Scholarship through the Centre for Agricultural Innovation, which is a joint initiative between the University of Melbourne and Agriculture Victoria Research. It was further supported by a Grains Research and Development Corporation Research Scholarship (UOM2202-002RSX).
Acknowledgements
The authors thank Mohammad Aftab for technical support and all growers and agronomists who allowed and enabled access to cereal fields for sample collection.
References
ABARES (2023) Australian Crop Report June 2023. ABARES, Canberra, Australia. Available at https://doi.org/10.25814/4xkx-8v26
Baltenberger DE, Ohm HW, Foster JE (1987) Reactions of oat, barley and wheat to infection with barley yellow dwarf virus isolates. Crop Science 27(2), 195-198.
| Crossref | Google Scholar |
Bencharki B, Mutterer J, El Yamani M, Ziegler-Graff V, Zaoui D, Jonard G (1999) Severity of infection of Moroccan barley yellow dwarf virus PAV isolates correlates with variability in their coat protein sequences. Annals of Applied Biology 134(1), 89-99.
| Crossref | Google Scholar |
Carew M, Schiffer M, Umina P, Weeks A, Hoffmann A (2009) Molecular markers indicate that the wheat curl mite, Aceria tosichella Keifer, may represent a species complex in Australia. Bulletin of Entomological Research 99(5), 479-486.
| Crossref | Google Scholar | PubMed |
Chay CA, Smith DM, Vaughan R, Gray SM (1996) Diversity among isolates within the PAV serotype of barley yellow dwarf virus. Phytopathology 86(4), 370-377.
| Crossref | Google Scholar |
Choudhury S, Al-Shammari D, Hu H, Meinke H, Westmore G, Birchall C, Larkin P, Zhou M (2018) A screening method to detect BYDV-PAV resistance in cereals under glasshouse conditions. Plant Pathology 67(9), 1987-1996.
| Crossref | Google Scholar |
Choudhury S, Hu H, Fan Y, Larkin P, Hayden M, Forrest K, Birchall C, Meinke H, Xu R, Zhu J, Zhou M (2019) Identification of new QTL contributing to barley yellow dwarf virus-PAV (BYDV-PAV) resistance in wheat. Plant Disease 103(11), 2798-2803.
| Crossref | Google Scholar | PubMed |
Coutts BA, Hammond NEB, Kehoe MA, Jones RAC (2008a) Finding Wheat streak mosaic virus in south-west Australia. Australian Journal of Agricultural Research 59(9), 836-843.
| Crossref | Google Scholar |
Coutts BA, Strickland GR, Kehoe MA, Severtson DL, Jones RAC (2008b) The epidemiology of Wheat streak mosaic virus in Australia: case histories, gradients, mite vectors, and alternative hosts. Australian Journal of Agricultural Research 59(9), 844-853.
| Crossref | Google Scholar |
Dwyer GI, Gibbs MJ, Gibbs AJ, Jones RAC (2007) Wheat streak mosaic virus in Australia: relationship to isolates from the pacific northwest of the USA and its dispersion via seed transmission. Plant Disease 91(2), 164-170.
| Crossref | Google Scholar | PubMed |
Eagling DR, Cunningham PJ, Sward RJ, Halloran GM (1989) The incidence of barley yellow dwarf virus isolates in perennial ryegrass (Lolium perenne) in south-western Victoria. Plant Pathology 38(3), 408-413.
| Crossref | Google Scholar |
Edwards MC, McMullen MP (1987) Effects of wheat streak mosaic virus infection on fifteen hard red spring wheat cultivars. Farm Research 44, 6-7.
| Google Scholar |
Ellis MH, Rebetzke GJ, Chu P (2003a) First report of Wheat streak mosaic virus in Australia. Plant Pathology 52(6), 808.
| Crossref | Google Scholar |
Ellis MH, Rebetzke GJ, Mago R, Chu P (2003b) First report of Wheat streak mosaic virus in Australia. Australasian Plant Pathology 32(4), 551-553.
| Crossref | Google Scholar |
Gill CC (1980) Assessment of losses on spring wheat naturally infected with barley yellow dwarf virus. Plant Disease 64(2), 197-203.
| Crossref | Google Scholar |
Guy PL, Johnstone GR, Duffus JE (1986) Occurrence and identity of barley yellow dwarf viruses in Tasmanian pasture grasses. Australian Journal of Agricultural Research 37(1), 43-53.
| Crossref | Google Scholar |
Guy PL, Johnstone GR, Morris DI (1987) Barley yellow dwarf viruses in, and aphids on, grasses (including cereals) in Tasmania. Australian Journal of Agricultural Research 38(1), 139-152.
| Crossref | Google Scholar |
Hall GS, Little DP (2013) Within-host competition between barley yellow dwarf-PAV and -PAS. Virus Research 174(1), 148-151.
| Crossref | Google Scholar |
Halliday RB, Knihinicki DK (2004) The occurrence of Aceria tulipae (Keifer) and Aceria tosichella Keifer in Australia (Acari: Eriophyidae). International Journal of Acarology 30(2), 113-118.
| Crossref | Google Scholar |
Hawkes JR, Jones RAC (2005) Incidence and distribution of barley yellow dwarf virus and cereal yellow dwarf virus in over-summering grasses in a Mediterranean-type environment. Australian Journal of Agricultural Research 56(3), 257-270.
| Crossref | Google Scholar |
Henry M, Francki RIB, Wallwork H (1992) Occurrence of barley yellow dwarf virus in cereals and grasses of the low-rainfall wheatbelt of South Australia. Plant Pathology 41(6), 713-721.
| Crossref | Google Scholar |
Hodge BA, Paul PA, Stewart LR (2020) Occurrence and high-throughput sequencing of viruses in Ohio wheat. Plant Disease 104(6), 1789-1800.
| Crossref | Google Scholar | PubMed |
Hu H, Choudhury S, Shabala S, Gupta S, Zhou M (2019) Genomic regions on chromosome 5H containing a novel QTL conferring barley yellow dwarf virus-PAV (BYDV-PAV) tolerance in barley. Scientific Reports 9(1), 11298.
| Crossref | Google Scholar | PubMed |
Jarošová J, Chrpová J, Šíp V, Kundu JK (2013) A comparative study of the Barley yellow dwarf virus species PAV and PAS: distribution, accumulation and host resistance. Plant Pathology 62(2), 436-443.
| Crossref | Google Scholar |
Jo Y, Bae J-Y, Kim S-M, Choi H, Lee BC, Cho WK (2018) Barley RNA viromes in six different geographical regions in Korea. Scientific Reports 8(1), 13237.
| Crossref | Google Scholar | PubMed |
Jones RAC, Burges N (2006) Wheat streak mosaic virus: keeping a new enemy in check. Australian Grain 15, 4-8.
| Google Scholar |
Jones RAC, McKirdy SJ, Shivas RG (1990) Occurrence of barley yellow dwarf viruses in over-summering grasses and cereal crops in Western Australia. Australasian Plant Pathology 19(3), 90-96.
| Crossref | Google Scholar |
Jones RAC, Coutts BA, Mackie AE, Dwyer GI (2005) Seed transmission of Wheat streak mosaic virus shown unequivocally in wheat. Plant Disease 89(10), 1048-1050.
| Crossref | Google Scholar | PubMed |
Kundu JK (2008) First report of Barley yellow dwarf virus-PAS in wheat and barley grown in the Czech Republic. Plant disease 92(11), 1587.
| Crossref | Google Scholar | PubMed |
Kundu JK, Jarošová J, Gadiou S, Cervená G (2009) Discrimination of three BYDV species by one-step RT-PCR-RFLP and sequence based methods in cereal plants from the Czech Republic. Cereal Research Communications 37(4), 541-550.
| Crossref | Google Scholar |
Lacroix C, Seabloom EW, Borer ET (2014) Environmental nutrient supply alters prevalence and weakens competitive interactions among coinfecting viruses. New Phytologist 204(2), 424-433.
| Crossref | Google Scholar | PubMed |
Leclercq-Le Quillec F, Plantegenest M, Riault G, Dedryver CA (2000) Analyzing and modeling temporal disease progress of Barley yellow dwarf virus serotypes in barley fields. Phytopathology 90(8), 860-866.
| Crossref | Google Scholar | PubMed |
Malmstrom CM, Bigelow P, Trębicki P, Busch AK, Friel C, Cole E, Abdel-Azim H, Phillippo C, Alexander HM (2017) Crop-associated virus reduces the rooting depth of non-crop perennial native grass more than non-crop-associated virus with known viral suppressor of RNA silencing (VSR). Virus Research 241, 172-184.
| Crossref | Google Scholar | PubMed |
McKirdy SJ, Jones RAC (1993) Occurrence of barley yellow dwarf virus serotypes MAV and RMV in over-summering grasses. Australian Journal of Agricultural Research 44(6), 1195-1209.
| Crossref | Google Scholar |
McKirdy SJ, Jones RAC (1996) Use of imidacloprid and newer generation synthetic pyrethroids to control the spread of barley yellow dwarf luteovirus in cereals. Plant Disease 80(8), 895-901.
| Crossref | Google Scholar |
McKirdy SJ, Jones RAC, Nutter FW, Jr (2002) Quantification of yield losses caused by barley yellow dwarf virus in wheat and oats. Plant Disease 86, 769-773.
| Crossref | Google Scholar | PubMed |
Milgate A, Adorada D, Chambers G, Terras MA (2016) Occurrence of winter cereal viruses in New South Wales, Australia, 2006 to 2014. Plant Disease 100(2), 313-317.
| Crossref | Google Scholar | PubMed |
Nancarrow N, Aftab M, Freeman A, Rodoni B, Hollaway G, Trębicki P (2018) Prevalence and incidence of yellow dwarf viruses across a climatic gradient: a four-year field study in south eastern Australia. Plant Disease 102, 2465-2472.
| Crossref | Google Scholar | PubMed |
Nancarrow N, Aftab M, Zheng L, Maina S, Freeman A, Rodoni B, Spackman M, Trębicki P (2019) First report of barley virus G in Australia. Plant Disease Notes 103(7), 1799.
| Crossref | Google Scholar |
Nancarrow N, Aftab M, Hollaway G, Rodoni B, Trębicki P (2021) Yield losses caused by Barley Yellow Dwarf Virus-PAV infection in wheat and barley: a three-year field study in South-Eastern Australia. Microorganisms 9(3), 645.
| Crossref | Google Scholar | PubMed |
Nancarrow N, Kinoti WM, Lam SK, Rodoni B, Trębicki P (2023) First report of cereal yellow dwarf virus RPS infecting wheat in Australia. Plant Disease 107(10), 3325.
| Crossref | Google Scholar |
Nancarrow N, Kinoti WM, Rodoni B, Lam SK, Trebicki P (2024) First report of barley yellow dwarf virus PAS (Luteovirus pashordei) in oat in Australia. Plant Disease 108(4), 1123.
| Crossref | Google Scholar |
Oswald JW, Houston BR (1951) A new virus disease of cereals, transmissible by aphids. Plant Disease Reporter 35(11), 471-475.
| Google Scholar |
Pereira AMN (1993) Epidemiology of barley yellow dwarf viruses in Portugal. Phytopathologia Mediterranea 32(3), 211-222.
| Google Scholar |
Robertson NL, French R (2007) Genetic structure in natural populations of barley/cereal yellow dwarf virus isolates from Alaska. Archives of Virology 152(5), 891-902.
| Crossref | Google Scholar | PubMed |
Shahwan I, Hill J (1984) Identification and occurrence of wheat streak mosaic virus in winter wheat in Colorado and its effects on several wheat cultivars. Plant Disease 68(7), 579-581.
| Crossref | Google Scholar |
Singh K, Wegulo SN, Skoracka A, Kundu JK (2018) Wheat streak mosaic virus: a century old virus with rising importance worldwide. Molecular Plant Pathology 19(9), 2193-2206.
| Crossref | Google Scholar | PubMed |
Slykhuis JT (1955) Aceria tulipae Keifer (Acarina: Eriophyidae) in relation to the spread of wheat streak mosaic. Phytopathology 45(3), 116-128.
| Google Scholar |
Smith HC (1957) Cereal yellow dwarf virus seen in Australia. Commonwealth Phytopathological News 3, 10-11.
| Google Scholar |
Smith PR, Sward RJ (1982) Crop loss assessment studies on the effects of barley yellow dwarf virus in wheat in Victoria. Australian Journal of Agricultural Research 33(2), 179-185.
| Crossref | Google Scholar |
Sõmera M, Fargette D, Hébrard E, Sarmiento C, ICTV Report Consortium (2021a) ICTV Virus Taxonomy Profile: Solemoviridae 2021. Journal of General Virology 102(12), 001707.
| Crossref | Google Scholar |
Sõmera M, Massart S, Tamisier L, Sooväli P, Sathees K, Kvarnheden A (2021b) A survey using high-throughput sequencing suggests that the diversity of cereal and barley yellow dwarf viruses is underestimated. Frontiers in Microbiology 12, 673218.
| Crossref | Google Scholar | PubMed |
Sward RJ, Lister RM (1987) The incidence of barley yellow dwarf viruses in wheat in Victoria. Australian Journal of Agricultural Research 38(5), 821-828.
| Crossref | Google Scholar |
Sward RJ, Lister RM (1988) The identity of barley yellow dwarf virus isolates in cereals and grasses from mainland Australia. Australian Journal of Agricultural Research 39(3), 375-384.
| Crossref | Google Scholar |
Thackray DJ, Ward LT, Thomas-Carroll ML, Jones RAC (2005) Role of winter-active aphids spreading Barley yellow dwarf virus in decreasing wheat yields in a Mediterranean-type environment. Australian Journal of Agricultural Research 56, 1089-1099.
| Crossref | Google Scholar |
Trębicki P, Nancarrow N, Bosque-Pérez NA, Rodoni B, Aftab M, Freeman A, Yen A, Fitzgerald G (2017) Virus incidence in wheat increases under elevated CO2: a 4-year field study of yellow dwarf viruses from a free air carbon dioxide facility. Virus Research 241, 137-144.
| Crossref | Google Scholar | PubMed |
Walker PJ, Siddell SG, Lefkowitz EJ, Mushegian AR, Adriaenssens EM, Alfenas-Zerbini P, Davison AJ, Dempsey DM, Dutilh BE, García ML, Harrach B, Harrison RL, Hendrickson RC, Junglen S, Knowles NJ, Krupovic M, Kuhn JH, Lambert AJ, Łobocka M, Nibert ML, Oksanen HM, Orton RJ, Robertson DL, Rubino L, Sabanadzovic S, Simmonds P, Smith DB, Suzuki N, Van Dooerslaer K, Vandamme A-M, Varsani A, Zerbini FM (2021) Changes to virus taxonomy and to the International Code of Virus Classification and Nomenclature ratified by the International Committee on Taxonomy of Viruses (2021). Archives of Virology 166(9), 2633-2648.
| Crossref | Google Scholar | PubMed |
Waterhouse PM, Helms K (1985) Metopolophium dirhodum (Walker): a newly arrived vector of barley yellow dwarf virus in Australia. Australasian Plant Pathology 14(4), 64-66.
| Crossref | Google Scholar |
Watson MA, Mulligan TE (1960) Comparison of two barley yellow-dwarf viruses in glasshouse and field experiments. Annals of Applied Biology 48(3), 559-574.
| Crossref | Google Scholar |
Welgemoed T, Pierneef R, Read DA, Schulze SE, Pietersen G, Berger DK (2020) Next generation sequencing reveals past and current widespread occurrence of maize yellow mosaic virus in South Africa. European Journal of Plant Pathology 158(1), 237-249.
| Crossref | Google Scholar |
Wen F, Lister RM, Fattouh FA (1991) Cross-protection among strains of barley yellow dwarf virus. Journal of General Virology 72(4), 791-799.
| Crossref | Google Scholar |
Zhou M, Larkin P, Schwinghamer M, Coutts B, Birchall C, Johnson P, Westmore G, Davey B (2015) Studies on barley yellow dwarf virus (BYDV) in wheat. In ‘Proceedings of 17th Australian Society of Agronomy Conference’, 20–24 September 2015, Hobart, Australia. pp. 1–4. Available at http://www.agronomyaustraliaproceedings.org/images/sampledata/2015_Conference/pdf/agronomy2015final00295.pdf