

Reduced irrigation in high rainfall years and winter application of nitrogen reduce granulation in Imperial mandarin (Citrus reticulata cv. Imperial)
Helen J. Hofman A * , Hanna Toegel A , Siegrid C. Parfitt A and Malcolm W. Smith AA
Abstract
Preharvest granulation of Imperial mandarins is a significant problem for the Australian market. Causes of, and solutions for, this physiological disorder are poorly understood despite decades of research worldwide.
This research aimed to find management practices for growers to reduce granulation.
A 5-year on-farm trial in central Queensland, Australia, compared standard versus deficit irrigation and five rates of winter nitrogen application.
Reducing water (irrigation plus rainfall) in the 16–18 weeks following flowering reduced granulation in 3 of 5 years. Granulation increases with ratio of total water received to evapotranspiration, particularly in low crop load years. Higher nitrogen applications reduced granulation in 4 of 5 years, although treatment means were only significantly different at α = 0.05 in 1 year. Granulation increased with stronger early spring flush growth in a low crop load year and with later spring flush growth in one of two high crop load years. The deficit irrigation treatment had less spring flush growth and higher fruit set than the control in all years. Higher nitrogen treatments had more flush growth in high crop load years and less in low crop load years. Our data suggests competition between flush growth and fruit development for mineral resources and/or carbohydrates is a factor in the variability of granulation from fruit to fruit, but crop load is more important.
The three key strategies to minimise granulation are to maintain high crop loads, reduce irrigation after flowering, and apply sufficient nitrogen in winter.
This research will improve fruit quality for the consumer and financial returns to growers.
Keywords: competition, crop load, dry flesh, flush, granulation, irrigation, mandarin, nitrogen nutrition, water potential.
Introduction
The mandarin cultivar Imperial (Citrus reticulata cv. Imperial) is prone to preharvest granulation, a physiological disorder in which the flesh of severely affected fruit is an opaque white in colour and tasteless, with minimal or no extractable juice. Partially affected fruits are ‘crunchy’, with less flavour and juice than unaffected fruit. A significant proportion of granulated fruit reaches the consumer in some years because granulation cannot reliably be detected by the outward appearance or density of the fruit.
The vesicles that make up the internal flesh of citrus fruits are composed of thin-walled cells dominated by a juice-filled vacuole. Juice cells and vesicles in granulated fruit have thicker walls than unaffected fruit and juice is gelated (Shomer et al. 1989; Kang et al. 2022). Granulated fruit have a lower extractable juice percentage (Chakrawar and Singh 1977; Kaur et al. 1991). This appears to be the result of gelation, as several studies have found moisture content is higher in granulated fruit than in unaffected fruit (Awasthi and Nauriyal 1972a; Singh and Singh 1980a). A decrease in total soluble solid content in granulated vesicles is well established (Shomer et al. 1989; Kaur et al. 1990; Sharma et al. 2006; Wang et al. 2014).
Research on granulation in citrus has been conducted in growing regions of the world since the 1940s and, although causes and solutions remain poorly understood, many associations have been identified. These include larger fruit size (Awasthi and Nauriyal 1972b; Sharma et al. 2006), vegetative vigour (Bartholomew et al. 1941; Jawanda et al. 1978), low crop load (Gravina et al. 2004; Ritenour et al. 2004), rootstock type or rootstock vigour (Awasthi and Nauriyal 1972b; Albrigo 1978; Sharma and Saxena 2004), shaded positions in the canopy (Bartholomew et al. 1941; Awasthi and Nauriyal 1972c), warmer climates or high temperatures (Awasthi and Nauriyal 1971; Ritenour et al. 2004), low temperatures (Bartholomew et al. 1941; Chakrawar and Singh 1977), coastal regions (Bartholomew et al. 1941), higher rainfall in late summer or autumn (Van Noort 1969; Grierson 1981; Ritenour et al. 2004) and various mineral deficiencies or excesses (Awasthi and Nauriyal 1972d; Singh and Singh 1980b; Kaur et al. 1990).
These associations suggest that plant water status and nutrition are key aspects of on-farm management of granulation. Several studies have shown that granulation is reduced where irrigation water is reduced in volume (Erickson and Richards 1955; Malik et al. 1981) or the frequency of irrigation is reduced (Singh and Singh 1980c). It is only in recent decades that granulation has emerged as a major production problem for Imperial mandarin in Australia, despite at least 100 years of commercial production of a cultivar that originated as early as 1890 (Hardy et al. 2017). This may be partly due to increases in the volume and frequency of irrigation, with the advent of microsprinklers and monitoring technologies that are better able to avoid moisture stress and maximise fruit size. For these reasons we decided to trial reduced irrigation in an on-farm trial within a block prone to granulation.
The question of whether there is a critical period for irrigation or rainfall is an important one. The development of citrus fruit is described as having three broad stages: (I) cell division, (II) cell enlargement, and (III) fruit maturation and ripening (Bain 1958). Published reports suggest that high rainfall in late Stage II may be associated with granulation in navel oranges (Van Noort 1969; Ritenour et al. 2004). However, our initial research in Imperials suggested that Stage I was the most critical period for overwatering (Hofman 2010). Imperial is an early maturing cultivar and fruit growth is rapid. This may mean that, compared to other cultivars, early fruit development is more critical. We, thus, decided to apply the reduced irrigation treatment early in fruit development.
Most studies of mineral applications report favourable results from nearly every applied nutrient treatment (Singh and Singh 1981; Kaur et al. 1990), but this should be interpreted in the context that such studies were often conducted in regions with soil nutrient deficiencies. In our earlier trials with Imperials, we applied treatments with high and low levels of broadcast nitrogen (N), boron, zinc, potassium or phosphorus, or foliar applications of N, calcium or zinc. Of these treatments, only N applications of 200–300 g/tree in Stage I of fruit development consistently reduced granulation (Hofman 2010). Treatments that applied similar amounts of N in Stage II of fruit development had no effect. The success of Stage I applications was likely due to inadequate N applications in winter (i.e. 400–500 g N/tree) rather than to the Stage I timing. It was common industry practice at the time to reduce winter N applications below the recommended 800 g N/tree (Vock et al. 1997) to promote the earlier development of colour in the peel.
We hypothesise that winter N applications are key to supporting spring flush growth and thus reducing the competition for mineral resources and/or carbohydrates between fruit and flush in early fruit development. N used during the spring flush is mostly sourced from reserves in the tree, with only 10–30% supplied from the soil (Mooney and Richardson 1992; Martinez et al. 2002; Kreuger and Arpaia 2008). Indeed, studies in Australia by Chapman (1986) found that applications at times other than winter were ineffective and could be detrimental to fruit quality. Consequently, we compared effects on granulation of a range of winter N application levels in our trial.
The rapid development of Imperial fruit may mean that, compared to other cultivars, early fruit development is more susceptible to competition from expanding vegetative flush, and/or more susceptible to delays in the maturation of new flush from a ‘sink’ to a ‘source’ of carbohydrates. Individual fruit on the one tree vary in granulation severity. This could be due, at least in part, to variations in competition or supply of minerals and/or carbohydrates due to the extent or timing of flush growth at the shoot or twig level. If the pattern of flush growth is a factor, it might be possible to minimise granulation through strategies such as plant growth regulator applications, pruning or girdling. We therefore decided to measure flush growth and granulation at the individual twig level to better understand if flush growth patterns are a factor in granulation, whether they help to explain variation from fruit to fruit within the tree and whether irrigation or N treatments affected these patterns.
Our research hypothesis was that reduced irrigation and/or sufficient winter N applications would reduce incidence of granulation. We also hypothesised that variable patterns in spring flush expansion may contribute to variability in granulation from fruit to fruit. Our objectives were to test whether growers could reduce the incidence of granulation in Imperial mandarins by reducing irrigation and applying winter N, to ascertain relative effectiveness of the two practices and if there was any interaction between them, and to better understand the influence of flush growth at the individual twig and fruit level.
Materials and methods
Trial site and design
The trial was situated within a commercial orchard block in Wallaville, Central Queensland, Australia (25.1219°S, 151.9955°E), using trees on ‘Benton’ rootstocks that were 7 years old in Year 1, on a sandy soil, at 7 × 3 m spacing. Rows were on a slight slope, aligned east–west. The trial had a split plot design with irrigation treatments as the main plots and N treatments as the subplots. The subplots were of five trees, with data collected from the central three trees. There were five replicates. The trial design was balanced using two interlinked Latin squares, one for each irrigation treatment. Apart from the irrigation and N treatments detailed below, all trees were subject to the same fertiliser, pest management and harvesting practices (Hardy et al. 2017).
Treatments
Treatments were applied for 5 consecutive years (2017/18–2021/22). The two irrigation treatments were a ‘control’ treatment, that is, standard commercial irrigation as practised for Imperial blocks (Hardy et al. 2017), and a ‘deficit’ treatment. Deficits were imposed by turning off taps installed in irrigation pipes in ‘deficit’ treatment rows when the ‘control’ treatment was irrigated. The level of deficit each year was thus not an independent amount but was always relative to the ‘control’. Decisions to irrigate the ‘control’ treatment were made by the grower. Decisions to irrigate the ‘deficit’ treatment were made by the researchers, based on a visual assessment of stress in the trees and soil moisture monitoring using tensiometers. In Year 1, there was frequent rainfall in Stage I of fruit development so deficits could not be applied. We therefore continued treatments in this and subsequent years into mid-Stage II (mid- to late-January). Deficits were applied from the end of flowering (early September). Table 1 shows estimated evapotranspiration (ET0), hours of irrigation, rainfall, and total water (rain + irrigation) as a percentage of ET0 during treatment periods for each treatment. ET0 is reference crop evapotranspiration for Bundaberg as calculated by the Australian Bureau of Meteorology using the Penman–Monteith equation (Allen et al. 1998). Irrigation rate was calculated as sprinkler output (L/h)/[row spacing (m) × sprinkler spacing (m)] that is, 3.3 mm/h.
| Trial year and treatment period | ET0 (mm) | Rain (mm) | Hours of irrigation | Total water (rain + irrigation) (mm) | Total water/ET0 (%) | ||||
|---|---|---|---|---|---|---|---|---|---|
| Control | Deficit | Control | Deficit | Control | Deficit | ||||
| Year 1 | 631 | 535 | 30 | 4 | 634 | 548 | 101 | 87 | |
| wb 24/9 to wb 14/1 | |||||||||
| Year 2 | 734 | 405 | 94 | 2 | 719 | 412 | 98 | 56 | |
| wb 23/9 to wb 20/1 | |||||||||
| Year 3 | 656 | 86 | 86 | 28 | 369 | 179 | 56 | 27 | |
| wb 7/10 to wb 6/1 | |||||||||
| Year 4 | 750 | 248 | 101 | 36 | 580 | 365 | 77 | 49 | |
| wb 21/9 to wb 18/1 | |||||||||
| Year 5 | 664 | 667 | 63 | 25 | 859 | 743 | 129 | 112 | |
| wb 27/9 to wb 24/1 | |||||||||
wb, week beginning.
ET0 = reference crop evapotranspiration calculated using the Penman–Monteith equation. For Years 1–3, ET0 is Bureau of Meteorology data for Bundaberg airport, Station 39128. In Years 4 and 5, data is from the PhyTech alert system for Wallaville. Rainfall and irrigation hours were recorded by farm staff. Irrigation data for Year 1 is an estimate based on soil moisture readings. ML/ha can be calculated as mm/100.
Nitrogen nutrition treatments were five rates of winter applications of N: 850, 700, 550, 400 and 250 g N/tree or 405, 333, 262, 190 and 119 kg N/ha (Treatments 1–5 respectively). The recommended rate for 7-year-old trees is 700 g/N tree, increasing to 800 g/N tree from Year 8 onwards (Vock et al. 1997). In Year 2, the lowest N rate (Treatment 5) was 340 g/tree due to an application error. N applications were single broadcast applications of granular urea (46% N) in early winter with minor adjustments for fertiliser blends applied at approximately the same time. No additional N applications were made at other times of the year.
Crop load assessment
From Year 2, the crop load on each data tree was visually rated at harvest using an 11-point scale. Ratings are relative within the 1 year and years are not directly comparable.
Flush growth and fruit set measurements
From Year 2, we tagged eight twigs per tree, one at each of the 45° points of the circumference, at a reachable height on one data tree per sub-plot. In Year 2, only three of the five subplots for each treatment combination were tagged. Twigs were single growth units from the previous year’s spring or summer flush. Twigs were tagged in late winter before any spring growth was evident.
We measured the length and number of new spring flush shoots on the tagged twigs approximately every 2 weeks until fully elongated. At harvest, fruit that remained on tags were cut and rated as for the main sample (see ‘Fruit sampling and assessment’ below). Data on flush growth from twigs with no fruit at harvest were included in analysis of treatment effects on flush but excluded from analyses of flush effects on granulation. When more than one fruit was harvested from a twig, the same flush data was used for each fruit, not divided by the number of fruit.
Fruit sampling and granulation assessment
The effects of treatments were assessed at fruit maturity, approximately a week before commercial picking. Twenty fruit were picked from each data tree in a stratified random sample, five from each quadrant. Samples included fruit from both outside and inside the canopy, to a maximum of an arm’s length (~0.8 m) within the canopy, and to a height within reach of the sampler (~2 m). Where crop load was unevenly distributed around the tree, we adjusted sampling to represent the crop. In Year 5, crop loads on most trees were extremely low so we reduced sample numbers to avoid picking fruit deep inside the canopy.
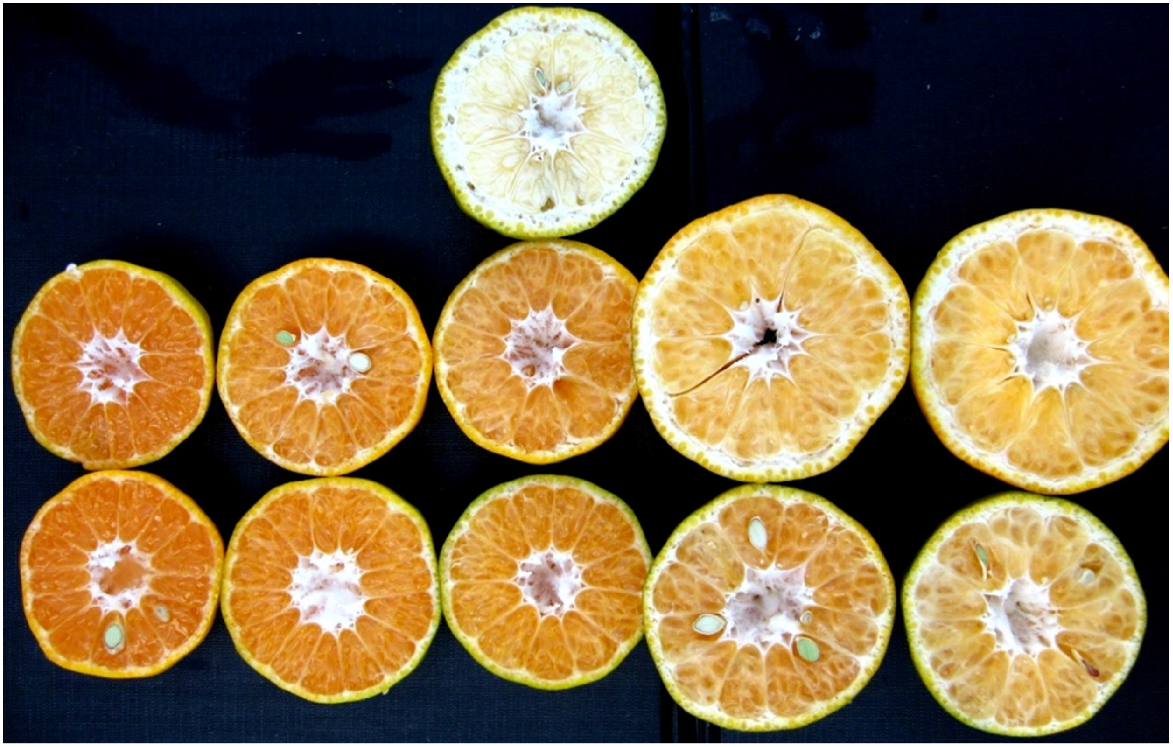
Each fruit was cut in the field in half along the equator and visually rated from 0 to 5, in steps of 0.5 (Fig. 1). Fruit rated 0 had no visible granulation, that is, vesicles had thin translucent walls, and colour was deep orange. Fruit rated 5 were opaque and white, and when squeezed had no extractable juice.
Example of visual ratings of granulation severity with ratings in bottom row (L to R) 0, 1, 2, 3, 4; second row (L to R), ratings 0.5, 1.5, 2.5, 3.5, 4.5; top row, rating 5.
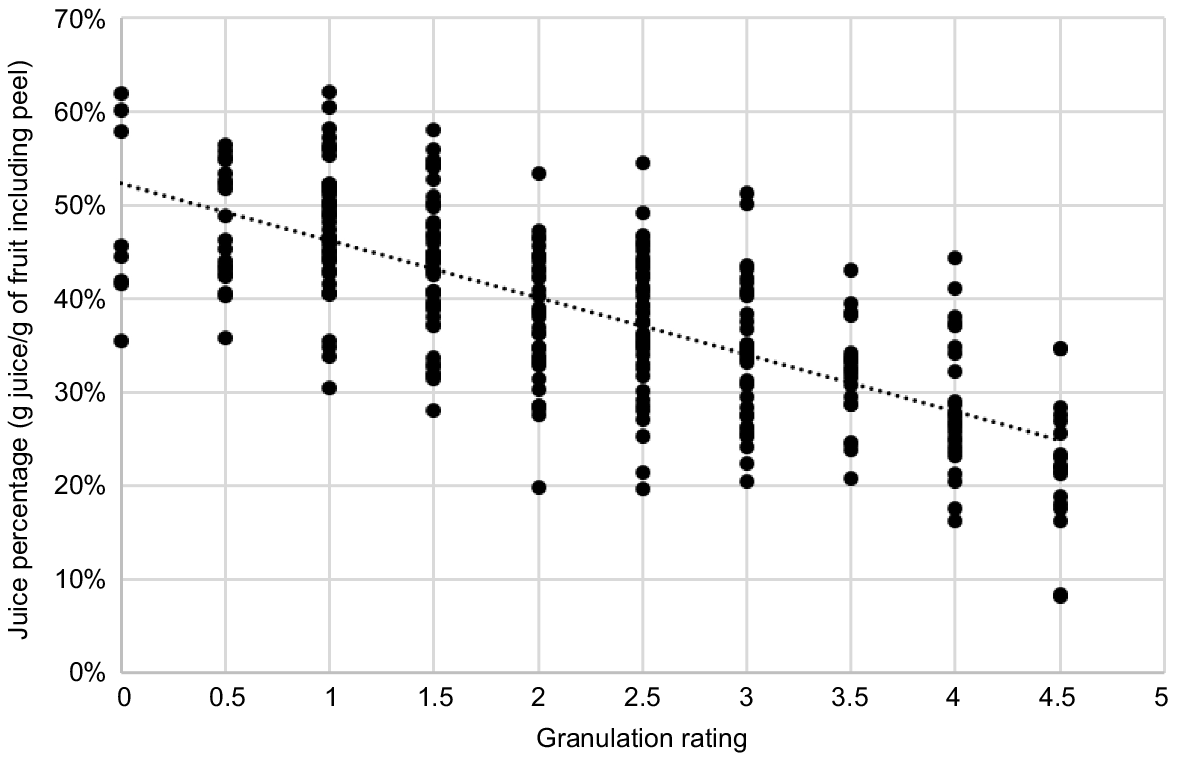
To calibrate the juice percentage of ratings, we selected 162 cut fruit in Year 2 and 159 fruit in Year 4 to cover as wide a range as possible in ratings. The juice percentage of each cut half of the subsample was measured. ‘Juice percentage’ was calculated as the volume (mL) of readily extractable juice (using a domestic juicer) as a percentage of weight (g) of the half fruit, including peel. The correlation coefficient (r) of the linear relationship between rating and juice percentage for the combined sample data was −0.711 (P < 0.001) (Fig. 2). On the basis of this data, we report fruit rated ≥3 or approximately <33% juice as ‘severely granulated’. Fruit rated 0, 0.5, 1 or 1.5 (mean juice percentage of 48.7, 47.7, 48.0 and 43.6, respectively) were categorised as ‘good’. Fruit rated as 2 or 2.5 were categorised as ‘crunchy’ (mean juice percentage of 37.8 and 37.9, respectively).
Results and discussion
Irrigation treatment effects on granulation
The deficit treatment reduced granulation in 3 out of 5 trial years, although in Year 5 treatment means were not significantly different at α = 0.05 (Table 2). The effectiveness of the treatment varied each year with differences in overall or seasonal crop load, rainfall and the volume of irrigation applied, as follows:
| Treatment | Rating | % rated ≤1.5 ‘good’ | % rated 2–2.5 ‘crunchy’ | % rated ≥3 ‘severely granulated’ | Fruit diameter (mm) | Crop load rating | |
|---|---|---|---|---|---|---|---|
| Year 1 | |||||||
| Irrigation treatment | |||||||
| Control | 2.72b | 27.1%a | 25.3% | 47.7%b | 66.5 | 3.7 | |
| Deficit | 2.43a | 34.3%b | 28.3% | 37.5%a | 66.6 | 4.0 | |
| P | 0.013 | 0.003 | 0.202 | 0.017 | 0.852 | 0.613 | |
| ese | 0.05 | 0.8% | 1.4% | 1.8% | 0.3 | 0.3 | |
| N treatment (N/tree) | |||||||
| 1. 850 g | 2.46 | 34.3% | 26.0% | 39.7% | 65.7a | 3.6 | |
| 2. 700 g | 2.35 | 33.5% | 30.2% | 36.3% | 66.8bc | 3.5 | |
| 3. 550 g | 2.63 | 30.7% | 26.2% | 43.2% | 66.4ab | 3.6 | |
| 4. 400 g | 2.66 | 29.7% | 26.5% | 43.8% | 66.5abc | 4.5 | |
| 5. 250 g | 2.78 | 25.2% | 25.0% | 49.8% | 67.4c | 4.0 | |
| P | 0.324 | 0.664 | 0.361 | 0.440 | 0.034 | 0.387 | |
| ese | 0.15 | 4.7% | 1.9% | 5.1% | 0.4 | 0.4 | |
| P interaction | 0.973 | 0.967 | 0.578 | 0.996 | 0.653 | 0.833 | |
| Year 2 | |||||||
| Irrigation treatment | |||||||
| Control | 1.55b | 63.6%a | 27.9%b | 8.5%b | 59.2b | Not rated A | |
| Deficit | 1.06a | 86.7%b | 12.1%a | 1.1%a | 56.8a | ||
| P | 0.009 | 0.014 | 0.017 | 0.012 | 0.011 | ||
| ese | 0.07 | 3.9% | 2.9% | 1.2% | 0.4 | ||
| N treatment (N/tree) | |||||||
| 1. 850 g | 1.19ab | 78.3%b | 18.3%a | 3.3% | 57.7ab | ||
| 2. 700 g | 1.11a | 84.5%b | 12.2%a | 3.3% | 56.7a | ||
| 3. 550 g | 1.22ab | 78.2%b | 19.5%ab | 2.3% | 57.9b | ||
| 4. 400 g | 1.44bc | 71.8%ab | 21.2%ab | 7.0% | 58.6bc | ||
| 5. 340 g B | 1.55c | 63.0%a | 29.0%b | 8.0% | 59.1c | ||
| P | 0.022 | 0.035 | 0.021 | 0.348 | 0.002 | ||
| ese | 0.10 | 4.7% | 3.3% | 2.4% | 0.4 | ||
| P interaction | 0.656 | 0.629 | 0.883 | 0.454 | 0.149 | ||
| Year 3 | |||||||
| Irrigation treatment | |||||||
| Control | 1.47 | 72.1% | 23.0% | 4.9% | 60.8b | 1.0a | |
| Deficit | 1.59 | 66.1% | 29.6% | 4.4% | 53.9a | 1.9b | |
| P | 0.147 | 0.296 | 0.227 | 0.665 | 0.002 | 0.002 | |
| ese | 0.11 | 6.9% | 5.7% | 2.2% | 1.1 | 0.2 | |
| N treatment (N/tree) | |||||||
| 1. 850 g | 1.37 | 76.8% | 19.8% | 3.3% | 56.2a | 1.6 | |
| 2. 700 g | 1.53 | 70.7% | 23.0% | 6.2% | 55.2a | 1.2 | |
| 3. 550 g | 1.56 | 67.6% | 27.5% | 4.8% | 57.2ab | 1.4 | |
| 4. 400 g | 1.51 | 69.7% | 27.2% | 3.2% | 58.8bc | 1.6 | |
| 5. 250 g | 1.68 | 60.5% | 33.8% | 5.7% | 59.8c | 1.5 | |
| P | 0.084 | 0.204 | 0.116 | 0.584 | 0.001 | 0.215 | |
| ese | 0.07 | 5.0% | 4.6% | 1.2% | 0.9 | 0.1 | |
| P interaction | 0.061 | 0.199 | 0.344 | 0.128 | 0.534 | 0.987 | |
| Year 4 | |||||||
| Irrigation treatment | |||||||
| Control | 0.86 | 98.1% | 1.7% | 0.3% | 59.5b | 2.6 | |
| Deficit | 0.89 | 98.8% | 1.1% | 0.1% | 56.5a | 3.1 | |
| P | 0.673 | 0.383 | 0.466 | 0.374 | 0.002 | 0.107 | |
| ese | 0.05 | 0.5% | 0.5% | 0.1% | 0.3 | 0.2 | |
| N treatment (N/tree) | |||||||
| 1. 850 g | 0.81 | 99.3% | 0.7% | 0.0% | 57.3 | 2.6 | |
| 2. 700 g | 0.88 | 98.2% | 1.8% | 0.0% | 57.2 | 2.7 | |
| 3. 550 g | 0.89 | 98.3% | 1.3% | 0.3% | 58.0 | 3.0 | |
| 4. 400 g | 0.87 | 98.2% | 1.3% | 0.5% | 58.6 | 3.0 | |
| 5. 250 g | 0.90 | 98.2% | 1.8% | 0.0% | 58.9 | 3.1 | |
| P | 0.376 | 0.757 | 0.645 | 0.487 | 0.066 | 0.152 | |
| ese | 0.03 | 0.7% | 0.6% | 0.3% | 0.3 | 0.2 | |
| P interaction | 0.148 | 0.602 | 0.500 | 0.540 | 0.806 | 0.235 | |
| Year 5 | |||||||
| Irrigation treatment | |||||||
| Control | 3.06 | 14.5% | 23.2%a | 62.3% | 60.6 | 0.9 | |
| Deficit | 2.75 | 24.0% | 28.3%b | 47.6% | 59.8 | 0.7 | |
| P | 0.147 | 0.124 | 0.044 | 0.080 | 0.057 | 0.458 | |
| ese | 0.123 | 3.5% | 1.3% | 4.4% | 0.2 | 0.2 | |
| N treatment (N/tree) | |||||||
| 1. 850 g | 3.27 | 10.2% | 23.3% | 66.5% | 60.1 | 0.7 | |
| 2. 700 g | 3.03 | 19.0% | 21.5% | 59.5% | 59.4 | 0.5 | |
| 3. 550 g | 2.92 | 18.2% | 25.2% | 56.5% | 59.9 | 0.7 | |
| 4. 400 g | 2.71 | 18.9% | 35.2% | 45.9% | 61.0 | 1.0 | |
| 5. 250 g | 2.59 | 30.2% | 23.5% | 46.3% | 60.6 | 1.1 | |
| P | 0.065 | 0.136 | 0.106 | 0.195 | 0.100 | 0.108 | |
| ese | 0.171 | 5.2% | 3.8% | 7.0% | 0.4 | 0.2 | |
| P interaction | 0.452 | 0.524 | 0.629 | 0.607 | 0.310 | 0.039 | |
In Year 1, total water over the treatment period in the deficit treatment was approximately 20% less than the control, with the differential applied mostly in early Stage II (Table 1). The deficit irrigation treatment reduced the mean granulation rating from 2.72 to 2.43 (P = 0.013). The mean proportion of severely granulated fruit was reduced from 47.7% to 37.5% (P = 0.017) (Table 2).
In Year 2, there was less rainfall than Year 1 and a high crop load. In the deficit treatment, total water was reduced by approximately half, the mean granulation rating was reduced from 1.55 to 1.06 (P = 0.009), and the mean proportion of severely granulated fruit from 8.5% to 1.1% (P = 0.012) (Table 2).
In Year 5, a year with high rainfall and very low crop load, reducing total water by 10–15% reduced the mean granulation rating from 3.06 to 2.75 (P = 0.147), and the proportion of severely granulated fruit from 62.3% to 47.6% (P = 0.080) (Table 2).
In Years 3 and 4, the deficit treatment (total water reductions of 50% and 40% respectively) had no additional benefit. We attribute this to low rainfall and the reduced volumes in the control irrigation regime (Table 1). After good results from the deficit irrigation treatment in the first 2 years of the trial, the grower reduced control irrigation volume so that total water in this treatment dropped from >100% of ET0 in the previous 2 years to 56% of ET0 in Year 3 and 77% of ET0 in Year 4. High seasonal crop load in Year 4 also meant minimal granulation in all treatments. Fruit in the deficit treatment samples were on average smaller in diameter in all years. In most years, the mean treatment differences were <3 mm but in Year 3, a year with low crop load and the lowest level of total water in the deficit treatment, the means differed by 7 mm (Table 2).
These results indicate that overwatering is an important cause of granulation. The current advice to Australian growers is that mandarin water requirements are high, 7–12 ML/ha per annum, and that it is critical to avoid water stress in flowering, fruit set and Stage I of fruit development (Hardy et al. 2017). Our results suggest these recommendations may need to be revised for Imperials. In our trial, the total water for the control treatment during the 16–18 week treatment period in the wet years 1, 2 and 5 was 6.3, 7.2 and 8.6 ML/ha (101%, 98% and 129% of ET0), compared to 5.5, 4.1 and 7.4 ML/ha in the deficit treatment (87%, 56% and 112% of ET0) (Table 1). Low levels of granulation in both irrigation treatments were achieved in the low rainfall years (3 and 4) within the range 1.8–5.8 ML/ha, or 27–77% of ET0.
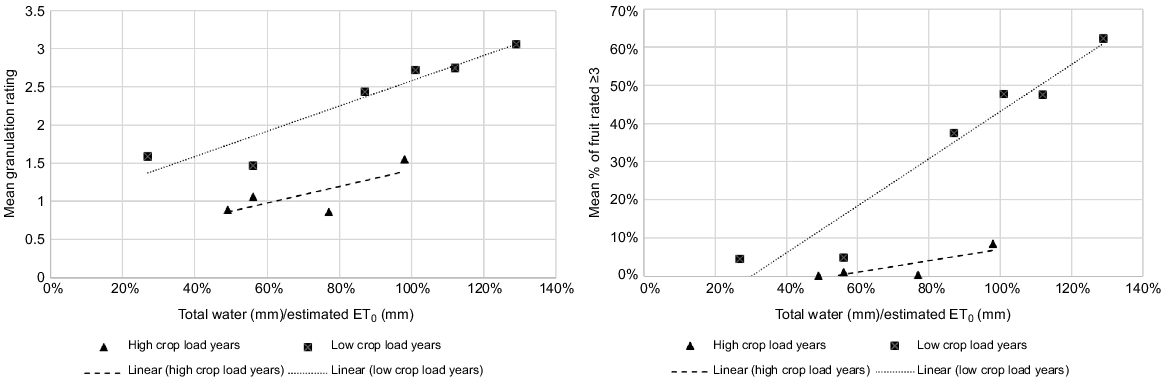
Although the number of data points is small, our results show a clear trend in increasing granulation when the ratio of total water received to evapotranspiration increases, particularly in low crop load years (Fig. 3). Variability in crop load makes it difficult to suggest specific irrigation parameters, but our data shows that applying total water to 50–60% of ET0 or 3–4 ML/ha in the 16–18 week treatment period would be a good experimental starting point. The suggested crop factor for citrus at 70% canopy cover as calculated by the UN’s Food and Agriculture Organization is 65–67% of ET0 (Allen et al. 1998). When water in the deficit treatment was reduced as low as 27% of ET0 or 1.8 ML/ha in the treatment period in Year 3, the effect on granulation was slightly detrimental (P = 0.147) and fruit size declined (P = 0.002), so this may indicate the lower level of the range for experimentation.
Relationships between the ratio of total water/estimated ET0 and mean granulation ratings (left) and % of fruit rated ≥3 (right) for irrigation treatments in 5 years of study, showing high and low crop load years separately. For mean granulation ratings in low crop load years r2 = 0.876 (P = 0.004) and in high crop load years r2 = 0.344 (P = 0.250). For mean % of fruit rated ≥3 in low crop load years, r2 = 0.917 (P = 0.002) and in high crop load years, r2 = 0.541 (P = 0.167).
Although our earlier research suggested that Stage I of fruit development was more critical (Hofman 2010), in this new trial we carried deficits through to mid- to late-January (mid-Stage II). We suggest that granulation could be triggered at any stage of fruit development but is likely to be most severe when triggered early, as it appears that, once triggered, it continues to exacerbate without the possibility of reversal. It may be that a deficit all season is beneficial: this remains to be tested.
Nitrogen treatment effects on granulation
There was lower mean granulation in the higher winter N treatments in the first 3 years of the trial (P = 0.324, 0.022, 0.084, respectively) (Table 2). Although differences between means were only significantly different at α = 0.05 in 1 year, the trend is clear. We note that Treatment 2 (700 g N/tree) tended to show higher levels of granulation than would be expected from the general trend. We attribute this anomaly to poorer tree health and shallow soil profiles in 3 of the 10 plots for this treatment. In Year 4, a very high crop load year, granulation was minimal and all the N treatments had similar granulation levels (P = 0.376). In Year 5, the trend was reversed: the higher N treatments tended to have higher granulation than the lower N treatments (P for mean granulation = 0.065; P for % of fruit severely granulated = 0.195). The reason for this reversal is unclear, as flush growth was lower for the higher N treatments (Table 3) and there were no clear differences between N treatments in fruit set (Table 4) or crop load at harvest (Table 2) (see discussion in ‘Flush growth and granulation relationships’ below).
| Max. flush length (mm) | No. of new shoots | ||||||||
|---|---|---|---|---|---|---|---|---|---|
| Year | 2 | 3 | 4 | 5 | 2 | 3 | 4 | 5 | |
| Seasonal crop load | High | Low | High | Very low | High | Low | High | Very low | |
| Date measured | 5 October | 10 October | 24 September | 5 October | 13 September | 10 October | 24 September | 13 September | |
| Irrigation treatment | |||||||||
| Control | 43.9 | 67.1b | 42.4 | 73.5 | 2.48b | 4.74 | 2.24 | 3.12 | |
| Deficit | 39.9 | 56.0a | 33.0 | 67.9 | 1.67a | 4.05 | 2.41 | 3.13 | |
| P | 0.624 | 0.014 | 0.144 | 0.156 | 0.030 | 0.061 | 0.531 | 0.913 | |
| ese | 5.7 | 1.9 | 3.7 | 2.7 | 0.25 | 0.19 | 0.18 | 0.09 | |
| N treatment (N/tree) | |||||||||
| 1. 850 g | 51.6 | 60.5ab | 41.5 | 53.9a | 2.25 | 3.57a | 2.67 | 2.56a | |
| 2. 700 g | 32.8 | 44.8a | 29.3 | 73.6bc | 1.88 | 3.57a | 2.16 | 3.35bc | |
| 3. 550 g | 43.6 | 61.8ab | 39.3 | 61.1ab | 1.79 | 4.50ab | 2.23 | 2.66ab | |
| 4. 400 g | 42.5 | 75.3b | 39.7 | 83.7c | 2.21 | 4.77ab | 2.26 | 3.45c | |
| 5. 250 g A | 39.0 | 65.1b | 38.8 | 81.1c | 2.25 | 5.55b | 2.32 | 3.59c | |
| P | 0.680 | 0.027 | 0.303 | <0.001 | 0.853 | 0.042 | 0.820 | 0.013 | |
| ese | 9.0 | 6.2 | 4.3 | 4.2 | 0.39 | 0.50 | 0.33 | 0.25 | |
| P interaction | 0.872 | 0.316 | 0.618 | 0.897 | 0.853 | 0.941 | 0.618 | 0.86 | |
| No. of fruit early October | No. of fruit early November | ||||||||
|---|---|---|---|---|---|---|---|---|---|
| Year | 2 | 3 | 4 | 5 | 2 | 3 | 4 | 5 A | |
| Seasonal crop load | High | Low | High | Very low | High | Low | High | Very low | |
| Date measured | 11 October 2018 | 10 October 2019 | 8 October 2020 | 5 October 2021 | 2 November 2018 | 7 November 2019 | 5 November 2020 | ||
| Irrigation treatment | |||||||||
| Control | 4.50 | 1.05a | 3.48a | 0.04 | 1.42 | 0.63a | 0.59 | Insufficientdata | |
| Deficit | 4.76 | 1.79b | 5.17b | 0.07 | 1.80 | 0.91b | 0.76 | ||
| P | 0.689 | 0.002 | 0.042 | 0.591 | 0.147 | 0.003 | 0.175 | ||
| ese | 0.45 | 0.07 | 0.40 | 0.04 | 0.18 | 0.03 | 0.07 | ||
| N treatment (N/tree) | |||||||||
| 1. 850 g | 6.13 | 1.85 | 4.51 | 0.06 | 1.88 | 0.88 | 0.70 | ||
| 2. 700 g | 4.17 | 1.67 | 4.10 | 0 | 1.46 | 0.71 | 0.60 | ||
| 3. 550 g | 4.40 | 1.48 | 4.44 | 0.04 | 1.88 | 0.85 | 0.75 | ||
| 4. 400 g | 4.13 | 1.15 | 4.41 | 0.03 | 1.12 | 0.73 | 0.67 | ||
| 5. 250 g B | 4.33 | 0.94 | 4.17 | 0.13 | 1.71 | 0.71 | 0.66 | ||
| P | 0.281 | 0.363 | 0.970 | 0.299 | 0.316 | 0.953 | 0.821 | ||
| ese | 0.72 | 0.35 | 0.50 | 0.04 | 0.28 | 0.20 | 0.09 | ||
| P interaction | 0.703 | 0.373 | 0.216 | 0.118 | 0.993 | 0.637 | 0.932 | ||
These results indicate that a factor in managing granulation is to ensure sufficient application of winter N. Our study suggests that the current recommendation of 800 g N/tree for mature trees is appropriate (Vock et al. 1997).
Flush growth and granulation relationships
Our data shows different patterns in Years 2, 3 and 4 for flush and granulation relationships at the individual twig level (Figs 4, 5 and 6). In Year 5, there were insufficient numbers of fruit remaining on tagged twigs at fruit maturity to allow analysis of associations between flush and granulation.
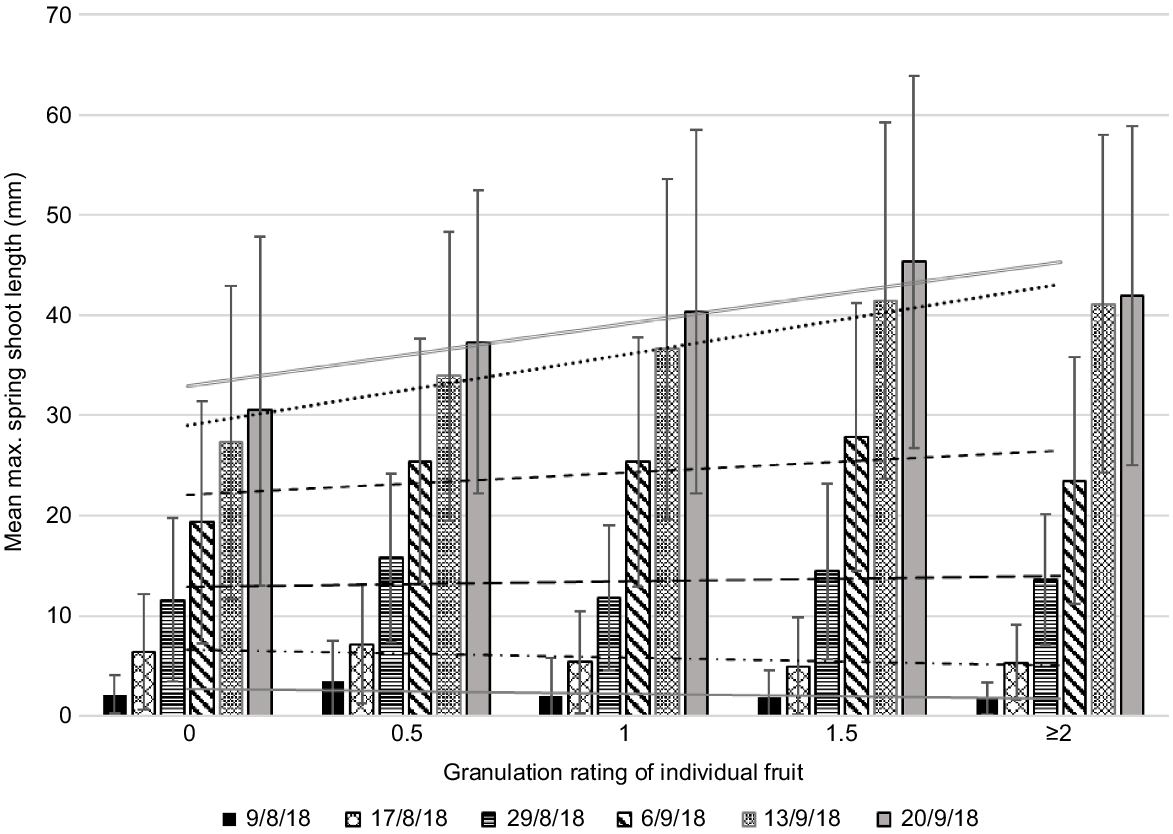
Mean maximum length of spring flush at six dates by rating of individual fruit in Year 2 (high crop load year). All treatments combined. Error bars show standard deviations. Fruit of different ratings may come from the same twig. Data includes zero values (i.e. where twigs set fruit but had no spring flush). The numbers of fruit in each category were 0 = 25, 0.5 = 41, 1 = 33, 1.5 = 24, ≥2 = 14 (total 137 fruit). Mean fruit diameter (mm) in each category for rating 0 = 49.5, 0.5 = 51.4, 1 = 52.2, 1.5 = 54.0, ≥2 = 57.4.
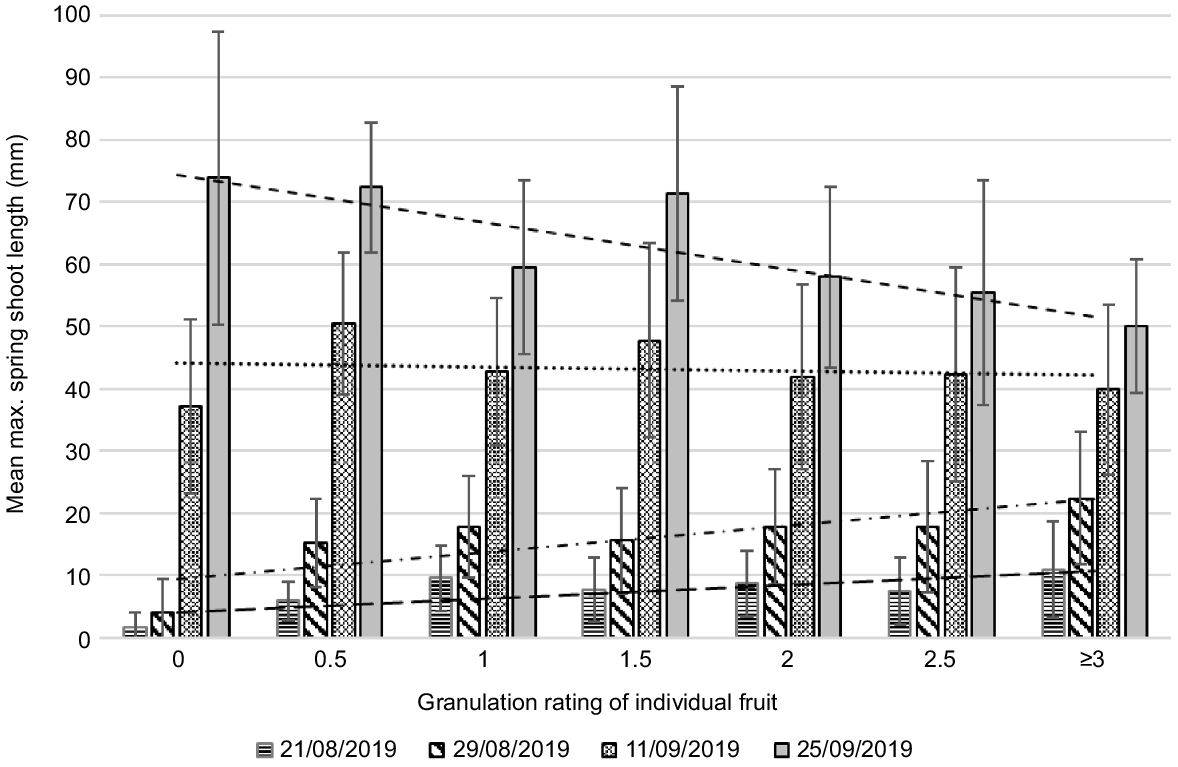
Mean maximum length of spring flush at four dates by rating of individual fruit in Year 3 (low crop load year). All treatments combined. Error bars show standard deviations. Fruit of different ratings may come from the same twig. Data includes zero values (i.e. where twigs set fruit but had no spring flush). The numbers of fruit in each category were 0 = 10, 0.5 = 13, 1 = 45, 1.5 = 22, 2 = 14, 2.5 = 8, ≥3 = 8 (total 120 fruit). Mean fruit diameter (mm) in each category for rating 0 = 48.6, 0.5 = 53.8, 1 = 55.7, 1.5 = 57.7, 2 = 58.3, 2.5 = 62.4, ≥3 = 57.4.
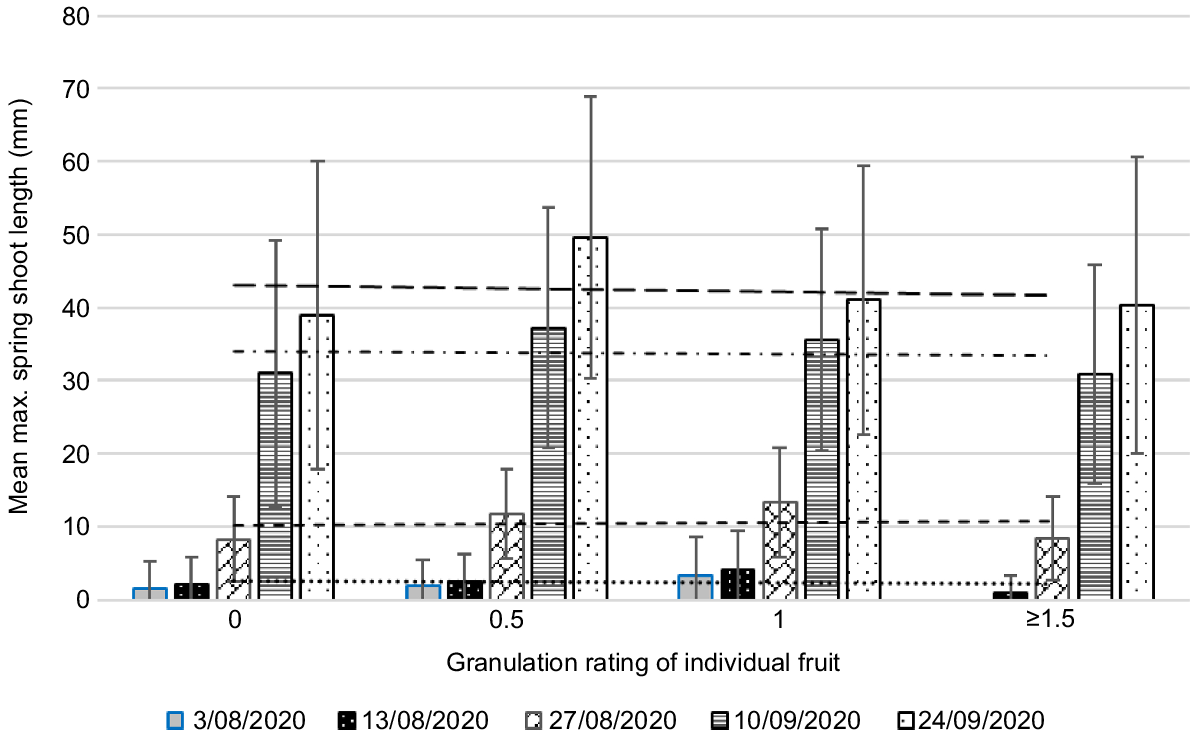
Mean maximum length of spring flush at five dates by rating of individual fruit in Year 4 (very high crop load year). All treatments combined. Error bars show standard deviations. Fruit of different ratings may come from the same twig. Data includes zero values (i.e. where twigs set fruit but had no spring flush). The numbers of fruit in each category were 0 = 21, 0.5 = 70, 1 = 93, ≥1.5 = 23 (total 207 fruit). The highest rating of fruit in this sample was 2 (two fruit). Mean fruit diameter (mm) in each category for rating 0 = 49, 0.5 = 52, 1 = 56, ≥1.5 = 59.
In Year 3, a low crop load year, there was a high incidence of granulation. Mean maximum flush length was higher than in high crop load years. Stronger early flush growth was associated with higher granulation ratings; stronger later flush was associated with lower granulation ratings (Fig. 5). We suggest that in low crop load years, carbohydrate and nutrient reserves in the tree have likely been depleted by the previous season’s large crop, so there is competition between fruit development and early flush growth. Later flush seems to support better fruit development. This may be because in low crop load years there are fewer fruit and more flush to supply carbohydrates to the lower numbers of fruit, once the flush matures (Goldschmidt and Golomb 1982).
In Years 2 and 4, both high crop load years, there was less granulation and mean maximum flush length was shorter than in the low crop load year. In Year 2, there appeared to be no detrimental effect of early flush growth but stronger later flush meant fruit were more granulated (Fig. 4). In Year 4, a very high crop load year, there appeared to be no association between granulation and flush growth at any measurement date (Fig. 6). Carbohydrate and nutrient reserves are known to accumulate in low crop years (Jones et al. 1975; Goldschmidt and Golomb 1982) and our results suggest that, in the subsequent high crop load years, these reserves are sufficient to support both early fruit development and spring flush growth. In addition, heavy flowering and fruit set suppresses flush growth, reducing potential competition. The observed detrimental effect of stronger later spring flush in Year 2 may be due to earlier depletion of reserves in that year.
The extent to which fruit set and new flush growth in citrus rely on carbohydrate reserves is under dispute, with some studies suggesting growth relies on current photosynthesis rather than stored resources (Kriedemann 1969; Monerri et al. 2011). However, our observations of the different patterns in low and high crop load years for granulation suggest that reserves play a significant part early in fruit development for Imperials. This reinforces the need for adequate application of winter N.
Treatment effects on spring flush growth and fruit set
The deficit irrigation treatment had a lower mean maximum spring flush length than the control in all years, and a lower mean number of spring flush shoots per tag in all years except Years 4 and 5 (Table 3). The data on fruit set for the irrigation treatments show an inverse pattern to flush growth, with the deficit treatment setting and retaining more fruit, although P values were high in Years 2 and 5 (P = 0.689 and 0.591, respectively, for October measurements) (Table 4). These results may mean that overirrigation, in fostering greater flush growth, exacerbates flush and fruit competition. However, data for overall granulation incidence were not fully aligned with these trends, with the deficit irrigation treatment only reducing granulation in some years, despite having shorter flush and setting more fruit in all years. Other factors, such as water availability to fruit, may have more influence on overall granulation incidence than flush competition.
The fruit set data for Years 2, 3 and 4 show a weak pattern of better early (October) fruit set from the higher N treatments, with variable plot means (P = 0.281, 0.363 and 0.970, respectively) (Table 4). However, the patterns of flush growth for N treatments differ with seasonal crop load. The higher N treatments had less maximum flush growth per twig than the lower N treatments when the seasonal crop load was low (Years 3 and 5) (P = 0.027 and 0.011, respectively) (Table 3). In high crop load years (Years 2 and 4), the trend is reversed, although variability was high (P = 0.680, 0.303, respectively). This was despite the pattern of reduced granulation from the higher N treatments in all years except Year 5. Thus the driving factor in N treatment differences is more likely to be crop load and its effects on reserves, rather than flush growth per se.
The flush and fruit set data show that variability in flush growth from twig to twig may explain some of the variability in granulation severity from fruit to fruit within the one tree but suggest that other factors such as crop load and water availability may be more important. Treatments that regulate flush growth, such as plant growth retardants, are worth further testing, but are likely to be less effective than managing crop load. Strategies to better manage crop load include fruit thinning, timely picking, preflowering drought stress and preflowering gibberellic acid sprays.
Possible role of juice cell water potential
The effectiveness of both irrigation and N treatments suggests that cell turgor and soluble solute concentrations may be key physiological factors underlying granulation. Turgor (or ‘hydrostatic potential’) and soluble solute concentration (or ‘osmotic potential’) are components of water potential, a measure of the free energy of water per unit volume, which drives water movement in plant cells. Juice cells in citrus fruit are not directly connected to the vascular system, so maintaining moisture content depends on low water potentials within the cell (Kaufmann 1970; Mantell et al. 1980). Low cell turgor and high levels of soluble solutes enable continuing water diffusion through permeable cell walls or channels in cell walls into juice vacuoles. Results from the current study are consistent with our earlier suggestion that granulation may be linked to relatively high water potential in juice cells, that is, to high cell turgor and low soluble solute concentrations (Hofman and Smith 2008).
Differences in cell water potential could be an explanation for the variability in granulation severity between seasons, between trees, between fruit within the one tree, and between vesicles within the one fruit. Cell turgor and solute concentration could differ at all these levels as a result of factors such as availability, competition, distribution patterns and transport efficiencies. Water potential could also be an explanation for many of the environmental and physiological conditions associated with granulation. For example, the association of granulation with vegetative vigour and mineral deficiencies could be explained by their detrimental effects on soluble solid content in juice cells. The associations with larger fruit size, rootstock vigour, coastal regions and higher rainfall could be explained by higher cell turgor. The associations of low crop loads and shaded positions in the canopy with granulation could be due to either or both components.
Conclusion
There was no interaction in any year between irrigation and N treatments for granulation means, even though these treatments influence flush growth and fruit set (Table 2). Although we have more statistical confidence in the differences in results from our irrigation treatments than our N treatments, the scale of improvements from the two factors in Years 1 and 2 were similar. We conclude that both irrigation and N applications need to be managed for optimum results.
Our results show that moisture availability (irrigation and rain), nitrogen nutrition, crop load and flush growth patterns are all factors influencing granulation incidence and severity; and that three key on-farm strategies to minimise granulation are to maintain high crop loads, reduce irrigation after flowering, and apply sufficient nitrogen in winter.
Data availability
The data that support this study will be shared upon reasonable request to the corresponding author.
Declaration of funding
We acknowledge in-kind funding for 2017/18 from the Department of Agriculture and Fisheries (Queensland Government) and Spencer Ranch Pty Ltd, and funding for the 2018/19 year from the Department of Agriculture and Fisheries, Spencer Ranch Pty Ltd, Seven Fields Citrus (Nutrano Pty Ltd) and the Mundubbera Fruit Growers Association Inc. Funding from 2019/20 to 2022/23 was from Hort Innovation, using the Hort Innovation citrus research and development levy, coinvestment from the Department of Agriculture and Fisheries, and contributions from the Australian Government. Hort Innovation is the grower-owned, not-for-profit research and development corporation for Australian horticulture.
Acknowledgements
We are grateful for trial site provision, collaboration and support provided by Craig Spencer and Will Thompson and staff, Spencer Ranch Pty Ltd.
References
Albrigo LG (1978) Rootstocks affect ‘Valencia’ orange fruit quality and water balance. Citrus Industry 59, 31-44.
| Google Scholar |
Awasthi RP, Nauriyal JP (1971) Studies on granulation in sweet orange (Citrus sinensis Osbeck): I. Effect of climate on granulation. Punjab Horticultural Journal 11, 6-14.
| Google Scholar |
Awasthi RP, Nauriyal JP (1972a) Studies on granulation in sweet orange (Citrus sinensis Osbeck). VI. Differences in moisture, total soluble solids and ascorbic acid content of juice vesicles in different stages of granulation. Indian Journal of Horticulture 12, 203-211.
| Google Scholar |
Awasthi RP, Nauriyal JP (1972b) Studies on granulation in sweet orange (Citrus sinensis Osbeck): IV. Physical characteristics of granulated and non-granulated fruits. Indian Journal of Horticulture 29, 40-44.
| Google Scholar |
Awasthi RP, Nauriyal JP (1972c) Studies on granulation in sweet orange (Citrus sinensis Osbeck): II. Effect of age, tree condition, tree aspect, fruit size, rootstock and tree variation on granulation. Journal of Research Punjab Agricultural University 10, 62-70.
| Google Scholar |
Awasthi RP, Nauriyal JP (1972d) Studies on nutritional status of trees and carbohydrates metabolism in relation to granulation in sweet orange (Citrus sinensis Osbeck). Indian Journal of Horticulture 29, 252-257.
| Google Scholar |
Bain JM (1958) Morphological, anatomical, and physiological changes in the developing fruit of the Valencia orange, Citrus sinensis (L) Osbeck. Australian Journal of Botany 6, 1-23.
| Crossref | Google Scholar |
Bartholomew ET, Sinclair WB, Turrell FM (1941) Granulation of Valencia oranges. Bulletin of the University of California College of Agriculture 647, 3-63.
| Google Scholar |
Chakrawar VR, Singh R (1977) Studies on citrus granulation: I. Physical and quality aspects of granulation. Haryana Journal of Horticultural Sciences 6, 128-131.
| Google Scholar |
Chapman JC (1986) Growth management of mature citrus with applied nitrogen. Acta Horticulturae 175, 173-178.
| Crossref | Google Scholar |
Erickson LC, Richards SJ (1955) Influence of 2,4-D and soil moisture on size and quality of Valencia oranges. Proceedings of the American Society for Horticultural Science 65, 109-112.
| Google Scholar |
Goldschmidt EE, Golomb A (1982) The carbohydrate balance of alternate-bearing citrus trees and the significance of reserves for flowering and fruiting. Journal of the American Society for Horticultural Science 107, 206-208.
| Crossref | Google Scholar |
Gravina A, Arbiza H, Telias A, Benzano F, D’Oliveira Flores V, Casanova S, Gambetta G (2004) Harvest date effect on fruit quality and return bloom in three citrus cultivars. In ‘Proceedings of the 10th International Citrus Congress’, Agadir, Morocco, 15–20 February 2004. pp. 284–290. (International Society of Citriculture: Riverside, CA, USA)
Jawanda JS, Uppal DK, Singh R, Arora JS (1978) Studies on granulation in citrus fruits. Punjab Horticultural Journal 18, 180-188.
| Google Scholar |
Jones WW, Embleton TW, Coggins CW, Jr (1975) Starch content of roots of ‘Kinnow’ mandarin trees bearing fruit in alternate years. HortScience 10, 514.
| Crossref | Google Scholar |
Kang C, Jiang A, Yang H, Zheng G, Wang Y, Cao J, Sun C (2022) Integrated physiochemical, hormonal, and transcriptomic analysis revealed the underlying mechanisms for granulation in Huyou (Citrus changshanensis) fruit. Frontiers in Plant Science 13, 923443.
| Crossref | Google Scholar | PubMed |
Kaufmann MR (1970) Water potential components in growing citrus fruits. Plant Physiology 46, 145-149.
| Crossref | Google Scholar | PubMed |
Kaur H, Aulakh PS, Kapur SP, Singh SN (1990) Effect of growth regulators and micronutrients on granulation and fruit quality of sweet orange cv. Jaffa. Punjab Horticultural Journal 30, 13-19.
| Google Scholar |
Kaur H, Chanana YR, Kapur SP (1991) Effect of growth regulators on granulation and fruit quality of sweet orange cv. Mosambi. Indian Journal of Horticulture 48, 224-227.
| Google Scholar |
Kriedemann PE (1969) 14C translocation in orange plants. Australian Journal of Agricultural Research 20, 291-300.
| Crossref | Google Scholar |
Malik MN, Akbar MJ, Ahmad I (1981) Granulation intensity in various citrus fruits and its response to different irrigation intervals. Journal of Agricultural Research, Pakistan 19, 135-140.
| Google Scholar |
Mantell A, Goldschmidt EE, Monselise SP (1980) Turnover of tritiated water in calamondin plants. Journal of the American Society for Horticultural Science 105, 741-744.
| Crossref | Google Scholar |
Martinez JM, Banuls J, Quinones A, Martin B, Primo-Millo E, Legaz F (2002) Fate and transformations of 15N labelled nitrogen applied in spring to Citrus trees. The Journal of Horticultural Science and Biotechnology 77, 361-367.
| Crossref | Google Scholar |
Monerri C, Fortunato-Almeida A, Molina RV, Nebauer SG, Garcia-Luis A, Guardiola JL (2011) Relation of carbohydrate reserves with the forthcoming crop, flower formation and photosynthetic rate, in the alternate bearing ‘Salustiana’ sweet orange (Citrus sinensis L.). Scientia Horticulturae 129, 71-78.
| Crossref | Google Scholar |
Ritenour MA, Albrigo LG, Burns JK, Miller WM (2004) Granulation in Florida citrus. Proceedings of the Florida State Horticultural Society 117, 358-361.
| Google Scholar |
Sharma RR, Saxena SK (2004) Rootstocks influence granulation in Kinnow mandarin (Citrus nobilis x C. deliciosa). Scientia Horticulturae 101, 235-242.
| Crossref | Google Scholar |
Sharma RR, Singh R, Saxena SK (2006) Characteristics of citrus fruits in relation to granulation. Scientia Horticulturae 111, 91-96.
| Crossref | Google Scholar |
Shomer I, Chalutz E, Vasiliver R, Lomaniec E, Berman M (1989) Scierification of juice sacs in pummelo (Citrus grandis) fruit. Canadian Journal of Botany 67, 625-632.
| Crossref | Google Scholar |
Singh R, Singh R (1980a) Effect of granulation on physical and chemical characters of the fruit of ‘Kaula’ mandarin. Indian Journal of Agricultural Science 50, 565-568.
| Google Scholar |
Singh R, Singh R (1980b) Relationship between granulation and nutrient status of Kinnow mandarin at different localities. Punjab Horticultural Journal 20, 134-139.
| Google Scholar |
Singh R, Singh R (1980c) Effect of irrigation frequency on granulation in Valencia Late sweet orange. Punjab Horticultural Journal 20, 36-38.
| Google Scholar |
Singh R, Singh R (1981) Effect of nutrient sprays on granulation and fruit quality of ‘Dancy tangerine’ mandarin. Scientia Horticulturae 14, 235-244.
| Crossref | Google Scholar |
Wang X-Y, Wang P, Qi Y-P, Zhou C-P, Yang L-T, Liao X-Y, Wang L-Q, Zhu D-H, Chen L-S (2014) Effects of granulation on organic acid metabolism and its relation to mineral elements in Citrus grandis juice sacs. Food Chemistry 145, 984-990.
| Crossref | Google Scholar | PubMed |