Growth and phosphorus uptake of faba bean and cotton are related to Colwell-P concentrations in the subsoil of Vertosols
T. I. McLaren A B E , M. J. Bell C , I. J. Rochester D , C. N. Guppy A , M. K. Tighe A and R. J. Flavel AA School of Environmental and Rural Science, University of New England, Armidale, NSW 2351, Australia.
B School of Agriculture, Food and Wine, University of Adelaide, Adelaide, SA 5064, Australia.
C Queensland Alliance for Agriculture and Food Innovation, University of Queensland, PO Box 23, Kingaroy, Qld 4610, Australia.
D CSIRO Plant Industry, Australian Cotton Research Institute, LB 59, Narrabri, NSW 2390, Australia.
E Corresponding author. Email: tim.mclaren@adelaide.edu.au
Crop and Pasture Science 64(8) 825-833 https://doi.org/10.1071/CP13025
Submitted: 16 January 2013 Accepted: 13 September 2013 Published: 29 October 2013
Journal Compilation © CSIRO Publishing 2013 Open Access CC BY-NC-ND
Abstract
Recent studies report low and variable phosphorus (P) fertiliser use efficiency (PUE) for cotton in the northern grains region (NGR) of eastern Australia. This may be due to cotton accessing P pools that are not currently tested for in the subsoil (10–30 cm) or variation in response to P source and placement strategy. Two glasshouse studies were used to investigate this, incorporating two soil P tests to assess readily and slowly available P pools (Colwell, and a dilute acid colloquially referred to as the BSES extractant), and five different P fertiliser placement strategies in the subsoil. Eighteen Vertosols were collected across southern to central Queensland in the NGR, and then used to grow faba bean (Vicia faba L.) and cotton (Gossypium hirsutum L.) sequentially in the same 28-L pot. Readily available P pools assessed by Colwell-P were of major importance for faba bean and cotton dry matter, as well as for tissue P concentrations. Cotton was less responsive to extractable subsoil P concentrations than faba bean, suggesting either greater internal PUE or improved ability to accumulate P under conditions of limited availability. We recommend that subsoil P fertilisation should occur before sowing faba bean to maximise PUE in a cotton–faba bean rotation. Faba bean and cotton both recovered more P when the subsoil was fertilised, but no individual P fertiliser placement strategy was superior. Phosphorus extracted using the BSES method was not correlated with faba bean or cotton dry matter or tissue P concentration over the single crop cycle. We also recommend that Colwell-P be measured in the topsoil and subsoil to understand the quantity of plant-available P in Vertosols of the NGR, and that further research is needed to describe the resupply of the readily available P pool from slowly available P pools during a single crop cycle.
Additional keywords: deep fertiliser placement, nutrient management, slowly available P, Vertisol, yield response.
Introduction
The farming systems of the northern grains region (NGR) of eastern Australia have historically received minimal phosphorus (P) fertilisation due to the high initial fertility of Vertosols, which are the dominant soil type used for cropping in the NGR (Hubble 1984). Over the past 30 years, P fertiliser use has increased 6-fold, due to the perceived decline in soil fertility in the NGR (Dorahy 2002; Rochester 2007). However, when P is applied in cotton systems, P fertiliser use efficiencies (PUE; the proportion of applied P recovered in biomass) (0–67%) have been unpredictable, and few studies have investigated why this is so (Dorahy et al. 2004). Consequently, some growers apply P fertiliser based on estimated crop P removal (~20 kg P/ha), rather than assessing the quantity of plant-available soil P (Dorahy et al. 2004; Rochester 2007).
The Colwell (1963) bicarbonate method is the main soil P test used to predict plant-available P in the NGR (Dorahy et al. 2004). Recent studies have suggested that soil sampling depth, fallow length, and mycorrhizal activity may result in an under- or over-estimation of plant-available P using the Colwell extractant (Dorahy 2002; Lester et al. 2008; Wang et al. 2007). Soil testing is usually carried out in the topsoil layer (0–10 cm), or in the mixed layer (0–30 cm) taken from the apex of irrigated cotton beds (Dorahy et al. 2004). However, subsoil moisture and the consequent exploitation of nutrients not routinely measured at depth may influence crop yield in the NGR, especially in zero-till dryland production systems. These deeper layers, particularly 10–30 cm, can supply a substantial amount of P for plant uptake (Wang et al. 2007). The overestimation of plant-available P in the topsoil is further exacerbated through the enrichment of the topsoil layer, caused by nutrient stratification from the subsoil to the topsoil by crops, and fertiliser application to the topsoil (Ma et al. 2009; Wang et al. 2009).
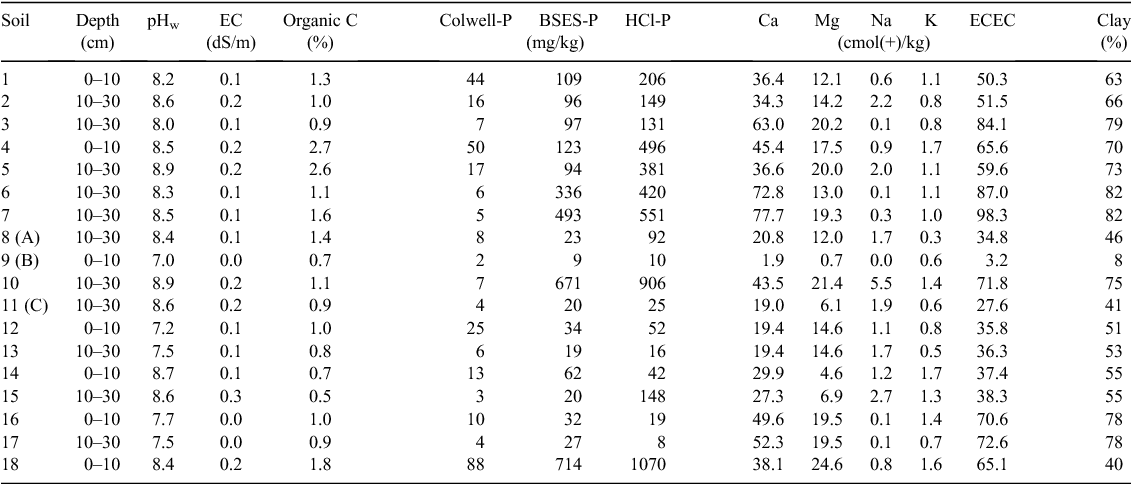
Vertosols contain large amounts of inorganic P, predominantly calcium (Ca) phosphates, which can be slowly released to the soil solution by dissolution (Pundarikakshudu 1989; Wang et al. 2007). A large proportion of this pool can be dissolved with dilute acids (e.g. the 0.005 m sulfuric acid method, known as the BSES extractant; Kerr and von Stieglitz 1938; Truog 1930), and this BSES-P is related to P extracted using 1 m HCl (data presented in Table 1). Predicting the amount of P this pool releases to the soil solution and the rate of supply is difficult. Wang et al. (2007) found a 50% decrease in the 1 m HCl soluble P pool (Hedley et al. 1982) over 18 crop cycles in one Vertosol from the NGR. Cotton, which has a large surface area for P absorption through arbuscular mycorrhizae (AM) symbiosis, may be ideally suited to take advantage of slowly available P dissolution (Wang et al. 2008).
Grain legumes are often grown as a rotational crop with cotton, and can provide a disease break and act as both a ‘cash’ crop and a way of improving soil nitrogen (N) levels before cotton planting (Bolland et al. 1999; Rochester 2007). Faba bean has been identified as a promising grain legume on the neutral to alkaline soils of the Western Australian grain belts, and is increasingly being used in the NGR (Bolland et al. 2000). However, the P requirements of faba bean have received little attention in the NGR. Current P fertiliser recommendations for faba bean are based on field trial studies from South Australia, where Colwell-P concentrations (critical Colwell-P of 26 mg P/kg) were measured in the topsoil (0–10 cm) layer from a variety of soil types (Reuter et al. 1995). Here, we investigate the importance of subsoil P pools for two agriculturally important crops in the NGR. The aims of this study were: (1) to understand the availability of subsoil P pools for faba bean and cotton under topsoil moisture-limiting conditions; and (2) to investigate the optimum P fertiliser placement strategy in the subsoil to improve PUE for faba bean and cotton under limited moisture in the topsoil.
Material and methods
Soil collection and sample preparation
Vertosols (Isbell 2002) were collected at 18 locations from southern and central Queensland in the NGR, and the collection included seven soils with a Colwell-P concentration of ≤6 mg P/kg before soil collection and preparation. The 18 soils included a wide variety of Vertosol suborders (Black, Brown, and Grey). Chemical and physical properties are shown in Table 1.
Site location and sampling depth (0–10 cm and/or 10–30 cm) were determined using preliminary soil P data from a pilot study investigating the available soil P status of the NGR. All but one of the soils were collected 12 months before use in the pot trials from fields that had recently grown cereal or legume crops, and were dried slowly. Soil 18 was collected 36 months earlier and stored in drums before use. Approximately 2000 kg of soil was collected from each location–soil depth, dried, and homogenised using a laboratory jaw crusher to produce an average aggregate size of 6 mm diameter. A subsample was collected at the time of potting up and ground using a rotary grinder to <2 mm for subsequent analysis. These soils were used as subsoils for the glasshouse studies. An additional Vertosol with a history of cotton and wheat production was sourced from Wee Waa, New South Wales. At this site, ~1000 kg of soil (0–30 cm) was collected, dried, and crushed using a Vickers Ruwolt rock crusher to <5 mm for subsequent plant growth. The Colwell-P and BSES-P concentrations of this soil were 25 and 185 mg P/kg, respectively, and the pH (1 : 5 soil : H2O) was 8.7. This soil was used as topsoil in the experiments.
Experimental design
Phosphorus response
To investigate the response of faba bean and cotton to subsoil P fertility, a glasshouse experiment using the 18 soils was conducted at the University of New England (UNE), Armidale, NSW. Treatments consisted of two P levels (0 and 40 mg P/kg applied as KH2PO4) in the subsoils (23 kg of subsoil in columns 70 cm tall), with three replicates in a randomised block design. The 18 soils received basal nutrients in powder form, and these were combined with the added P (where appropriate) and mixed thoroughly through the soil using a cement mixer. Basal nutrients included: potassium (K) as KNO3 (combined with KH2PO4 for +P treatments) to supply 200 mg K/kg soil; N as NH4NO3 and KNO3 (in +P treatments) to supply 200 mg N/kg soil; and sulfur (S) as CaSO4.2H2O to supply 37.5 mg S/kg soil. Faba bean was planted in May 2011 and was harvested 90 days later. The pots were then allowed to pass through a wetting and drying cycle. Basal nutrients were reapplied to the subsoil through the irrigation system, and cotton was planted on December 2011 and was harvested 60 days later.
Phosphorus placement
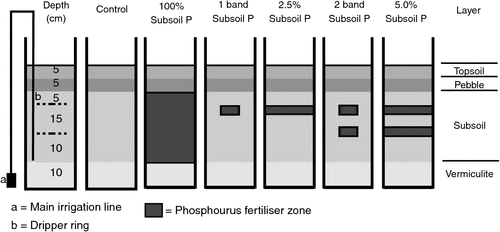
In a second glasshouse experiment, a subset of three soils was used to investigate P fertiliser placement and PUE (Table 1). Treatments consisted of two P levels (0 and 40 mg P/kg) at five different placement locations in the subsoil (Fig. 1), with three replicates in a randomised block design. Placement strategies for the added 40 mg P/kg soil were: (i) P mixed throughout the 23 kg of subsoil (100% soil volume); (ii) P placed in a single band 15 cm below the soil surface (<1%); (iii) P split equally between two bands (i.e. 20 mg P/kg in each band) placed 15 and 25 cm below the soil surface (<1%); (vi) P mixed in 0.58 kg of subsoil and distributed as a P-rich layer 15 cm below the soil surface (2.5%); and (v) P split between two ‘layers’ of 0.58 kg of subsoil (i.e. 20 mg P/kg in each) and placed 15 and 25 cm below the soil surface (5%). The 0 P treatment was used as a control for both glasshouse experiments, and basal nutrients were applied as described above.
|
Pot and irrigation design
In the NGR, soil P tests are usually conducted in the topsoil where moisture may become limiting for extended periods during the growing season, requiring plants to access moisture and nutrients from the subsoil. This environment was simulated using a unique pot and subsoil irrigation system (Fig. 1). A 22.5-cm-diameter polyvinyl chloride tube was cut into 70-cm lengths, and a galvanised iron plate was attached to the base. A subsoil irrigation system was installed using 13-mm polyethylene pipe situated down the side of the pot, and two perpendicularly joined dripper tubes (Landline 8; Netafim Australia Pty Ltd, Laverton North, Vic.) of diameter 0.4 cm, dripper spacing 15 cm, with three drippers per ring, and a maximum flow rate per dripper of 8.19 L/h, forming two rings in the subsoil layer. The 13-mm pipe protruded down the outside of the pot to a 25-mm main irrigation line situated at the base of the pot and connected to the tap. This distributed the water evenly to each pot. Rainwater containing negligible amounts of P, K, and S was used for irrigation. At the start of the irrigation system, a root inhibitor (Tech filter, Netafim) containing minute traces of trifluralin was used to minimise dripper blockages without affecting the bulk soil. The pots were then partitioned into four sections (Fig. 1), including: (i) a 10-cm layer of vermiculite to minimise water logging; (ii) a 23-kg subsoil layer containing the experimental treatments and subsoil irrigation; (iii) a 5-cm pebble layer (0.5 cm diameter) to prevent water movement from the subsoil to the topsoil; and (iv) a 5-cm topsoil layer for plant establishment. A fertiliser band of NH4H2PO4 containing 6 mg P/kg was placed 3 cm below the topsoil surface to mimic field planting conditions and set crop yield potential.
Agronomy and harvest
Faba bean was chosen as the initial crop in the sequence to: investigate the ability of faba bean to take up subsoil P; simulate common legume–cotton rotations in the NGR; and ensure the presence of AM for cotton production (Rochester 2007; Thompson 1987). Four faba bean seedlings that had been germinated in a growth cabinet at 23°C for 4 days were planted into the topsoil layer 2 cm below the soil surface. Water was added manually to the topsoil to prevent the seedlings from drying out and ensure good establishment. The two smallest seedlings were removed after 4 weeks when manual watering was ceased to allow the topsoil to dry out. From that point, only subsoil irrigation was used to maintain soil moisture between field capacity (FC) and permanent wilting point (PWP). The pebble layer prevented water movement from the subsoil to the topsoil, which could be seen to crack on drying. Glasshouse temperatures were maintained at 22/15°C (day/night).
Basal nutrients were re-applied through the irrigation water before sowing cotton. These included dissolved K and S as K2SO4 (to supply 200 mg K and 37.5 mg S/kg), and N as NH4NO3 (to supply 200 mg N/kg).
Six cotton seedlings that had been germinated in a growth cabinet at 23°C for 4 days were planted into the topsoil layer 2 cm below the soil surface. Water was added manually to the topsoil to prevent the seedlings from drying out and ensure good establishment. The four smallest cotton seedlings were removed 4 weeks after plant establishment when manual watering was ceased to allow the topsoil to dry out. The cotton was irrigated as for the faba beans. The glasshouse temperature was maintained at 30/20°C (day/night).
Faba bean and cotton plant shoots were harvested during early pod- and boll-fill, respectively, and dried in an oven at 60°C for 7 days. After drying, plant samples were weighed to determine dry matter (DM), then ground using a rotor cross beater grinder (Retsch, Haan, Germany) to pass through a 1-mm sieve, and homogenised before elemental analysis using sealed chamber digestion (SCD) (faba bean) and portable X-ray fluorescence (PXRF) (cotton). The DM and tissue P concentration were reported separately to determine whether tissue P concentrations were correlated with DM, and also to minimise the impact of errors in DM estimation due to variability in radiation intensity across the glasshouse. The DM was multiplied by the plant tissue P concentration to assess the differences between cotton and faba bean to utilise soil P (see Eqn 2 in Statistical analyses).
Soil and plant analysis
Soil
All chemical and physical properties of the soils used in this study were carried out on soil samples obtained from the pilot study. Soils used in this study were collected at the same location as the soils used in the pilot study, using geo-references. Soil analyses included pH (method 4A1), electrical conductivity (EC) (method 3A1), total organic carbon (C) (method 6B3), Colwell-P (method 9B1), BSES-P (method 9G1), and effective cation exchange capacity (ECEC) (method 15A1) as described by Rayment and Lyons (2011). The quantity of HCl-P was measured as described by Guppy et al. (2000); and clay was measured as cited by Thorburn and Shaw (1987).
Plant phosphorus
Faba bean material was digested according to Anderson and Henderson (1986) and subsequently analysed via inductively coupled plasma-optical emission spectroscopy.
A Bruker Tracer III-V PXRF with associated software (Bruker X-rayOps, S1PXRF 3.8.30 and Spectra 7.2.1.1) (Bruker Biosciences Corp., Billerica, MA, USA) was used to determine total plant P concentrations for all cotton plant samples according to McLaren et al. (2012). Briefly, 1.0 g of each sample was weighed into 5-mL cylindrical polyethylene containers. The containers were then sealed with a 7.6 cm by 4.0 cm rectangular sheet of 1.5-µm Mylar® X-ray polyethylene film and secured with a 2 cm rubber band. Each sample was scanned for 120 s in triplicate at 15 keV and 33 µA using helium gas and a vacuum. Each replicate scan was repositioned slightly on the PXRF window to obtain a better representation of the bulk sample.
Statistical analyses
All statistical modelling and regression analyses were conducted using R 2.10.1 (R Development Core Team 2005), except for the placement trial, which used an analysis of variance (ANOVA) carried out using JMP software (SAS Institute 2012). The ANOVA was conducted to separate means between 0 and P (including placement) treatments for faba bean and cotton DM, and tissue P concentration (at P = 0.05). The blocking factor was significant and was retained in the model. Normality and variance homogeneity assumptions of the ANOVA model used were met and significant differences between means were determined using Student’s test.
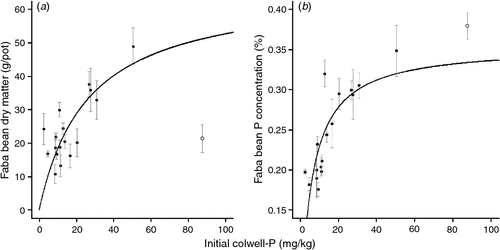
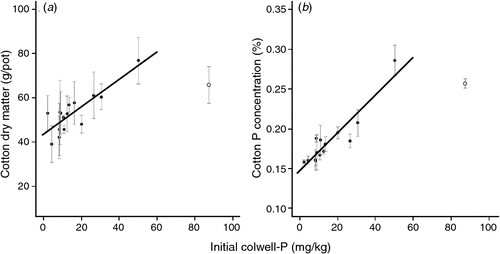
A Michaelis–Menten non-linear regression was used to model the relationship between faba bean DM and tissue P concentration. This model was chosen as the best fit from several non-linear regression types based on visual inspection. A simple linear regression was used to model cotton DM and tissue P concentration, and relative faba bean and cotton P uptake. A simple linear regression was chosen as the ‘best fit’ from several linear and non-linear models. The regression was used as an approximate indication of the relationship between cotton DM and tissue P concentration v. initial Colwell-P, as the model assumptions were not valid due to non-normally distributed residuals. Cotton DM, tissue P concentration, and P uptake v. initial BSES-P were also examined, but no suitable model was found to fit the data (data not shown). Equations describing the Michaelis–Menten non-linear model (Eqn 1) and relative P uptake (Eqn 2) are as follows:

where y is faba bean DM (g) or tissue P concentration (%), and x is initial Colwell-P (mg/kg);

where y is relative P uptake (%), a is mean P uptake from nil P treatments (mg/kg), and b is mean P uptake from added P treatments (mg/kg).
Results
Faba bean
There was a curvilinear relationship between initial Colwell-P concentration and faba bean DM and P concentration using a Michaelis–Menten non-linear regression (Fig. 2). There were insufficient sites with high Colwell-P concentrations (>25 mg P/kg) to establish an asymptote. There was no relationship between faba bean DM or tissue P concentration and initial BSES-P (data not shown).
|
Cotton
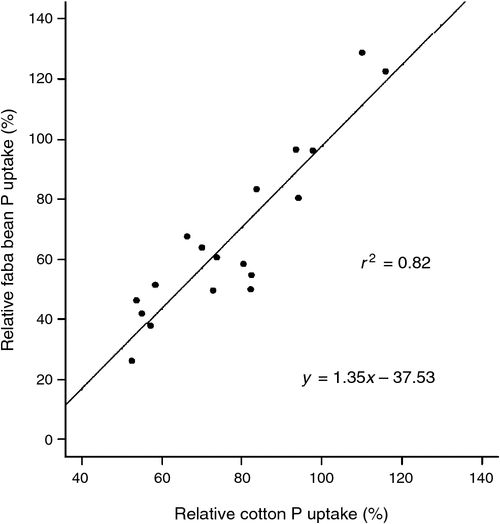
There was a linear relationship between initial Colwell-P and cotton DM and initial Colwell-P and tissue P concentration (Fig. 3). There were insufficient sites with high Colwell-P concentrations (>25 mg P/kg) to establish any curvature or asymptote. There was no relationship between cotton DM or tissue P concentration and initial BSES-P (mg/kg). There was a strong correlation between relative faba bean P uptake and relative cotton P uptake (Fig. 4).
|
|
Phosphorus fertiliser placement
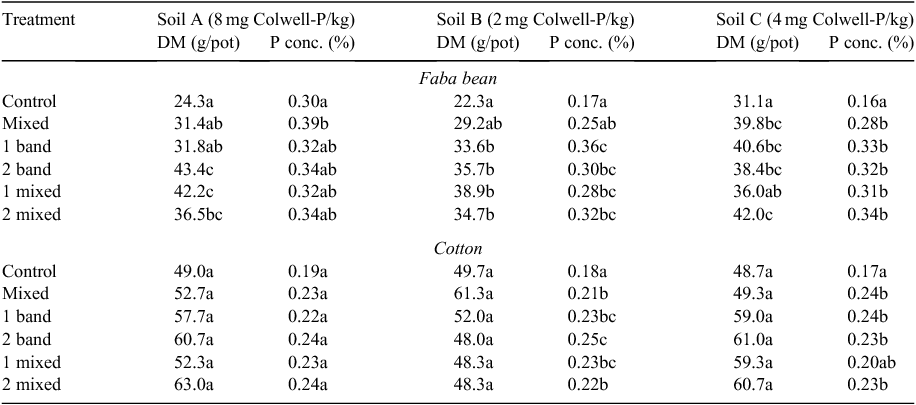
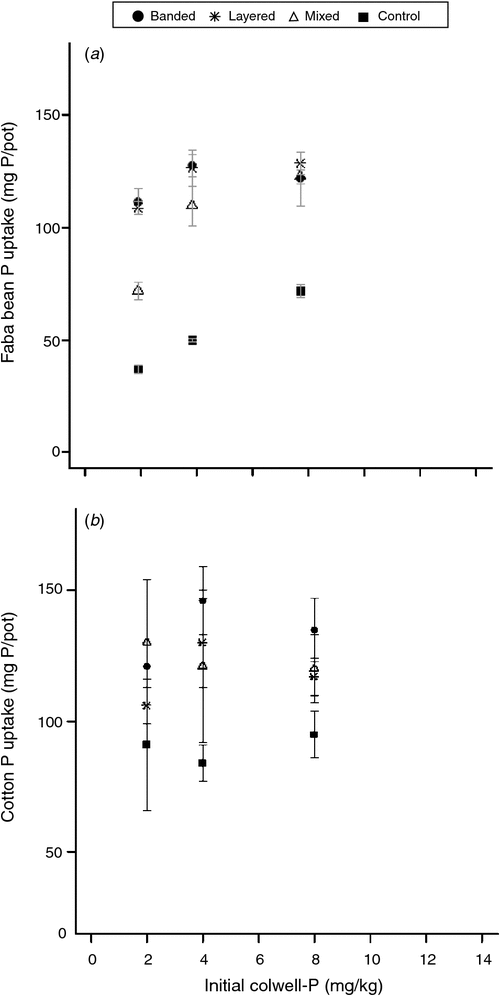
Generally, faba bean DM and tissue P concentration significantly increased for most of the P fertiliser placements compared with the control for all soils, although tissue P concentration in soil A was an exception (Table 2). There was no one fertiliser placement among the placement strategies tested that was superior in terms of increasing faba bean DM and tissue P concentration across all soils. Accumulation of P in faba bean was more responsive to applied P than in cotton (Fig. 5). The large soil P enrichment treatment (mixed) was not as effective in supplying P to faba bean as the more concentrated P fertiliser treatments (banded and mixed) when Colwell-P concentrations were low (2 and 4 mg P/kg) (Fig. 5a). However, in the soil where Colwell-P was highest (soil A, 8 mg P/kg) the large-volume P enrichment was able to provide sufficient P for faba bean such that P uptake was equivalent for all P fertiliser placement strategies.
|
|
Cotton DM did not significantly increase at any P fertiliser placement (P > 0.05) for any soils tested (Table 2). However, there were significant increases in cotton tissue P concentration for two of the three soils used, with soil A again the exception (Table 2). When a significant increase in tissue P concentration was observed, there was no one fertiliser placement among the placement strategies that was superior at improving tissue P concentration across all soils (Table 2 and Fig. 5b).
Generally, there was a high level of variability between replicates for cotton, and to a lesser extent faba bean. Water was maintained between FC and PWP for all pots, and no wilting symptoms were observed. However, a decreasing biomass gradient was observed from the south-eastern to north-western corner of the glasshouse bay, which was probably related to the orientation of the glasshouse and incident radiation. It is likely that solar radiation was a confounding environmental variable, not captured by the blocking factor, increasing the variance within treatments and reducing the precision of the experiment. The soil that was identified as an outlier in Figs 2 and 3 was not included in the statistical analysis because the crop was visually poor, possibly caused by the long-term storage (>3 years) of the soil and thus reduced biological activity (Thompson 1987).
Discussion
Faba bean and cotton response to subsoil Colwell-phosphorus
Faba bean and cotton DM were positively related to Colwell-P concentrations in the subsoil. The increase in DM corresponded with tissue P concentrations for both crops; thus, subsoil P availability affected crop DM yield. Crop access to soil P can be significantly reduced in the topsoil layer of Vertosols as rainfall is infrequent and high soil evaporation prevails (Wang et al. 2009). However, these dry topsoils may not impact on growth or yield due to reliance on stored soil moisture and nutrients in the subsoil (Wang et al. 2009). Studies by Wang et al. (2009) found that cotton tissue P concentrations greatly improved when P was applied to the subsoil compared with topsoil applications. This may compromise the ability of current soil sampling strategies based on the topsoil layer to accurately predict plant-available P in cotton soils, especially in rainfed cropping systems (Wang et al. 2007, 2009).
In this study we demonstrate the positive relationship between subsoil Colwell-P concentrations and crop DM and tissue P concentrations under topsoil moisture-limiting conditions. In the field, however, the depth of soil moisture limitations may differ from what we define as topsoil (i.e. 0–10 cm), as factors such as clay content, organic matter, and ground cover affect soil moisture distribution and retention (Ma et al. 2009; Wang et al. 2009). Similarly, root distribution down the profile will vary with species and seasonal rainfall patterns. Studies by Alston (1980) found that wheat did not benefit from subsoil P applications when high topsoil P concentrations were combined with adequate topsoil moisture during early growth stages. Therefore, it may be difficult to accurately predict the relative proportions of plant-available P from two defined layers given the uncertainty around the availability of topsoil P from year to year (Wang et al. 2009). Nevertheless, assessing plant-available P in cotton systems should include separate topsoil and subsoil Colwell-P measurements, with greater emphasis on subsoil Colwell-P concentrations under rainfed conditions or when irrigation is limited.
Vertosol soils contain high amounts of Ca phosphates (both native and fertiliser reaction products) (Wang et al. 2007). It is unknown to what extent this pool may buffer or replenish the soil solution, but the lack of correlation between faba bean or cotton P uptake and various measures of these slow-release pools reflects the difficulty of incorporating a large, slowly available P pool in assessing plant-available P over short durations (Thomas and Peaslee 1973). The BSES method is proving a useful predictor for the form and availability of the slowly available P pool in Vertosols (McLaren et al. 2013). However, the quantity of slowly available P measured by the BSES extractant may not be useful for assessing plant-available P during a single growing cycle (McLaren et al. 2013). We suggest that monitoring the shift in BSES-P concentrations over several crop cycles may improve our understanding of the contribution of slowly available P for plant uptake.
Phosphorus fertiliser placement
Plants have a variety of mechanisms that respond to soil P limitations and/or enriched soil P zones, including: (i) increased root surface area through AM symbiosis; (ii) soil phosphate solubilisation through root exudation; (iii) a plant physiological response to increase P uptake in the enriched zone; and (iv) root proliferation in response to soil P enrichment (Ma et al. 2009; Richardson et al. 2009; Wang et al. 2008). It is likely that some or all of these mechanisms were being utilised by the two crops, thus obtaining sufficient P from either the fertiliser or the subsoil layer.
Faba bean was more responsive to applied P than cotton, demonstrating that the most efficient use of P fertiliser would be to apply before sowing faba beans in a cotton–faba bean rotation (Fig. 4). At low Colwell-P concentrations (<8 mg P/kg), faba bean P uptake was higher when P fertiliser was placed in a highly concentrated zone (i.e. layered, 5% soil P enrichment; or banded, <5% soil P enrichment) compared with the treatment where the whole subsoil volume was enriched (i.e. mixed). The significance of this is that increasing the volume of soil exposed to fertiliser P may not significantly increase the amount of P fertiliser taken up by this crop species.
Cotton is well adapted to low soil-P environments, and can obtain sufficient P from the bulk soil at relatively low Colwell-P concentrations (Dorahy et al. 2004, 2008). The lack of difference between soil P enrichment treatments and cotton P uptake demonstrates that cotton can obtain sufficient P from the bulk soil regardless of P-fertiliser application strategy but also responds to small changes in solution P concentration very efficiently, as evidenced by similar responses from all placement strategies irrespective of initial Colwell-P status, possibly due to the root–AM complex (Wang et al. 2008). The dependence of cotton on mycorrhizal symbiosis for P uptake is known to increase as the P fertility of the soil decreases (Pugh et al. 1981). This becomes important when available P levels fall below 20 mg/kg (Olsen-P) and compensatory reliance on mycorrhizal infection is considerable (Price et al. 1989). Our study supports Dorahy et al. (2004), who found that cotton was largely unresponsive to applied P above Colwell-P concentrations of 6 mg P/kg. However, it should be noted the lack of cotton response to applied P was measured using banded P applications, and the results from the current study suggest that cotton roots do not respond readily to banded applications. Consequently, it is possible that strong treatment differences were not observed in the current study because of adequate Colwell-P concentrations (~6 mg P/kg) in the subsoil layer. It is also likely that soil Colwell-P concentrations increased following soil collection and preparation and after the faba bean crop caused by: (i) the release of P from mineralised organic sources induced by soil drying (Sparling et al. 1985); and (ii) the excretion of organic anions from the faba bean crop mobilising P in the rhizosphere, and the subsequent release of P from decomposing roots (Pierret et al. 1999; Hinsinger et al. 2009).
Increases in cotton tissue P concentrations in two of the three soils demonstrate increased cotton P uptake with subsoil P fertilisation. Previous studies (Dorahy et al. 2008) have found that cotton P uptake was primarily sourced from outside the fertiliser band, which suggests that maintaining labile P reserves throughout the crop root-zone will be important to supplying adequate P to the crop. However, our results suggest that those reserves need not be high for cotton. Even at low Colwell-P concentrations in the subsoil, cotton was able to acquire most of its P from the bulk soil, with applied P fertiliser increasing P uptake by ~40%. In contrast, faba bean was not efficient at extracting P from subsoils with low available P, as P uptake from applied fertiliser increased from ~80% of plant P at Colwell-P of 8 mg P/kg to 170% at Colwell-P of 2 mg P/kg. It may be concluded that faba bean, compared with cotton, has a higher threshold solution P concentration below which it cannot access P efficiently (Fig. 5). A difference in threshold P concentrations may account for the lower P uptake of faba bean where P was mixed throughout the profile, as solution P concentrations may not have been raised high enough in the low Colwell-P soil to pass this threshold (Fig. 5).
The response by cotton to applied P fertiliser was small and often statistically non-significant. Part of the reason for this may have been the differences in radiation across the glasshouse and the impracticability of regular re-randomisation of large pots within treatment blocks in this experiment. However, with cotton following after the initial faba bean crop, we were unable to ascertain the impact of labile P that may have been released from mineralised organic sources induced by soil wetting and drying, faba bean excretion of organic anions mobilising P in the rhizosphere, and the subsequent release of P from decomposing roots, and these aspects need further investigation (Sparling et al. 1985; Pierret et al. 1999; Hinsinger et al. 2009). Despite this, the lack of P response by cotton in soil A was consistent with the reports by Dorahy et al. (2004), and it suggests that the Colwell-P in this subsoil would only have been marginal at worst for cotton growth and yield.
Conclusion
Few studies have investigated subsoil P pools and their availability for plant uptake in the Vertosols of the NGR. This study demonstrates the importance of measuring Colwell-P in the subsoil, and that it is positively related to faba bean and cotton DM and tissue P concentrations. Faba bean response to applied P was greater than cotton, and no one P fertiliser placement strategy was superior for both crops. In low Colwell-P environments, high P-concentration fertiliser application strategies (bands) improved faba bean P uptake compared with treating a large volume of soil with P fertiliser.
A limitation to this study was the high proportion of Vertosols containing high BSES-Ca/P ratios (>74 : 1), suggesting that the slowly available P pool would not be influential in buffering or replenishing the soil solution (McLaren et al. 2013). Further research is needed to understand the importance of slowly available P pools over several cropping cycles in the Vertosols of the NGR.
Acknowledgements
Financial support from the Cotton Catchment Communities Cooperative Research Centre (Cotton CRC, project 1.03.44) is greatly acknowledged. Thanks are also extended to Mr Michael Faint, Mrs Leanne Lisle, Mr David Lester, Mr Peter Want, and Mr Laurie Smith for technical assistance. The authors greatly appreciate the primary producers located in the NGR who supplied soil for this experiment.
References
Alston A (1980) Response of wheat to deep placement of nitrogen and phosphorus fertilizers on a soil high in phosphorus in the surface layer. Australian Journal of Agricultural Research 31, 13–24.| Response of wheat to deep placement of nitrogen and phosphorus fertilizers on a soil high in phosphorus in the surface layer.Crossref | GoogleScholarGoogle Scholar | 1:CAS:528:DyaL3cXhsVGkt7o%3D&md5=faed506531b9ed1f2f766b56f4fc3616CAS |
Anderson DL, Henderson LJ (1986) Sealed chamber digestion for plant nutrient analysis. Agronomy Journal 78, 937–939.
| Sealed chamber digestion for plant nutrient analysis.Crossref | GoogleScholarGoogle Scholar | 1:CAS:528:DyaL28XlvVOisrk%3D&md5=07282cf976a063652fdc2fc742ccc4faCAS |
Bolland MDA, Siddique KHM, Loss SP, Baker MJ (1999) Comparing responses of grain legumes, wheat and canola to applications of superphosphate. Nutrient Cycling in Agroecosystems 53, 157–175.
| Comparing responses of grain legumes, wheat and canola to applications of superphosphate.Crossref | GoogleScholarGoogle Scholar |
Bolland MDA, Siddique KHM, Brennan RF (2000) Grain yield responses of faba bean (Vicia faba L.) to applications of fertiliser phosphorus and zinc. Australian Journal of Experimental Agriculture 40, 849–857.
| Grain yield responses of faba bean (Vicia faba L.) to applications of fertiliser phosphorus and zinc.Crossref | GoogleScholarGoogle Scholar | 1:CAS:528:DC%2BD3cXnvVeqsbg%3D&md5=5efac03e5745f028bf2ac7f66e311e1eCAS |
Colwell JD (1963) The estimation of the phosphorus fertilizer requirements of wheat in southern New South Wales by soil analysis. Australian Journal of Experimental Agriculture and Animal Husbandry 3, 190–197.
| The estimation of the phosphorus fertilizer requirements of wheat in southern New South Wales by soil analysis.Crossref | GoogleScholarGoogle Scholar | 1:CAS:528:DyaF2cXnvVOhsQ%3D%3D&md5=f8483c002701cb0667a8852dd419f4b9CAS |
Dorahy CG (2002) Determining the phosphorus requirement of cotton (Gossipium hirsutum L.) grown on alkaline soils in eastern Australia. PhD Thesis, University of New England, Armidale, NSW, Australia.
Dorahy CG, Rochester IJ, Blair GJ (2004) Response of field-grown cotton (Gossypium hirsutum L.) to phosphorus fertilisation on alkaline soils in eastern Australia. Australian Journal of Soil Research 42, 913–920.
| Response of field-grown cotton (Gossypium hirsutum L.) to phosphorus fertilisation on alkaline soils in eastern Australia.Crossref | GoogleScholarGoogle Scholar | 1:CAS:528:DC%2BD2cXhtVOqsLbM&md5=dfa759a010b5959a844398a0129b4bf3CAS |
Dorahy CG, Rochester IJ, Blair GJ, Till AR (2008) Phosphorus use-efficiency by cotton grown in an alkaline soil as determined using 32phosphorus and 33phosphorus radio-isotopes. Journal of Plant Nutrition 31, 1877–1888.
| Phosphorus use-efficiency by cotton grown in an alkaline soil as determined using 32phosphorus and 33phosphorus radio-isotopes.Crossref | GoogleScholarGoogle Scholar | 1:CAS:528:DC%2BD1cXht1arur7P&md5=bcc885a24769f6b237948ff6d2f8f231CAS |
Guppy CN, Menzies NW, Moody PW, Compton BL, Blamey FPC (2000) A simplified, sequential, phosphorus fractionation method. Communications in Soil Science and Plant Analysis 31, 1981–1991.
| A simplified, sequential, phosphorus fractionation method.Crossref | GoogleScholarGoogle Scholar | 1:CAS:528:DC%2BD3cXmvVGlsb4%3D&md5=9112d53e774f17e0a012f01ac01c72afCAS |
Hedley MJ, Stewart JWB, Chauhan BS (1982) Changes in inorganic and organic phosphorus fractions induced by cultivation practices and by laboratory incubations. Soil Science Society of America Journal 46, 970–976.
| Changes in inorganic and organic phosphorus fractions induced by cultivation practices and by laboratory incubations.Crossref | GoogleScholarGoogle Scholar | 1:CAS:528:DyaL3sXjvFCl&md5=870c17fb14e5c1eaa1c196fc3888747bCAS |
Hinsinger P, Bengough AG, Vetterlein D, Young IM (2009) Rhizosphere: biophysics, biogeochemistry and ecological relevance. Plant and Soil 321, 117–152.
| Rhizosphere: biophysics, biogeochemistry and ecological relevance.Crossref | GoogleScholarGoogle Scholar | 1:CAS:528:DC%2BD1MXos1enu78%3D&md5=f45d1f06d521c2c3a4bc48fc03d7713bCAS |
Hubble GD (1984) The cracking clay soils: definition, distribution, nature, genesis and use. In ‘The properties and utilization of cracking clay soils’. (Eds JW McGarity, EH Hoult, HB So) pp. 3–13. (University of New England: Armidale, NSW)
Isbell RF (2002) ‘The Australian Soil Classification.’ Revised edn (CSIRO Publishing: Melbourne)
Kerr HW, von Stieglitz CR (1938) ‘The laboratory determination of soil fertility.’ (Bureau of Sugar Experiment Stations: Brisbane, Qld)
Lester DW, Birch CJ, Dowling CW (2008) Fertiliser N and P applications on two vertosols in north-eastern Australia. 1. Comparative grain yield responses for two different cultivation ages. Australian Journal of Agricultural Research 59, 247–259.
| Fertiliser N and P applications on two vertosols in north-eastern Australia. 1. Comparative grain yield responses for two different cultivation ages.Crossref | GoogleScholarGoogle Scholar | 1:CAS:528:DC%2BD1cXjtVKjtL8%3D&md5=ce129e23616188a358f47bfc1575779fCAS |
Ma Q, Rengel Z, Rose T (2009) The effectiveness of deep placement of fertilisers is determined by crop species and edaphic conditions in Mediterranean-type environments: a review. Australian Journal of Soil Research 47, 19–32.
| The effectiveness of deep placement of fertilisers is determined by crop species and edaphic conditions in Mediterranean-type environments: a review.Crossref | GoogleScholarGoogle Scholar |
McLaren TI, Guppy CN, Tighe MK (2012) A rapid and non-destructive plant nutrient analysis using portable X-ray fluorescence. Soil Science Society of America Journal 76, 1446–1453.
| A rapid and non-destructive plant nutrient analysis using portable X-ray fluorescence.Crossref | GoogleScholarGoogle Scholar | 1:CAS:528:DC%2BC38XhtFarsbjK&md5=331d04094df509bc8d274d5d5d1286a8CAS |
McLaren TI, Guppy CN, Tighe MK, Moody PW, Bell M (2013) Dilute acid extraction is a useful indicator of the supply of slowly available phosphorus in Vertisols. Soil Science Society of America Journal
| Dilute acid extraction is a useful indicator of the supply of slowly available phosphorus in Vertisols.Crossref | GoogleScholarGoogle Scholar |
Pierret A, Moran CJ, Pankhurst CE (1999) Differentiation of soil properties related to the spatial association of wheat roots and soil macropores. Plant and Soil 211, 51–58.
| Differentiation of soil properties related to the spatial association of wheat roots and soil macropores.Crossref | GoogleScholarGoogle Scholar | 1:CAS:528:DyaK1MXnt1Krtb0%3D&md5=a9b4dff806da5de6b5d3ab826560eb1fCAS |
Price NS, Roncadori RW, Hussey RS (1989) Cotton root growth as influenced by phosphorus nutrition and vesicular-arbuscular mycorrhizas. New Phytologist 111, 61–66.
| Cotton root growth as influenced by phosphorus nutrition and vesicular-arbuscular mycorrhizas.Crossref | GoogleScholarGoogle Scholar |
Pugh LM, Roncadori RW, Hussey RS (1981) Factors affecting vesicular-arbuscular mycorrhizal development and growth of cotton. Mycologia 73, 869–879.
| Factors affecting vesicular-arbuscular mycorrhizal development and growth of cotton.Crossref | GoogleScholarGoogle Scholar |
Pundarikakshudu R (1989) Studies of the phosphate dynamics in a Vertisol in relation to the yield and nutrient uptake of rainfed cotton. Experimental Agriculture 25, 39–45.
| Studies of the phosphate dynamics in a Vertisol in relation to the yield and nutrient uptake of rainfed cotton.Crossref | GoogleScholarGoogle Scholar |
R Development Core Team (2005) ‘R: A language and environment for statistical computing.’ (R Foundation for Statistical Computing: Vienna)
Rayment GE, Lyons DJ (2011) Phosphorus. In ‘Soil chemical methods—Australasia.’ (CSIRO Publishing: Melbourne)
Reuter DJ, Dyson CB, Elliott DE, Lewis DC, Rudd CL (1995) An appraisal of soil phosphorus testing data for crops and pastures in South Australia. Australian Journal of Experimental Agriculture 35, 979–995.
| An appraisal of soil phosphorus testing data for crops and pastures in South Australia.Crossref | GoogleScholarGoogle Scholar | 1:CAS:528:DyaK28Xhs1yhsr4%3D&md5=378d95aa47687662f0d2bbc13c59155dCAS |
Richardson AE, Hocking PJ, Simpson RJ, George TS (2009) Plant mechanisms to optimise access to soil phosphorus. Crop & Pasture Science 60, 124–143.
| Plant mechanisms to optimise access to soil phosphorus.Crossref | GoogleScholarGoogle Scholar | 1:CAS:528:DC%2BD1MXitlyrs7s%3D&md5=b89d3512cf5612f00b3e6f953863de94CAS |
Rochester IJ (2007) Nutrient uptake and export from an Australian cotton field. Nutrient Cycling in Agroecosystems 77, 213–223.
| Nutrient uptake and export from an Australian cotton field.Crossref | GoogleScholarGoogle Scholar | 1:CAS:528:DC%2BD2sXitFKms7o%3D&md5=e33eb4d577754f983d1b28553a3e987aCAS |
SAS Institute (2012) ‘JMP Version 10.’ (SAS Institute Inc.: Cary, NC)
Sparling G, Whale K, Ramsay A (1985) Quantifying the contribution from the soil microbail biomass to the extractable P levels of fresh and air-dried soils. Soil Research 23, 613–621.
| Quantifying the contribution from the soil microbail biomass to the extractable P levels of fresh and air-dried soils.Crossref | GoogleScholarGoogle Scholar | 1:CAS:528:DyaL28XjtlCksQ%3D%3D&md5=5ce467af40759ac32402b0ce414218c3CAS |
Thomas GW, Peaslee DE (Eds) (1973) ‘Soil testing and plant analysis.’ (Soil Science Society of America: Madison, WI)
Thompson J (1987) Decline of vesicular-arbuscular mycorrhizae in long fallow disorder of field crops and its expression in phosphorus deficiency of sunflower. Australian Journal of Agricultural Research 38, 847–867.
| Decline of vesicular-arbuscular mycorrhizae in long fallow disorder of field crops and its expression in phosphorus deficiency of sunflower.Crossref | GoogleScholarGoogle Scholar | 1:CAS:528:DyaL2sXmtFKltbk%3D&md5=723b75e554067d33744ae9d7143094b4CAS |
Thorburn P, Shaw R (1987) Effects of different dispersion and fine fraction determination methods on the results of routine particle size analysis. Soil Research 25, 347–360.
| Effects of different dispersion and fine fraction determination methods on the results of routine particle size analysis.Crossref | GoogleScholarGoogle Scholar |
Truog E (1930) The determination of the readily available phosphorus of soils. Journal - American Society of Agronomy 22, 874–882.
| The determination of the readily available phosphorus of soils.Crossref | GoogleScholarGoogle Scholar | 1:CAS:528:DyaA3MXhtFCr&md5=52a78d72755f88eba8a8cd7332543950CAS |
Wang X, Lester DW, Guppy CN, Lockwood PV, Tang C (2007) Changes in phosphorus fractions at various soil depths following long-term P fertiliser application on a black Vertosol from south-eastern Queensland. Australian Journal of Soil Research 45, 524–532.
| Changes in phosphorus fractions at various soil depths following long-term P fertiliser application on a black Vertosol from south-eastern Queensland.Crossref | GoogleScholarGoogle Scholar |
Wang X, Tang C, Guppy CN, Sale PWG (2008) Phosphorus acquisition characteristics of cotton (Gossypium hirsutum L.), wheat (Triticum aestivum L.) and white lupin (Lupinus albus L.) under P deficient conditions. Plant and Soil 312, 117–128.
| Phosphorus acquisition characteristics of cotton (Gossypium hirsutum L.), wheat (Triticum aestivum L.) and white lupin (Lupinus albus L.) under P deficient conditions.Crossref | GoogleScholarGoogle Scholar | 1:CAS:528:DC%2BD1cXht1aju7nI&md5=3e121b07c5354d624c5eb217d15546bfCAS |
Wang X, Tang C, Guppy CN, Sale PWG (2009) The role of hydraulic lift and subsoil P placement in P uptake of cotton (Gossypium hirsutum L.). Plant and Soil 325, 263–275.
| The role of hydraulic lift and subsoil P placement in P uptake of cotton (Gossypium hirsutum L.).Crossref | GoogleScholarGoogle Scholar | 1:CAS:528:DC%2BD1MXhsFSrt7jI&md5=f4252b2393dee3572428fea68985af59CAS |


