A systematic assessment of the metallome of selected plant families in the Queensland (Australia) flora by using X-ray fluorescence spectroscopy
Imam Purwadi A , Farida Abubakari A , Gillian K. Brown B , Peter D. Erskine A and Antony van der Ent
  A C *
A C *
A Centre for Mined Land Rehabilitation, Sustainable Minerals Institute, The University of Queensland, Brisbane, Qld 4072, Australia.
B Department of Environment and Science, Queensland Herbarium, Toowong, Qld 4066, Australia.
C Laboratory of Genetics, Wageningen University and Research, The Netherlands; and Laboratoire Sols et Environnement, INRAE, Université de Lorraine, France.
Australian Journal of Botany 71(4) 199-215 https://doi.org/10.1071/BT22028
Submitted: 17 March 2022 Accepted: 31 January 2023 Published: 5 May 2023
© 2023 The Author(s) (or their employer(s)). Published by CSIRO Publishing. This is an open access article distributed under the Creative Commons Attribution 4.0 International License (CC BY)
Abstract
Context: Fewer than 10 plant species from Australia were known to hyperaccumulate metal(loid)s, despite metal-rich soils being widespread in Australia. By measuring herbarium specimens with non-destructive portable X-ray fluorescence spectroscopy (XRF) instrumentation their metal(loid)s concentrations can be determined, providing information that could be used to probe the evolution, biogeography, ecology, and physiology of plant species.
Aims: This study aimed to systematically measure herbarium specimens to obtain information on the prevailing concentrations of metal(loid)s in nearly 7000 plant specimens across seven plant families, and to link this data to an assessment of their spatial distribution.
Methods: The raw XRF spectrum of each herbarium specimen was processed using a new data-analysis pipeline recently validated for XRF data of herbarium specimens, to determine the concentrations of the first-row metal transition elements, and other detected elements. The collection localities of each of the herbarium specimens were plotted against rainfall and soil types to assess possible distributional patterns.
Key results: The results showed several newly discovered hyperaccumulator plant species, including 15 for manganese, two for nickel, three for cobalt, three for zinc, two for rare earth elements and one for selenium.
Conclusions and implications: Australia has more hyperaccumulator plant species than previously known and the XRF analysis of herbarium specimens is a powerful tool for their discovery. This research presents a new value proposition for the continued funding of herbarium collections in Australia and could initiate a range of research opportunities to use these data for future studies of plant evolution and adaptation.
Keywords: biogeography, cobalt, herbarium collection, hyperaccumulators, manganese, nickel, phylogenetic diversity, XRF technology, zinc.
Introduction
Global herbaria are the largest repositories of ionome, taxonomic, genetic, and biogeographic information on the plant kingdom (Greve et al. 2016; Souza and Hawkins 2017; Heberling et al. 2019; van der Ent et al. 2019a). The term ‘ionome’ is the totality of all elements found in plants including non-metals, metals, and metalloids (Lahner et al. 2003), and roughly equates to the ‘metallome’ or ‘elementome’ which more specifically refers to the range of metals (and non-metals) present in a plant (Edwards et al. 2014; Peñuelas et al. 2019). Characterisation of the full ionome or metallome in herbarium specimens requires analytical instrumentation capable of measuring without causing damage to the specimen, and portable X-ray fluorescence (XRF) spectroscopy meets this requirement (van der Ent et al. 2019a). The portable XRF instrument emits focused high-energy X-rays to excite elements within the sample to produce characteristic fluorescent X-rays. These fluorescent X-rays are recorded which the instrument processes and reports to detected elements and their concentrations in the sample (Kalnicky and Singhvi 2001; Markowicz and Haselberger 2004).
Our research has pioneered an approach based on a non-destructive technique using portable XRF instrumentation to obtain elemental data from herbarium specimens, which has thus far been applied to the floras of Papua New Guinea, Malaysia, New Caledonia, and South America (van der Ent et al. 2019b; Do et al. 2020; Belloeil et al. 2021). Australia has a unique and rich flora diversity, harbouring ~8% of the world’s plant kingdom (Chapman 2009; Broadhurst and Coates 2017). However, few metal(loid) hyperaccumulator plants have been discovered in Australia, despite extensive ultramafic outcrops where these remarkable species have often been found in other parts of the world (van der Ent et al. 2015). Hyperaccumulators are rare plant species capable of attaining extremely high foliar concentrations of specific elements without experiencing physiologically stress (van der Ent et al. 2013). For example, the average concentration of manganese (Mn) in normal plant leaves is ~80 μg g−1 (range 20–500 μg g−1), and the threshold for Mn hyperaccumulation has been set at 10 000 μg g−1 (Baker and Brooks 1989). Nickel (Ni) concentrations in plants growing on ‘normal soils’ (e.g. soils that are not ultramafic) are typically <10 μg g−1, whereas, on ultramafic soils, they are higher (50–100 μg g−1), and, consequently, the threshold of hyperaccumulation is 1000 μg g−1 (Reeves 1992). Meanwhile, the notional thresholds for cobalt (Co) and zinc (Zn) hyperaccumulation are 300 μg g−1 and 3000 μg g−1 respectively (Krämer et al. 2007; van der Ent et al. 2013).
The portable XRF instrument is not designed for herbarium specimens, and in studies undertaken thus far the reported concentrations were corrected on the basis of an empirical calibration approach (McCartha et al. 2019; van der Ent et al. 2019a; Do et al. 2020; Gei et al. 2020; Abubakari et al. 2021a, 2021b, 2022). Even though the same type of instrument was used, the results of the empirical calibration can differ because different sets of standards are used, thus producing different empirical formulas. Because of that, a new data-analysis pipeline to process raw XRF data has been developed to overcome the main limitations of empirical calibrations. This new approach needs only one set of calibration standards for each element and has a better accuracy (Purwadi et al. 2022).
Therefore, this study aims to use this new approach to assess the metallome in selected herbarium specimens from Australia. Australia has an estimated ~21 645 species, of which >90% are endemic (Chapman 2009), and half of the known Australian vascular flora (~14 482) occur in Queensland (Brown and Bostock 2020). Given the size of the collection of the Queensland Herbarium, a selection was made on the basis of families that were likely to contain hyperaccumulating taxa on the basis of global incidences of hyperaccumulation, namely, Apocynaceae, Celastraceae, Cunoniaceae, Myrtaceae, Phyllanthaceae, and Proteaceae (Reeves 2003; Reeves et al. 2018a, 2018b). Instead of using empirical calibration, the data were processed using the new pipeline aiming to make the results comparable and standardised (Purwadi et al. 2022). Finally, we performed an analysis of the geospatial distribution of specimens to assess possible distributional patterns.
Materials and methods
Herbarium specimen selection for XRF scanning
Before this study begun, fewer than 10 hyperaccumulator plant species had been reported from Australia. Given that more than 900 000 herbarium specimens are kept at the Queensland Herbarium, a selection was made on the basis of family and genera that were most likely to contain hyperaccumulator plant species, and focused on seven families, Apocynaceae, Celastraceae, Cunoniaceae, Myrtaceae, Phyllanthaceae, Proteaceae, and Salicaceae, totalling 6696 specimens. Table 1 tabularises the total number of species and specimens for each family measured in this study. The results of herbarium specimen XRF scanning for the genera Denhamia (Celastraceae), Gossia (Myrtaceae) and Macadamia (Proteaceae) have been previously published; however, they used the older empirical calibration method (Abubakari et al. 2021a, 2021b, 2022).
| Family | Species | Specimens | ||||
| Measured | Total | Percentage | Measured | Total | Percentage | |
| Apocynaceae | 12 | 180 | 7 | 372 | 9163 | 4.1 |
| Celastraceae | 27 | 41 | 66 | 1463 | 2827 | 51.8 |
| Cunoniaceae | 27 | 28 | 96 | 666 | 797 | 83.6 |
| Myrtaceae | 24 | 772 | 3 | 636 | 35 864 | 1.8 |
| Phyllanthaceae | 54 | 140 | 39 | 633 | 6751 | 9.4 |
| Proteaceae | 100 | 205 | 49 | 2351 | 8241 | 28.5 |
| Salicaceae | 23 | 33 | 70 | 575 | 951 | 60.5 |
Number of species and specimens are those identified and held at the Queensland Herbarium (Brown 2021).
Handheld XRF calibration
A Thermo Fisher Scientific Niton XL3t 950 GOLDD+ portable XRF instrument was used to scan the herbarium specimens. The instrument was used in ‘Soils Mode’ coupled with the ‘Main filter’ at 50 kV aiming to excite the K-shells of the first-row transition metals. Each specimen was placed on top of two pure (99.995%) 2 mm thick plates of titanium and molybdenum, respectively and the specimens were measured for 30 s. This setting was used to absorb X-rays transmitted through the specimen and to ensure a uniform background. Each specimen was measured once only at the leaf lamina; this procedure generates errors of less than 4% compared with the mean concentration of the whole leaf for the first-row transition metals (Purwadi et al. 2022). The obtained spectra were processed in GeoPIXE 7.5, a software package based on dynamic analysis that has been developed for synchrotron-based XRF and nuclear microprobe techniques (Ryan 2000; Ryan et al. 2005). The instrument was calibrated in a previous study (Purwadi et al. 2022) to obtain relevant instrumental parameters (filter material and thickness, source composition, detector dimensions, etc.) required by GeoPIXE. The dynamic analysis method is a fundamental parameter approach that solves complex physics equations (Sherman 1955) by iteratively fitting linear and non-linear models to decompose the full XRF spectrum to single spectrum of each element within the sample that contributes to the full XRF spectrum (Ryan 2000; Ryan et al. 2005, 2015). Provided with instrumental parameters (X-ray tube, detector, filters, etc.) and sample parameters (density, thickness, etc.), it statistically calculates the concentration of each element on the basis of the decomposed spectra. This calibration quantifies certified thin films and yields errors less than 5% (Supplementary Tables S1–S2 and Fig. S1). During the decomposition process, the continuum background of the spectrum is also estimated and corrected for low and fluctuated counts (Ryan et al. 1988). Then, the limit of detection is estimated following this formula, 3.29σb, where σb is the standard deviation of the background (Currie 1968). As the background of herbarium spectra vary resulting from different matrix compositions and physical properties, the calculated limit of detection are not the same for each spectrum, and therefore, this study reports the average limit of detection.
Data presentation and analysis
The elemental concentrations reported by GeoPIXE were processed further in R v4.1.1 and RStudio v1.4.1106. The following packages were used to produce charts in this study: ggplot2 (Wickham 2009). Dunn’s Kruskal–Wallis post hoc test was performed to check the similarity in elemental distribution across the family by using ‘FSA’ package (P ≤ 0.05). The elemental concentrations are classified further into three operationally defined classes (normal, accumulator, hyperaccumulator), as shown in Table 2. The upper threshold of the ‘normal’ class represents 10% of the established ‘hyperaccumulator’ threshold values (van der Ent et al. 2013). It follows that the ‘accumulator’ class is then defined as concentrations falling between 10% and 100% of the hyperaccumulator threshold values for each element. There has not been a statistically sound underpinning of the recognition of hyperaccumulation threshold values, although attempts have been made in regional datasets (Pollard et al. 2002; Reeves et al. 2018a; van der Ent et al. 2020). Herbarium specimens accompanied with information on the location of where they have been collected, expressed as longitude and latitude coordinates, were imported into QGIS Software v3.22 and and processed to generate a density and contour line of number of specimens taken per square kilometre. The density and contour line was overlapped on top of Australian soil type classification (Searle 2021), and Australian rainfall data (Australian Bureau of Meteorology 2020).
| Element | Hyperaccumulator (μg g−1)A | Accumulator (μg g−1) | Normal (μg g−1) |
| Mn | ≥10 000 | 10 000 > x > 1000 | ≤1000 |
| Co | ≥300 | 300 > x > 3 | ≤3 |
| Ni | ≥1000 | 1000 > x > 100 | ≤100 |
| Zn | 3000 | 3000 > x > 300 | ≤300 |
AThreshold value used in Reeves et al. (2018a).
Results
Overall observations
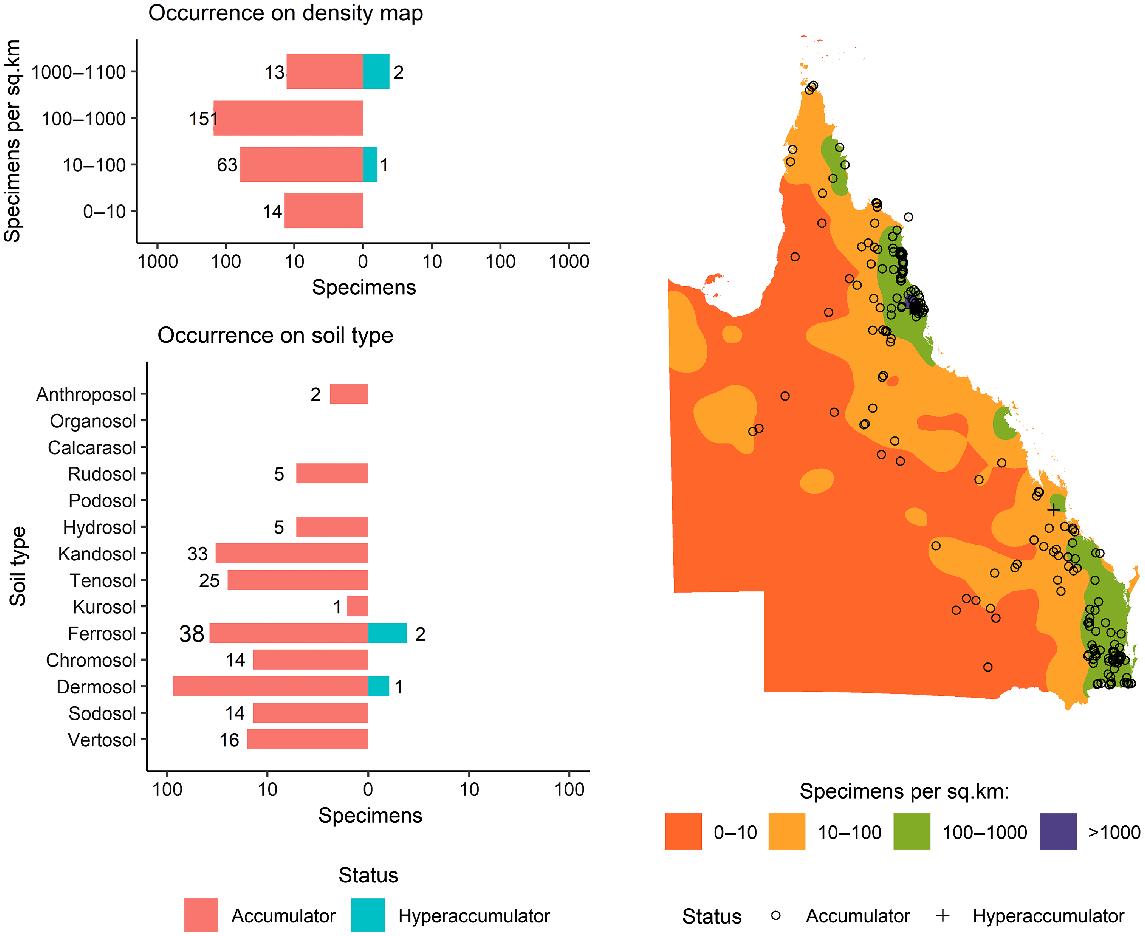
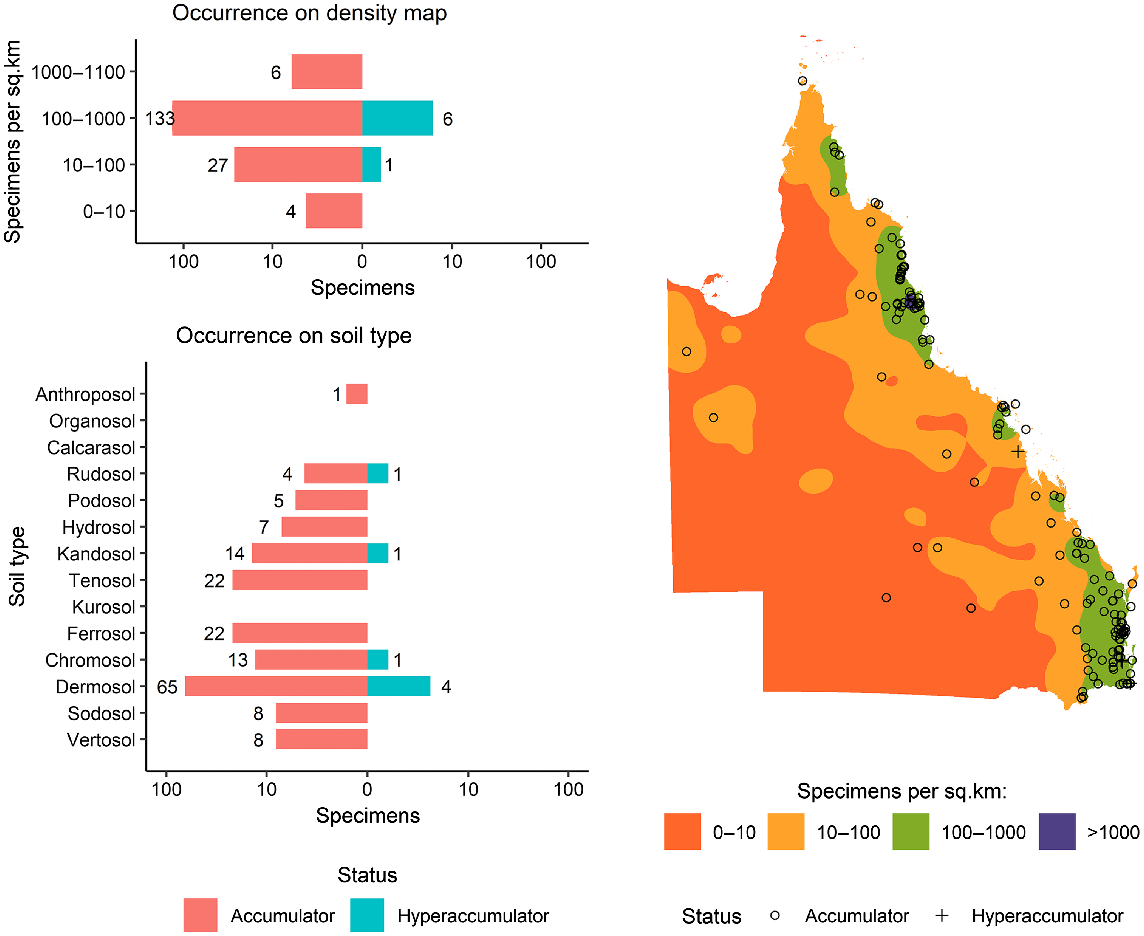
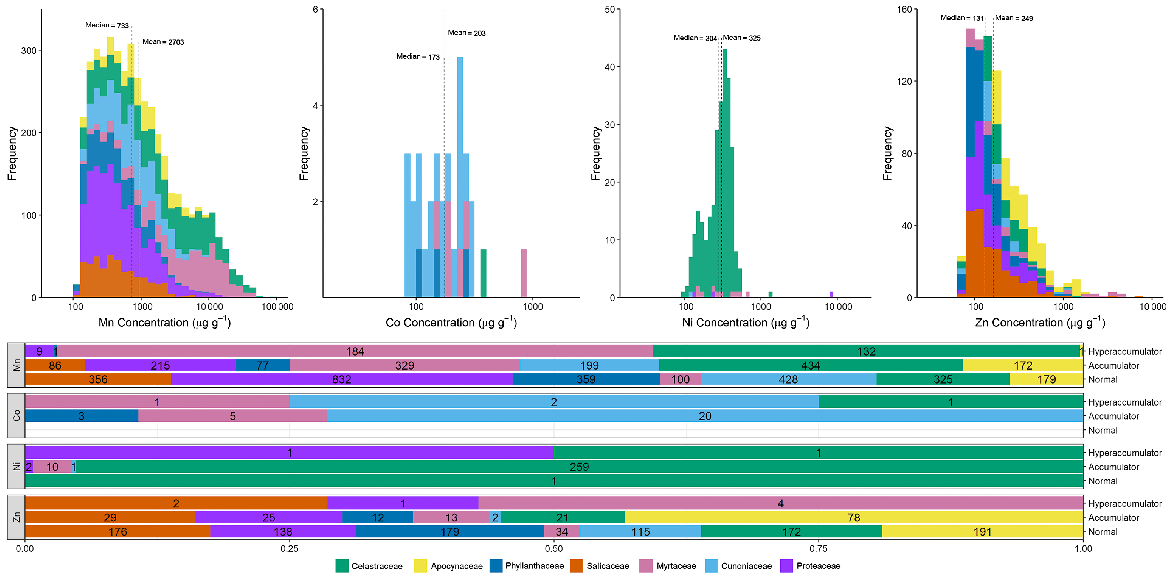
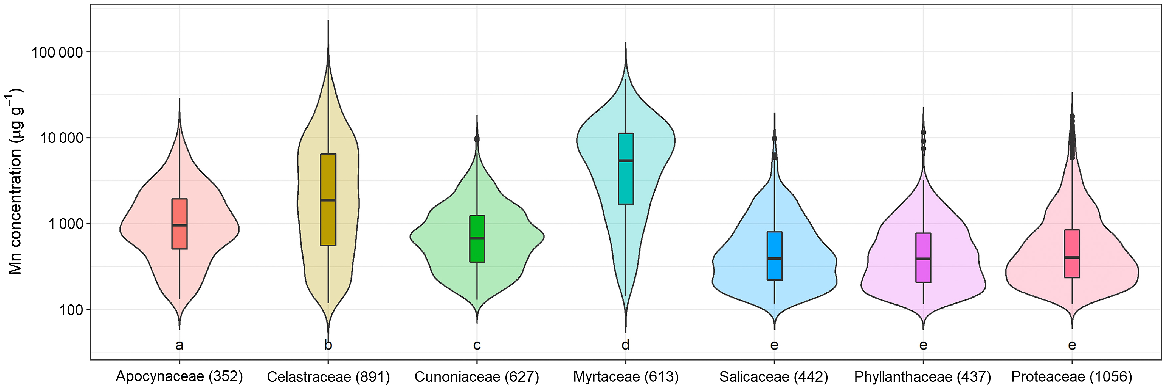
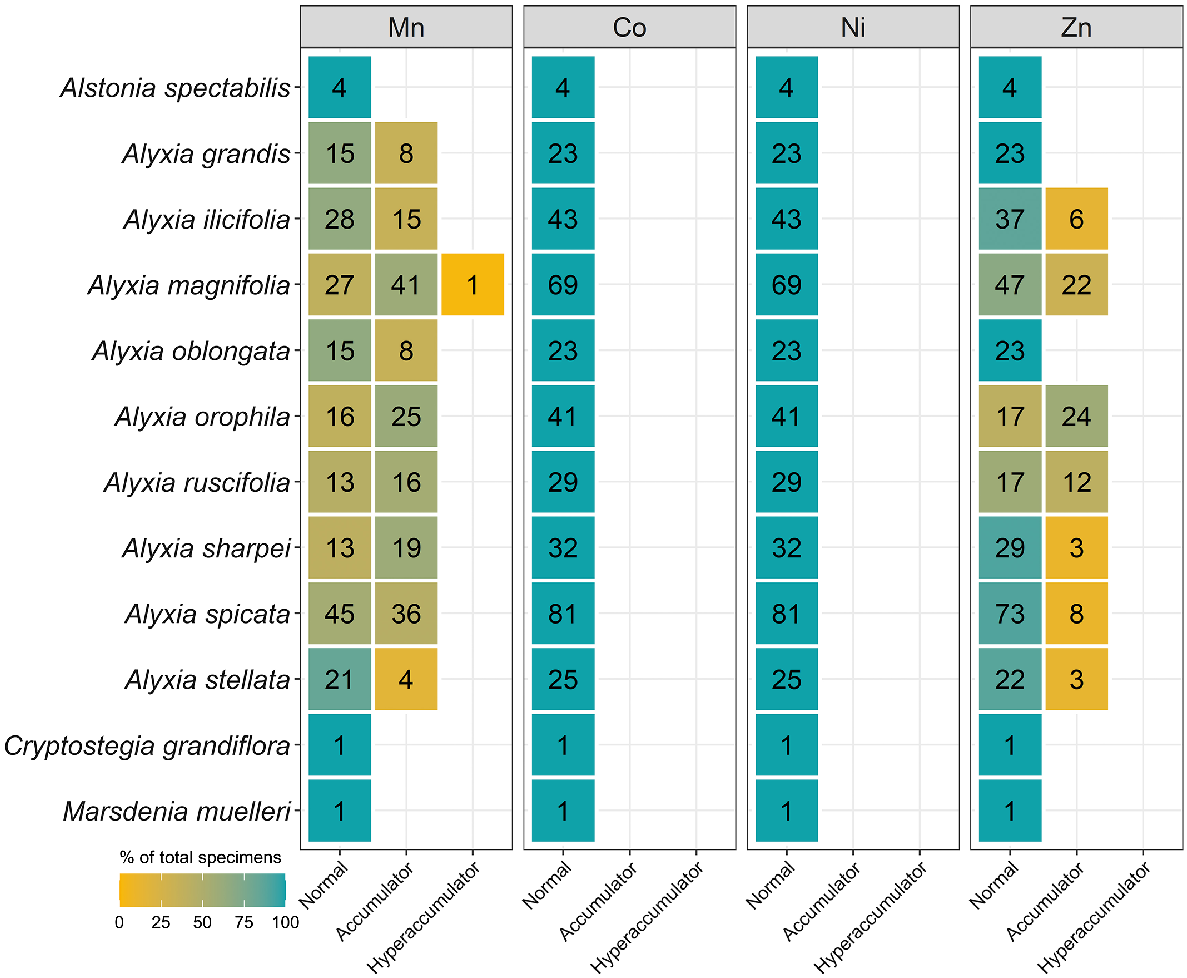
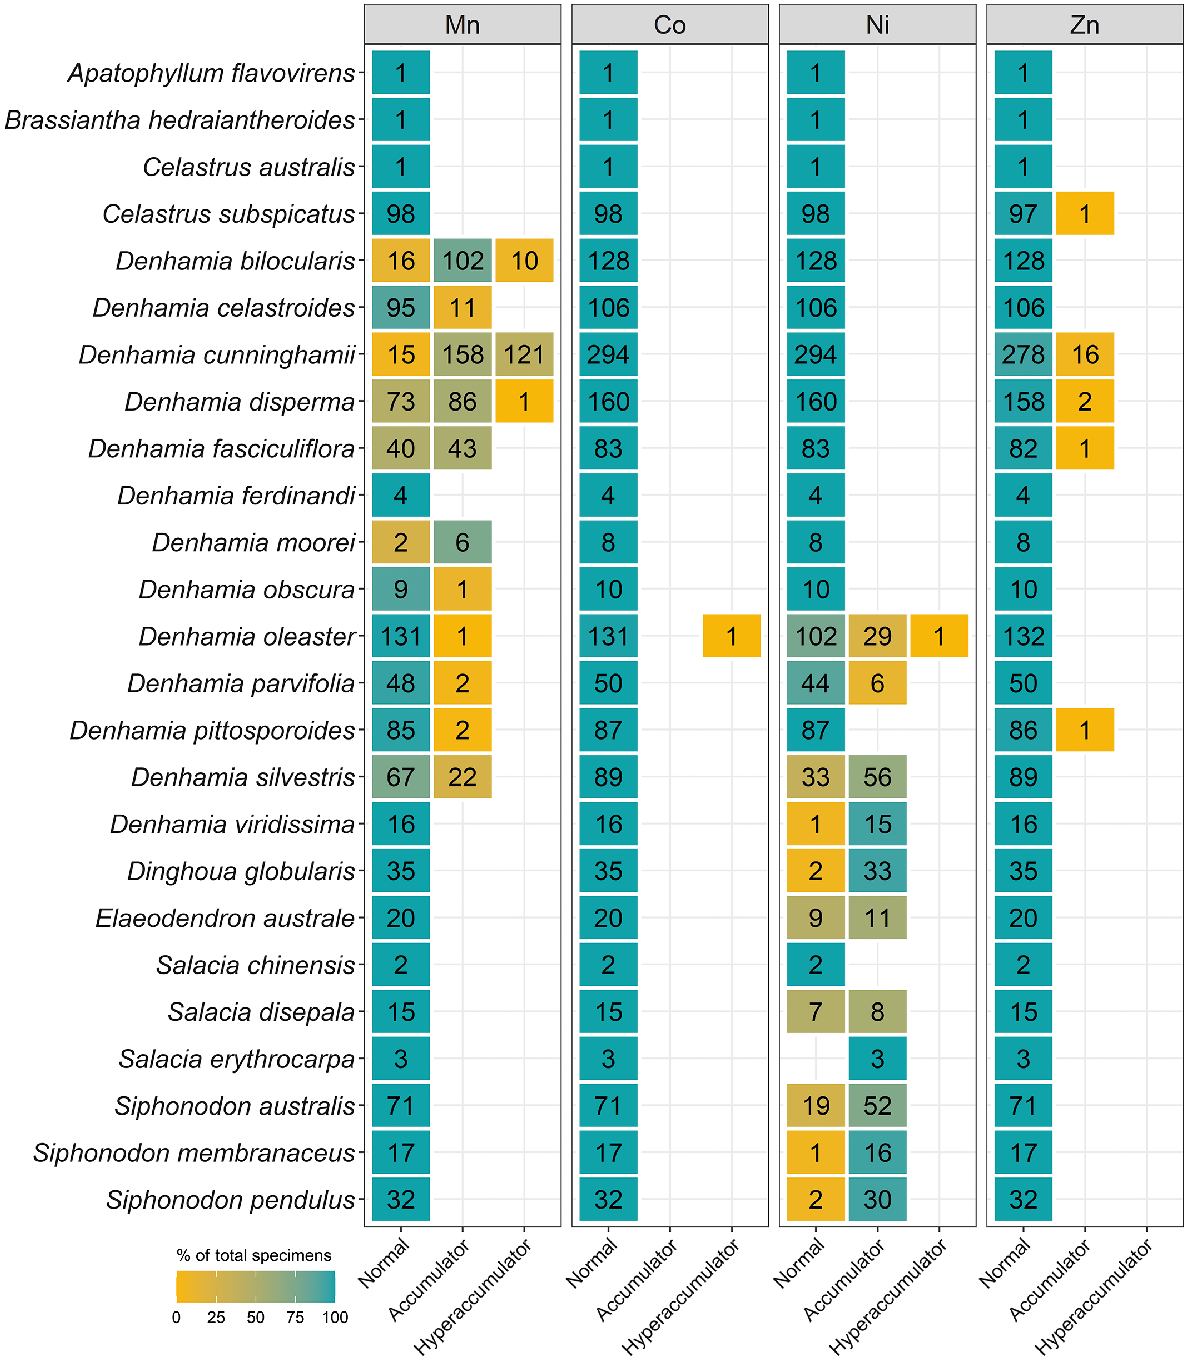
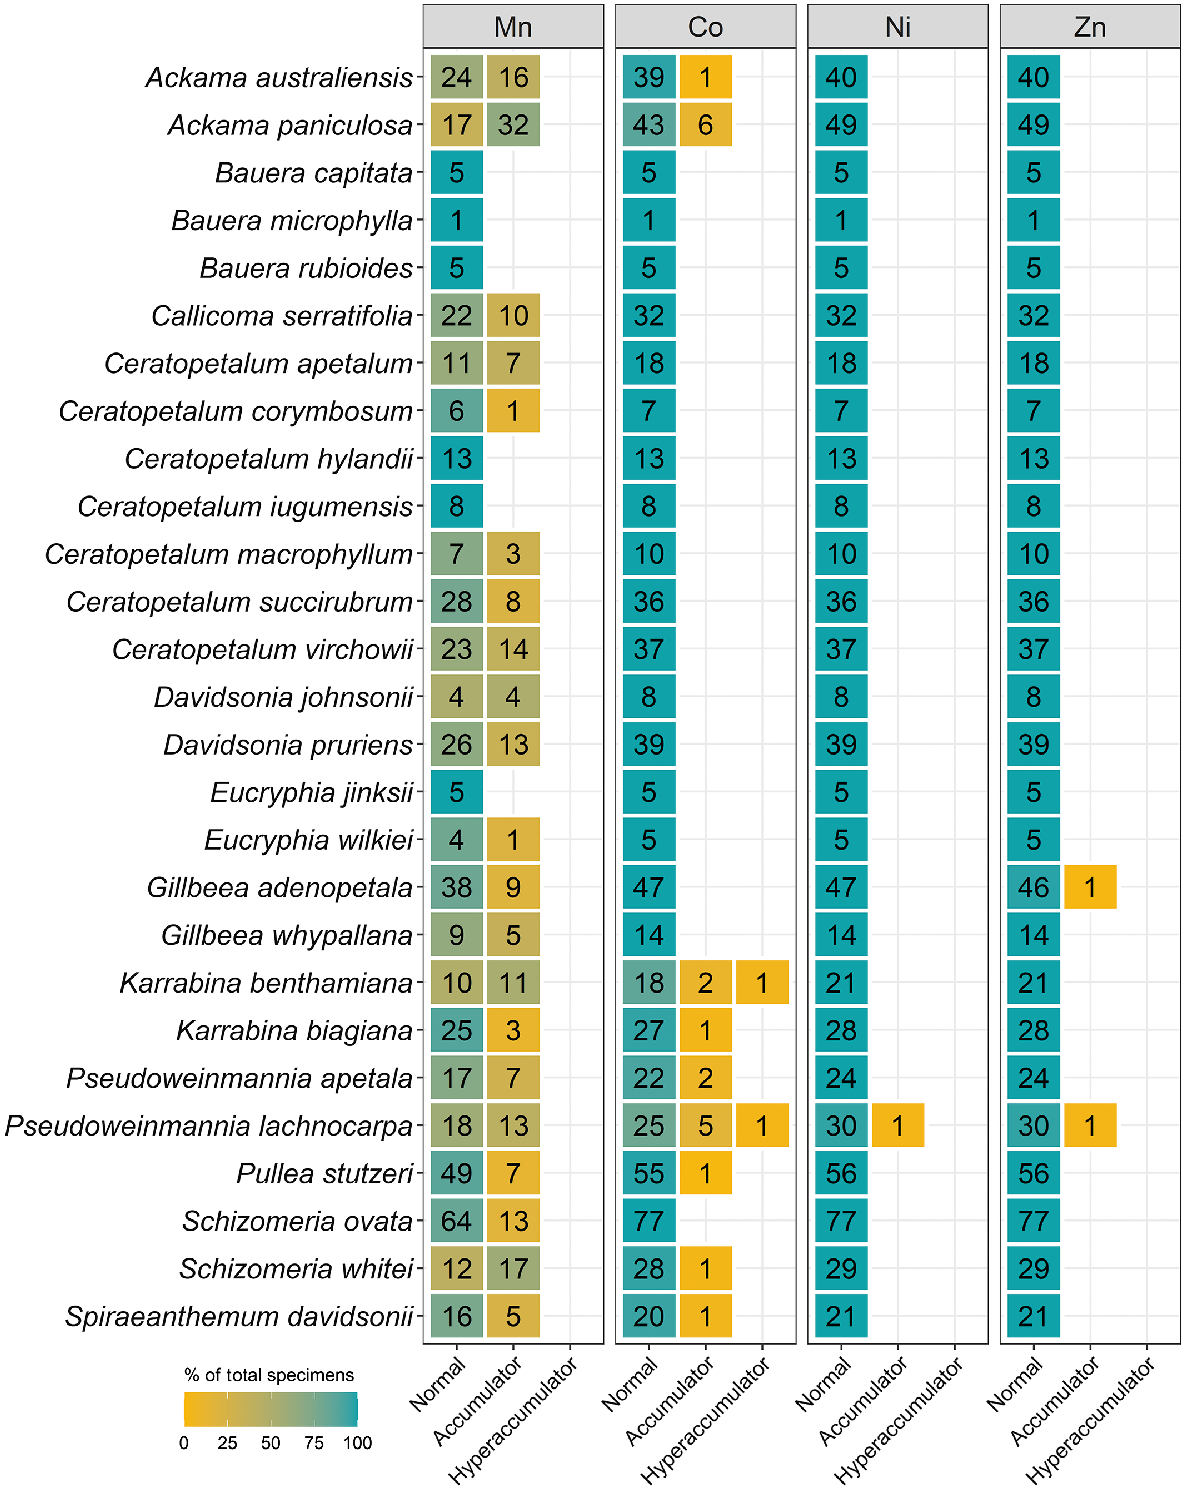
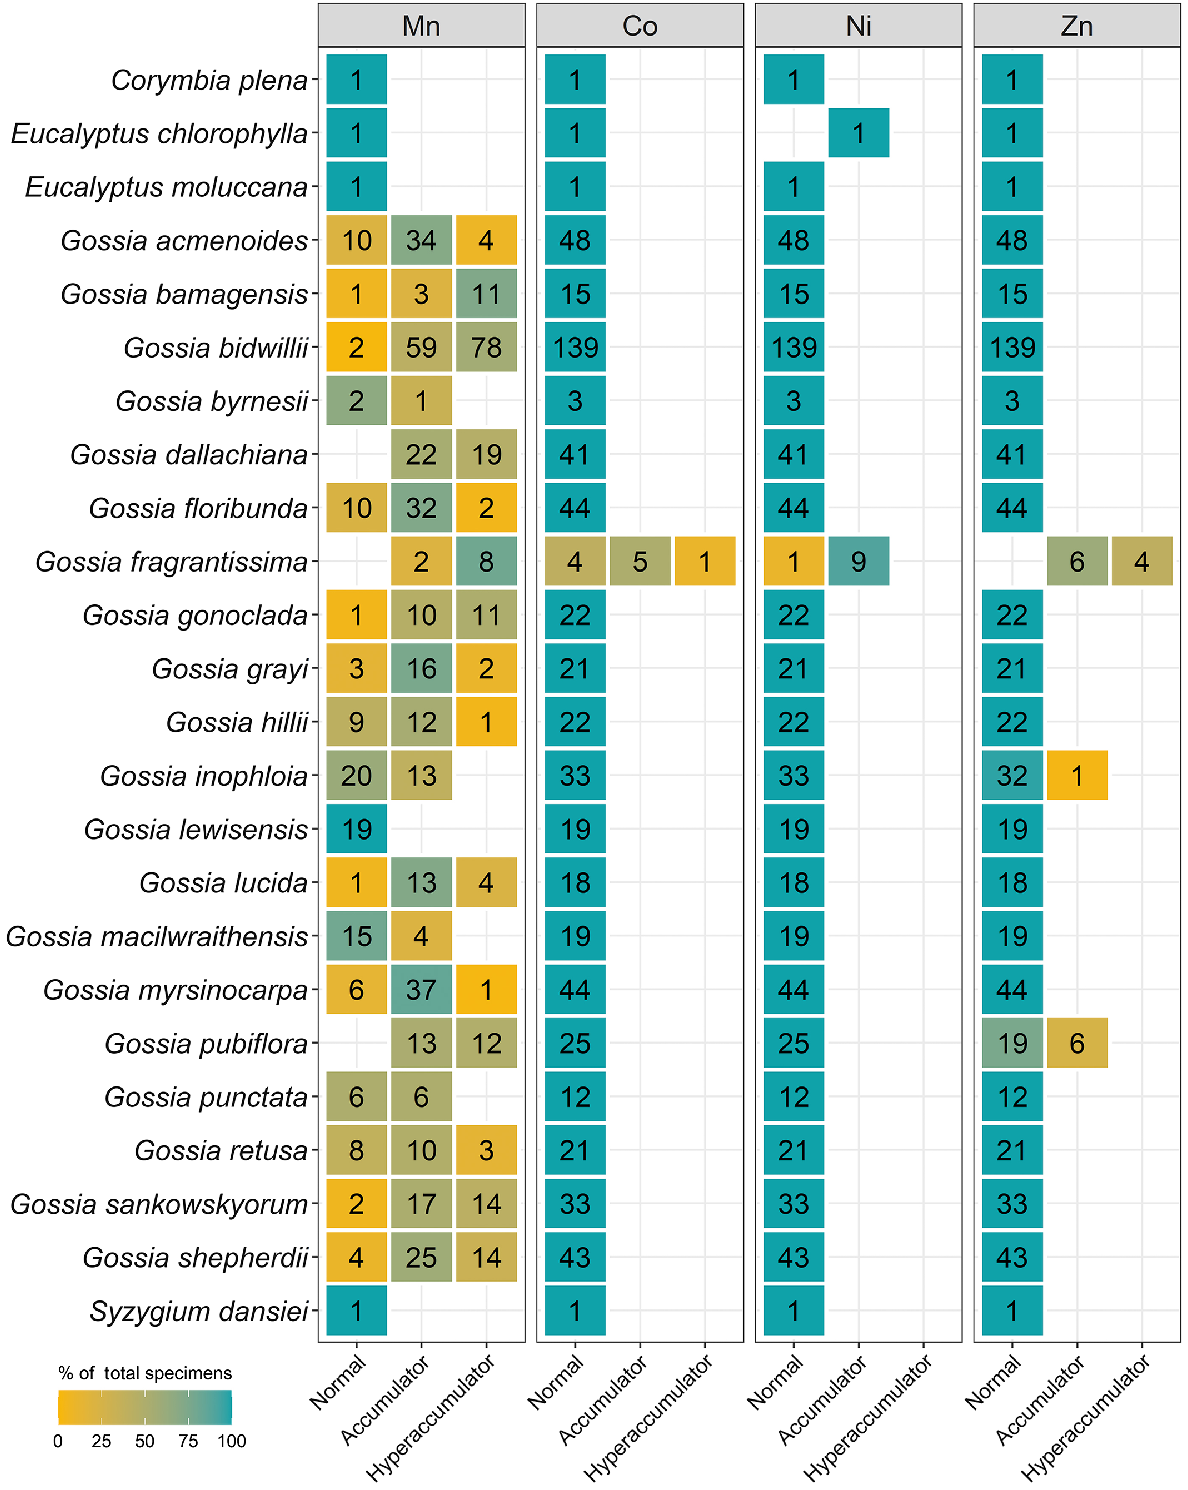
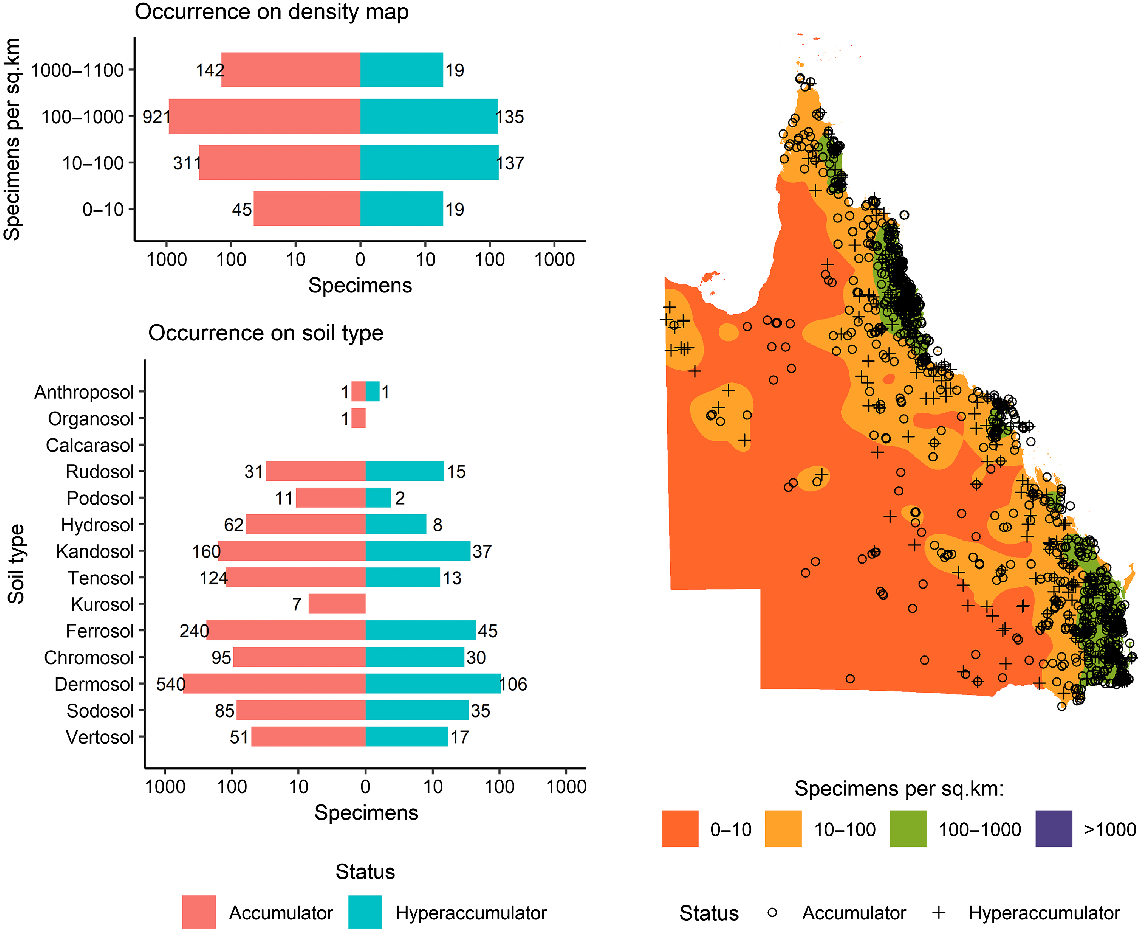
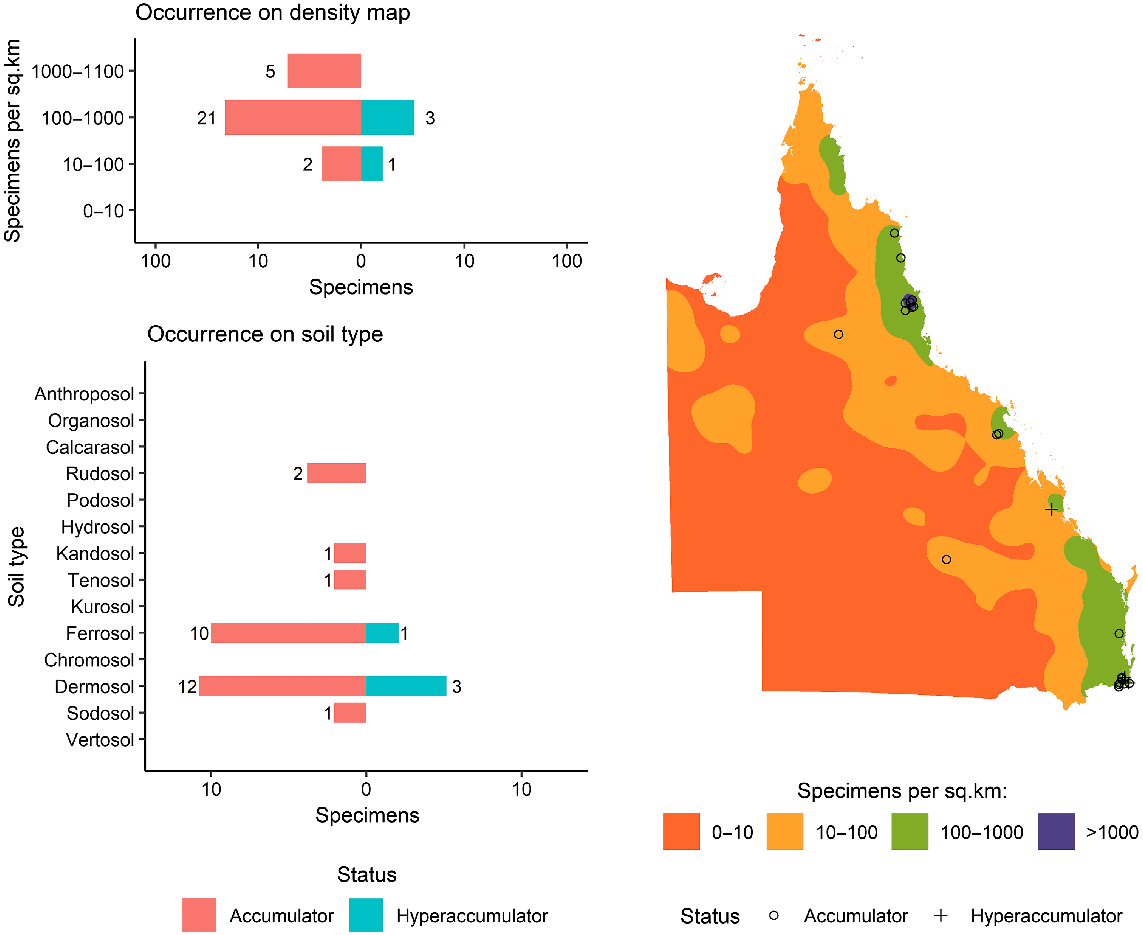
As shown in Fig. 1, a total of 6696 specimens were scanned, covering over 5% of both the species and specimens kept in Queensland herbarium, consisting of five orders, seven families, 73 genera, and 267 species. Of the first-row transition metals, only Mn, Co, Ni, and Zn were detected (average LODs were 130 μg g−1, 80 μg g−1, 90 μg g−1, and 80 μg g−1 respectively) in significant numbers of herbarium specimens (4418, 32, 275, and 1192 respectively), as shown in Table 3. Twenty-seven plant species were identified as Mn hyperaccumulators (>10 000 μg g−1), and the distribution of Mn concentration across families significantly differed, except for the Salicaceae, Phyllanthaceae, and Salicaceae and Proteaceae (Fig. 2). Fewer than 10 plant species were found to be Co, Ni, and/or Zn, hyperaccumulators (Figs 3–9 and Figs S2–S5). In addition to Mn, Co, Ni, and Zn, several specimens were detected to contain yttrium (Y) and selenium (Se), mostly from the Proteaceae. Figs 10–13 show density maps of the number of specimens taken per 1 × 1 km2 and the occurrences of (hyper)accumulator specimens associated soil types and herbarium density. Dense areas (more than 100 specimens km−2) were observed close to the coastline, and the density decreased as the distance from coastline increased as a function of rainfall (Figs S6–S7). However, the majority of (hyper)accumulator specimens were not collected in the most dense or sparse areas. In terms of soil types, Vertosol was the most common soil type, covering 36.77% of Queensland (Fig. S7), and on the basis of Figs 10–13, no (hyper)accumulator specimens were found in Calcarosol, but most were commonly found growing in Dermosols.
Histograms of Mn, Co, Ni, and Zn. Only samples greater than the limits of detection were used to construct histograms (LODs are >128 μg g−1 for Mn, >75 μg g−1 for Co, >91 μg g−1 for Ni, and >81 μg g−1 zinc Zn). Stacked bar plots display the number of specimens classified as normal, accumulator, and hyperaccumulator. Table 2 lists thresholds to define normal, accumulator, and hyperaccumulator.
| Family | Element | N | <LOD | >LOD (% of N) | Hyperaccumulator | Concentration (μg g−1) |
| Apocynaceae | Mn | 372 | 20 | 94.6 | 1 | 130–13 000 [1500] |
| Celastraceae | 1463 | 572 | 60.9 | 132 | 120–82 000 [5100] | |
| Cunoniaceae | 666 | 39 | 94.1 | 0 | 130–9800 [970] | |
| Myrtaceae | 636 | 23 | 96.4 | 184 | 140–48 000 [7700] | |
| Phyllanthaceae | 633 | 196 | 69.0 | 1 | 120–11 000 [640] | |
| Proteaceae | 2351 | 1295 | 44.9 | 9 | 110–18 000 [900] | |
| Salicaceae | 575 | 133 | 76.9 | 0 | 120–9700 [670] | |
| Apocynaceae | Co | 372 | 372 | 0.0 | 0 | NA |
| Celastraceae | 1463 | 1462 | 0.1 | 1 | 380 | |
| Cunoniaceae | 666 | 644 | 3.3 | 2 | 82–305 [170] | |
| Myrtaceae | 636 | 630 | 0.9 | 1 | 150–840 [310] | |
| Phyllanthaceae | 633 | 630 | 0.5 | 0 | 110–270 [180] | |
| Proteaceae | 2351 | 2351 | 0.0 | 0 | NA | |
| Salicaceae | 575 | 575 | 0.0 | 0 | NA | |
| Apocynaceae | Ni | 372 | 372 | 0.0 | 0 | NA |
| Celastraceae | 1463 | 1202 | 17.8 | 1 | 98–1300 [300] | |
| Cunoniaceae | 666 | 665 | 0.2 | 0 | 119 | |
| Myrtaceae | 636 | 626 | 1.6 | 0 | 140–660 [330] | |
| Phyllanthaceae | 633 | 633 | 0.0 | 0 | NA | |
| Proteaceae | 2351 | 2348 | 0.1 | 1 | 140–8000 [2800] | |
| Salicaceae | 575 | 575 | 0.0 | 0 | NA | |
| Apocynaceae | Zn | 372 | 103 | 72.3 | 0 | 70–1600 [290] |
| Celastraceae | 1463 | 1270 | 13.2 | 0 | 77–1300 [170] | |
| Cunoniaceae | 666 | 549 | 17.6 | 0 | 77–1100 [140] | |
| Myrtaceae | 636 | 585 | 8.0 | 4 | 81–4600 [720] | |
| Phyllanthaceae | 633 | 442 | 30.2 | 0 | 77–1200 [160] | |
| Proteaceae | 2351 | 2187 | 7.0 | 1 | 77–25 000 [330] | |
| Salicaceae | 575 | 368 | 36.0 | 2 | 78–7000 [230] |
Distribution of Mn concentrations in seven selected families. Numbers in parentheses after the family name represent the number of specimens per family with concentration greater than the detection limit of Mn (128 μg g−1). Different letters below violin plots indicate significant differences among families. The shape of violin depicts the distribution of the data. The distribution of Mn concentrations in Apocynaceae, Cunoniaceae, Salicaceae, Phyllanthaceae, and Proteaceae resembles a normal distribution in which most of data are distributed close to mean and median values. The violin shape of Celastraceae and Myrtaceae are thin with long tails, indicating that extreme Mn concentrations are found within the dataset.
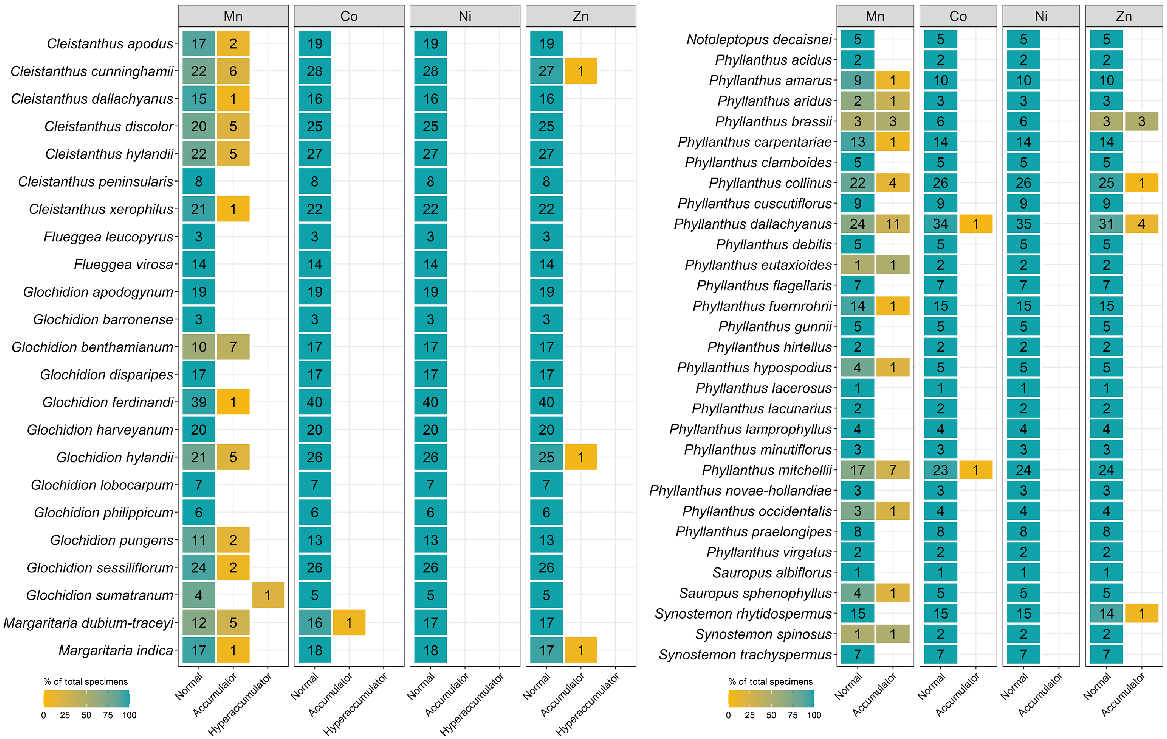
The number of specimens classified as normal, accumulator, and hyperaccumulator defined in Table 2 for four genera from the Apocynaceae measured using XRF scanning.
The number of specimens classified as normal, accumulator, and hyperaccumulator defined in Table 2 for seven genera from the Celastraceae measured using XRF scanning.
The number of specimens classified as normal, accumulator, and hyperaccumulator defined in Table 2 for 12 genera from the Cunoniaceae measured using XRF scanning.
The number of specimens classified as normal, accumulator, and hyperaccumulator defined in Table 2 for four genera from the Myrtaceae measured using XRF scanning.
The number of specimens classified as normal, accumulator, and hyperaccumulator defined in Table 2 for eight genera from the Phyllanthaceae measured using XRF scanning.
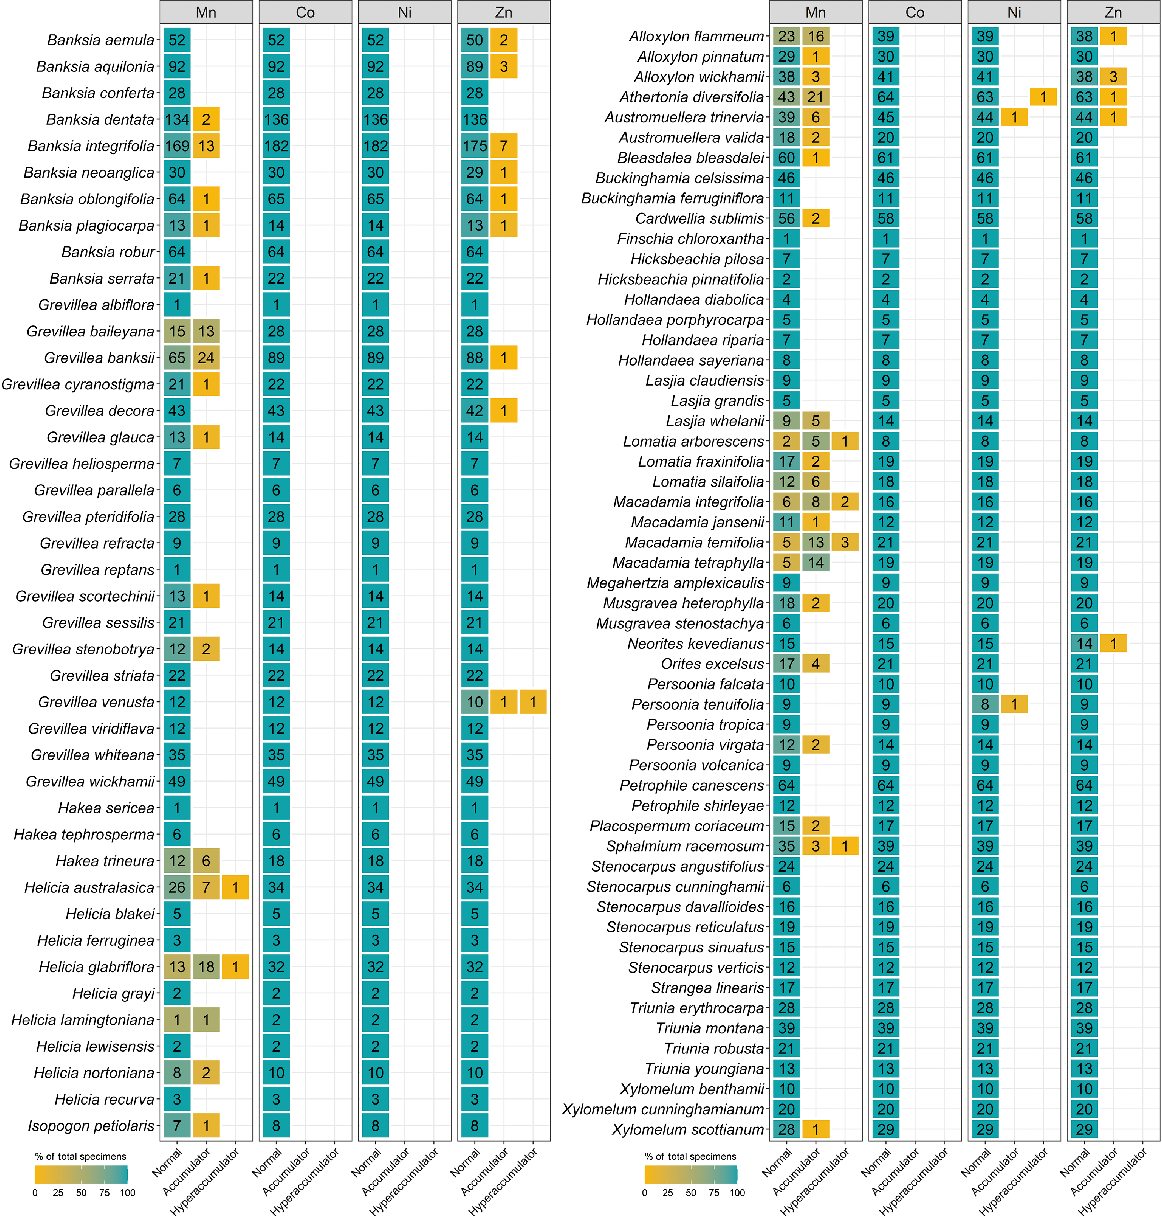
The number of specimens classified as normal, accumulator, and hyperaccumulator defined in Table 2 for 28 genera from the Protaeceae measured using XRF scanning.
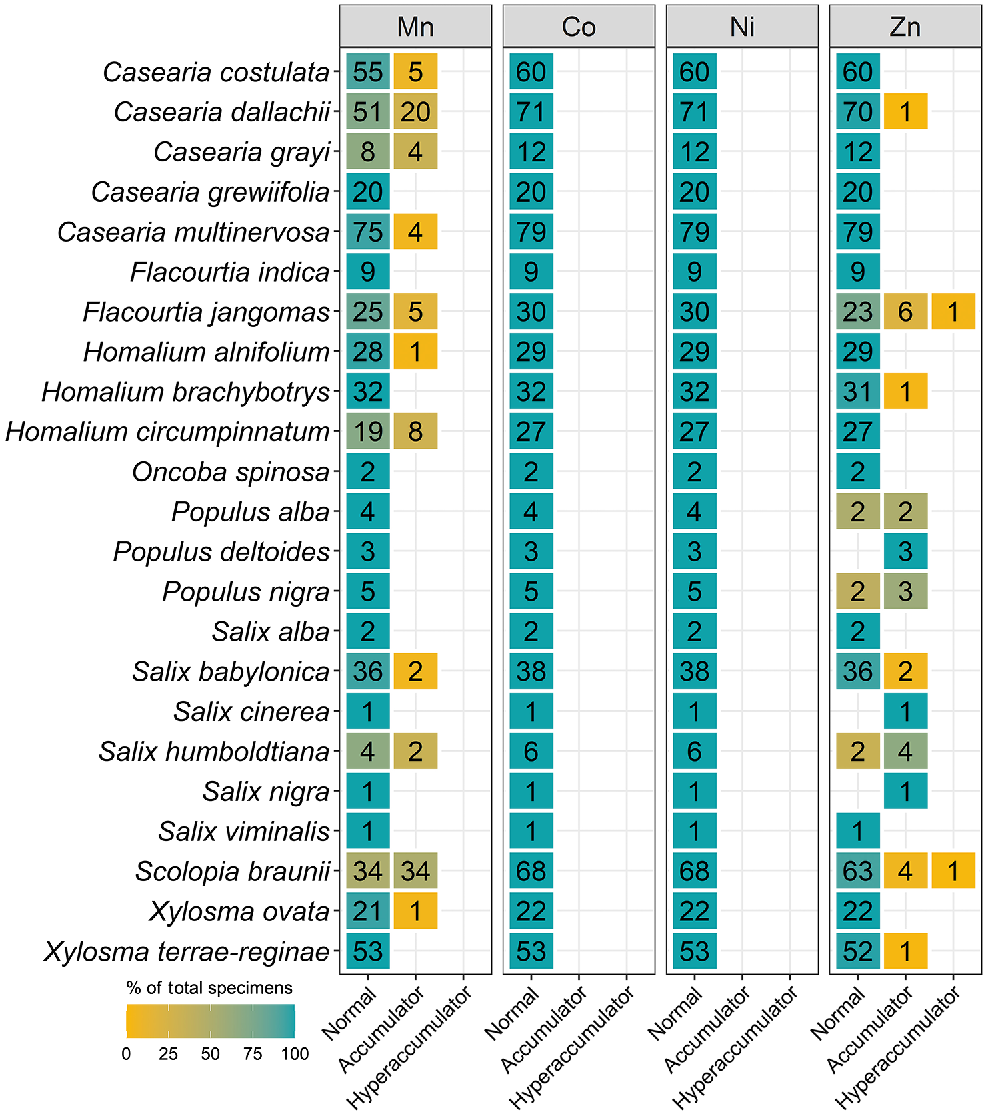
The number of specimens classified as normal, accumulator, and hyperaccumulator defined in Table 2 for seven genera from the Salicaceae measured using XRF scanning.
Map of Queensland showing the distribution of Mn-(hyper)accumulator specimens on top of the density map of the number of specimens collected per one square kilometre, accompanied by bar plots showing the number of Mn-(hyper)accumulator specimens as a function of the density and soil type.
Map of Queensland showing the distribution of Co-(hyper)accumulator specimens on top of the density map of the number of specimens collected per one square kilometre, accompanied by bar plots showing the number of Co-(hyper)accumulator specimens as a function of the density and soil type.
Metal and metalloid concentrations in herbarium specimens
The concentrations of elements were determined simultaneously. Manganese concentrations measured in the specimens followed a right-skewed distribution and had a wide range, from ~100 μg g−1 up to 82 000 μg g−1 (Fig. 1). The mean and median concentrations of Co, Ni, and Zn were almost equal, indicating that the concentrations of these elements were distributed normally, with only few outliers representing hyperaccumulator species. Cobalt, Ni, and Zn were not detected in more than 5500 specimens.
Manganese
Celastraceae and Myrtaceae specimens had higher Mn concentrations of up to 82 000 μg g−1 and 48 000 μg g−1 respectively (Table 3). In terms of average Mn concentration, Celastraceae was lower than Myrtaceae (5100 μg g−1 compared with 7700 μg g−1 respectively). From Celastraceae, Denhamia bilocularis and D. cunninghamii contained up to 31 000 μg g−1 Mn and 82 000 μg g−1 Mn respectively. Both were previously reported (Abubakari et al. 2021a), whereas Denhamia disperma was newly identified, with Mn up to 11 000 μg g−1 (Table S3). Of 20 Mn-hyperaccumulator plants identified in this study, 15 were Myrtaceae. Nine were known Mn-hyperaccumulator plant species, and six were new Mn-hyperaccumulator plant species (Gossia acmenoides, G. floribunda, G. grayi, G. lucida, G. myrsinocarpa, and G. retusa) containing >10 000 μg g−1, with the maximum concentrations ranging up to 48 000 μg g−1 Mn (Table S3). Gossia fragrantissima had previously been reported to be capable of hyperaccumulating multiple different elements (Table 4).
| Element | Order | Taxon | N | <LOD | Hyperaccumulator | Concentration (μg g−1) | Other studies |
| Co | Celastrales | Celastraceae | 1463 | ||||
| Denhamia oleaster | 132 | 131 | 1 | 380 | |||
| Oxalidales | Cunoniaceae | 666 | |||||
| Karrabina benthamiana | 21 | 18 | 1 | 230–305 [260] | |||
| Pseudoweinmannia lachnocarpa | 31 | 25 | 1 | 82–304 [170] | |||
| Myrtales | Myrtaceae | 636 | |||||
| Gossia fragrantissima | 10 | 4 | 1 | 150–840 [310] | Abubakari et al. (2021b) | ||
| Ni | Celastrales | Celastraceae | 1463 | ||||
| Denhamia oleaster | 132 | 101 | 1 | 98–1300 [270] | |||
| Proteales | Proteaceae | 2351 | |||||
| Athertonia diversifolia | 64 | 63 | 1 | 8000 | |||
| Zn | Myrtales | Myrtaceae | 636 | ||||
| Gossia fragrantissima | 10 | 0 | 4 | 330–4600 [2600] | Abubakari et al. (2021b) | ||
| Proteales | Proteaceae | 2351 | |||||
| Grevillea venusta | 12 | 10 | 1 | 550–25 000 [13 000] | |||
| Malpighiales | Salicaceae | 575 | |||||
| Flacourtia jangomas | 30 | 7 | 1 | 82–7000 [501] | |||
| Scolopia braunii | 68 | 22 | 1 | 81–3200 [230] |
Cobalt
Of 6696 measured specimens, only 32 specimens had Co concentration greater than the detection limit (LOD > 80 μg g−1). The Celastraceae had only one specimen, Denhamia oleaster, with a concentration above the detection limit, with 380 μg g−1 Co. This species was also found to hyperaccumulate Ni (Table 4). It total, 22 of 32 specimens with concentrations greater than the LOD were from the Cunoniaceae with two species, Karrabina benthamiana and Pseudoweinmannia lachnocarpa, slightly higher than 300 μg g−1 Co. Six specimens with concentrations greater than the detection limit were from the Myrtaceae, with one hyperaccumulator and five accumulator species. Three Phyllanthaceae specimens were accumulator plants with Co concentrations between 100 μg g−1 and 300 μg g−1.
Nickel
Similar to Co, no specimens from the Apocynaceae, Phyllanthaceae or Salicaceae had concentrations above the detection limit for Ni (LOD > 90 μg g−1). In all, 3 of the 2351 Proteaceae specimens had concentrations greater than the detection limit, with two accumulator and one hyperaccumulator species that is all specimens of Athertonia diversifolia with 8000 μg g−1 Ni. Of the 272 specimens with concentrations greater than the Ni detection limit, 261 are Celastraceae with Ni concentrations in the accumulator range between 100 μg g−1 and 1300 μg g−1, which is found in a D. oleaster specimen. No hyperaccumulator plat species were detected in the Myrtaceae but the mean Ni concentration of the Myrtaceae at 330 μg g−1 was slightly more than that of the Celastraceae at 300 μg g−1.
Zinc
The total number (1192) of specimens containing Zn above the detection limit (80 μg g−1) was higher than that for Ni and Co. The Apocynaceae and Salicaceae did not have specimens with concentrations above the Co and Ni detection limits, but had the highest number of specimens with Zn detected, namely, 269 and 207 specimens respectively. Only 78 specimens of Apocynaceae were Zn accumulators (300–3000 μg g−1), whereas the rest of the specimens were in the normal catagory. Among Salicaceae specimens, Flacourtia jangomas and Scolopia braunii specimens had Zn of up to 7000 and 3200 μg g−1 respectively. Grevillea venusta from the Proteaceae was also shown as a new Zn-hyperaccumulator plant, and the previously reported multielement-hyperaccumulator plant, G. fragrantissima, was also detected.
Other elements
In all, 71 specimens were detected to contain Y, and the majority (68 of 71) of specimens were from the Proteaceae (Table S3). Specimens of Helicia australasica and Helicia glabriflora from the Proteaceae had >1000 μg g−1 Y, making these two species newly discovered rare earth-element (REE)-hyperaccumulator plants. Three specimens with Y concentrations greater than the detection limit were from the Cunoniaceae (Gillbeea adenopetala with 100 μg g−1 Y and G. adenopetala with 180 μg g−1 Y) and one from the Celastraceae (D. oleaster with 310 μg g−1 Y). In addition, 15 specimens were found to have detectable Se, and all were from the Proteaceae (Table S4). Of these 15 specimens, 12 were Austromuellera trinervia, with Se concentrations ranging from 80 μg g−1 to 310 μg g−1.
Discussion
Of 6696 specimen measured 2254 were reported in previous studies (Abubakari et al. 2021a, 2021b, 2022), and all hyperaccumulator specimens found in those studies were also detected in this study (Table S5). Compared to this study, the previous studies used empirical calibrations, and reported higher mean and maximum Mn concentrations (Abubakari et al. 2021a, 2021b, 2022). Such empirical calibrations rely on measuring a set of standards (in this case comprised of dried leaves) to derive a mathematical model, which presumes that the standards and herbarium specimens have the exact same matrix (e.g. composition, thickness, and density). However, herbarium specimens vary greatly in their composition, thickness, and density. The new GeoPIXE-based approach (Purwadi et al. 2021, 2022) used here derives parameters to correct for sample thickness and density and models the entire spectrum to give access to all elements detected.
Manganese is present in relatively high foliar concentrations as plants utilise more of this element than they do Co, Ni, and Zn for their essential metabolism. This fact might explain the high rate of specimens with Mn concentrations above the detection limit. Hyperaccumulator properties were observed in all families, but the Myrtaceae contained 15 of 26 identified Mn-hyperaccumulator plant taxa and had the highest rate of specimens with concentrations above the detection limit. This result aligns with a previous study in New Caledonia (Gei et al. 2020). The Cunoniaceae had the second-highest incidence of specimens exceeding the Mn detection limit, but its metal trait was not limited to Mn, but also Co. This study showed that two of the four Co-hyperaccumulator plants were in the Cunoniaceae (Table 4). The previous study in New Caledonia measured specimens from the Cunoniaceae, but in different genera, and found this family to be the top hyperaccumulator taxon for Mn and Co, which is why we suspected Mn and Co-(hyper)accumulator traits to occur in this family. Together with the measurements of the Cunoniaceae in New Caledonia by Gei et al. (2020), it is likely that Mn and Co-(hyper)accumulator traits are widespread across this family.
Currently, there are five Ni-hyperaccumulator taxa known from Australia, namely, Rostellularia adscendens var. hispida (Acanthaceae) with up to 2190 μg Ni g−1 (Reeves 2003), Pimelea leptospermoides (Thymelaeaceae) with up to 2780 μg Ni g−1 (Reeves et al. 2015), Commelina ensifolia (Commelinaceae) with up to 1490 μg Ni g−1, Stackhousia tryonii (Celastraceae) with up to 41 260 μg Ni g−1, and Hybanthus floribundus (Violaceae) with up to 13 500 μg Ni g−1 (Severne and Brooks 1972; Batianoff et al. 1990; Reeves 2003; Reeves et al. 2015). Four Ni-hyperaccumulator plants from Queensland have previously been reported (Batianoff et al. 2000; Reeves 2003). All of these occur on ultramafic soils. However, in this study, two newly discovered Ni-hyperaccumulating taxa, namely D. oleaster (100–1300 [272] μg g−1 Ni) and A. diversifolia (8000 μg g−1 Ni), were not collected from ultramafic soils. The majority of identified Ni (hyper)accumulators occur in the Celastraceae. The results showed that five of eight genera from the Celastraceae have Co- or Ni-(hyper)accumulative properties, and this suggests that more systematic scanning of all Celastraceae genera may be required to confirm Co- and Ni-(hyper)accumulator properties in the Celastraceae.
Zinc was the second-most detected element in XRF scanned herbarium specimens and this may be attributed to the fact that Zn is more abundant than Co and Ni in soils (Taylor and McLennan 1995). Zinc is required by plants to produce enzymes for energy production, electron transport, chlorophyll biosynthesis, the maintenance of membrane integrity, and antioxidant activity (Dalcorso et al. 2014). Only 20 Zn-hyperaccumulator plant species have been reported globally (Reeves et al. 2018a), including two in Australia, namely, Crotalaria novae-hollandiae (16 200 μg Zn g−1; Tang et al. 2022) and G. fragrantissima (3900 μg Zn g−1); the latter is able to simultaneously co-accumulate up to 13 200 μg Mn g−1, 480 μg Co g−1 and 834 μg Ni g−1; Fernando et al. 2013; Abubakari et al. 2021b). This study found that the Salicaceae had two Zn-hyperaccumulating taxa. A similar study conducted in New Caledonia also encountered Zn hyperaccumulators in the Salicaceae but from different genera (Gei et al. 2020).
The highly unexpected discovery of Y and Se anomalies in the Proteaceae, especially in the genera Austromuellera and Helicia, remains as yet unexplained. With the empirical calibration, this result would have not been reported because it depends on the internal instrument calculations, whereas the procedure used in this study processes the raw spectra recorded by the instrument (Purwadi et al. 2021, 2022). Fresh collections from the field are required to confirm these anomalies by conducting wet chemical analysis to obtain the total concentration of the ionome a dosing trial to assess hyperaccumulating patterns, and surface examination to assess dust contaminations.
A clear trend is observed in the density maps (Figs 11–13) where areas with higher density are close to coastline where rainfall is highest (Fig. S6). However, there is no clear relationship between the total number of specimens collected in an area and the likelihood of hyperaccumulators plants occuring. The most typical soil types in Queensland are Vertosols, covering 36.77% of the State, but the majority of (hyper)accumulator specimens occur on Dermosols, which cover 7.7% of Queensland. A previous study has confirmed the occurrence of hyperaccumulator plants on Dermosols in Queensland (Fernando et al. 2018).
It is important to note that bias occurs in collecting specimens and selecting specimens. As previously shown, the highest density of specimens was closest to the coastline where most people live, the topography is varied and the diversity of vegetation communities is highest. Here, less effort is often required to collect specimens, especially those close to roads, than for specimens from remote locations. The scanning effort was also biased towards families that have a high probability of finding hyperaccumulator plants. As only five hyperaccumulator plant species had been reported before from Australia, this study intended to demonstrate that Australia has more hyperaccumulator plants, and they are waiting to be discovered. Moreover, the results of this study may not reflect (hyper)accumulative properties of all plant species in Queensland, because only a small portion of herbarium collections were scanned. For example, only 636 of 35 864 Myrtaceae specimens held in the Queensland Herbarium were XRF scanned.
Conclusions
Systematic herbarium XRF scanning has demonstrated its usefulness again to uncover metal/metalloid (hyper)accumulating species. The relatively few identified (hyper)accumulator plant species from Australia is probably not due to the fact that they do not exist, but because they have not been discovered yet. This study also revealed Y-(hyper)accumulator plant species that have not reported before either from herbarium XRF scanning or other studies. This result was achieved by employing the new pipeline for XRF data processing of herbarium specimens (Purwadi et al. 2021, 2022), enabling the identification of plants that hyperaccumulate multiple elements, including uncommon elements such as Y and Se.
The analysis of herbarium specimens in this way can identify hyperaccumulator species that may be threatened by mining activities (Whiting et al. 2004; Erskine et al. 2012), bush fires, and land-clearing (Reeves et al. 2018a). Their timely identification may help ensure their survival by developing conservation plans. We hope that this preliminary study will inspire efforts to unlock foliar elemental information from major Australian herbarium collections by using XRF analysis. This is a new value proposition for the continued funding of herbarium collections in Australia and could initiate a range of research opportunities to use these data for future studies of plant adaptation and evolution. When a more complete database of Australian hyperaccumulator plants is produced, the most exceptional species could be targeted for use in a wide variety of purposes, including biofortification and phytoremediation. Given the usefulness of the new procedure, it may be worth re-processing all herbarium XRF scanning data, because, so far, all previous studies used the empirical method to correct Mn, Co, Ni, and Zn concentrations, and may have missed to report other elements such as Y or Se. The reprocessed data are also standardised and may be used to revisit the threshold of hyperaccumulation plants and to study plant species at a global scale.
Data availability
The data that support this study will be shared upon reasonable request to the corresponding author.
Conflicts of interest
The authors declare no conflicts of interest relevant to the content of this paper.
Acknowledgements
Imam Purwadi and Farida Abubakari are the recipients of UQ Graduate School Scholarships (UQGSS) from The University of Queensland. We thank the Director of the Queensland Herbarium for permission to access the collections.
References
Abubakari F, Nkrumah PN, Erskine PD, Brown GK, Fernando DR, Echevarria G, van der Ent A (2021a) Manganese (hyper)accumulation within Australian Denhamia (Celastraceae): an assessment of the trait and manganese accumulation under controlled conditions. Plant and Soil 463, 205-223.
| Crossref | Google Scholar |
Abubakari F, Nkrumah PN, Fernando DR, Brown GK, Erskine PD, Echevarria G, van der Ent A (2021b) Incidence of hyperaccumulation and tissue-level distribution of manganese, cobalt, and zinc in the genus Gossia (Myrtaceae). Metallomics 13, mfab008.
| Crossref | Google Scholar |
Abubakari F, Nkrumah PN, Fernando DR, Erskine PD, van der Ent A (2022) Manganese accumulation and tissue-level distribution in Australian Macadamia (Proteaceae) species. Environmental and Experimental Botany 193, 104668.
| Crossref | Google Scholar |
Australian Bureau of Meteorology (2020) Decadal and multi-decadal rainfall. Available at http://www.bom.gov.au/jsp/ncc/climate_averages/decadal-rainfall/index.jsp?maptype=6&period=7605&product=totals#maps
Baker AJM, Brooks RR (1989) Terrestrial higher plants which hyperaccumulate metallic elements – a review of their distribution, ecology and phytochemistry. Biorecovery 1, 81-126.
| Google Scholar |
Batianoff GN, Reeves RD, Specht RL (1990) Stackhousia tryonii Bailey: a nickel-accumulating serpentine-endemic species of Central Queensland. Australian Journal of Botany 38, 121-130.
| Crossref | Google Scholar |
Batianoff GN, Neldner VJ, Singh S (2000) Vascular plant census and floristic analysis of serpentine landscapes in central Queensland. Proceedings of the Royal Society of Queensland 109, 1-30.
| Google Scholar |
Belloeil C, Jouannais P, Malfaisan C, Reyes Fernández R, Lopez S, Navarrete Gutierrez DM, Maeder-Pras S, Villanueva P, Tisserand R, Gallopin M, Alfonso-Gonzalez D, Fuentes Marrero IM, Muller S, Invernon V, Pillon Y, Echevarria G, Berazaín Iturralde R, Merlot S (2021) The X-ray fluorescence screening of multiple elements in herbarium specimens from the Neotropical region reveals new records of metal accumulation in plants. Metallomics 13, mfab045.
| Crossref | Google Scholar |
Broadhurst L, Coates D (2017) Plant conservation in Australia: current directions and future challenges. Plant Diversity 39, 348-356.
| Crossref | Google Scholar |
Brown GK (2021) Introduction to the census of the Queensland flora 2021. (Queensland Government: Brisbane, Qld, Australia) Available at https://www.data.qld.gov.au/dataset/census-of-the-queensland-flora-2020
Currie LA (1968) Limits for qualitative detection and quantitative determination. Application to radiochemistry. Analytical Chemistry 40, 586-593.
| Crossref | Google Scholar |
Dalcorso G, Manara A, Piasentin S, Furini A (2014) Nutrient metal elements in plants. Metallomics 6, 1770-1788.
| Crossref | Google Scholar |
Do C, Abubakari F, Remigio AC, Brown GK, Casey LW, Burtet-Sarramegna V, Gei V, Erskine PD, van der Ent A (2020) A preliminary survey of nickel, manganese and zinc (hyper)accumulation in the flora of Papua New Guinea from herbarium X-ray fluorescence scanning. Chemoecology 30, 1-13.
| Crossref | Google Scholar |
Edwards NP, Manning PL, Bergmann U, Larson PL, Van Dongen BE, Sellers WI, Webb SM, Sokaras D, Alonso-Mori R, Ignatyev K, Barden HE, Van Veelen A, Anné J, Egerton VM, Wogelius RA (2014) Leaf metallome preserved over 50 million years. Metallomics 6, 774-782.
| Crossref | Google Scholar |
Erskine P, van der Ent A, Fletcher A (2012) Sustaining metal-loving plants in mining regions. Science 337, 1172-1173.
| Crossref | Google Scholar |
Fernando DR, Marshall AT, Forster PI, Hoebee SE, Siegele R (2013) Multiple metal accumulation within a manganese-specific genus. American Journal of Botany 100, 690-700.
| Crossref | Google Scholar |
Fernando DR, Marshall AT, Green PT (2018) Cellular ion interactions in two endemic tropical rainforest species of a novel metallophytic tree genus. Tree Physiology 38, 119-128.
| Crossref | Google Scholar |
Gei V, Isnard S, Erskine PD, Echevarria G, Fogliani B, Jaffré T, Van Der Ent A (2020) A systematic assessment of the occurrence of trace element hyperaccumulation in the flora of New Caledonia. Botanical Journal of the Linnean Society 194, 1-22.
| Crossref | Google Scholar |
Greve M, Lykke AM, Fagg CW, Gereau RE, Lewis GP, Marchant R, Marshall AR, Ndayishimiye J, Bogaert J, Svenning J-C (2016) Realising the potential of herbarium records for conservation biology. South African Journal of Botany 105, 317-323.
| Crossref | Google Scholar |
Heberling JM, Prather LA, Tonsor SJ (2019) The changing uses of herbarium data in an era of global change: an overview using automated content analysis. BioScience 69, 812-822.
| Crossref | Google Scholar |
Kalnicky DJ, Singhvi R (2001) Field portable XRF analysis of environmental samples. Journal of Hazardous Materials 83, 93-122.
| Crossref | Google Scholar |
Krämer U, Talke IN, Hanikenne M (2007) Transition metal transport. FEBS Letters 581, 2263-2272.
| Crossref | Google Scholar |
Lahner B, Gong J, Mahmoudian M, Smith EL, Abid KB, Rogers EE, Guerinot ML, Harper JF, Ward JM, McIntyre L, Schroeder JI, Salt DE (2003) Genomic scale profiling of nutrient and trace elements in Arabidopsis thaliana. Nature Biotechnology 21, 1215-1221.
| Crossref | Google Scholar |
McCartha GL, Taylor CM, van der Ent A, Echevarria G, Navarrete Gutiérrez DM, Pollard AJ (2019) Phylogenetic and geographic distribution of nickel hyperaccumulation in neotropical Psychotria. American Journal of Botany 106, 1377-1385.
| Crossref | Google Scholar |
Peñuelas J, Fernández-Martínez M, Ciais P, Jou D, Piao S, Obersteiner M, Vicca S, Janssens IA, Sardans J (2019) The bioelements, the elementome, and the biogeochemical niche. Ecology 100, e02652.
| Crossref | Google Scholar |
Pollard AJ, Powell KD, Harper FA, Smith JAC (2002) The genetic basis of metal hyperaccumulation in plants. Critical Reviews in Plant Sciences 21, 539-566.
| Crossref | Google Scholar |
Purwadi I, Gei V, Echevarria G, Erskine PD, Mesjasz-Przybyłowicz J, Przybyłowicz WJ, van der Ent A (2021) Tools for the discovery of hyperaccumulator plant species in the field and in the herbarium. In ‘Agromining: farming for metals’. (Eds A van der Ent, AJ Baker, G Echevarria, MO Simonnot, JL Morel) pp. 183–195. (Springer) doi:10.1007/978-3-030-58904-2_9
Purwadi I, Casey LW, Ryan CG, Erskine PD, van der Ent A (2022) X-ray fluorescence spectroscopy for analysis of the Ionome of herbarium specimens. Plant Methods 18, 139. doi:10.1186/s13007-022-00958-z
Reeves RD (2003) Tropical hyperaccumulators of metals and their potential for phytoextraction. Plant and Soil 249, 57-65.
| Crossref | Google Scholar |
Reeves RD, Laidlaw WS, Doronila A, Baker AJM, Batianoff (the late) GN (2015) Erratic hyperaccumulation of nickel, with particular reference to the Queensland serpentine endemic Pimelea leptospermoides. Australian Journal of Botany 63, 119-127.
| Crossref | Google Scholar |
Reeves RD, Baker AJM, Jaffré T, Erskine PD, Echevarria G, van der Ent A (2018a) A global database for plants that hyperaccumulate metal and metalloid trace elements. New Phytologist 218, 407-411.
| Crossref | Google Scholar |
Reeves RD, van der Ent A, Baker AJM (2018b) Global distribution and ecology of hyperaccumulator plants. In ‘Agromining: farming for metals’. (Eds A Van Der Ent, G Echevarria, A Baker, J Morel) pp. 75–92. (Springer: Cham, Switzerland) doi:10.1007/978-3-319-61899-9_5
Ryan CG (2000) Quantitative trace element imaging using PIXE and the nuclear microprobe. International Journal of Imaging Systems and Technology 11, 219-230.
| Crossref | Google Scholar |
Ryan CG, Clayton E, Griffin WL, Sie SH, Cousens DR (1988) SNIP, a statistics-sensitive background treatment for the quantitative analysis of PIXE spectra in geoscience applications. Nuclear Instruments and Methods in Physics Research Section B: Beam Interactions with Materials and Atoms 34, 396-402.
| Crossref | Google Scholar |
Ryan CG, Etschmann BE, Vogt S, Maser J, Harland CL, Van Achterbergh E, Legnini D (2005) Nuclear microprobe – Synchrotron synergy: towards integrated quantitative real-time elemental imaging using PIXE and SXRF. Nuclear Instruments and Methods in Physics Research Section B: Beam Interactions with Materials and Atoms 231, 183-188.
| Crossref | Google Scholar |
Ryan CG, Laird JS, Fisher LA, Kirkham R, Moorhead GF (2015) Improved dynamic analysis method for quantitative PIXE and SXRF element imaging of complex materials. Nuclear Instruments and Methods in Physics Research Section B: Beam Interactions with Materials and Atoms 363, 42-47.
| Crossref | Google Scholar |
Severne BC, Brooks RR (1972) A nickel-accumulating plant from Western Australia. Planta 103, 91-94.
| Crossref | Google Scholar |
Sherman J (1955) The theoretical derivation of fluorescent X-ray intensities from mixtures. Spectrochimica Acta 7, 283-306.
| Crossref | Google Scholar |
Souza ENF, Hawkins JA (2017) Comparison of herbarium label data and published medicinal use: herbaria as an underutilized source of ethnobotanical information. Economic Botany 71, 1-12.
| Crossref | Google Scholar |
Tang RH, Erskine PD, Nkrumah PN, Echevarria G, van der Ent A (2022) Soil–plant relationships of metallophytes of the zinc–lead–copper Dugald River gossan, Queensland, Australia. Plant and Soil 471, 227-245.
| Crossref | Google Scholar |
Taylor SR, McLennan SM (1995) The geochemical evolution of the continental crust. Reviews of Geophysics 33, 241-265.
| Crossref | Google Scholar |
van der Ent A, Baker AJM, Reeves RD, Pollard AJ, Schat H (2013) Hyperaccumulators of metal and metalloid trace elements: facts and fiction. Plant and Soil 362, 319-334.
| Crossref | Google Scholar |
van der Ent A, Jaffré T, L’Huillier L, Gibson N, Reeves RD (2015) The flora of ultramafic soils in the Australia–Pacific region: state of knowledge and research priorities. Australian Journal of Botany 63, 173-190.
| Crossref | Google Scholar |
van der Ent A, Echevarria G, Pollard AJ, Erskine PD (2019a) X-Ray fluorescence ionomics of herbarium collections. Scientific Reports 9, 4746.
| Crossref | Google Scholar |
van der Ent A, Ocenar A, Tisserand R, Sugau JB, Echevarria G, Erskine PD (2019b) Herbarium X-ray fluorescence screening for nickel, cobalt and manganese hyperaccumulator plants in the flora of Sabah (Malaysia, Borneo Island). Journal of Geochemical Exploration 202, 49-58.
| Crossref | Google Scholar |
van der Ent A, Echevarria G, Nkrumah PN, Erskine PD (2020) Frequency distribution of foliar nickel is bimodal in the ultramafic flora of Kinabalu Park (Sabah, Malaysia). Annals of Botany 126, 1017-1027.
| Crossref | Google Scholar |
Whiting SN, Reeves RD, Richards D, Johnson MS, Cooke JA, Malaisse F, Paton A, Smith JAC, Angle JS, Chaney RL, Ginocchio R, Jaffré T, Johns R, Mcintyre T, Purvis OW, Salt DE, Schat H, Zhao FJ, Baker AJM (2004) Research priorities for conservation of metallophyte biodiversity and their potential for restoration and site remediation. Restoration Ecology 12, 106-116.
| Crossref | Google Scholar |


