

Regional heat stress maps for grazing dairy cows in New Zealand under climate change
S. J. R. Woodward A * , P. C. Beukes A , J. P. Edwards B , K. J. Verhoek A , J. G. Jago A and C. Zammit C
A
B
C
Abstract
For dairy cows housed indoors, ambient temperature and relative humidity are key drivers of heat stress, whereas for cows kept outdoors, solar radiation and wind speed are also important. Solar radiation directly increases the heat load on cows, whereas wind speed affects their ability to dissipate heat through convection and evaporation.
We aimed to determine whether climate-driven changes in these variables affect heat stress risk where cows are outdoors during summer and shoulder seasons, particularly in pasture-based farming systems such as in New Zealand. Understanding outdoor-specific factors is crucial for accurately assessing and mitigating heat stress in grazing dairy cattle, because their management needs differ substantially from those in housed systems.
Using daily climate projection data from 2006 to 2098, peak daily values of the temperature–humidity index (THI) of Thom and the grazing heat-load index (GHLI) of Bryant were calculated and used to map predicted changes in both the annual (June–May) number of days with heat stress risk and also the annual accumulated heat stress exposure (the sum of effective degrees Celsius above the threshold) for dairy production regions of New Zealand.
The results illustrated the limitations of using THI in the context of outdoor use, where solar radiation and wind speed are shown to be more important than relative humidity. The GHLI predicted that the risk of heat stress is already high in the Waikato (69 days), Bay of Plenty (69 days) and Canterbury (80 days) regions in the 2020s. Canterbury was also notable for having high heat stress exposure within day compared with other regions (i.e. heat stress days were particularly intense), attributable to the combined effect of high air temperatures, high solar radiation and low wind speeds.
According to climate projections, regions already experiencing high numbers of heat stress risk days and heat stress exposure in the 2020s will experience the greatest increases in heat stress risk to the 2050s. However, dramatic increases in the number of heat stress days are not anticipated.
This allows research and development to focus on mitigation practices in these regions where dairy farming systems must adapt to a changing climate. Mitigation strategies may include provision of shade, access to sprinklers, genetic selection for heat stress resilience, modifying feeding regimes to reduce heat load, or development of new solutions and technologies.
Keywords: global warming, grazing heat load index (GHLI), grazing livestock, pasture-based systems, regional spatial analysis, solar radiation, temperature–humidity index (THI), wind speed.
Introduction
In a changing climate, grazing animals are increasingly exposed to extreme climate events, which may adversely affect their health, welfare, and productivity (Rojas-Downing et al. 2017; Schütz 2018). Owing to their naturally high metabolic load, lactating dairy cows are particularly susceptible to heat stress, and associated welfare concerns (Cartwright et al. 2023). Economic impacts from reduced milk production, reproductive performance and resistance to disease are also high (Cartwright et al. 2023). Whereas most studies have focused on housed animals (e.g. West 2003; Wheelock et al. 2010; Gernand et al. 2019; Chen et al. 2024), studies of grazing cows have also found that heat stress affects physiological indicators such as respiration rate and panting score (Bryant et al. 2023), as well as daily milk production, milk temperature, milk protein, and concentrate intake (Bryant et al. 2007; Osei-Amponsah et al. 2020). The ability to predict the future incidence and prevalence of dairy cow heat stress events could provide useful information to support development of and investment into tactical and strategic management interventions, such as providing shade or sprinklers to cows (Schütz 2018; Neves et al. 2022; Thornton et al. 2022), genetic selection for heat-resilient traits, modified milking or feeding regimes (Rojas-Downing et al. 2017; Schütz et al. 2023) and novel solutions.
Predicting future heat stress risk requires a model to generate future climate projections and another model to infer heat stress risk from these climate projections. Earlier work on heat stress in dairy cows has focused on the temperature–humidity index (THI) as the model to infer heat stress risk (Dikman and Hansen 2009; Polsky and von Keyserlingk 2017; Schütz 2018; Shu et al. 2021), the original version of which was proposed by Thom (1959) to predict human discomfort. Despite its continuing popularity, the lack of solar radiation and wind speed in the THI means that it may not be applicable for outdoor animals (Mader et al. 2006; Gaughan et al. 2008; Lees et al. 2018; Cowan et al. 2024), particularly grazing dairy cows (Herbut et al. 2018). A number of alternative indices have subsequently been developed to address these shortcomings, and have been reviewed for dairy cows by Herbut et al. (2018), Yan et al. (2021a) and Bryant et al. (2023). Yan et al. (2021a) demonstrated that THI performs relatively poorly compared with other indices when it comes to predicting animal responses, even for cows housed in free-stall barns. For dairy cows grazing outdoors, Bryant et al. (2023) found no indices specifically suited for extensively grazed cattle, and subsequently developed the grazing heat-load index (GHLI) to better represent heat stress risk for grazing animals by using observed respiration rate, panting score, and drooling as heat stress indicators. The GHLI is based on air temperature, solar radiation and wind speed. The option for including relative humidity was also tested; however, this did not improve predictive performance.
To our knowledge, the application of heat-load indices to predict heat stress risk on the basis of climate projection data beyond the current day has not previously been attempted for the dairying regions of New Zealand. In agreement with global trends, the impacts of climate change in New Zealand are already apparent in the form of rising average air temperatures and changing rainfall patterns (Ministry for the Environment 2023). There is a long-term warming trend projected for New Zealand, with average increases of about 0.8°C by 2040, 1.4°C by 2090, and 1.6°C by 2110, relative to the 1986–2005 period across a range of climate scenarios (Ministry for the Environment 2018). It is likely that winter and spring rainfall will increase in the west of both the North and South Islands, with drier conditions in the east and north. Such changes are likely to be spatially variable across regions. New Zealand’s position in the mid-latitude westerly wind belt means that the main climatic influences come from changes in wind flow, and its rugged and mountainous terrain that gives rise to considerable regional and localised climate variability (Ministry for the Environment 2018; Beukes et al. 2021; Glassey et al. 2021; Babylon et al. 2022). Understanding this variability is crucial to predicting differences in heat stress risk faced by dairy regions with different weather generation processes.
The aim of this study was to use published climate predictions and heat stress indices to predict likely changes in heat stress risk in dairy farming regions of New Zealand, enabling prioritisation of investment in research investigating tactical and strategic management interventions to support animal health, welfare, and productivity by minimising the impacts of heat stress.
Materials and methods
National climate projections
Climate projections are computer simulations of future climate that are based on future scenarios of greenhouse-gas concentrations. Four future scenarios called ‘Representative Concentration Pathways’ (RCPs) were developed for the Fifth Assessment Report of the Intergovernmental Panel on Climate Change (IPCC 2014). RCPs are ‘plausible descriptions of how the future may evolve with respect to a range of variables, including socio-economic change, technological change, energy and land use, and emissions of greenhouse gases and air pollutants’ (van Vuuren et al. 2011, p. 6). In order of increasing warming, the four RCPs are denoted as RCP 2.6, RCP 4.5, RCP 6.0 and RCP 8.5.
In New Zealand, six different Global Climate Models (GCMs) are used to generate future climate projections for these RCPs (Ministry for the Environment 2018). These projections are then downscaled onto a 5 × 5 km grid covering New Zealand as described by New Zealand’s National Institute of Water and Atmospheric Research (NIWA 2018, 2023). The effect of greenhouse-gas concentrations on climatic variables is projected to vary with region, but in general, average air temperatures are expected to increase, with larger increases expected under higher greenhouse-gas concentrations, especially during the summer and autumn seasons and at higher elevations, with an increase in hot days (maximum air temperature of 25°C or higher) and decreases in relative humidity (NIWA 2018, 2023).
In the current study, NIWA climate projections for the years 2006–2098 were used in the calculations of the heat stress indices, which is the standard period currently used for climate projections in New Zealand (NIWA 2023). The relevant variables include minimum and maximum daily air temperature (°C) at 2 m above ground, mean daily relative humidity (%) at 2 m, mean daily downward solar radiation (MJ/m2.day) at the ground surface, and mean daily wind speed (m/s) at 10 m (NIWA 2023). Wind speed at 2 m can be estimated as approximately 0.75 of the wind speed at 10 m (Allen et al. 1998). All indices and metrics were calculated for each of the four RCP × six GCM combinations separately.
Geographic extent
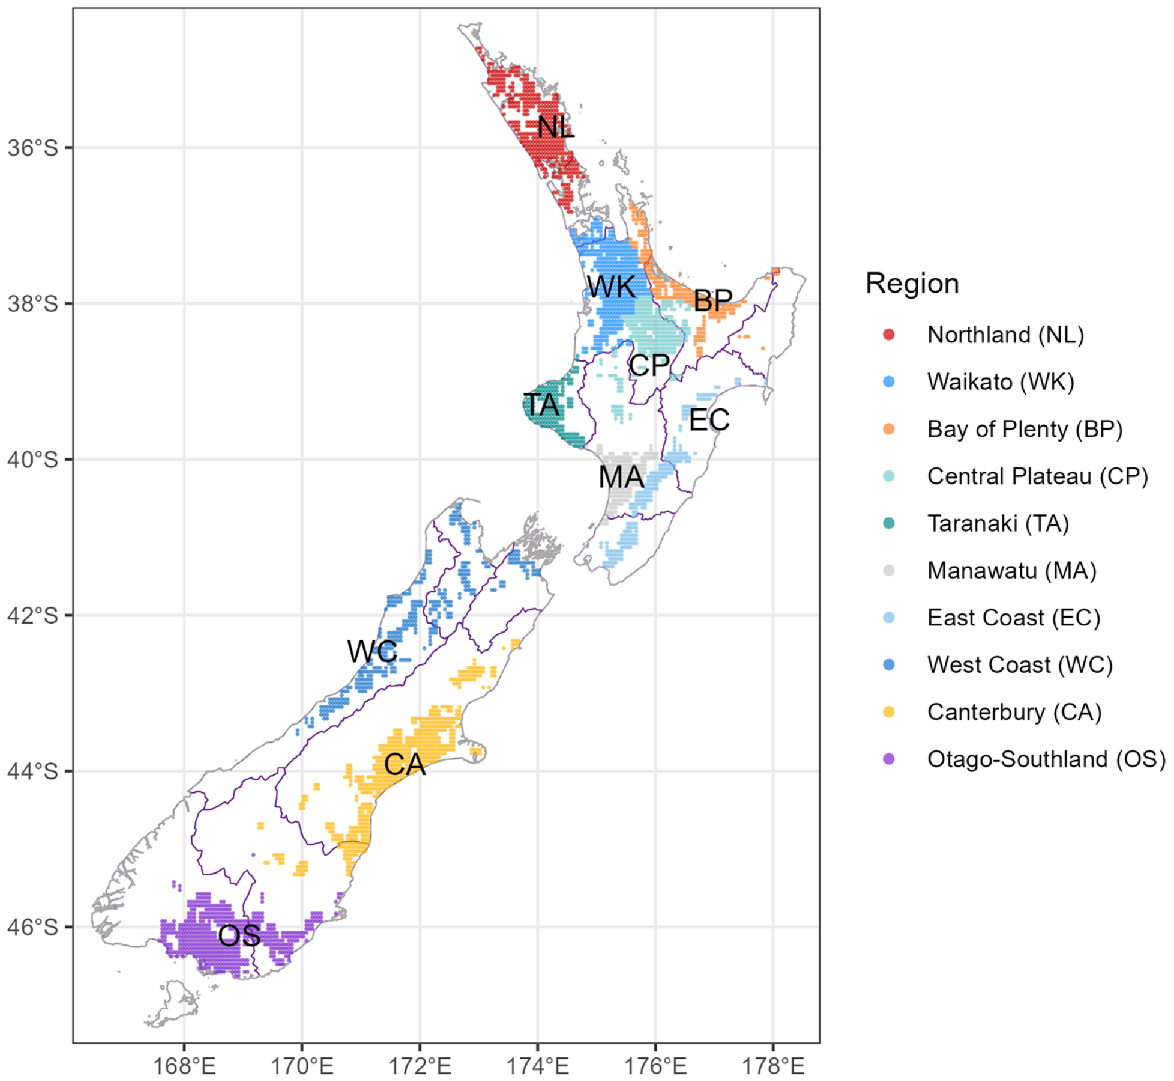
New Zealand’s climate is dominated by westerly flow from the Tasman Sea passing over central mountain ranges that run north–south (NIWA 2018), resulting in generally higher rainfall and relative humidity in the west (Northland, Waikato, Taranaki, and the West Coast), contrasting with lower rainfall and relative humidity, as well as higher air temperatures and solar radiation, in the east (Bay of Plenty, East Coast and Canterbury). Wind speed is highest in coastal areas and lower inland, although higher elevations may also experience windy conditions. For this study, points from the 5 × 5 km grid were chosen that were within 5 km of existing dairy farms in 2021, as derived from DairyNZ levy milksolids database. This yielded a total of 3278 grid points in the primary dairy regions of New Zealand (Fig. 1). These regions were aligned with New Zealand’s main climatic zones described by Singers and Rogers (2014), with Northland (NL), Waikato (WK) and Bay of Plenty (BP) dairy areas being classed as warm-subhumid, Central Plateau (CP), Taranaki (TA) and Manawatu (MA) as mild-subhumid, East Coast (EC) and Canterbury (CA) as mild-semiarid, West Coast (WC) as mild-humid, and Otago-Southland (OS) as cool-subhumid. Note that in later figures, several subregions are labelled as follows: Central Plateau is subdivided into Central Plateau (CP) and Rotorua (RO), East Coast is subdivided into Hawke’s Bay (HB) and Wairarapa (WR), West Coast is subdivided into Nelson (NN) and West Coast (WC), and Canterbury is subdivided into North Canterbury (NC), Mid Canterbury (MC), South Canterbury (SC) and Central Otago (CO).
Heat stress predictions
Several indices have been proposed to predict heat stress conditions for dairy cows (Herbut et al. 2018; Lees et al. 2018; Yan et al. 2021a). THI is most widely used but has published limitations, namely neglecting factors such as solar radiation and wind speed, which are particularly important for grazing animals (Mader et al. 2006; Herbut et al. 2018; Shu et al. 2021). THI at a point in time is typically calculated as
where T is the air temperature (°C) and RH is the relative humidity (%) (National Research Council 1971). Various THI thresholds have been proposed to indicate heat stress conditions relevant to the different physiological responses of cows of different breeds in different contexts (Bryant et al. 2007; Schütz 2018; Gernand et al. 2019; Shu et al. 2021; Cartwright et al. 2023). A generic approach is to use the threshold THI of >72 to indicate heat stress. This threshold was originally proposed for indoor-housed, high-producing dairy cows in southern USA (Armstrong 1994; Osei-Amponsah et al. 2020). However, Bryant et al. (2007) showed that lower-yielding, New Zealand Holstein-Friesian/Jersey crossbreed cows grazing outdoors are relatively more sensitive to heat stress and suggested that milk production begins to decline above a threshold of THI > 69. This breed category comprises 60% of the New Zealand dairy herd (DairyNZ 2023). Therefore, the threshold of THI > 69 was used in this current study.
Recently, Bryant et al. (2023) proposed a grazing heat-load index (GHLI) to account for the effects of solar radiation and wind speed on elevated respiration rate in grazing dairy cows in New Zealand. The GHLI index was developed from five summer respiration-rate studies previously conducted in the Waikato region of New Zealand and was more accurate than other published indices in that environment (Bryant et al. 2023). GHLI, which is in units of breaths per minute, was found to be more highly correlated than THI to physiological responses to heat stress (respiration rate, rumen temperature) measured in grazing dairy cows in Waikato (Bryant et al. 2023) and Northland (Woodward et al. 2024). Air temperature, solar radiation, and wind speed were identified as being the most important explanatory variables for respiration rate, and inclusion of relative humidity did not improve predictive accuracy. GHLI at a point in time is calculated as:
where T is the air temperature (°C), WS is the wind speed (m/s) and SR is the total solar radiation (expressed in MJ/m2.h), all averaged over the previous hour. Note that in Bryant et al. (2023), WS was in km/h, but incorrectly reported as m/s (J. R. Bryant, pers. comm.). This equation was developed using data collected between 12:00 hours and 15:00 hours on summer afternoons (December–February).
Bryant et al. (2023) observed that panting scores and drooling began to increase when GHLI was >55. This threshold is consistent with the respiration rates measured by Schütz et al. (2010) for grazing cows with or without access to shade as air temperatures increased. Therefore, the GHLI threshold of >55 was adopted in the current study to indicate heat stress conditions.
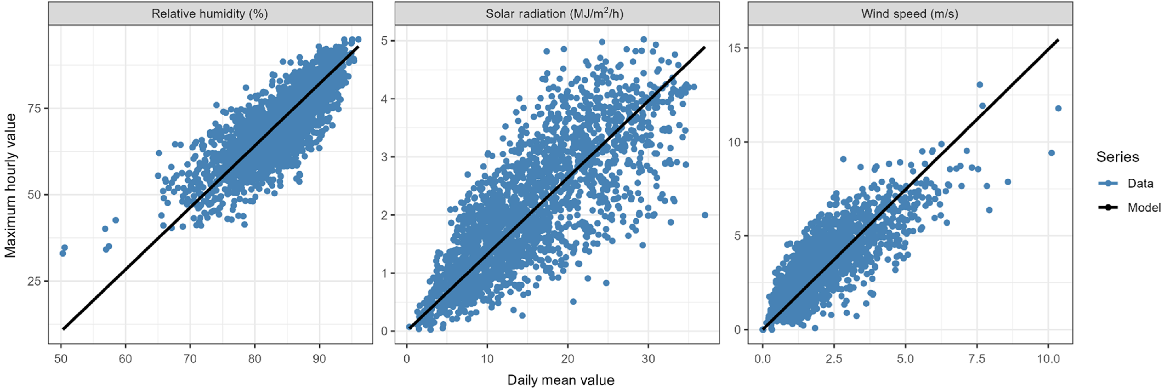
The incidence and severity of heat stress in cows is greatest in the afternoon hours, when air temperature and solar radiation are at their maximum (Shrestha et al. 2019; Soneye et al. 2019; Bryant et al. 2023), wind speed also tends to be high, and relative humidity is typically low (Yan et al. 2021b; Wandayantolis et al. 2023); other than air temperature, the climate projection data provides only daily averages for most variables, and, therefore, lacks granularity to summarise data according to time of day. Estimates of the daily maximum values of THI and GHLI calculated using these average values are likely to be inaccurate.
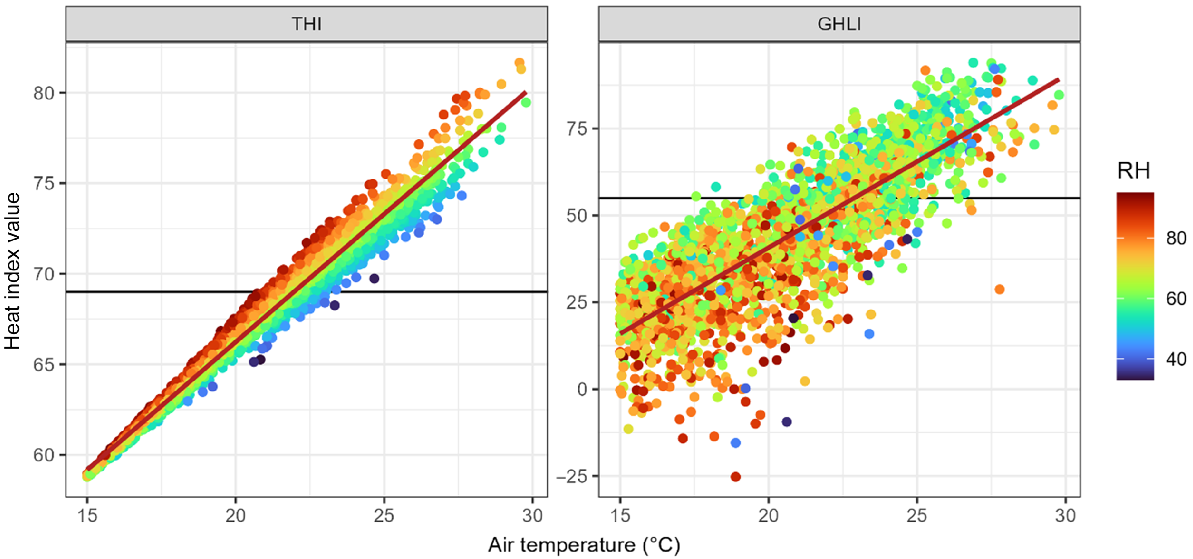
Hourly climate data from Northland (2021–2023; Woodward et al. 2024) and Waikato (2021–2022) were used to explore the relationship between afternoon values and daily average values of these variables. Fig. 2 shows the error from using daily average relative humidity to calculate THI or daily average solar radiation and wind speed to calculate GHLI compared with the maximum calculated using hourly data. THI predictions based on mean daily relative humidity tend to approximate THI predictions using maximum hourly values well, whereas GHLI predictions based on mean daily solar radiation and wind speed are poor.
Accuracy of using daily average relative humidity to calculate daily maximum THI or daily average solar radiation and wind speed to calculate daily maximum GHLI (x-axis), compared with values calculated from hourly data (y-axis).

To derive accurate estimates of the daily heat stress indices, we required estimates of relative humidity, solar radiation and wind speed that coincided with the time of daily maximum air temperature. On the basis of the previously mentioned hourly data, the following models were developed to estimate afternoon values (RH, WS, SR that correspond to the maximum daily air temperature, T) from daily average values (RHav, WSav and SRav):
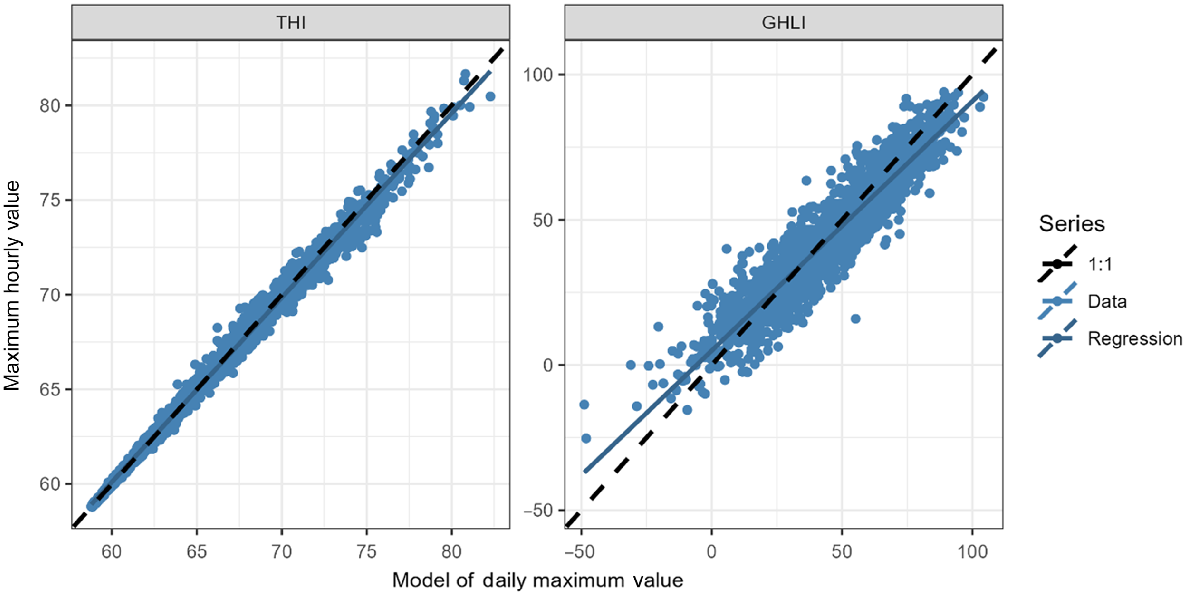
where BIAS is the mean difference between the model and the data, RMSE is the standard deviation of residuals, and R2 is the proportion of variation in the data explained by the model. Note that SRav has units of MJ/m2.day whereas SR has units of MJ/m2.h. The measured hourly weather data and the derived daily models are compared in Fig. 3, showing that the models are linear and unbiased. These estimates were used alongside daily maximum air temperature (T) to calculate the peak afternoon heat stress indices for each day of the climate projections. When the daily peak THI and GHLI were calculated using this approach, and compared with the peak values calculated hourly for the historical Northland and Waikato data, there was excellent correspondence for both THI (BIAS = 0.08, RMSE = 0.44, R2 = 0.99) and GHLI (BIAS = −1.40, RMSE = 7.90, R2 = 0.85; Fig. 4). This shows that daily average weather data can be used to accurately estimate daily maximum values of THI and GHLI for Northland and Waikato. We assume that the same relationships hold for the rest of New Zealand. Future work should validate these equations for a wider range of sites.
Linear models to estimate the ‘maximum hourly value’ (defined as the hour of maximum air tempertuare on each day) of climate variables from daily mean values. Equations and r-squared values are given in the text. Note that hourly and daily values of solar radiation are given in MJ/m2.h and MJ/m2.day respectively.
Validation of the approach for calculating daily maximum heat stress index value from daily mean weather data. The y-axis is based on hourly weather data from three New Zealand sites. ‘Maximum hourly value’ of THI and GHLI is calculated directly from hourly weather data. The x-axis, ‘Model of daily maximum value’, is calculated from daily maximum air temperature and daily mean relative humidity, solar radation and wind speed, as described in the text.
Using this approach, peak daily THI and GHLI were calculated by NIWA for the daily climate projections for each of the locations shown in Fig. 1 from 2006 to 2098 for the four RCPs and the six GCMs. The results were uploaded to a Snowflake database (Snowflake Inc., Bozeman, MT, USA) and analysed using the dbplyr package (ver. 2.5.0; https://dbplyr.tidyverse.org) in R (ver. 4.3.0; R Core Team 2023). Plots were produced using the ggplot2 (ver. 3.5.1; https://ggplot2.tidyverse.org), sf (ver. 1.0-19; https://r-spatial.github.io/sf/) and viridis (ver. 0.6.5; https://sjmgarnier.github.io/viridis/) packages in R.
For each location, the THI and GHLI heat stress indices were used to calculate the number of ‘heat stress risk days’ in each farming season, i.e. the number of days in which the index exceeded the threshold of THI > 69 or GHLI > 55 respectively, between 1 June and the following 31 May. The total exceedance above the threshold for each farming season (the ‘heat stress exposure’) was also calculated using GHLI only and converted to units of effective degrees Celsius (by dividing by 4.21, which is the coefficient of T in Eqn 2 for GHLI). This was undertaken to express the exceedance in familiar units. The average heat stress exposure per heat stress risk day (effective degrees Celsius) was also calculated for each season (1 June to 31 May).
Because of the very large quantity of prediction data generated (3287 locations, six Global Circulation Models, four Representative Concentration Pathways, years 2006–2098), it was necessary to focus on the practical questions of interest. The aim of this study was to ascertain the current and future heat stress risk to dairy cows in different regions of New Zealand.
The number of heat stress risk days and total heat stress exposure were first calculated for each farming season, for each location, GCM and RCP. Average values were then calculated for each decade. The predictions for the 2020s decade were used to represent current conditions, and the predictions for the 2050s decade were used to represent future conditions. This mid-century time point was selected because it was considered close enough for the farming sector to consider in their long-term strategic planning. The RCP 6.0 pathway was used to represent a likely climate scenario in which greenhouse-gas concentrations stabilise slowly as a result of weak climate policies (van Vuuren et al. 2011; Hausfather 2019; Hausfather and Peters 2020). Predictions were finally averaged across the six GCMs to determine an expected value for each output. The variation between the GCMs was also assessed. These results were used to generate time series of regional trends. These series highlight differences in current and projected heat stress risk among regions. Additionally, maps were generated to show existing and future heat stress hotspots, as well as locations where the prevalence and severity of heat stress are predicted to remain relatively stable in the future.
Results
Index comparison for current state
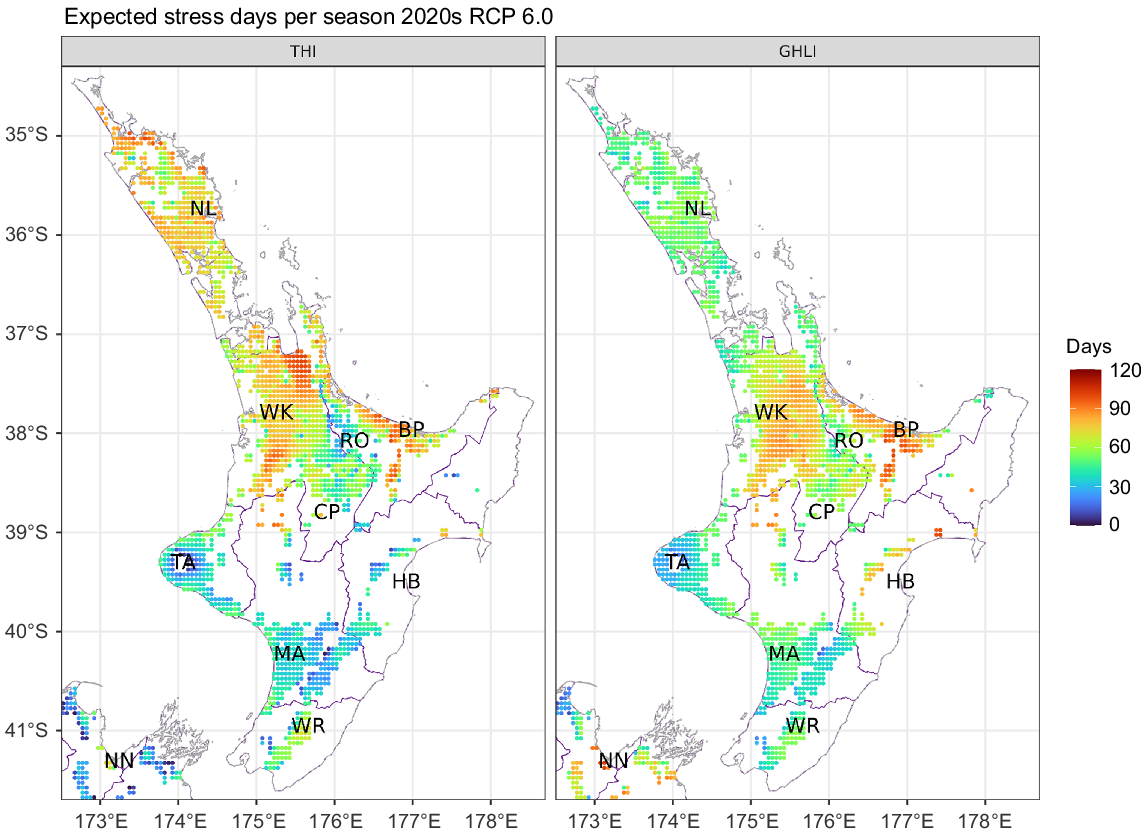
The numbers of heat stress risk days per season predicted using THI and GHLI are shown in Figs 5 and 6 for the North Island and South Island respectively, for the current period (2020s) for RCP 6.0 (2020s results are similar across all RCPs). There were notable differences in the spatial patterns of heat stress risk days between the indices. Most notably, THI predicted higher numbers of heat stress days in Northland (NL) and lower numbers in Hawke’s Bay (HB) compared with GHLI predictions (Fig. 6). Although Northland has moderate relative humidity, solar radiation is low (presumably because of high cloud cover; maps of average weather focusing on days when T > 15°C are included in Supplementary Figs S1 and S2). By contrast, although Hawke’s Bay has lower than average relative humidity, solar radiation is extremely high because of its predominantly clear skies. The importance of solar radiation is not accounted for in THI; therefore, the GHLI results are likely to be a better representation of heat stress conditions experienced by grazing cows. Similar differences can be seen in the South Island, where THI predicted low numbers of heat stress days in Nelson (NN), Canterbury (NC, MC and SC) and Central Otago (CO) compared with GHLI. The THI predictions reflect Nelson, Canterbury, and Central Otago’s relatively low relative humidity. However, solar radiation is extremely high in these regions. These results suggest that THI could misrepresent the heat stress risk for grazing dairy cows and may be less applicable for outdoor use.
Current average heat stress risk per season (days) for the North Island calculated using THI of >69 and GHLI of >55 for the 2020s under RCP 6.0. Nine regions are represented, including Northland (NL), Waikato (WK), Bay of Plenty (BP), Rotorua (RO), Central Plateau (CP), Taranaki (TA), Manatwau (MA), Hawke’s Bay (HB) and Wairarapa (WR).
Current average heat stress risk per season (days) for the South Island calculated using THI of >69 and GHLI of >55 for the 2020s under RCP 6.0. Seven regions are represented, including Nelson (NN), West Coast (WC), North Canterbury (NC), Mid Canterbury (MC), South Canterbury (SC), Central Otago (CO) and Otago-Southland (OS).
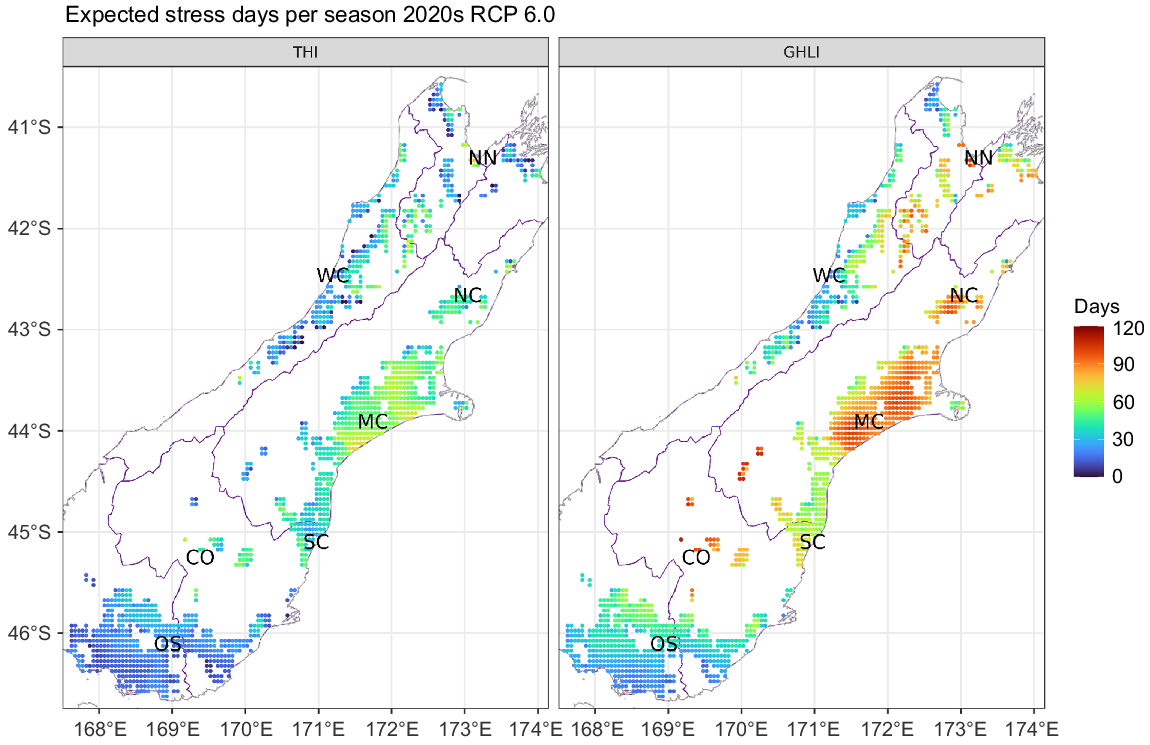
Heat stress risk days (GHLI > 55) per season are estimated to be more than 65 in the Waikato (WK), the Bay of Plenty (BP), and in Canterbury (NC, MC, CO, but not SC) in the current 2020s period (Supplementary Table S1). Parts of Hawke’s Bay (HB) and Nelson (NN) are also likely to experience high numbers of heat stress risk days. By contrast, areas of higher altitude in the North Island such as Taranaki (TA) and eastern Manawatu (MA) are estimated to experience fewer than 40 heat stress risk days per year. In the South Island, parts of the West Coast (WC) and Otago-Southland coastal areas, which are relatively humid and cloudy, are predicted to experience fewer than 40 heat stress risk days per year.
Suitability of THI
The relationship between the heat stress indices and air temperature for the Northland and Waikato weather data is explored in Fig. 7. THI is approximately linear with T and positively dependent on RH (Eqn 1). By contrast, although GHLI also shows a linear dependence on T (Eqn 2), the correlation with RH is negative; higher values of GHLI are more commonly associated with a low RH. The reason for this is that GHLI was developed using data from grazing dairy cows (Bryant et al. 2023), for whom heat stress is positively correlated with SR (Eqn 2), which tends to be negatively correlated with RH. This strengthens the suggestion that THI may be a less appropriate predictor of heat stress in grazing dairy cows than is GHLI. Similarly, THI has also been found to be less applicable for cattle in unshaded feedlots (Mader et al. 1997, 2006). Further results are therefore presented for GHLI only.
Regional trends
Regional trends in the expected number of heat stress risk days and the average daily heat stress exposure (using GHLI of >55) per season are shown for RCP 6.0 in Fig. 8. Trends in these variables for all RCPs are given in Supplementary Fig. S3.
Model-predicted expected heat stress days per season (days) and expected heat stress exposure on heat stress risk days (effective °C), calculated when GHLI is >55 under RCP 6.0. Dots show annual values, and lines show smoothed trends (estimated using the ‘loess’ algorithm with a span of 1.0).
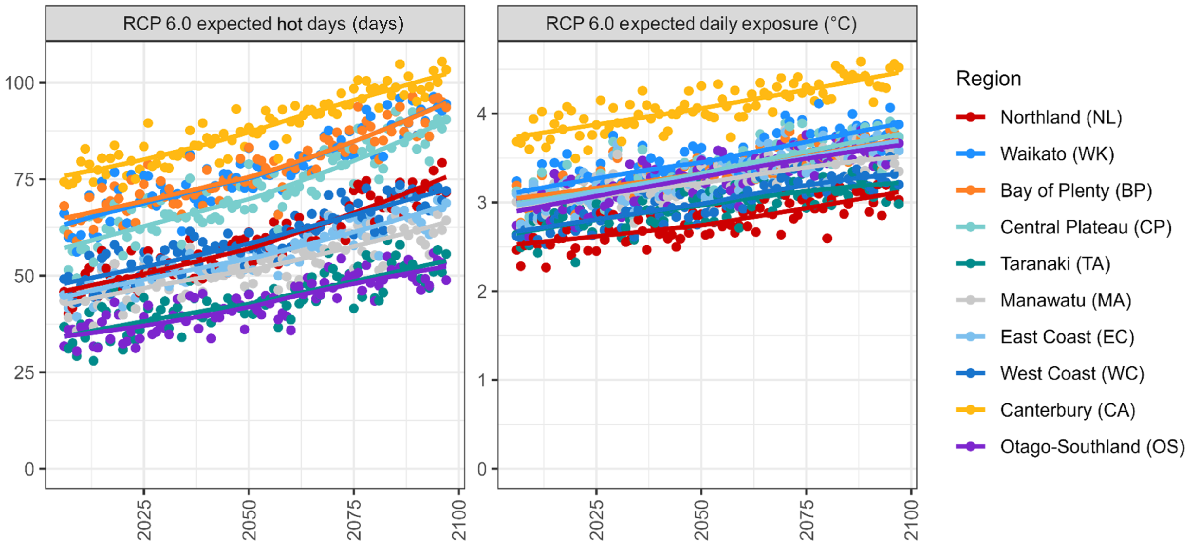
The predicted number of heat stress risk days was greatest in Canterbury, Bay of Plenty, Waikato, and Central Plateau. Moderate numbers of heat stress risk days were predicted for Northland, West Coast, East Coast and Manawatu, and the lowest numbers of heat stress risk days were predicted for Taranaki and Otago-Southland. The number of heat stress risk days is predicted to increase similarly for all regions from 2006 to 2098.
The severity (average heat stress exposure) of heat stress risk days was predicted to be far higher (approximately 0.7 effective degrees Celsius greater on average) in Canterbury, known for its higher summer temperatures (Macara 2016), than in other New Zealand regions. Apart from Canterbury, the severity of heat stress risk days was similar in Waikato, Bay of Plenty, Central Plateau, East Coast, Otago-Southland, and Manawatu, and less severe in West Coast, Taranaki, and Northland. The predicted national average increase in the number of heat stress risk days from 2020s to 2050s was 0.9 under RCP 2.6 (range: 0.4–1.9), 5.1 under RCP 4.5 (range: 4.2–6.3), 8.4 under RCP 6.0 (range: 6.3–10.5), and 15.0 under RCP 8.5 (range: 11.6–18.5) (the regional and national results are presented in Supplementary Fig. S3).
Spatial patterns of state and trend
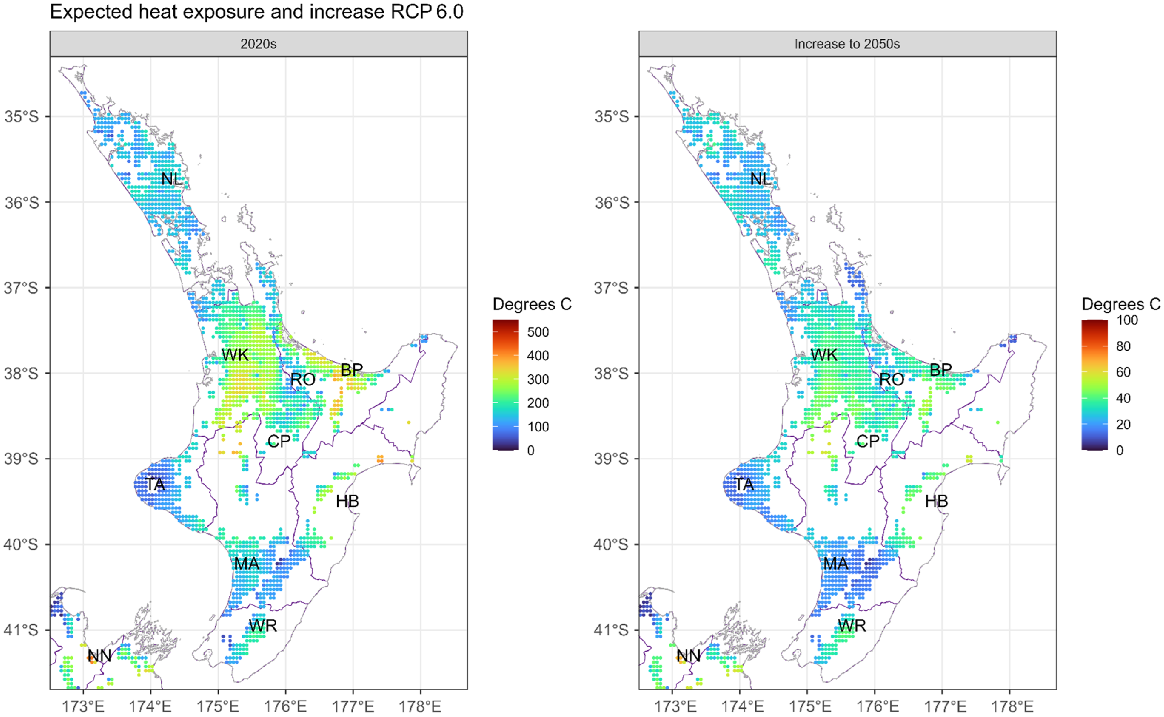
Predicted current heat stress exposure per season (accumulated effective °C above threshold, scale 0–550°C) in the 2020s under RCP 6.0 and predicted increase in heat stress exposure per season to the 2050s (scale 0–100°C) are shown in Figs 9 and 10 for the North Island and South Island respectively. The North Island already experiences accumulated heat stress exposure of >250°C in the Waikato (WK), the Bay of Plenty (BP) and parts of Hawke’s Bay (HB), and these regions with high heat stress exposure are predicted to also experience the largest increases in heat stress exposure to the 2050s. Areas of lower heat stress exposure (<100°C) are generally found at higher altitudes, in places such as Rotorua (RO), Central Plateau (CP), parts of Taranaki (TA), and along the Ruahine and Tararua Ranges between the Manawatu (MA) and Wairarapa (WR). Northland (NL) and Manawatu (MA) also have generally low values, reflecting low solar radiation in Northland and higher wind speeds in Manawatu (on the basis of the weather maps in Supplementary Figs S1 and S2). These regions are also predicted to experience a smaller increase in heat stress exposure approaching the 2050s than are other North Island regions.
Current average accumulated heat stress exposure per season (°C) for the 2020s (scale 0–550°C) and predicted change to the 2050s (scale 0–100°C), calculated when GHLI is >55 for the North Island under RCP 6.0.
Current expected accumulated heat stress exposure per season (°C) for the 2020s (scale 0–550°C) and predicted change to the 2050s (scale 0–100°C), calculated when GHLI is >55 for the South Island under RCP 6.0.

Annual heat stress exposures have a greater range in the South Island, with the highest values (>250°C) occurring in North Canterbury (NC), Mid Canterbury (MC), and pockets of Nelson (NN) and Central Otago (CO), reflecting higher air temperatures and solar radiation in those regions. These areas are also expected to experience the greatest increases in heat stress exposure to the 2050s. Heat stress exposures are relatively lower (<100°C) in the western and southern parts of the island, especially on the West Coast (WC) and Otago-Southland (OS). These regions experience both lower air temperatures and lower solar radiation. Increases in heat stress exposure is these areas are expected to be relatively small to the 2050s compared with other South Island regions.
Variation across GCMs
Variation between the six Global Circulation Models (GCMs) used in New Zealand climate-change research (NIWA 2018) represents uncertainty in the projected climate-change variables. The size of this variation was assessed by plotting the deviation in the expected number of heat stress risk days (GHLI > 55) for each GCM compared with the mean across all six GCMs for the North and South Islands under RCP 6.0 for the 2050s. These figures can be found in Supplementary Figs S4 and S5. In the North Island, the HadGEM2-ES GCM Model projected the highest number of hot days in the 2050s (+5.9), and BCC-SCM1.1 the fewest (−3.2), relative to the average across the six GCMs. The variation in the South Island was relatively less, with GFDL-CM3 giving the highest predictions of hot days (+3.3) and GISS-EL-R the fewest (−3.8), relative to the average. The different models gave spatially different results, but the differences from the mean were generally small (average error of 3.6 days, equivalent to 6%).
Discussion
Our results quantified the heat stress risk (annual heat stress risk days and accumulated heat stress load) in dairying regions of New Zealand on the basis of two heat stress indices (THI, GHLI) and 24 future climate projections (six GCMs simulating four RCPs). Daily average climate data were downscaled to determine afternoon weather (relative humidity, solar radiation, and wind speed) that aligned with maximum daily air temperature data. Locally determined thresholds (THI > 69; GHLI > 55) derived from grazing studies in New Zealand where the dominant dairy cow breed is Holstein-Friesian/Jersey crossbreed cows (Bryant et al. 2007, 2023) were used to indicate heat stress risk days and calculate heat stress exposure.
Although both THI and GHLI have been calibrated using New Zealand data (Bryant et al. 2007, 2023) and produced reasonable predictions (Fig. 7), the challenges of using THI for assessing heat stress risk in grazing dairy cows was apparent, owing to its reliance on relative humidity, and lack of sensitivity to solar radiation and wind speed (Mader et al. 2006; Gaughan et al. 2008; Herbut et al. 2018; Lees et al. 2018). This was most clearly indicated by regional differences between THI and GHLI in predictions for Northland, Hawke’s Bay, Nelson, and Central Otago. Whereas the THI predictions primarily reflected patterns of high air temperature, GHLI incorporated regional differences in the solar radiation and wind speed effects driving heat stress risk, and is therefore preferred. We recommend that THI be used with caution for assessing heat stress risk for grazing cows.
Using GHLI, our results indicated an average increase of between 1 and 15 heat stress risk days for the dairy farming regions of New Zealand from 2020s to 2050s, depending on the RCP assumed. These results can be put into perspective by referring to previous studies of spatial heat stress risk for dairy cattle by using THI. For example, Solymosi et al. (2010) reported an average increase of between 1 and 27 heat stress risk days from 1961–1990 to 2021–2050 in Hungary (using THI of >68), depending on which climate model was used. As in our study, the greatest increases were predicted for those regions where dairy cattle production was already most intensive. Similarly, Nidumolu et al. (2014) mapped heat stress risk days across the Murray dairy region in Australia under the assumption that THI of >75 represented ‘moderate’ heat stress risk. Their results reflected the spatial gradient of air temperature and suggested an increase of 12–15 heat stress risk days (from the 1971 to 2000 baseline) by 2025 and 31–42 days by 2050. Aside from differences in methodology, these results reflect differences in predicted future climate for these locations. However, for New Zealand, Ausseil et al. (2019) used the same methodology as Nidumolu et al. (2014), to predict climate-change impacts on heat stress risk in New Zealand, notwithstanding that the heat stress risk threshold of THI > 75 is likely to be too high for New Zealand cows (Bryant et al. 2007). They estimated an average of 8.9 heat stress risk days currently (1986–2005), with projected increases of 6.9, 8.6, 9.2 and 12.8 days to 2046–2060 for RCP 2.6, 4.5, 6.0 and 8.5 respectively. In agreement with our regional results, Ausseil et al. (2019) estimated that the current heat stress risk was greatest in the Waikato, Hawke’s Bay, and Canterbury. However, our analysis also highlighted Bay of Plenty, Nelson, and Central Otago as being at risk, whereas Hawke’s Bay had few dairy farms, and Wairarapa, identified as a hot spot by Ausseil et al. (2019), was predicted to be at lower risk due to its higher wind speeds. Again, Ausseil et al. (2019) predicted heat stress risk increases to be most pronounced in regions already at risk. Apart from geographical differences between these studies, differences in numbers of heat stress risk days could be explained by the lack of a standard definition of a ‘heat stress risk day’ between studies, and use of outdated climate projections in older results. These studies have highlighted the need for consistent definitions and thresholds when conducting heat stress analysis.
Solar radiation, wind speed, and relative humidity are all interacting factors that affect the way that dairy cows experience hot weather, and the importance of these weather variables varies regionally owing to local climatic conditions. Therefore, it is unsurprising that the weather variables driving heat stress risk varied among regions in our study. For example, in the North Island, the Waikato, Bay of Plenty, and Hawke’s Bay regions experience some of the highest air temperatures and low wind speeds, whereas the Wairarapa experiences high air temperatures with relatively high wind speeds. These factors in combination either exacerbate or help reduce the heat stress exposure in those regions respectively. Conversely, in the South Island, the North Canterbury, Mid Canterbury and Central Otago regions experience high air temperatures and low wind speeds that combine to produce some of the highest heat stress days and heat stress exposures in the country (Fig. 10). In contrast, Nelson experiences high solar radiation, but air temperatures are more moderate, mitigating the heat stress risk. Therefore, in regions where a combination of high air temperatures, high solar radiation, and low wind speeds are common, farmers may need to be more aware of the risks of heat stress.
Climate-change projections and heat stress risk models inherently come with a degree of uncertainty. Uncertainty about future climates is represented in the range of assumed future greenhouse-gas concentrations (the four RCPs) and the ensemble of global climate models (the six GCMs). The choice of heat stress index and threshold also comes with uncertainty (e.g. Figs 5 and 6) as does the method for estimating daily maximum index values from daily average climate data. The range of predictions across RCPs was analysed in Supplementary Table S1 and gives the national average heat stress days as 52.9–54.5 in 2020s (similar across RCPs) and the increase to 2050s as ranging from 1 to 15 days, depending on the RCP assumed. Climate scenarios RCP 2.6 and RCP 8.5 represent unlikely futures, so the uncertainty is probably smaller than this range. The range of predictions across the GCMs is also analysed in Supplementary Figs S4 and S5 and was estimated to be approximately ±6%. Additionally, the GHLI equation presented here was based on animal-based indicators of heat stress from grazing Holstein-Friesian/Jersey crossbreed cows in the Waikato (Bryant et al. 2023). Further work is required to determine whether this equation remains accurate across contrasting regions or for different types of cows.
A threshold of GHLI > 55 represents a respiration rate at which cows begin to exhibit physiological changes (increased breathing rate, and in some cows panting and drooling) in response to their environment (Bryant et al. 2023). There will be different views on what is acceptable before mitigation should be applied. Nevertheless, by determining the average number of days that present a risk of heat stress and the likely intensity of that event, this analysis has provided a benchmark for further study and discussion with dairy farmers and the wider dairy support system. Despite these embedded uncertainties, this is the most comprehensive attempt to assess climate-change implications for New Zealand conditions and cows and provides an initial view that can be refined as better models are developed. The analysis will allow more targeted mitigations to be developed based on the main drivers and intensity of risk in the different regions.
The results of this study contain both concerning and encouraging implications for pastoral dairy farming in New Zealand. Expected increases in heat stress risk days and annual heat stress exposure are estimated to be relatively modest (Fig. 8), even under the relatively pessimistic RCP 6.0 scenario, and also to be focused in those same regions where impacts are already high. This allows more targeted research, development, and extension in these regions. Nevertheless, New Zealand is already experiencing, and will continue for the remainder of the 2020s to experience, large numbers of heat stress risk days in key dairying regions, with the annual number of heat stress risk days expected to be 69 days in the Waikato and Bay of Plenty and 80 days in Canterbury. In addition, the associated heat stress exposure is high in these regions, especially in Canterbury where high air temperature and low wind speeds combine to produce challenging conditions. This implies that dairy cows in these regions may already be experiencing health, welfare and productivity impacts associated with heat stress events. Our findings have highlighted the importance of strategies to manage and mitigate heat stress risk within the broader remit of climate-change mitigation and adaptation for the New Zealand dairy industry. Options to mitigate heat stress may include provision of shade, access to sprinklers, and specialised feed, whereas options to adapt to better cope with heat stress risk may include breed development (e.g. increasing the proportion of New Zealand Jersey genetics, genes for improved coat characteristics, Donkersloot et al. 2017) and farm systems re-design.
Conclusions
Robust predictions of heat stress risk for grazing dairy cows under future climate scenarios requires that the most important weather variables are included (air temperature, solar radiation, wind speed) at the critical time of day (mid- to later afternoon). Models (e.g. heat stress indices) based on mean daily values or neglecting solar radiation or wind effects are unlikely to provide reliable predictions for grazing dairy cows. However, with care, mid- to late afternoon weather conditions can be estimated from mean daily values. Furthermore, heat stress indices and their thresholds for defining heat stress events should be appropriate for the animals and situations of interest. Indices such as THI developed for indoor-housed cows, for example, may not be well suited to defining heat stress risk for cows grazing outdoors, and may give different predictions of regions at most risk of heat stress from indices such as GHLI developed specifically for the local situation. As the effects of air temperature, solar radiation and wind speed vary by region, predictions of heat stress risk days and annual heat stress exposure (predicted using GHLI) are spatially variable. In New Zealand, the three regions predicted to have the greatest heat stress risk, Waikato, Bay of Plenty and Canterbury, currently account for 47% of New Zealand’s milk production (DairyNZ 2023). Future increases in heat stress risk days and heat stress exposure can be expected to align with these patterns, although results here suggest that heat stress risk exists now and that increases from 2020s to 2050s will be modest. Future research should focus on targeted heat stress mitigation research, development, and extension targeted to the weather conditions and challenges unique to each region.
Data availability
The climate projection data used in this study are the property of the National Institute of Water and Atmospheric Research (NIWA).
Declaration of funding
This research was conducted within the Ministry of Business, Innovation and Employment’s National Science Challenge ‘The Deep South: Changing with our Climate’, with additional support from the dairy farmers of New Zealand through DairyNZ Inc. contract CRS6181 ‘Animal Centric Dairy Farming’.
Acknowledgements
Thanks go to Gabby Hawke and Robbie McGregor for assistance with data ingestion into Snowflake.
References
Armstrong DV (1994) Heat stress interaction with shade and cooling. Journal of Dairy Science 77(7), 2044-2050.
| Crossref | Google Scholar | PubMed |
Ausseil A-G, van der Weerden T, Beare M, Teixeira E, Baisden T, Lieffering M, Guo J, Keller E, Law R, Noble A (2019) Climate change impacts on land use suitability. Report number LC3573. Manaaki Whenua - Landcare Research. Available at https://deepsouthchallenge.co.nz/resource/climate-change-impacts-on-land-use-suitability/
Babylon A, Woodward S, Beukes P (2022) Summer growth rates and annual yields of perennial ryegrass (Lolium perenne L.) in the Upper North Island are expected to decline as a result of climate change. Journal of New Zealand Grasslands 84, 31-40.
| Crossref | Google Scholar |
Beukes P, Babylon A, Griffiths W, Woodward S, Kalaugher E, Sood A, Chapman D (2021) Modelling perennial ryegrass (Lolium perenne) persistence and productivity for the Upper North Island under current and future climate. NZGA: Research and Practice Series 17, 297-306.
| Crossref | Google Scholar |
Bryant JR, López-Villalobos N, Pryce JE, Holmes CW, Johnson DL (2007) Quantifying the effect of thermal environment on production traits in three breeds of dairy cattle in New Zealand. New Zealand Journal of Agricultural Research 50(3), 327-338.
| Crossref | Google Scholar |
Bryant JR, Huddart F, Schütz KE (2023) Development of a heat load index for grazing dairy cattle. New Zealand Journal of Agricultural Research 66(6), 665-679.
| Crossref | Google Scholar |
Cartwright SL, Schmied J, Karrow N, Mallard BA (2023) Impact of heat stress on dairy cattle and selection strategies for thermotolerance: a review. Frontiers in Veterinary Science 10, 1198697.
| Crossref | Google Scholar | PubMed |
Chen L, Thorup VM, Kudahl AB, Østergaard S (2024) Effects of heat stress on feed intake, milk yield, milk composition, and feed efficiency in dairy cows: a meta-analysis. Journal of Dairy Science 107(5), 3207-3218.
| Crossref | Google Scholar | PubMed |
Cowan T, Wheeler MC, Cobon DH, Gaughan JB, Marshall AG, Sharples W, McCulloch J, Jarvis C (2024) Observed climatology and variability of cattle heat stress in Australia. Journal of Applied Meteorology and Climatology 63(5), 645-663.
| Crossref | Google Scholar |
DairyNZ (2023) Dairy statistics. Available at https://www.lic.co.nz/about/research-publications/dairy-statistics [accessed 22 November 2023]
Dikman S, Hansen PJ (2009) Is the temperature-humidity index the best indicator of heat stress in lactating dairy cows in a subtropical environment? Journal of Dairy Science 92(1), 109-116.
| Crossref | Google Scholar |
Donkersloot EG, Worth GM, Yeates AF, Littlejohn MD, McNaughton LR, Spelman RJ, Davis SR (2017) The benefit of a slick hair coat for heat tolerance in New Zealand dairy cattle. In ‘Proceedings of the Association for the Advancement of Animal Breeding and Genetics, Vol. 24’, online, 2–4 November 2021. pp. 94–97.
Gaughan JB, Mader TL, Holt SM, Lisle A (2008) A new heat load index for feedlot cattle. Journal of Animal Science 86(1), 226-234.
| Crossref | Google Scholar | PubMed |
Gernand E, König S, Kipp C (2019) Influence of on-farm measurements for heat stress indicators on dairy cow productivity, female fertility, and health. Journal of Dairy Science 102(7), 6660-6671.
| Crossref | Google Scholar | PubMed |
Glassey C, Wills G, McCahon K, Dodd M, Chapman DF (2021) Long-term central waikato summer–autumn rainfall and pasture growth trends. Are conditions for pasture growth changing over time? In ‘Resilient pastures symposium. Grassland research and practice series 17, Dunedin, New Zealand’, 11–12 May 2021, Lake Karapiro, New Zealand. (Ed. GB Douglas) pp. 369–378. (New Zealand Grassland Association) 10.33584/rps.17.2021.3456
Hausfather Z (2019) Explainer: the high-emissions ‘RCP8.5’ global warming scenario. Carbon Brief. Available at https://www.carbonbrief.org/explainer-the-high-emissions-rcp8-5-global-warming-scenario/ [accessed 27 November 2023]
Hausfather Z, Peters GP (2020) Emissions – the ‘business as usual’ story is misleading. Nature 577, 618-620.
| Crossref | Google Scholar | PubMed |
Herbut P, Angrecka S, Walczak J (2018) Environmental parameters to assessing of heat stress in dairy cattle – a review. International Journal of Biometeorology 62, 2089-2097.
| Crossref | Google Scholar | PubMed |
IPCC (2014) Climate change 2014: synthesis report. Contribution of working groups I, II and III to the fifth assessment report of the Intergovernmental Panel on Climate Change. IPCC, Geneva, Switzerland. p. 151. Available at https://www.ipcc.ch/report/ar5/syr/
Lees JC, Lees AM, Gaughan JB (2018) Developing a heat load index for lactating dairy cows. Animal Production Science 58(8), 1387-1391.
| Crossref | Google Scholar |
Macara GR (2016) The climate and weather of Canterbury. 2nd edition. NIWA Science and Technology Series 68, 44 pp. https://niwa.co.nz/climate-and-weather/regional-climatologies/canterbury
Mader TL, Dahlquist JM, Gaughan JB (1997) Wind protection effects and airflow patterns in outside feedlots. Journal of Animal Science 75(1), 26-36.
| Crossref | Google Scholar | PubMed |
Mader TL, Davis MS, Brown-Brandl T (2006) Environmental factors influencing heat stress in feedlot cattle. Journal of Animal Science 84(3), 712-719.
| Crossref | Google Scholar | PubMed |
Ministry for the Environment (2018) Climate change projections for New Zealand: atmosphere projections based on simulations from the IPCC fifth assessment. Publication ME 1385, Ministry for the Environment, Wellington, New Zealand. Available at http://www.mfe.govt.nz/
Ministry for the Environment (2023) New Zealand’s environmental reporting series: our atmosphere and climate 2023. Ministry for the Environment, Wellington, New Zealand. Available at http://www.environment.govt.nz/
Neves SF, Silva MCF, Miranda JM, Stilwell G, Cortez PP (2022) Predictive models of dairy cow thermal state: a review from a technological perspective. Veterinary Sciences 9(8), 416.
| Crossref | Google Scholar | PubMed |
Nidumolu U, Crimp S, Gobbett D, Laing A, Howden M, Little S (2014) Spatio-temporal modelling of heat stress and climate change implications for the Murray dairy region, Australia. International Journal of Biometeorology 58, 1095-1108.
| Crossref | Google Scholar | PubMed |
NIWA (2018) The climate and weather of New Zealand. NIWA Science and Technology Series 74, 50 pp. Available at https://niwa.co.nz/climate-and-weather/regional-climatologies/new-zealand
NIWA (2023) Climate change scenarios for New Zealand. Available at https://niwa.co.nz/our-science/climate/information-and-resources/clivar/scenarios [accessed 22 November 2023]
Osei-Amponsah R, Dunshea FR, Leury BJ, Cheng L, Cullen B, Joy A, Abhijith A, Zhang MH, Chauhan SS (2020) Heat stress impacts on lactating cows grazing Australian summer pastures on an automatic robotic dairy. Animals 10(5), 869.
| Crossref | Google Scholar | PubMed |
Polsky L, von Keyserlingk MAG (2017) Invited review: Effects of heat stress on dairy cattle welfare. Journal of Dairy Science 100(11), 8645-8657.
| Crossref | Google Scholar | PubMed |
R Core Team (2023) R: A Language and Environment for Statistical Computing. R Foundation for Statistical Computing, Vienna, Austria. Available at https://www.R-project.org/
Rojas-Downing MM, Nejadhashemi AP, Harrigan T, Woznicki SA (2017) Climate change and livestock: impacts, adaptation, and mitigation. Climate Risk Management 16, 145-163.
| Crossref | Google Scholar |
Schütz KE, Rogers AR, Poulouin YA, Cox NR, Tucker CB (2010) The amount of shade influences the behavior and physiology of dairy cattle. Journal of Dairy Science 93(1), 125-133.
| Crossref | Google Scholar | PubMed |
Schütz KE, Cox NR, Cave VM, Huddart FJ, Tucker CB (2023) Effects of changing milking and feeding times on the behaviour, body temperature, respiration rate and milk production of dairy cows on pasture. Applied Animal Behaviour Science 261, 105895.
| Crossref | Google Scholar |
Shrestha AK, Thapa A, Gautam H (2019) Solar radiation, air temperature, relative humidity, and dew point study: Damak, Jhapa, Nepal. International Journal of Photoenergy 2019(1), 8369231.
| Crossref | Google Scholar |
Shu H, Wang W, Guo L, Bindelle J (2021) Recent advances on early detection of heat strain in dairy cows using animal-based indicators: a review. Animals 11(4), 980.
| Crossref | Google Scholar | PubMed |
Singers NJD, Rogers GM (2014) A classification of New Zealand’s terrestrial ecosystems. Science for conservation series no. 325. Department of Conservation, Wellington, New Zealand. Available at https://www.doc.govt.nz/about-us/science-publications/series/science-for-conservation/
Solymosi N, Torma C, Kern A, Maróti-Agóts A, Barcza Z, Könyves L, Berke O, Reiczigel J (2010) Changing climate in Hungary and trends in the annual number of heat stress days. International Journal of Biometeorology 54, 423-431.
| Crossref | Google Scholar | PubMed |
Soneye OO, Ayoola MA, Ajao IA, Jegede OO (2019) Diurnal and seasonal variations of the incoming solar radiation flux at a tropical station, Ile-Ife, Nigeria. Heliyon 5(5), e01673.
| Crossref | Google Scholar | PubMed |
Thom EC (1959) The discomfort index. Weatherwise 12, 57-61.
| Crossref | Google Scholar |
Thornton P, Nerlson G, Mayberry D, Herrerro M (2022) Impacts of heat stress on global cattle production during the 21st century: a modelling study. The Lancet Planet Health 6(3), e192-e201.
| Crossref | Google Scholar | PubMed |
van Vuuren DP, Edmonds J, Kainuma M, Riahi K, Thomson A, Hibbard K, Hurtt GC, Kram T, Krey V, Lamarque J-F, Masui T, Meinshausen M, Nakicenovic N, Smith SJ, Rose SK (2011) The representative concentration pathways: an overview. Climatic Change 109, 5.
| Crossref | Google Scholar |
Wandayantolis W, Maslakah FA, Nugroho S (2023) Diurnal variations of meteorological elements to fluctuation of air quality parameters. Journal of Environmental Science and Sustainable Development 6(1), 34-49.
| Crossref | Google Scholar |
West JW (2003) Effects of heat-stress on production in dairy cattle. Journal of Dairy Science 86, 2131-2144.
| Crossref | Google Scholar |
Wheelock JB, Rhoads RP, VanBaale MJ, Sanders SR, Baumgard LH (2010) Effects of heat stress on energetic metabolism in lactating Holstein cows. Journal of Dairy Science 93, 644-655.
| Crossref | Google Scholar |
Woodward SJR, Edwards P, Verhoek K, Jago J (2024) Identifying and predicting heat stress events for grazing dairy cows using rumen temperature boluses. JDS Communications 5(5), 431-435.
| Crossref | Google Scholar |
Yan G, Li H, Shi Z (2021a) Evaluation of thermal indices as the indicators of heat stress in dairy cows in a temperate climate. Animals 11(8), 2459.
| Crossref | Google Scholar | PubMed |
Yan P, Zuo D, Yang P, Li S (2021b) Typical modes of the wind speed diurnal variation in Beijing based on the clustering method. Frontiers in Physics 9, 675922.
| Crossref | Google Scholar |