

Use of 15N abundance in tail hair to predict feed efficiency and response to a urea supplement in young cattle fed a tropical grass forage
B. C. Fraser A , K. Eyre A , J. B. Gaughan B , G. Wijffels C and L. F. P. Silva A *
A
B
C
Abstract
Beef cattle performance varies substantially in environments with low protein forage. Nitrogen use efficiency (NUE) explains a large portion of this variation. The natural abundance of the 15N isotope (δ15N) in biological tissues can be used as a proxy for NUE.
This study aimed to use tail hair δ15N from Brahman steers fed a medium-quality forage-only diet to assist in predicting their performance and nitrogen metabolism response to a ureasupplemented diet.
A complete randomised block design with two distinct periods (diets) was conducted using 24 Brahman steers with an initial liveweight of 238 ± 29 kg (mean ± s.d.) and aged 10–12 months. The steers were fed a medium-quality hay diet (baseline diet with crude protein (CP) 76 g/kg DM) for 56 days, followed by an N-supplemented diet (hay plus molasses and urea, 92 g CP/kg DM) for another 56 days. Each feeding period concluded with a 7-day evaluation in metabolic crates to assess nitrogen metabolism parameters.
Steer rankings based on δ15N levels in tail hair were consistent across both diets. Significant individual variation was observed in average daily gain (ADG) on the baseline diet (−125 to 181 g/day) and in response to the urea supplemented diet (−11 g/day to 480 g/day). Markedly, δ15N from the baseline diet was significantly correlated with ADG, NUE, and feed conversion efficiency (FCE) during the urea supplemented diet.
Tail hair δ15N from the baseline diet assisted in predicting ADG, NUE, and FCE during the urea supplemented diet.
Tail hair δ15N may be used to identify more productive and efficient cattle.
Keywords: average daily gain, Bos indicus, cattle, feed conversion efficiency, nitrogen isotopes, nitrogen metabolism, nutrition physiology, supplements.
Introduction
Rangeland beef cattle in northern Australia often graze low-quality tropical pastures where nitrogen (N) is frequently the primary limiting nutrient (McLennan et al. 2017; Dixon et al. 2022). During periods of low forage quality, it is common to supplement cattle with N sources, including non-protein nitrogen (NPN) such as urea, which has been shown to improve rumen microbial digestion and liveweight (LW) gain (Winks et al. 1979; Holroyd et al. 1988; Dixon et al. 1998). Studies in northern Australia have demonstrated that N supplements, including NPN, can reduce dry-season LW loss by up to 35 kg in growing cattle grazing senesced tropical pastures (Dixon et al. 2022). The effectiveness of NPN supplementation in these systems is largely due to its provision of rumen-degradable N, which supports microbial activity and improves the intake of metabolisable energy (ME) from low-quality forages (Coates and Dixon 2008; McLennan et al. 2017). Poppi and McLennan (1995) further emphasise the importance of balancing N and energy intake in ruminants, as N availability often becomes the primary limiting factor. Conversely, energy intake can constrain growth when N is no longer limiting. This interplay between N and energy utilisation highlights the critical role of protein of N supplementation in improving productivity for cattle grazing in tropical systems with low forage quality.
Despite these nutritional interventions, there are significant variations in the ability of cattle to perform optimally in harsh conditions. Differences in N metabolism are associated with variations in growth rate and reproductive performance when cattle are on low-protein diets (Sinclair et al. 2000; Huntington et al. 2001). Cattle that lose less N through urine and faeces will be able to return more N to the rumen for microbial anabolism, compared with those that have higher N losses (Hailemariam et al. 2021). However, quantifying N losses and N recycling on large numbers of individual cattle is not an easy pursuit, as it requires total collection of faeces and urine. Therefore, metabolic markers, such as blood urea N, creatinine and 3-methylhistidine have been used to assess differences between animals (Lavery and Ferris 2021).
The natural abundance of the heavier 15N isotope (δ15N) in body tissues of cattle has been proposed as a proxy for N use efficiency (NUE) and feed efficiency when cattle are on low–protein diets (Cantalapiedra-Hijar et al. 2015; Silva et al. 2022). The two major N isotopes that are involved in the metabolism of protein in plants and animals are 14N and 15N. Of these two N isotopes, 14N is the most abundant form of N on Earth and requires less energy to break its bonds (Lavery and Ferris 2021). During rumen fermentation and N transactions in the liver and kidney, 14N-containing substrates are preferentially used by enzymes and fractionation occurs (Lavery and Ferris 2021). Therefore, cattle urine is enriched in 14N and body tissues contain a greater δ15N than that occurring in the diet (Nasrollahi et al. 2020), although the δ15N in tissue is influenced by diet composition (Cantalapiedra-Hijar et al. 2015). Body tissues, including tail hair, can be used to evaluate the δ15N.
Collection of tail hair is easy, non-invasive, requires no special collection or storage equipment and is shelf stable, as compared to plasma and urine samples (Tallo-Parra et al. 2017). As hair grows, it retains the dietary N conditions of the past. These qualities make tail hair an attractive option to study the association between δ15N and cattle performance. It is expected that, due to lower N losses in urine, cattle with lower δ15N in body tissues will be more feed efficient and have greater NUE (Cantalapiedra-Hijar et al. 2020; Silva et al. 2022).
Nitrogen is a major limiting nutrient in cattle. Insufficient dietary N may impair performance and thereby decrease ADG (Hendricksen et al. 1994). Supplementation of N to cattle is a common practice, often requiring significant financial investment. Performance can be improved in cattle with protein supplementation (McLennan et al. 2017); however, the expected value of the performance improvement should cover the cost of the supplement. Non-protein nitrogen, such as urea, is often an attractive, less expensive option that is safe to feed to cattle at appropriate concentrations (Köster et al. 2002).
The large individual variation in performance of cattle creates an economic and nutritional problem and creates a large variation of total N losses to the environment. Protein supplements are formulated based on the predicted average herd intake of the supplement and the subsequent response. A portion of the animals will excrete more N with no or very little increase in performance, while a portion of the animals will respond well. The ability to predict growth response to supplements would allow for better decisions on cattle breeding, group segregation, when to supplement with N, and more targeted supplement formulation, increasing total NUE of the overall system.
Thus, we hypothesised that cattle tail hair δ15N might assist in predicting differences in N metabolism parameters and growth rates of cattle when on low–protein diets and receiving a urea supplement.
Materials and methods
Approval was granted by The University of Queensland Production and Companion Animals Animal Ethics Committee (approval 2021/AE000013).
Location, animals, and diets
A 141-day study was undertaken at the Queensland Animal Science Precinct, located on the Gatton Campus of The University of Queensland, Australia. Twenty-six Brahman steers with an initial body weight (BW) of 238 ± 29 kg (mean ± s.d.) and 10–12 months old were sourced from the same cohort and a single herd in Southeast Queensland, Australia. The steers were weaned as a cohort and maintained in paddocks containing mostly Buffel grass (Cenchrus ciliaris L.) with only mineral supplementation. Two steers were removed based on the homogeneity of the initial BW, and twenty-four steers were used for the study. The trial was designed to determine variations in average daily gain (ADG) and N balance and metabolism parameters, including NUE and excretion of N in urine (N-urine) in cattle fed two diets.
The 24 steers were first grouped into two blocks based on body weight (BW) and then randomly assigned to individual pens (3 × 10 m) with concrete floors, rubber mats, and shade covering half of each pen. The steers remained in individual pens for two 56-day periods to monitor dry matter intake (DMI) and average daily gain (ADG). The study was conducted in two distinct phases. During the first phase, all 24 steers received a baseline diet of medium-quality hay. In the second phase, they were transitioned to a urea supplemented diet, where the same baseline diet was offered alongside a molasses-urea supplement (M8U) containing 80 g urea/kg as-fed. Following each 56-day period, the steers were housed in metabolic crates for 7 days to assess N metabolism parameters, including N intake, urinary N excretion, faecal N excretion, N retention, and NUE.
Steers were provided ad libitum access to Chloris gayana (Rhodes grass) hay with 76.4 g crude protein (CP)/kg DM (baseline diet, Table 1), and water. The first 7 days were considered as an adaptation period. The amount of hay offered daily was adjusted to maintain refusals at around 5% of the offer. A mineral supplement (Table 1) was provided at a maximum rate of 100 g per steer per day to minimise mineral deficiencies while on the medium-quality hay diet. The mineral supplement was replenished as needed, though it was not consumed daily. The steers were placed in metabolism crates, as described by Carmona et al. (2020), for 7 days for total collection of feed, faeces, and urine to determine N balance.
| Item | Baseline diet | Urea diet | |
|---|---|---|---|
| Ingredients (g/kg of the diet as-fed) A | |||
| Grass hay | 1000 | 910 | |
| Molasses-urea supplement B | – | 90 | |
| Chemical composition | |||
| Dry matter (g/kg as-fed) | 824 | 810 | |
| CP (g/kg DM) | 76.4 | 91.9 | |
| Ash (g/kg DM) | 106 | 105 | |
| Neutral detergent fibre (g/kg DM) | 743 | 620 | |
| Estimated ME (MJ/kg) C | 8.27 | 8.31 | |
| CP:ME ratio (g CP:MJ ME) | 9.24 | 11.06 |
CP, Crude protein; ME, metabolisable energy.
During the second period of the trial, the steers returned to the individual pens for assessment of individual variation in ADG when receiving a urea supplement. The steers received the same low-protein Rhodes grass hay plus the M8U supplement. The M8U supplement was offered in a separate plastic container from the hay at 10% of the previous 5-day average hay intake, supplying approximately 40 g of urea per day (urea supplemented diet, 91.9 g CP/kg DM, Table 1). All steers completely consumed the daily allocation of the M8U supplement. Steers were then moved into the metabolism crates for 7 days for determination of differences in N balance when receiving a urea supplement.
Animal performance
Body weight was measured fortnightly for the duration of the trial and ADG was calculated by regressing body weight over time for both diets. The response to the N supplementation was calculated as ADG on the urea supplemented diet – ADG on the baseline diet. Dry matter intake (DMI) was calculated as DMI (kg) = (weight of feed offered − weight of feed refused) × average feed DM content.
Nitrogen balance and digestibility
Nitrogen balance of the cattle in the metabolism crates was measured by previously established protocols (Poppi et al. 1981). The diet was offered at 90% of the previous 5-day average intake. After 2 days of adaptation, total daily amount of faeces and urine were recorded and 10% of each steer’s output was collected for 5 days and stored at 4°C. Sulfuric acid (100 g/L) was added to the urine trays to adjust the urine pH to < 4 to inhibit microbial growth.
At the end of the 7-day collection period, including adaptation, all daily samples during the collection period were mixed, and representative subsamples of faeces and acidified urine were taken. Faecal samples were dried at 60°C in a forced air oven until reaching a constant weight. Acidified urine samples were stored at −20°C until analysed. Protein and fibre digestibility were calculated as in Cochran and Galyean (1994):
Retained N (g per day) in individual steers was determined by:
NUE for each steer was calculated as:
Feed analysis
As-fed hay samples were collected weekly and pooled into two samples representing each of the two feeding periods. Steers were fed daily at approximately 0730 h. Residual feed was collected, weighed, and disposed of daily. Once a week, residuals were collected from one block of the individual pens and then the second block the next week. Every two weeks 7 days of residuals were collected, subsampled and pooled over the whole phase for each animal.
Hay, feed residuals, faeces, and urea supplemented samples were dried in a forced air oven at 60°C for 48 h and ground to 2 mm fragments. Hay and faeces samples were evaluated for DM, CP, neutral detergent fibre (NDF) and ash. Residuals and molasses were evaluated for DM, CP and ash. After initial drying at 60°C, DM concentration was determined at 105°C (AOAC 2019, Method 934.01). Ash was analysed by ignition at 550°C for 3 h and organic matter (OM) was determined by adjusting DM for ash content (AOAC 2019, Method 942.05). Estimated ash-free NDF was determined as described in Mertens (2002), with Ankom F57 filter bags. Total N of faeces, residuals and molasses was analysed by combustion at 1250°C using a LECO 928 (LECO Corporation, St. Joseph, MI) analyser and CP calculated by multiplying total N by 6.25. Total N of hay was analysed by combustion (CN928 Carbon/Nitrogen Determinator, Leco Corporation, St. Joseph, MI) and CP calculated by multiplying total N by 6.25.
Plasma urea nitrogen (PUN) and rumen ammonia (N-NH3)
After the adaption period on each diet, blood samples were collected at approximately 0730 h, before the morning feeding, from the jugular vein into a 10 mL BD Vacutainer® Heparin Tubes (Becton, Dickinson and Company, Franklin Lakes, NJ). Blood tubes were centrifuged at 3000g for 10 min at 4°C. Plasma samples were transferred to Eppendorf tubes and stored at −20°C until analysis for PUN. Chemical analysis of PUN was performed with a chemistry analyser (Beckman Coulter AU480, Beckman Coulter Inc, Brea CA).
Rumen fluid samples were taken at 0 and 3 h after feeding on days 21 and 22 during the baseline phase, and on days 36 and 37 during the urea supplemented phase. Rumen fluid samples were filtered through stockings and pH was immediately measured (Edge Benchtop HI2002, Hanna Instruments, Melbourne, Vic., Australia). The 8 mL subsamples were transferred into tubes containing 2 mL 0.5 M H2SO4 for ammonia (NH3-N) measurement. Samples were stored at −20°C until analysis. The nitroprusside-salicylate procedure was applied to clarified rumen fluid for automatic measurement on the SEAL AQ400 discrete analyser (Seal Analytical Ltd., Southampton, UK), as previously described (Kopp and McKee 1983; Baethgen and Alley 1989).
Natural abundance of nitrogen isotopes in tail hair
Tail hair was collected at the end of each dietary trial, when moving the steers into the metabolism crates, by grasping the hair manually and applying force dorsally. The hair was placed in a loose single-throw knot and stored in paper bags. The 2 cm of tail hair closest to the hair bulb was analysed for δ15N, representing hair growth during the last 4 weeks before collection (Schwertl et al. 2003). The rapid turnover of N in hair, with a half-life of ~20 days (Schwertl et al. 2003), supports the use of this 2 cm section for accurate reflection of recent dietary intake. Tail hair samples were prepared by washing with 2:1 v/v methanol:chloroform, as described by Schwertl et al. (2003).
The δ15N values in tail hair were measured using an Elementar Vario Isotope Cube Elemental Analyser coupled with a PrecisION isotope ratio mass spectrometer (Elementar, Langenselbold, Hesse, Germany) at the Stable Isotope Geochemistry Laboratory, The University of Queensland. The δ15N values were expressed relative to atmospheric N (Peterson and Fry 1987) and reported in per thousand (‰). Calibration was achieved through a 3-point normalisation, using the standards USGS40, USGS41a, and USGS43. Precision, based on the international glutamic acid standard USGS40, was ± 0.2‰ at 1 sigma.
Statistical analysis
Of the 26 initial steers, two steers were removed due to illness and decreased feed intake, resulting in 24 steers remaining in the study. Data were analysed as a randomised block design, with steers being randomly allocated to pens within one of two blocks based on initial BW. Descriptive statistics and normality checks were performed for each independent variable, using SAS PROC MEANS and SAS PROC UNIVARIATE. No variable required transformation. The association between δ15N in tail hair during the baseline diet and response to the urea supplemented diet, NUE, N metabolism parameters and δ15N in tail hair during the urea supplemented diet was analysed using mixed-effects linear regression (PROC MIXED in SAS), with block included as a random effect.
Results
There were significant individual variations in DMI and ADG for both diets. Total DMI varied from 14.5 g/kg BW to 18.8 g/kg BW, with an average of 16.5 g/kg BW on the baseline diet, and 15.2 g/kg BW to 20.8 g/kg BW, with an average of 17.9 g/kg BW on the urea supplemented diet (Tables 2 and 3). The ADG during the baseline diet ranged from −125 to 181 g/day, with an average of 64 g/day (Table 2). On average, urea supplementation resulted in an increase of 202 g/day in ADG, with a range from −11 g/day to 480 g/day. Thirty percent of the steers had less than a 100 g/day increase in ADG in response to urea supplementation, while 30% had an increase greater than 250 g/day.
| Item | Mean | Min | Max | s.d. | |
|---|---|---|---|---|---|
| BW (kg) | 239 | 195 | 296 | 27 | |
| DM intake (g/kg BW) | 16.5 | 14.5 | 18.8 | 1.3 | |
| DOM intake (g/kg BW) | 9.0 | 7.8 | 10.2 | 0.7 | |
| NDF intake (g/kg BW) | 12.3 | 10.6 | 14.0 | 1.0 | |
| CP intake (g/kg BW) | 1.3 | 1.1 | 1.4 | 0.1 | |
| ADG (g/day) | 63 | −125 | 181 | 74 | |
| FCE1 (kg ADG/kg DM intake) | 0.016 | −0.033 | 0.050 | 0.019 | |
| FCE2 (kg ADG/kg DOM intake) | 0.030 | −0.055 | 0.095 | 0.035 | |
| NUE (g N retained/kg N intake) | 42 | −85 | 129 | 51 | |
| DM digestibility (g/kg) | 592 | 549 | 670 | 30 | |
| OM digestibility (g/kg) | 607 | 564 | 691 | 30 | |
| NDF digestibility (g/kg) | 593 | 534 | 697 | 39 | |
| CP digestibility (g/kg) | 615 | 488 | 696 | 54 | |
| N faeces (g/kg N intake) | 385 | 304 | 512 | 54 | |
| N urine (g/kg N intake) | 432 | 330 | 553 | 62 | |
| N balance (g/day) | 9.34 | −0.63 | 18.08 | 4.68 | |
| PUN (mmol/L) | 2.82 | 2.13 | 3.67 | 0.41 | |
| Rumen N-NH3 0 h before feeding (mg N/L) | 46.9 | 29.2 | 62.7 | 9.0 | |
| Rumen N-NH3 3 h after feeding (mg N/L) | 43.7 | 26.3 | 66.9 | 10.9 | |
| δ15N in tail hair (‰) | 8.02 | 6.88 | 9.17 | 0.54 |
δ15N, natural abundance of the 15N isotope; ADG, average daily gain; CP, crude protein; DOM, digestible organic matter; FCE, feed conversion efficiency; NDF, neutral detergent fibre; NUE, nitrogen use efficiency; PUN, plasma urea nitrogen.
| Item | Mean | Min | Max | s.d. | |
|---|---|---|---|---|---|
| BW (kg) | 241 | 181 | 288 | 24 | |
| DM intake (g/kg BW) | 17.9 | 15.2 | 20.8 | 1.4 | |
| DOM intake (g/kg BW) | 9.9 | 8.2 | 11.3 | 0.8 | |
| NDF intake (g/kg BW) | 11.1 | 9.4 | 12.9 | 0.9 | |
| CP intake (g/kg BW) | 1.6 | 1.4 | 1.9 | 0.1 | |
| ADG (g/day) | 265 | 68.2 | 446 | 114 | |
| FCE1 (kg ADG/kg DM intake) | 0.065 | 0.032 | 0.093 | 0.017 | |
| FCE2 (kg ADG/kg DOM intake) | 0.119 | 0.058 | 0.177 | 0.033 | |
| NUE (g N retained/kg N intake) | 136 | 35 | 210 | 45 | |
| DM digestibility (g/kg) | 594 | 555 | 633 | 21 | |
| OM digestibility (g/kg) | 609 | 568 | 645 | 20 | |
| NDF digestibility (g/kg) | 539 | 461 | 602 | 35 | |
| CP digestibility (g/kg) | 722 | 615 | 777 | 35 | |
| N faeces (g/kg N intake) | 271 | 211 | 335 | 30 | |
| N urine (g/kg N intake) | 464 | 336 | 632 | 99 | |
| N balance (g/day) | 18.1 | 4.7 | 30.3 | 7.7 | |
| PUN (mmol/L) | 3.11 | 2.54 | 4.45 | 0.42 | |
| Rumen N-NH3 0 h before feeding (mg N/L) | 41.6 | 30.7 | 58.2 | 7.3 | |
| Rumen N-NH3 3 h after feeding (mg N/L) | 132 | 112 | 162 | 14 | |
| δ15N in tail hair (‰) | 8.08 | 6.88 | 9.45 | 0.60 |
δ15N, natural abundance of the 15N isotope; ADG, average daily gain; CP, crude protein; DOM, digestible organic matter; NDF, neutral detergent fibre; NUE, nitrogen use efficiency; PUN, plasma urea nitrogen.
All performance and metabolic variables are presented as means ± s.d. for each diet in Tables 2 and 3 to demonstrate the extent of inter-animal variation. Due to temporal differences confounded with diet effects, comparisons between diets could not be made in this study, and thus P-values for diet effects are not provided and the data is presented in two separate tables. For both diets, all variables, including tail hair δ15N, exhibited considerable individual variation (range and s.d.), highlighting the variability in N metabolism across animals.
Tail hair δ15N as a predictor of growth rate, nitrogen use efficiency (NUE) and feed conversion efficiency (FCE)
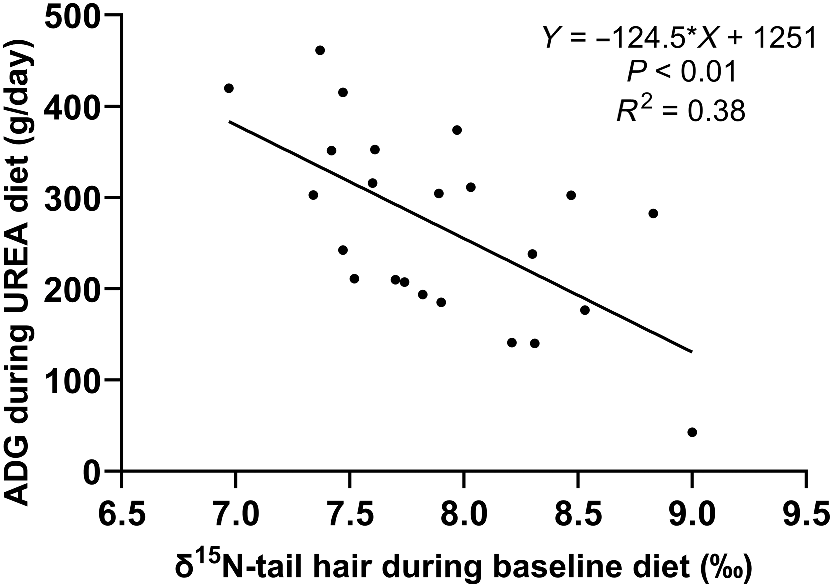
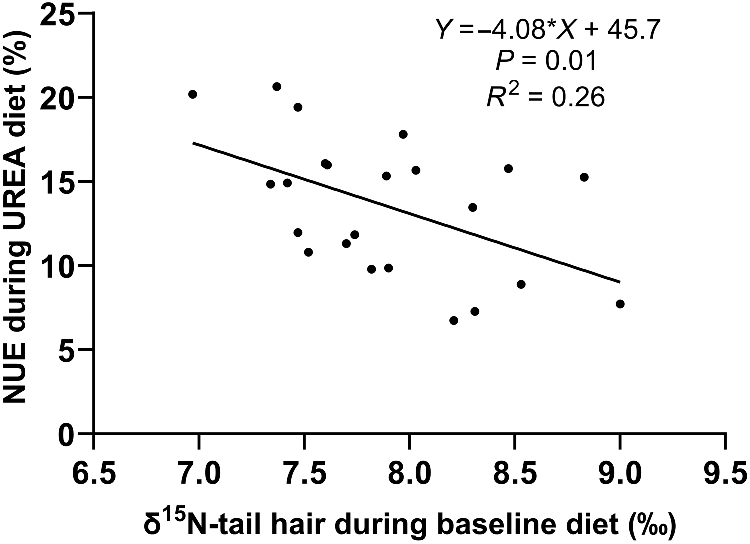
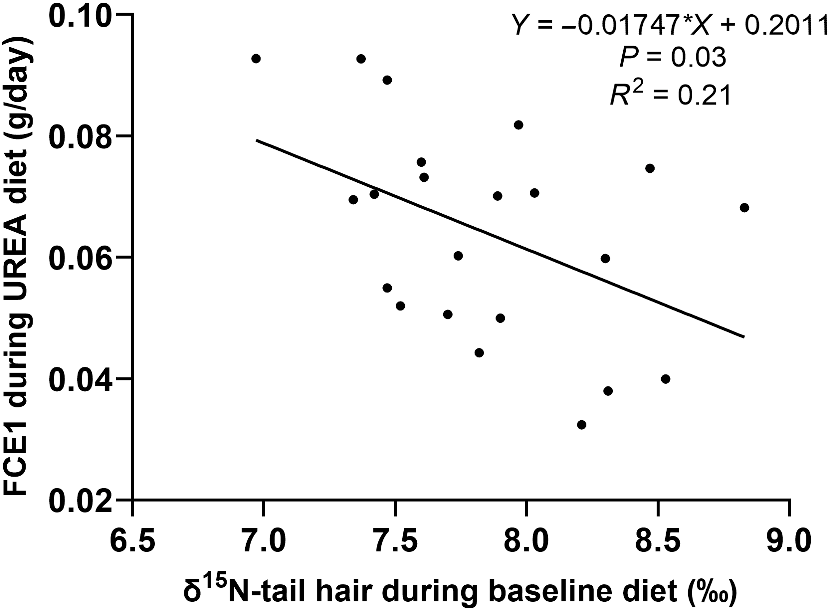
The growth rate, NUE, and FCE of steers on the urea supplemented diet were significantly correlated (P < 0.01), with the initial tail-hair δ15N measured during the baseline diet explaining 38% of the variation in ADG (Fig. 1), 26% of the variation in NUE (Fig. 2), and 21% of the variation in FCE (Fig. 3). Steers with lower δ15N in tail hair gained more weight and had greater NUE and FCE compared to those with higher δ15N values.
Variation of the average daily gain during urea diet to baseline natural abundance of the 15N isotope (δ15N).
Variation of the NUE during urea diet to baseline natural abundance of the 15N isotope (δ15N).
Variation of the feed conversion efficiency during urea diet to baseline natural abundance of the 15N isotope (δ15N).
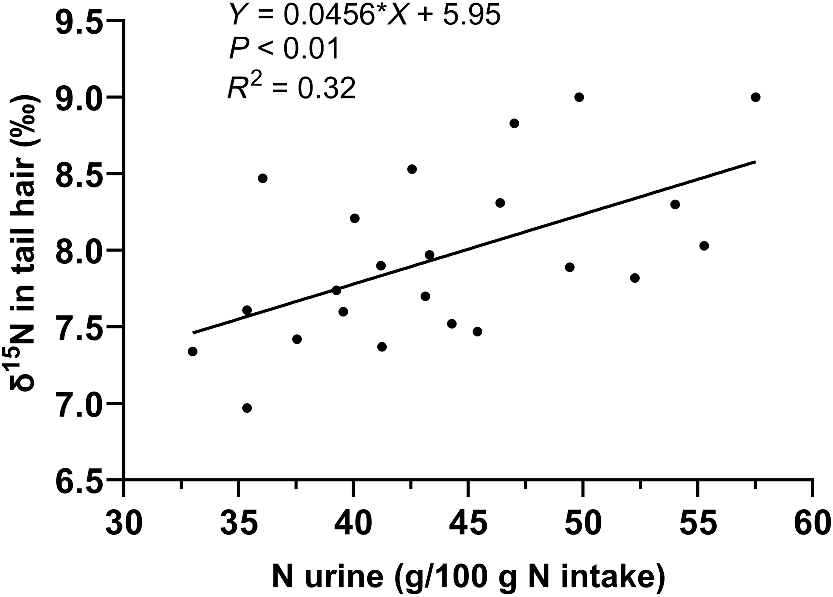
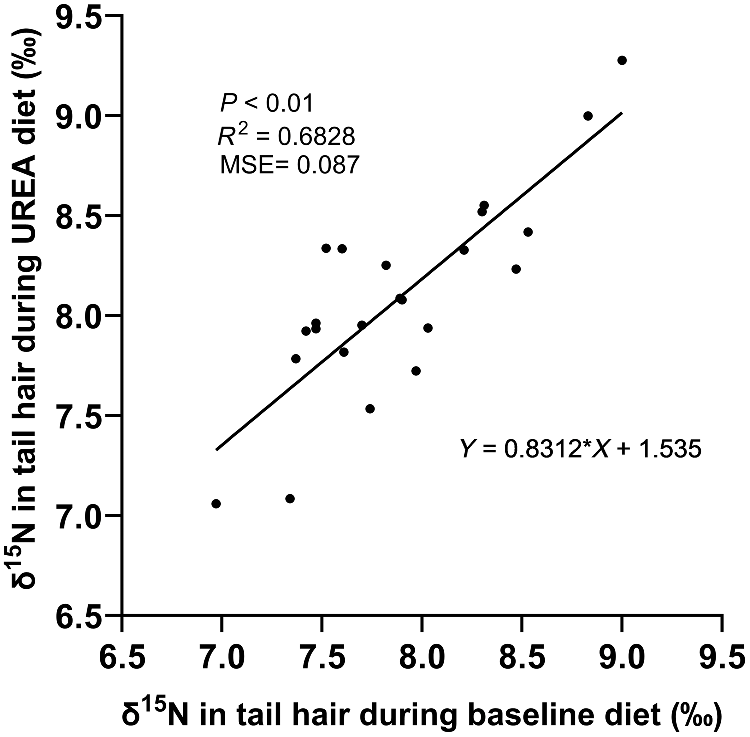
Additionally, δ15N from the baseline diet was correlated with urinary losses (P < 0.01), explaining 31.6% of the variation in urine N losses (Fig. 4). Rumen fluid ammonia and PUN were not correlated with any performance parameters on either diet (Tables 4 and 5). The ranking of δ15N values remained consistent between the baseline and urea supplemented diets, with δ15N from the baseline diet explaining 68% of the variation in δ15N during the urea supplemented diet (Fig. 5).
Variation of the natural abundance of the 15N isotope (δ15N) during baseline diet to urine nitrogen loss.
| Variables | 1 | 2 | 3 | 4 | 5 | 6 | 7 | 8 | 9 | 10 | 11 | 12 | 13 | 14 | 15 | |
|---|---|---|---|---|---|---|---|---|---|---|---|---|---|---|---|---|
| 1. δ15N in tail hair (‰) | – | |||||||||||||||
| 2. ADG (g/day) | −0.64** | – | ||||||||||||||
| 3. BW (kg) | 0.23 | −0.02 | – | |||||||||||||
| 4. FCE1 (kg ADG/kg DM intake) A | −0.62** | 0.99** | −0.03 | – | ||||||||||||
| 5. N intake (g/day) | −0.30 | 0.44* | 0.78** | 0.44* | – | |||||||||||
| 6. CP digestibility (%) | −0.52* | 0.37† | −0.36† | 0.35† | −0.07 | – | ||||||||||
| 7. DM digestibility (%) | 0.24 | −0.24 | 0.37† | −0.23 | 0.13 | −0.03 | – | |||||||||
| 8. NDF digestibility (%) | 0.37† | −0.29 | 0.51* | −0.28 | 0.18 | −0.20 | 0.96** | – | ||||||||
| 9. N urine (g/kg N intake) | 0.56* | −0.48* | 0.31 | −0.49* | −0.19 | −0.27 | 0.44* | 0.54* | – | |||||||
| 10. N faeces (g/kg N intake) | 0.52* | −0.37† | 0.36† | −0.35† | 0.07 | −1.00** | 0.03 | 0.20 | 0.27 | – | ||||||
| 11. Total N excretion (g/kg N intake) | 0.68** | −0.54* | 0.42* | −0.54* | −0.09 | −0.75** | 0.32 | 0.49* | 0.84** | 0.75** | – | |||||
| 12. N balance (g/day) | −0.71** | 0.55* | −0.45* | 0.54* | 0.09 | 0.73** | −0.36† | −0.52* | −0.85** | −0.73** | −0.99** | – | ||||
| 13. NUE (g N retained/kg N digested) | −0.68** | 0.54* | −0.41* | 0.54* | 0.11 | 0.67** | −0.32 | −0.48* | −0.89** | −0.67** | −0.99** | 0.98** | – | |||
| 14. Rumen N-NH3 (mg N/L) B | 0.14 | −0.12 | −0.41* | −0.07 | −0.47* | −0.08 | −0.09 | −0.07 | 0.02 | 0.08 | 0.06 | −0.04 | −0.05 | – | ||
| 15. PUN (mmol/L) | −0.09 | 0.09 | −0.13 | 0.09 | −0.13 | 0.27 | −0.34 | −0.32 | −0.21 | −0.27 | −0.29 | 0.28 | 0.26 | 0.42* | – |
ADG, average daily gain; CP, crude protein; FCE, feed conversion efficiency, NDF, neutral detergent fibre; NUE, nitrogen use efficiency; PUN, plasma urea nitrogen.
†P < 0.10. *P < 0.05. **P < 0.01.
| Variables | 1 | 2 | 3 | 4 | 5 | 6 | 7 | 8 | 9 | 10 | 11 | 12 | 13 | 14 | 15 | |
|---|---|---|---|---|---|---|---|---|---|---|---|---|---|---|---|---|
| 1. δ15N in tail hair (‰) | – | |||||||||||||||
| 2. ADG (g/day) | −0.43 | – | ||||||||||||||
| 3. BW (kg) | 0.11 | 0.37† | – | |||||||||||||
| 4. FCE1 (kg ADG/kg DM intake) A | −0.45* | 0.97** | 0.21 | – | ||||||||||||
| 5. N intake (g/day) | −0.53** | 0.65** | 0.27 | 0.54** | – | |||||||||||
| 6. CP digestibility (%) | 0.32 | −0.20 | −0.38† | −0.13 | −0.04 | – | ||||||||||
| 7. DM digestibility (%) | 0.33 | −0.31 | −0.14 | −0.29 | −0.27 | 0.62** | – | |||||||||
| 8. NDF digestibility (%) | 0.55** | −0.29 | 0.12 | −0.31 | −0.41 | 0.44* | 0.89** | – | ||||||||
| 9. N urine (g/kg N intake) | 0.47* | −0.24 | 0.26 | −0.22 | −0.69** | −0.09 | 0.33 | 0.55** | – | |||||||
| 10. N faeces (g/kg N intake) | −0.32 | 0.20 | 0.38† | 0.13 | 0.04 | −1.00** | −0.62** | −0.44* | 0.09 | – | ||||||
| 11. Total N excretion (g/kg N intake) | 0.33 | −0.15 | 0.36† | −0.16 | −0.63** | −0.39† | 0.11 | 0.37† | 0.95** | 0.39† | – | |||||
| 12. N balance (g/day) | −0.45* | 0.23 | −0.37† | 0.23 | 0.70** | 0.29 | −0.19 | −0.47* | −0.96** | −0.29 | −0.98** | – | ||||
| 13. NUE (g N retained/kg N digested) | −0.37† | 0.17 | −0.35 | 0.17 | 0.65** | 0.33 | −0.15 | −0.40 | −0.97** | −0.33 | −0.99** | 0.98** | – | |||
| 14. Rumen N-NH3 (mg N/L) B | 0.08 | −0.09 | 0.31 | −0.08 | −0.42 | −0.34 | −0.01 | 0.30 | 0.69** | 0.34 | 0.72** | −0.72** | −0.69** | – | ||
| 15. PUN (mmol/L) | 0.09 | −0.08 | −0.24 | 0.05 | −0.47* | 0.06 | 0.15 | 0.10 | 0.26 | −0.06 | 0.22 | −0.24 | −0.23 | 0.19 | – |
ADG, average daily gain; CP, crude protein; FCE, feed conversion efficiency, NDF, neutral detergent fibre; NUE, nitrogen use efficiency; PUN, plasma urea nitrogen.
†P < 0.10. *P < 0.05. **P < 0.01.
Correlation between δ15N in tail hair and metabolism parameters
Several significant correlations were identified between δ15N in tail hair and metabolic parameters during both the baseline and urea supplemented diets (Tables 4 and 5). These interactions revealed distinct relationships between variables within each diet. On the baseline diet, δ15N was positively correlated with CP digestibility (P = 0.01). Additionally, δ15N exhibited strong correlations with ADG (P < 0.01) and moderate correlations with urine N excretion (P < 0.01), total N excretion (P < 0.01), N balance (P < 0.01), and NUE (P < 0.01).
For the urea supplemented diet, δ15N showed a weak trend towards correlation with NUE (P = 0.08) and moderate correlations with urine N excretion (P = 0.02) and N balance (P = 0.03). Furthermore, δ15N on the urea supplemented diet was moderately correlated with N intake (P = 0.01) and NDF digestibility (P < 0.01).
Discussion
The primary aim of this study was to evaluate whether δ15N could predict animal performance, particularly ADG, under different nutritional conditions, including supplementation with urea. There was uncertainty about whether the relationship between δ15N, NUE, and ADG would still hold when steers were supplemented with urea. One possibility was that more efficient animals would respond poorly to urea supplementation, as they might already recycle N effectively to the rumen. Alternatively, it was hypothesised that more efficient animals (those with lower δ15N and greater NUE) would respond better to urea supplementation, as their ability to recycle N would minimise N losses from spikes in PUN and support better utilisation (Reynolds and Kristensen 2008).
Cattle show significant variation in weight gain, feed intake, and NUE even when on the same diet (Koch et al. 1963). This variability, observed in both baseline and urea supplemented diets in our study, is partly attributed to differences in N recycling, which improves nutrient utilisation, particularly in low-protein diets (Silva et al. 2019; Hailemariam et al. 2021). The variation in ADG, DMI, NUE, and urinary N excretion suggests δ15N could be used to identify animals that respond better to urea supplementation. Specifically, we observed a significant variation in ADG responses to urea supplementation, with 30% of cattle showing either less than 100 g/day or more than 250 g/day of ADG improvement. Identifying these animals with δ15N could help select for more efficient animals or target supplementation to those most likely to benefit. However, it is important to recognise that factors such as feed quality and N intake also contribute to this variability.
This study demonstrates that tail hair δ15N, measured during the baseline diet, was a useful predictor of individual differences in N metabolism, and explained a portion of the variation in ADG and NUE during the urea supplemented diet. Although the R2 values for ADG (0.38) and NUE (0.26) were moderate, δ15N was still able to identify more efficient animals (those with lower δ15N), who responded better to supplementation, likely due to their superior ability to retain N rather than excreting it in urine. This finding is particularly relevant in grazing systems, where cattle may intermittently consume urea supplements, and maintaining N balance is critical for improving performance.
The relationship between tail hair δ15N and FCE observed in this study agrees with findings from Guarnido-Lopez et al. (2022), who demonstrated that low residual feed intake (RFI) cattle, which are more feed-efficient, exhibited improved NUE, regardless of diet. These efficient RFI animals showed lower urinary N excretion and better protein retention, consistent with the metabolic processes reflected by δ15N. The improved NUE is associated with a reduced partitioning of N towards waste products, particularly urine, and more efficient utilisation of N for growth and body composition (Lapierre et al. 2006; Calsamiglia et al. 2010). Our findings further support the hypothesis that δ15N could reflect broader metabolic differences, including protein turnover and N recycling, directly influencing feed efficiency. While Guarnido-Lopez et al. (2022) focused primarily on high-starch diets, results from this study suggest that the δ15N relationship with feed efficiency holds across both forage-based and supplemented diets.
The observed variation in ADG and FCE in both baseline and urea supplemented diets is likely driven by differences in N metabolism. Individual variation in N kinetics has been well-documented (Marini and Van Amburgh 2003; Bailey et al. 2012), and this study further confirms that these metabolic differences contribute to variation in performance. Increasing dietary N typically enhances urea synthesis in the liver and N recycling into the rumen and intestinal system, although the proportion of N intake recycled to microbial production decreases as intake rises (Silva et al. 2019). Traditional N metabolism assessments are resource-intensive (Wickersham et al. 2008; Lavery and Ferris 2021; Parra et al. 2022), but alternative proxy measures, such as δ15N in tissue samples, offer promising solutions for measuring changes in N metabolism and NUE (Cantalapiedra-Hijar et al. 2022).
This study did not demonstrate significant individual variation in DM, OM, NDF and CP digestibility, suggesting other factors may account for the observed performance variation. More efficient steers may have a greater recycling of N without improving feed digestibility. It has been shown that glucose can decrease NDF digestibility (Bailey et al. 2012), and the addition of molasses may have influenced digestibility in the present study. Previous research has reported a decrease in NDF digestibility of 4.8 g/kg for every kg increase in DMI (Krizsan et al. 2010). Additionally, increasing CP has been shown to increase diet digestibility in cattle (Beaty et al. 1994). In the current study, the addition of M8U to the diet and the increase of DMI likely offset changes in digestibility, resulting in no significant differences.
Our study emphasises the need to consider the dietary context when interpreting δ15N values. On the baseline diet, δ15N correlated with ADG, CP digestibility, and total N excretion. On the urea supplemented diet, δ15N was associated with N intake and NDF digestibility. These results illustrate the variability in N metabolism across different diets and among individual cattle.
In addition to changes in digestibility, other factors like rumen fluid ammonia concentrations can be used as an indication of rumen microbial synthesis, reflecting protein available for animal performance (Calsamiglia et al. 2010). Low rumen ammonia concentration can limit fermentation efficiency and total microbial yield (Meng et al. 1999), and N recycling is strongly influenced by rumen ammonia (Li et al. 2019). Similarly, PUN concentration can reflect changes in rumen ammonia and N recycling (Obitsu and Taniguchi 2009), though it is not an ideal predictor of NUE. In this study, no correlation was found between rumen ammonia or PUN and performance or efficiency parameters, such as ADG and FCE. This lack of correlation supports the potential of δ15N in tail hair as an important proxy for N metabolism and performance.
Moreover, it was anticipated that steers with low δ15N in tail hair and lower urine N losses would exhibit higher rumen ammonia and PUN concentrations, but this was not observed. Ammonia not used for microbial synthesis is absorbed through the rumen and converted to urea in the liver (Lavery and Ferris 2021). The more efficient steers may be absorbing similar amounts of ammonia but recycling greater quantities of urea back to the rumen at a constant rate, which could explain why rumen ammonia and PUN were poor predictors of NUE in this study.
It is important to acknowledge the limitations of using δ15N as a proxy for NUE. Factors such as nutritional history, variations in feed quality, and differences in N intake can influence δ15N concentrations (Sponheimer et al. 2003; Bernard et al. 2020). Therefore, δ15N values should be compared only within animals consuming the same diet. In the present study, the different N sources between the baseline and urea supplemented diets likely affected the δ15N enrichment of body tissues, as urea is depleted in δ15N, compared to plant proteins (Choi et al. 2002; Ti et al. 2021). This makes it difficult to interpret δ15N values across diets and likely accounts for the similar δ15N values observed (Fig. 5) even though the diets had different NUE. Therefore, δ15N comparisons should be made only within animals consuming the same diet.
In the present study, the different sources of N supply between the baseline and the urea supplemented diet likely alters the 15N enrichment of body tissues, as urea is depleted of 15N (Choi et al. 2002; Ti et al. 2021). This limits the interpretation of δ15N across diets and likely explains the similar δ15N values observed across both diets (Fig. 5), reinforcing that δ15N comparisons should be made within animals on the same diet.
Despite these potential influences, this study demonstrated that δ15N in tail hair can be used to assess metabolic responses in cattle fed low CP diets and in response to molasses-urea supplementation. Importantly, the rankings of the steers’ δ15N from low to high remained consistent between the baseline and supplemented diets, showing that δ15N can be a reliable proxy for NUE, even with the addition of urea supplements, a common practice in grazing cattle (Harper et al. 2019). To our knowledge, this is the first study to report the consistency of δ15N rankings across diets of different protein levels.
It is also important to consider that during periods of negative energy balance, such as when cattle are mobilising body tissues, N is released into the bloodstream as muscle is degraded to supply amino acids for gluconeogenesis (Sadri et al. 2023). This process could potentially influence δ15N values and complicate the relationship between δ15N and NUE. However, despite this mobilisation, animals with more efficient N retention would likely have lower δ15N in tail hair due to reduced urinary N excretion. Although research on δ15N in such animals is limited, the general relationship between N efficiency and δ15N suggests that more efficient N retention may be reflected in lower δ15N, even during periods of negative energy balance.
The variability in intake observed in extensive grazing systems, where both ME and N intake fluctuate due to grazing preferences, activity, and environmental factors, must be considered when interpreting δ15N data. Previous research, including Silva et al. (2022), has addressed this challenge by using δ13C in tail hair to trace grazing patterns and diet selection. In that study, reproductive performance was not correlated with diet selection, as no differences in δ13C were found between groups. However, cows with higher productivity had lower δ15N values during the dry season, suggesting more efficient N metabolism and reduced N losses, regardless of diet choice. This indicates that grazing behaviour, such as selecting different plant species or plant parts, does not confound the relationship between δ15N and reproductive efficiency.
The potential variation in supplement intake within grazing herds, where individual animals may consume different amounts of supplements, represents a characteristic challenge of grazing systems. This variability could influence δ15N and its ability to identify more efficient animals, as faster-growing individuals may consume more supplements. However, this issue extends beyond δ15N and applies to all selection indices used to identify efficient animals in grazing systems, such as growth rate, fertility, calving interval, and weaning weight. One potential solution is to develop remote monitoring tools to track individual supplement intake, helping to account for this variability (Simanungkalit et al. 2020).
Conclusions
Identification of proxies for N metabolism is of great importance to research and commercial beef production. This study demonstrates that tail hair δ15N offers a promising, practical proxy for assessing N metabolism, enabling easier and faster research. The ADG and FCE of steers on a urea supplemented diet were significantly correlated with tail hair δ15N measured on a medium-protein diet. Tail hair δ15N effectively reflected N metabolic variables, including NUE and N-urine losses. Thus, δ15N in tail hair has potential as a management tool to identify cattle with superior N efficiency and better responses to urea supplementation. This could facilitate the selection of more nitrogen-efficient animals for retention in the breeding herd, enhancing overall productivity.
Conflicts of interest
Luis Prada e Silva and John Gaughan are Associate Editors of Animal Production Science. To mitigate this potential conflict of interest, they had no editor-level access to this manuscript during peer review. The authors have no further conflicts of interest to declare.
Declaration of funding
This research was partially supported by funds from the Meat and Livestock Australia under Grant P.PSH.1016.
Acknowledgements
We gratefully acknowledge the support of Milou Dekkers and her staff at the Queensland Animal Science Precinct.
References
Baethgen WE, Alley MM (1989) A manual colorimetric procedure for measuring ammonium nitrogen in soil and plant Kjeldahl digests. Communications in Soil Science and Plant Analysis 20, 961-969.
| Crossref | Google Scholar |
Bailey EA, Titgemeyer EC, Olson KC, Brake DW, Jones ML, Anderson DE (2012) Effects of supplemental energy and protein on forage digestion and urea kinetics in growing beef cattle. Journal of Animal Science 90, 3492-3504.
| Crossref | Google Scholar | PubMed |
Beaty JL, Cochran RC, Lintzenich BA, Vanzant ES, Morrill JL, Brandt RT, Jr., Johnson DE (1994) Effect of frequency of supplementation and protein concentration in supplements on performance and digestion characteristics of beef cattle consuming low-quality forages. Journal of Animal Science 72, 2475-2486.
| Crossref | Google Scholar | PubMed |
Bernard M, Cheng L, Chantelauze C, Song Y, Jeanleboeuf A, Sagot L, Cantalapiedra-Hijar G (2020) Nitrogen partitioning and isotopic discrimination are affected by age and dietary protein content in growing lambs. Animal 14, 942-951.
| Crossref | Google Scholar | PubMed |
Calsamiglia S, Ferret A, Reynolds CK, Kristensen NB, van Vuuren AM (2010) Strategies for optimizing nitrogen use by ruminants. Animal 4, 1184-1196.
| Crossref | Google Scholar | PubMed |
Cantalapiedra-Hijar G, Ortigues-Marty I, Sepchat B, Agabriel J, Huneau JF, Fouillet H (2015) Diet-animal fractionation of nitrogen stable isotopes reflects the efficiency of nitrogen assimilation in ruminants. British Journal of Nutrition 113, 1158-1169.
| Crossref | Google Scholar | PubMed |
Cantalapiedra-Hijar G, Guarnido P, Schiphorst AM, Robins RJ, Renand G, Ortigues-Marty I (2020) Natural 15N abundance in specific amino acids indicates associations between transamination rates and residual feed intake in beef cattle. Journal of Animal Science 98, skaa171.
| Crossref | Google Scholar |
Cantalapiedra-Hijar G, Morel I, Sepchat B, Chantelauze C, Miller GA, Duthie C-A, Ortigues-Marty I, Dewhurst RJ (2022) Identifying cattle with superior growth feed efficiency through their natural 15N abundance and plasma urea concentration: a meta-analysis. Peer Community Journal 2, e31.
| Crossref | Google Scholar |
Carmona P, Costa DFA, Silva LFP (2020) Feed efficiency and nitrogen use rankings of Bos indicus steers differ on low and high protein diets. Animal Feed Science and Technology 263, 114493.
| Crossref | Google Scholar |
Choi W-J, Lee S-M, Ro H-M, Kim K-C, Yoo S-H (2002) Natural 15N abundances of maize and soil amended with urea and composted pig manure. Plant and Soil 245, 223-232.
| Crossref | Google Scholar |
Coates DB, Dixon RM (2008) Faecal near infrared reflectance spectroscopy estimates of diet quality and responses to nitrogen supplements by cattle grazing Bothriochloa pertusa pastures. Australian Journal of Experimental Agriculture 48, 829-834.
| Crossref | Google Scholar |
Dixon RM, Sullivan MT, O’Connor SN, Mayer RJ (2022) Diet quality, liveweight change and responses to N supplements by cattle grazing Astrebla spp. (Mitchell grass) pastures in the semi-arid tropics in north-western Queensland, Australia. Rangeland Journal 44, 97-113.
| Crossref | Google Scholar |
Guarnido-Lopez P, Ortigues-Marty I, Salis L, Chantelauze C, Bes A, Noziere P, Cantalapiedra-Hijar G (2022) Protein metabolism, body composition and oxygen consumption in young bulls divergent in residual feed intake offered two contrasting forage-based diets. Animal 16, 100558.
| Crossref | Google Scholar | PubMed |
Hailemariam S, Zhao S, He Y, Wang J (2021) Urea transport and hydrolysis in the rumen: a review. Animal Nutrition 7, 989-996.
| Crossref | Google Scholar | PubMed |
Hendricksen RE, Ternouth JH, Punter LD (1994) Seasonal nutrient intake and phosphorus kinetics of grazing steers in Northern Australia. Australian journal of agricultural research 45, 1817-1829.
| Crossref | Google Scholar |
Holroyd RG, Mason GWJ, Loxton ID, Knights PT, Orourke PK (1988) Effects of weaning and supplementation on performance of brahman cross cows and their progeny. Australian Journal of Experimental Agriculture 28, 11-20.
| Crossref | Google Scholar |
Huntington G, Poore M, Hopkins B, Spears J (2001) Effect of ruminal protein degradability on growth and N metabolism in growing beef steers. Journal of Animal Science 79, 533-541.
| Crossref | Google Scholar | PubMed |
Koch RM, Swiger LA, Chambers D, Gregory KE (1963) Efficiency of feed use in beef cattle. Journal of Animal Science 22, 486-494.
| Crossref | Google Scholar |
Köster HH, Woods BC, Cochran RC, Vanzant ES, Titgemeyer EC, Grieger DM, Olson KC, Stokka G (2002) Effect of increasing proportion of supplemental N from urea in prepartum supplements on range beef cow performance and on forage intake and digestibility by steers fed low-quality forage. Journal of Animal Science 80, 1652-1662.
| Crossref | Google Scholar | PubMed |
Krizsan SJ, Ahvenjarvi S, Huhtanen P (2010) A meta-analysis of passage rate estimated by rumen evacuation with cattle and evaluation of passage rate prediction models. Journal of Dairy Science 93, 5890-5901.
| Crossref | Google Scholar | PubMed |
Lapierre H, Pacheco D, Berthiaume R, Ouellet DR, Schwab CG, Dubreuil P, Holtrop G, Lobley GE (2006) What is the true supply of amino acids for a dairy cow? Journal of Dairy Science 89, E1-E14.
| Crossref | Google Scholar | PubMed |
Lavery A, Ferris CP (2021) Proxy measures and novel strategies for estimating nitrogen utilisation efficiency in dairy cattle. Animals 11, 343.
| Crossref | Google Scholar | PubMed |
Li MM, Titgemeyer EC, Hanigan MD (2019) A revised representation of urea and ammonia nitrogen recycling and use in the Molly cow model. Journal of Dairy Science 102, 5109-5129.
| Crossref | Google Scholar | PubMed |
Marini JC, Van Amburgh ME (2003) Nitrogen metabolism and recycling in Holstein heifers. Journal of Animal Science 81, 545-552.
| Crossref | Google Scholar | PubMed |
McLennan SR, Bolam MJ, Kidd JF, Chandra KA, Poppi DP (2017) Responses to various protein and energy supplements by steers fed low-quality tropical hay. 1. Comparison of response surfaces for young steers. Animal Production Science 57, 473-488.
| Crossref | Google Scholar |
Meng Q, Kerley MS, Ludden PA, Belyea RL (1999) Fermentation substrate and dilution rate interact to affect microbial growth and efficiency. Journal of Animal Science 77, 206-214.
| Crossref | Google Scholar | PubMed |
Mertens DR (2002) Gravimetric determination of amylase-treated neutral detergent fiber in feeds with refluxing in beakers or crucibles: collaborative study. Journal of AOAC International 85, 1217-1240.
| Google Scholar | PubMed |
Nasrollahi SM, Meale SJ, Morgavi DP, Schiphorst AM, Robins RJ, Ortigues-Marty I, Cantalapiedra-Hijar G (2020) The origin of N isotopic discrimination and its relationship with feed efficiency in fattening yearling bulls is diet-dependent. PLoS ONE 15, e0234344.
| Crossref | Google Scholar | PubMed |
Obitsu T, Taniguchi K (2009) Quantitative comparison of diversity and conformity in nitrogen recycling of ruminants. Asian-Australasian journal of animal sciences 22, 440-447.
| Crossref | Google Scholar |
Parra MC, Costa DF, Meale SJ, Silva LFP (2022) Rumen bacteria and feed efficiency of beef cattle fed diets with different protein content. Animal Production Science 62, 1029-1039.
| Crossref | Google Scholar |
Peterson BJ, Fry B (1987) Stable isotopes in ecosystem studies. Annual Review of Ecology and Systematics 18, 293-320.
| Crossref | Google Scholar |
Poppi DP, McLennan SR (1995) Protein and energy-utilization by ruminants at pasture. Journal of Animal Science 73, 278-290.
| Crossref | Google Scholar | PubMed |
Poppi DP, Minson DJ, Ternouth JH (1981) Studies of cattle and sheep eating leaf and stem fractions of grasses. 2. Factors controlling the retention of feed in the reticulo-rumen. Australian Journal of Agricultural Research 32, 109-121.
| Crossref | Google Scholar |
Reynolds CK, Kristensen NB (2008) Nitrogen recycling through the gut and the nitrogen economy of ruminants: an asynchronous symbiosis. Journal of Animal Science 86, E293-E305.
| Crossref | Google Scholar | PubMed |
Sadri H, Ghaffari MH, Sauerwein H (2023) Invited review: Muscle protein breakdown and its assessment in periparturient dairy cows. Journal of Dairy Science 106, 822-842.
| Crossref | Google Scholar | PubMed |
Schwertl M, Auerswald K, Schnyder H (2003) Reconstruction of the isotopic history of animal diets by hair segmental analysis. Rapid Communications in Mass Spectrometry 17, 1312-1318.
| Crossref | Google Scholar | PubMed |
Silva LFP, Dixon RM, Costa DFA (2019) Nitrogen recycling and feed efficiency of cattle fed protein-restricted diets. Animal Production Science 59, 2093-2107.
| Crossref | Google Scholar |
Silva LFP, Hegarty RS, Meale SJ, Costa DAF, Fletcher MT (2022) Using the natural abundance of nitrogen isotopes to identify cattle with greater efficiency in protein-limiting diets. Animal 16(Suppl 3), 100551.
| Crossref | Google Scholar | PubMed |
Simanungkalit G, Hegarty RS, Cowley FC, McPhee MJ (2020) Evaluation of remote monitoring units for estimating body weight and supplement intake of grazing cattle. Animal 14, s332-s340.
| Crossref | Google Scholar | PubMed |
Sinclair KD, Sinclair LA, Robinson JJ (2000) Nitrogen metabolism and fertility in cattle: I. Adaptive changes in intake and metabolism to diets differing in their rate of energy and nitrogen release in the rumen. Journal of Animal Science 78, 2659-2669.
| Crossref | Google Scholar | PubMed |
Sponheimer M, Robinson T, Ayliffe L, Roeder B, Hammer J, Passey B, West A, Cerling T, Dearing D, Ehleringer J (2003) Nitrogen isotopes in mammalian herbivores: hair δ15N values from a controlled feeding study. International Journal of Osteoarchaeology 13, 80-87.
| Crossref | Google Scholar |
Tallo-Parra O, Albanell E, Carbajal A, Monclús L, Manteca X, Lopez-Bejar M (2017) Prediction of cortisol and progesterone concentrations in cow hair using near-infrared reflectance spectroscopy (NIRS). Applied Spectroscopy 71, 1954-1961.
| Crossref | Google Scholar | PubMed |
Ti C, Ma S, Peng L, Tao L, Wang X, Dong W, Wang L, Yan X (2021) Changes of δ15N values during the volatilization process after applying urea on soil. Environmental Pollution 270, 116204.
| Crossref | Google Scholar | PubMed |
Wickersham TA, Titgemeyer EC, Cochran RC, Wickersham EE, Gnad DP (2008) Effect of rumen-degradable intake protein supplementation on urea kinetics and microbial use of recycled urea in steers consuming low-quality forage. Journal of Animal Science 86, 3079-3088.
| Crossref | Google Scholar | PubMed |
Winks L, Laing AR, O’Rourke PK, Wright GS (1979) Factors affecting response to urea-molasses supplements by yearling cattle in tropical Queensland. Australian Journal of Experimental Agriculture 19, 522-529.
| Crossref | Google Scholar |