

Average daily gain in lambs grazing mixed annual forage species compared with single species and relationship to feed on offer
E. H. Clayton A * , H. Fahey A , P. Tyndall A , R. Lowrie A , B. Xu A , F. Ataollahi A and M. R. Norton A
A
Abstract
Annual forage crops provide high-quality fodder for livestock during typical autumn and winter feed-gaps in the south-east of Australia and benefits through rotations in cropping systems. While benefits from intercropping with cereals and pasture or mixing canola and peas have been studied in Australia, the potential animal-production benefits of grazing mixed annual species forage crops have not been examined.
To determine average daily gain (ADG) and rumen fluid parameters when sheep graze mixtures of annual fodder crops compared with a single species.
Ninety six Dorset × Border Leicester × Merino lambs (mean = 44.3 ± 0.55 kg) were allocated to one of the following four treatment groups (n = 24/treatment) on the basis of sex and liveweight; a single species brassica control (canola) (Br) or annual forage species mixes containing brassica (canola, turnip, radish) and cereal (wheat, cereal rye) (B + C), brassica and legume (vetch, arrowleaf clove) (B + L) or brassica, cereal and legume (B + C + L). Liveweight and rumen fluid parameters were assessed prior to grazing and again 21 and 35 days after the commencement of grazing.
Mean ADG from Day 0 to Day 21 was lower for female, but not male, lambs grazing the Br control (231 ± 23 g head−1 day−1) than for those grazing any forage mix (B + C = 292 ± 23 g head−1 day−1, B + L = 296 ± 23 g head−1 day−1, B + C + L = 310 ± 22 g head−1 day−1). Liveweight change over 35 days of grazing was not different between any forage mixtures. Rumen fluid pH was higher (P < 0.001) for sheep grazing forages containing cereals (B + C = 6.97 ± 0.06, B + C + L = 6.86 ± 0.06) than for those grazing brassica or legume (Br = 6.59 ± 0.06, B + L = 6.68 ± 0.06). Total volatile fatty acid concentration was lower and rumen pH was higher when sheep grazed B + C than when they grazed any other forage mix.
The higher ADG in females grazing mixtures than in those grazing the Br was related to higher dry matter on offer. Further research should determine whether the lower pH observed when sheep grazed brassica and legume than when grazing mixes containing cereals is associated with subacute rumen acidosis and reduced fibre degradation and forage energy utilisation.
Mixed forage species can provide higher DM on offer and ADG. Improved rumen efficiency could be related to improved growth.
Keywords: annual fodder crops, dry matter, efficiency, methane, production, rumen parameters, weight gain.
Introduction
Annual forage crops are used to provide high-quality fodder for livestock during typical autumn and winter feed-gaps in the south-east of Australia (Moore et al. 2009) and to provide benefits through rotations in cropping systems (Kirkegaard et al. 2008). The incorporation of these annual fodder crops into mixed farming production systems has increased in recent years, as the use of pasture phases in cropping systems has declined (Howieson et al. 2000). Annual fodder crops also provide farmers with a higher degree of flexibility in feedbase production than do multi-year pasture phases. Until recently, annual forage crops have mainly comprised single species plantings of cereals, for example, oats or dual-purpose wheat (McGrath et al. 2021a), and occasionally a forage brassica or legume species. However, there is growing interest in the potential to mix these different plant families to provide greater nutritional diversity to grazing livestock, to improve soil conditions for subsequent crops, to optimise and lengthen the temporal distribution of feed availability and to increase the overall production of the forage crop.
Animal production can be less than optimal when sheep or cattle graze single species, which can be related to anti-nutritional compounds such as nitrates or glucosinolates in brassica species (Barry 2013) or suboptimal energy–protein or mineral balances, such as sodium or magnesium deficiencies in cereal crops (Masters 2015). Grazing mixtures of annual forage species with greater diversity may allow livestock to select their optimal diet, thus reducing risks of suboptimal nutrition (Provenza and Balph 1990). Other potential benefits of mixed species crops include improved soil properties, better surface and subsoil structure, enhanced nutrient cycling, greater soil carbon balance, increased soil macrofauna activity as well as reduced requirements for inputs such as fertilisers and herbicides in cropping systems and providing weed-management benefits through weed suppression and diversifying control options (Malézieux et al. 2009; Lithourgidis et al. 2011; Nelson et al. 2012; Chateil et al. 2013). Claims that the yield potential of multi-plant family species may be greater than that of single species crops have generally been made on the basis of ecological theory or in situations where grazing has not occurred (Hector et al. 1999); however, as indicated by previous authors, there is little experimental evidence to support such claims (Florence and McGuire 2020).
While research has been conducted in Australia examining mixtures of some species such as canola and peas or intercropping with cereals and pastures (Craig et al. 2013; Fletcher et al. 2016), the potential animal-production benefits of grazing mixed annual forage crops have not been quantified. Therefore, the aim of the current study was to determine whether average daily gain was improved when sheep grazed mixtures of annual fodder crops including brassica (canola, turnip, radish), cereal (wheat, cereal rye) and legume (vetch, arrowleaf clover) compared with grazing a single species.
Materials and methods
The study was conducted at the Wagga Wagga Agricultural Institute (35°02′55″S, 147°19′34″E) and was approved by the NSW Department of Primary Industries ACEC (Authority Number OAEC 0496) in compliance with the Animal Research Act 1985 (as amended) in accordance with the Australian Code of Practice for the Care and Use of Animals for Scientific Purposes (NHMRC 2013).
Forages, sowing and sample collection
The forage species selected for the current study were from a diverse plant family mix, including Brassicaceae (brassica), Poaceae (cereal) and Fabaceae (legume), which aimed to provide greater overall forage production as well as growth over a longer period of time for grazing. For example, early-season growth was expected from the brassica species, whereas later-season growth was expected from other species such as arrowleaf clover and cereal rye.
There were four experimental groups in the study, including a single-species control group and three mixed-species treatment groups, as follows:
A single-species brassica (Br) comprising canola (Brassica napus L. cv. Hyola 970) sown at 3 kg ha−1;
A brassica + cereal mixture (B + C) comprising canola at 3 kg ha−1, tillage radish (Raphanus sativus) at 2 kg ha−1, purple top turnip (B. rapa subsp. rapa) at 0.3 kg ha−1, wheat (Triticum aestivum L. cv. Ilabo) at 20 kg ha−1 and cereal rye (Secale cereale L. cv. Vampire) at 5 kg ha−1.
A brassica + legume mixture (B + L) comprising canola at 3 kg ha−1, tillage radish at 2 kg ha−1, purple top turnip at 0.3 kg ha−1, common vetch (Vicia sativa subsp. sativa) at 10 kg ha−1 and arrowleaf clover (Trifolium vesiculosum cv. Zulu 2) at 0.5 kg ha−1;
A brassica + cereal + legume mixture (B + C + L) comprising canola at 3 kg ha−1, tillage radish at 2 kg ha−1, purple top turnip at 0.3 kg ha−1, wheat at 20 kg ha−1, cereal rye at 5 kg ha−1, common vetch at 40 kg ha−1 and arrowleaf clover at 0.5 kg ha−1.
The seeding rates were based on commercial practice common in the mixed farming zone of south-eastern Australia (G. Condon, pers. comm.). Canola was sown at a lower rate than were other species, because this sowing rate is a compromise between forage yield and seed cost and also allows for grain harvest to occur (dual-purpose cropping), whereby animals can be excluded from grazing mid-season and grain harvested at the end of the year.
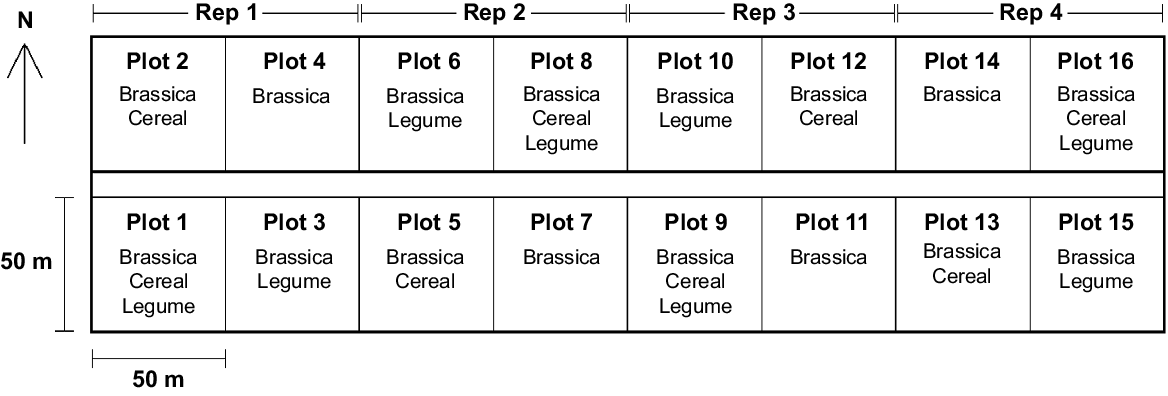
The four treatments were arranged in a randomised complete-block design, with each treatment being replicated four times, with a total of 16 plots (each 50 × 50 m, Fig. 1). The crops were sown in the first week of April 2023 (3rd to 5th) with a tyned seeder (0.17 m row spacing). Grazing commenced 79 days after sowing when there was greater than 1600 kg DM ha−1 on offer in all plots. Prior to grazing and 3 and 5 weeks after the grazing commenced, a BOTANAL assessment (t’Mannetje and Haydock 1963; Haydock and Shaw 1975; Tothill et al. 1992) was conducted to measure the quantity and composition of forage present in each plot. At each sampling occasion, each plot received 26 assessments of total dry matter, botanical composition and percentages of ground cover and live matter. For each of these assessments, 15 quadrats (0.5 m× 0.5 m dimension) were cut at 2.5 cm height for the development of calibration curves to estimate total dry matter. An estimate of plant density (% ground cover) was also made at each assessment. Representative grab samples of fodder from all treatment replicates were also collected on each occasion to estimate nutritive value. All samples were initially stored in a chilled insulated container and then dried at 70°C in a forced-draught oven until constant weight.
Animals and grazing
In total, 96 Dorset × Border Leicester × Merino lambs (11 months of age, 48.5 ± 0.32 kg, fat score (FS) = 2.93 ± 0.03) were enrolled in the project (n = 32 males and n = 64 females). Prior to the commencement of grazing, all lambs were vaccinated against clostridial diseases and caseous lymphadenitis (CLA, Glanvac 6, Zoetis, West Ryde, Sydney) and treated with a combination anthelmintic drench (TriGuard, Boehringer Ingelheim Animal Health Australia, North Ryde, NSW, Australia). Lambs were stratified by sex, ranked on liveweight (LW) and FS (White and Holst 2006) and randomly allocated to 1 of 16 plots (four plots per treatment, n = 8 males and 16 females per treatment). Lambs were acclimatised to a standard forage mix comprising the full species mixture (B + C + L) over a 10 day period prior to study commencement. Lambs grazed the plots (n = 6 per plot) for 35 days with free access to fresh water and a mixture of salt (NaCl), lime (CaCO3) and magnesium oxide (MgO, 2:2:1) at all times. Mineral consumption was recorded as the difference in weight of minerals offered and refused on a weekly basis.
After 21 days of grazing, the dry matter on offer in the Br control plots had fallen below a level that could sustain an adequate average daily gain (ADG); therefore, three sheep per plot (those from which rumen fluid and blood samples were not collected) were removed. The remaining three sheep grazed the Br control plots for a further 2 weeks until rumen and blood sampling; however, their LW and ADG data from Day 21 to Day 35 were not included in the statistical analyses. No other lambs were added or removed from any of the other plots and the stocking rate was kept constant for the period of grazing, as is common in the mixed farming zone of south-eastern Australia (McGrath et al. 2021b).
Animal sampling and data collection
Rumen fluid and LW data were collected prior to grazing the experimental plots and again on Days 21 and 35 after the commencement of grazing. Rumen fluid and blood was collected from three sheep per plot (two females and one male randomly selected from sheep in each plot). The LW of all lambs was measured using Ruddweigh 700™ scales (Gallagher Australia, Rydalmere, NSW, Australia) following calibration at the beginning and end of each weighing by using a known check weight.
Rumen fluid was collected using a stomach tube (Clayton et al. 1999). Following collection, rumen fluid was assessed for saliva contamination (Bramley et al. 2008) and if contaminated, the sample was discarded and another sample taken, as saliva artificially increases pH and dilutes rumen volatile fatty acid (VFA) concentration. If the second sample appeared to be contaminated, the sample was still collected; however, the values were not included in the analysis of VFA concentration. Approximately 10 mL of rumen fluid was decanted into a plastic container, placed on ice immediately and then frozen at −18°C until further processing.
Sample analysis
A subsample of approximately 150 g of each forage grab sample was dried in an oven at 70°C until constant weight to determine dry matter (DM) percentage, then ground through a 1 mm sieve (Wiley 5000, Location) prior to analysis. Proximate analyses (% DM) including neutral detergent fibre (NDF), acid detergent fibre (ADF), nitrogen (N), water-soluble carbohydrates (WSC) and ether extract (EE) and digestible organic matter in the DM (DOMD) were determined using near infra-red reflectance (NIR) spectroscopy with a Bruker multi-purpose analyser (MPA, Bruker Optik GmbH, Ettlingen, Germany) and OPUS software (ver. 5.1), with calibrations developed by the NSW Department of Primary Industries Feed Quality Service (NSW DPI FQS) as described previously (Packer et al. 2011).
Crude protein (CP, % DM), metabolisable energy (M/D) content (MJ (kg DM)−1) and non-fibre carbohydrate (NFC, % DM) were calculated using the following equations (NRC 2001; AFIA 2006):
Thawed rumen fluid samples were centrifuged at 1500g for 10 min at room temperature and a 100 μL aliquot of supernatant was transferred to a 1.5 mL plastic eppendorf tube containing 900 μL of dilute acid (1% formic–1% ortho-phosphoric acid mixture containing 4-methylvaleric internal standard at 184 mg L−1). VFA concentrations were determined by capillary gas chromatography (GC) by using an Agilent 6890 gas chromatograph with an autosampler and autoinjector, as described previously (Packer et al. 2011). The method employed a wide bore capillary column (SGE BP21 column; 12 m × 0.53 mm internal diameter (i.d.) and 0.5 μm film thickness, SGE International, Ringwood, Victoria, Australia, P/N 054473) with retention gap kit (including a 2 m × 0.53 mm i.d. guard column, P/N SGE RGK2).
For GC analysis, the carrier gas was helium with a total flow rate of 48.0 mL min−1, a split ratio of 5:1 and a column flow of 7.84 mL min−1. The inlet temperature was 155°C, inlet pressure was 19 kPa and injection volume was 1 μL. The oven temperature was set at 80°C for 2 min, increased at 6°C per min to 122°C, increased at 12°C per min to 144°C, increased at 40°C per min to 180°C, held for 2 min and then increased at 40°C per min up to 220°C and maintained to give a total run time of approximately 20 min. The flame ionisation detector temperature was set at 200°C, with the following gas flow rates; hydrogen, 35 mL min−1; instrument air, 350 mL min−1; and nitrogen make-up gas, 25 mL min−1. Sample VFA peaks were identified by comparing their retention times with those of a standard mixture of genuine VFAs (Sigma Aldrich) and quantified using Chemstations ver. C.01 and Microsoft Excel by using 4-methylvaleric acid as the internal standard. All results were calculated as mg L−1 and converted to mmol L−1 for subsequent analyses. The ratio of propionate to acetate plus two times butyrate (Pr:(Ac + 2Bu)) was also calculated from molar concentrations.
Forage height was calculated from DM on offer (kg DM ha−1) and density (% cover) by using the relationship included in the GrazFeed decision support tool, where a 3 cm high pasture with 100% density = 1000 kg DM ha−1 (Freer et al. 2012). The estimated DM intakes (DMI) of forages from Day 0 to Day 21 or Day 21 to Day 35 was calculated from DM on offer, forage height and digestibility by using GrazFeed (Freer et al. 2012). Total mineral intake (to be reported separately) was then used to calculate mineral intake as a proportion of DMI, taking into account six sheep per plot for all plots except Br only, from Day 21 to Day 35, where there were only three sheep per plot.
Methane (CH4) output (g day−1) was calculated by two methods. First, from the concentration of the major VFAs according to the following formula:
where the concentration of VFA is mol L−1 and 16.042 is the molecular weight of CH4 (Moss et al. 2000; Williams et al. 2019).
Second, from the proportion of VFAs according to the following formula:
where the proportion of VFA is mol 100 mol−1 of total VFA and 16.042 is the molecular weight of CH4 (Moss et al. 2000).
Statistical analyses
Prior to analysis, data were assessed for assumptions of normal distribution by evaluating frequency histogram and quantile–quantile plots and the Kolmogorov–Smirnov goodness-of-fit statistic using the univariate procedure in the SAS statistical program (ver. 6.12, SAS Institute Inc. 1997). Differences in DM yield, proximate analysis and weight of sheep among fodder treatments for Day 0, 21 and 35 sample collections were determined by repeated-measures analysis using the mixed-model procedure in SAS. The restricted maximum-likelihood (REML) estimation used ‘Plot’ as te individual experimental unit and ‘sheep’ within ‘plot’ as a sampling unit (Littell et al. 1998). The most appropriate covariance structure for each analysis was determined by reference to the Schwarz’s Bayesian information criterion (Wang and Goonewardene 2004). The analysis examined the fixed effects of ‘forage treatment’ and ‘day’, as well as the interaction between fixed effects, with ‘plot’ and ‘sex’ examined as random effects. For DM yield, separate analyses were conducted for Days 0–21 (with all forage species) or Day 35 only without Br. Differences in ADG among treatment groups were determined using the mixed-model procedure in SAS with ‘forage treatment’ and ‘sex’ as fixed effects as well as the interaction between fixed effects. The relationships between the analysis of proximate components of feed and weight gain were analysed by Pearson correlation by using SAS. An alpha of 0.05 was used for all statistical tests. One lamb in the B + C + L treatment was found to have cut their first tooth prior to the completion of the study and there was an error of weight measurement for one lamb in the B + C treatment at the Day 35 measurement and data from both sheep were excluded from the analysis.
Results
Mean DM on offer from Day 0 to Day 21 was highest for the B + C + L forage treatment compared with B + C, B + L or Br control (Table 1) and decreased for all plots over the period of grazing (Fig. 2). The DM on offer of individual species reflected the main species sown in each plot (Fig. 3). Mean pasture density (% cover) from Day 0 to Day 21 and on Day 35 was highest for the B + C + L forage treatment compared with any other treatment (Table 1). Mean calculated pasture height from Day 0 to Day 21 was 9.2, 9.8, 8.2 and 7.8 cm for the Br, B + C, B + L and B + C + L forage treatments respectively.
| Item | Forage treatment | s.e.m. | P-value | ||||||
|---|---|---|---|---|---|---|---|---|---|
| Br | B + C | B + L | B + C + L | Forage treatment | Day | Treatment × Day | |||
| Total DM yield (kg DM ha−1) | |||||||||
| Days 0–21 | 1538c | 1906b | 1922b | 2525a | 56.6 | <0.001 | <0.001 | 0.783 | |
| Day 35 | – | 1303b | 1071bc | 1882a | 91.7 | <0.001 | – | – | |
| Density (% cover) | |||||||||
| Days 0–21 | 64.6c | 66.2c | 78.6b | 92.6a | 1.42 | <0.001 | <0.001 | <0.001 | |
| Day 35 | – | 35.5b | 33.9b | 80.8a | 2.88 | <0.001 | <0.001 | <0.001 | |
| Species composition (% DM) | |||||||||
| Brassica | 97.9 | 24.5 | 59.3 | 15.0 | 2.32 | <0.001 | <0.001 | <0.001 | |
| Cereal | 0.00 | 75.4 | 0.65 | 27.5 | 2.08 | <0.001 | <0.001 | <0.001 | |
| Legume | 0.03 | 0.03 | 39.5 | 57.5 | 2.47 | <0.001 | <0.001 | 0.017 | |
Values are least-squares means ± standard errors of the least-squares means. Br control was grazed for 21 days; treatments B + C, B + L and B + C + L were grazed for 35 days. Species composition reflects the main forage treatments under investigation and does not include minor species (weeds).
Means in the same row with different letters differ significantly (at P =0.05).
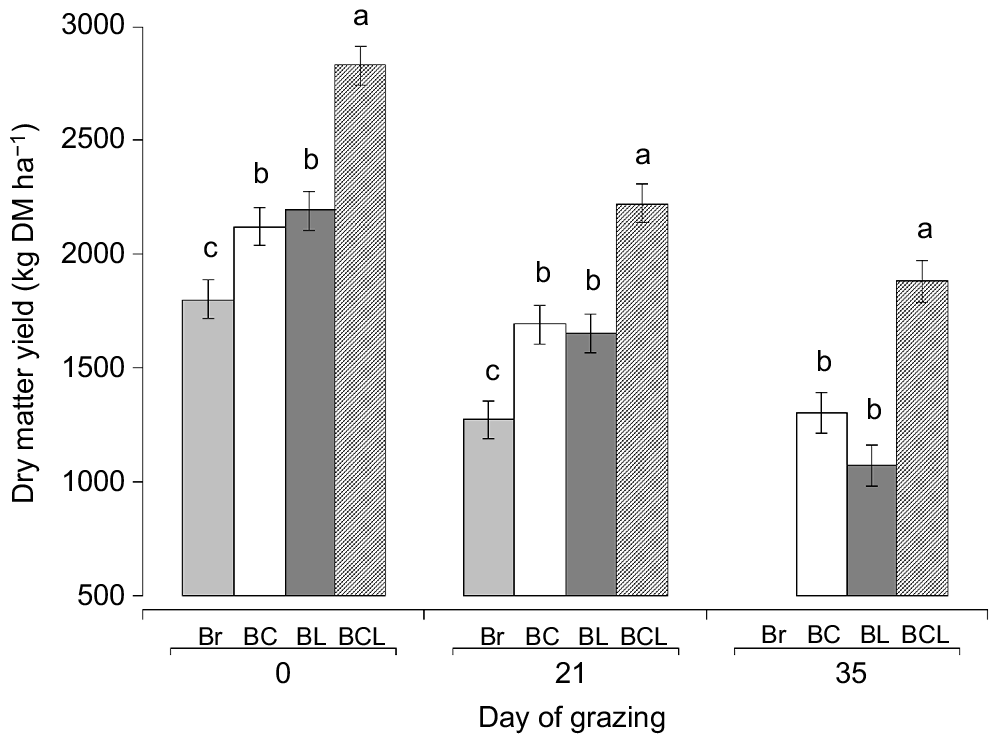
Mean dry matter yield for plots containing brassica only (Br) or a mixture of brassica and cereal (BC), brassica and legume (BL) or brassica, cereal and legume (BCL). Values are least-squares means ± standard errors of the least-squares means. Means with different letters within day of grazing differ significantly (at P = 0.05).
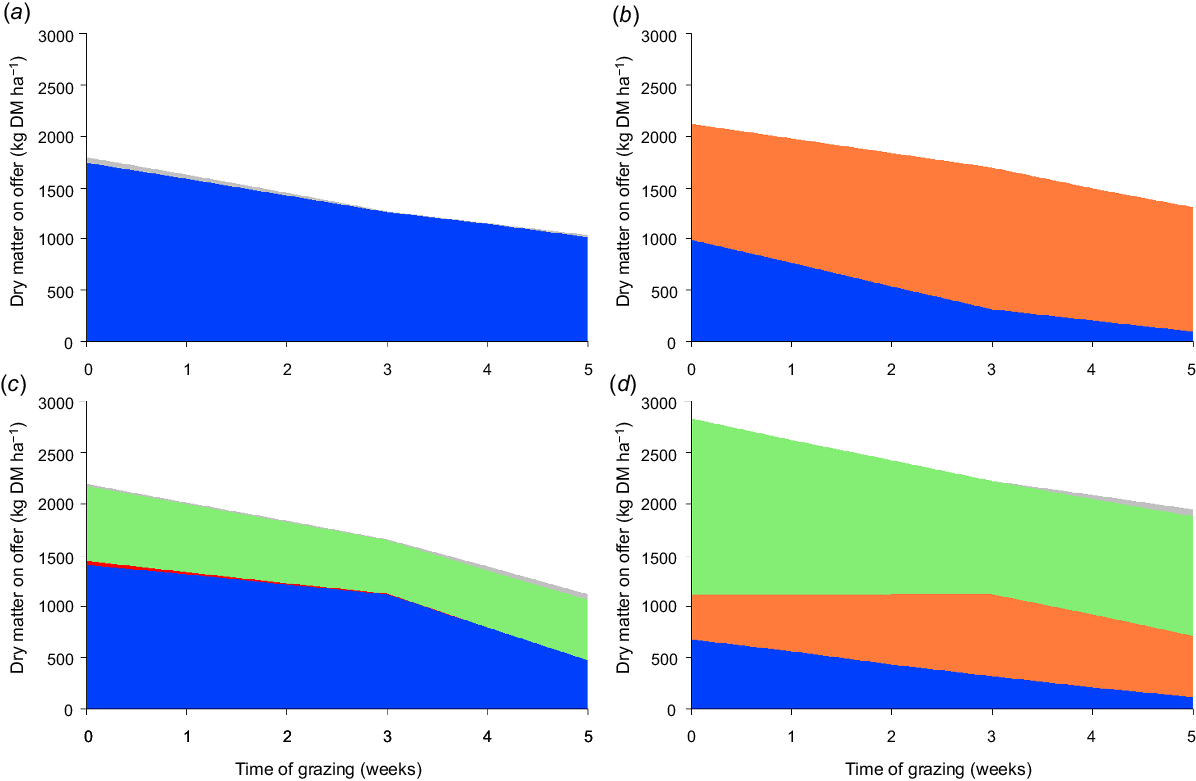
Dry matter on offer of individual species including brassica ( ), cereal (
 ), legume (
 ) or other species (
 ) for plots containing (a) brassica only or a mixture of (b) brassica + cereal, (c) brassica + legume or (d) brassica + cereal + legume.
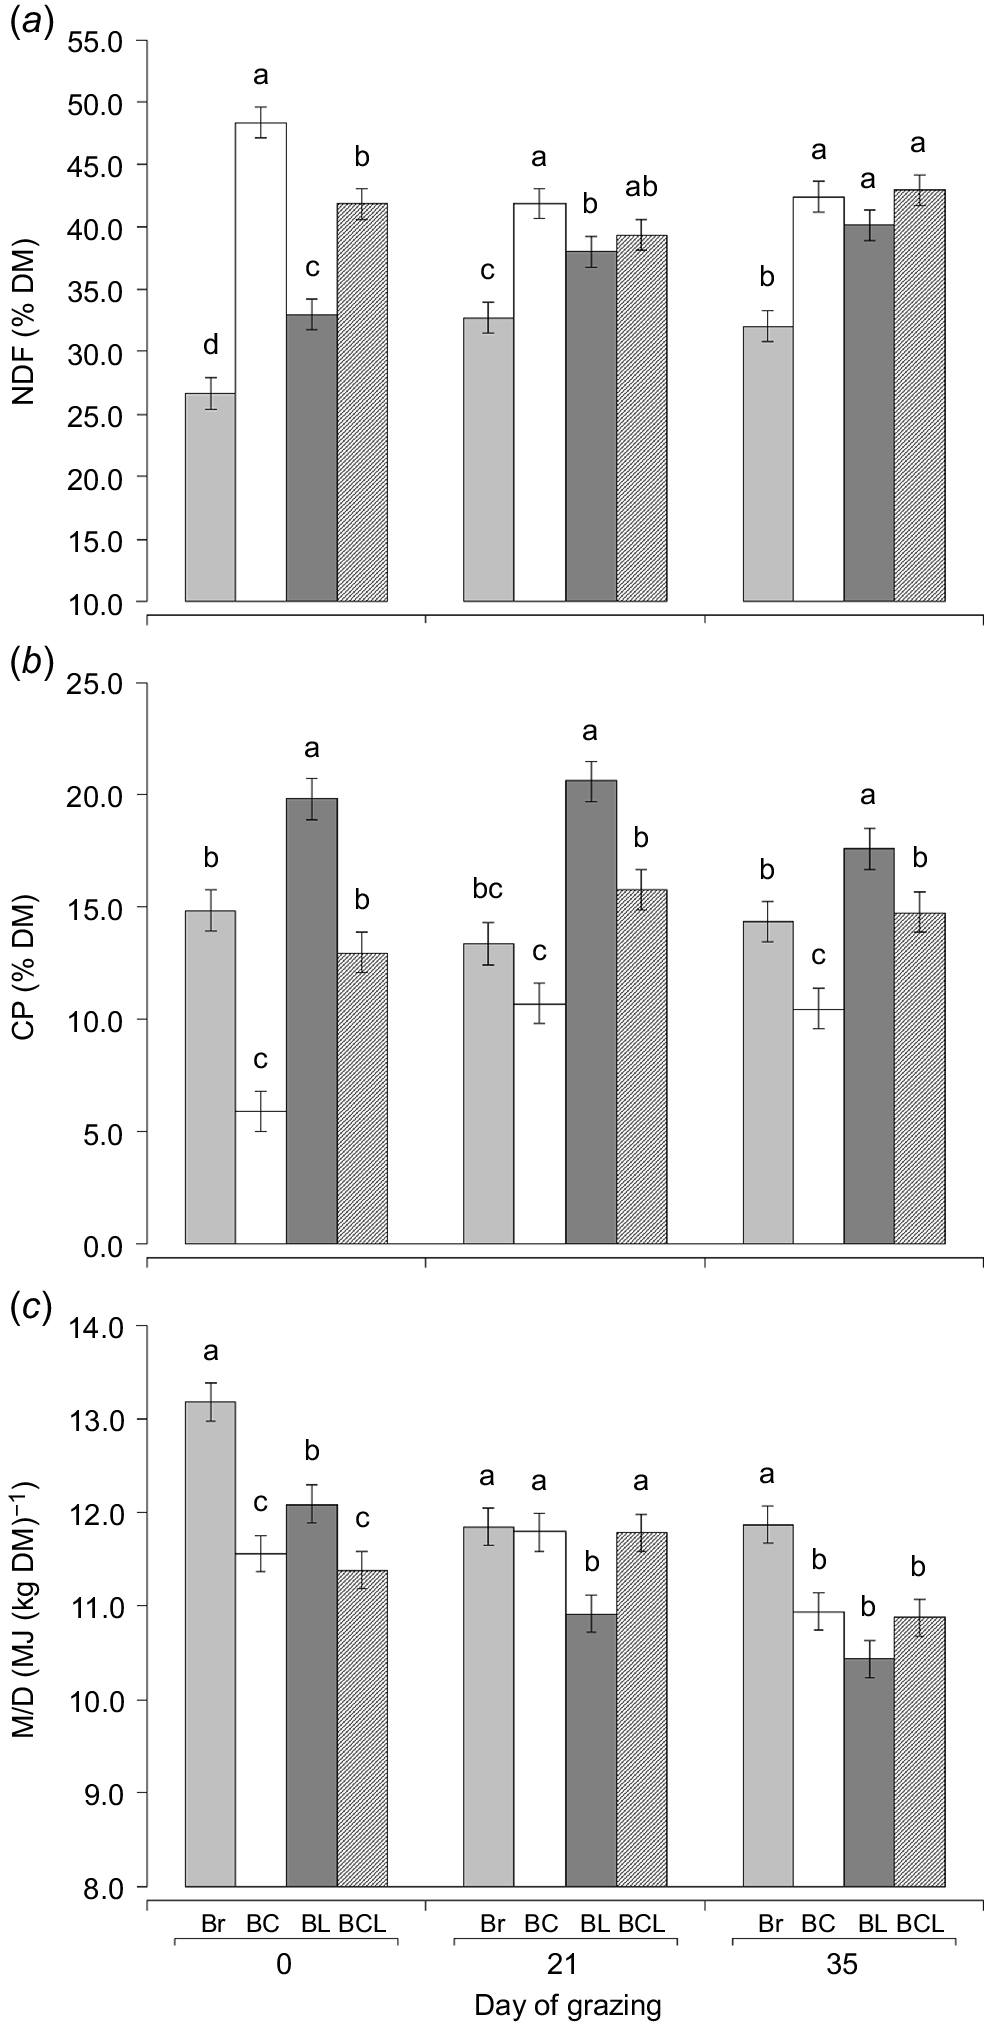
The NDF concentration was lowest for the Br control compared with any other treatment (Table 2). The CP concentration was higher in plots containing the B + L treatment than in any other treatment, whereas the M/D was highest in plots containing Br only (Table 2). The M/D of the brassica only forage declined from the commencement of grazing until Day 21, but remained similar by the end of grazing (Day 35, Fig. 4c) and higher than that of any other forage treatment.
| Item | Forage treatment | s.e.m. | P-value | ||||||
|---|---|---|---|---|---|---|---|---|---|
| Br | B + C | B + L | B + C + L | Forage treatment | Day | Treatment × Day | |||
| NDF (% DM) | 30.5 d | 44.2a | 37.0c | 41.4b | 0.57 | <0.001 | 0.076 | <0.001 | |
| ADF (% DM) | 19.1c | 25.6a | 24.8ab | 24.2b | 0.42 | <0.001 | 0.000 | <0.001 | |
| CP (% DM) | 14.2b | 9.0c | 19.4a | 14.5b | 0.49 | <0.001 | 0.052 | 0.011 | |
| Ash (% DM) | 14.4b | 11.0c | 20.1a | 12.2c | 0.79 | <0.001 | <0.001 | 0.113 | |
| WSC (% DM) | 19.2b | 24.6a | 12.6c | 18.8b | 0.90 | <0.001 | 0.003 | 0.586 | |
| EE (% DM) | 2.84a | 2.52b | 2.55b | 2.78a | 0.05 | 0.003 | <0.001 | 0.002 | |
| NFC (% DM) | 38.1a | 33.3b | 21.0c | 29.1b | 1.50 | <0.001 | <0.001 | 0.236 | |
| M/D (MJ (kg DM)−1) | 12.3a | 11.4b | 11.1b | 11.4b | 0.11 | <0.001 | <0.001 | <0.001 | |
Values are least-squares means ± standard errors of the least-squares means. Br control was grazed for 21 days; treatments B + C, B + L and B + C + L were grazed for 35 days.
Means in the same row with different letters differ significantly (at P = 0.05).
DM, dry matter; NDF, neutral detergent fibre; ADF, acid detergent fibre; CP, crude protein; WSC, water-soluble carbohydrate; EE, ether extract; NFC, non-fibre carbohydrate [100 – NDF – CP – Ash – EE; NRC 2001].
Proximate analysis including (a) neutral detergent fibre (NDF), (b) crude protein (CP) and (c) metabolisable energy (M/D) of plots containing brassica only (Br) or a mixture of brassica + cereal (BC), brassica + legume (BL) or brassica + cereal + legume (BCL) for 35 days. Different letters between fodder species (within day of grazing) indicate significant differences (at P = 0.05).
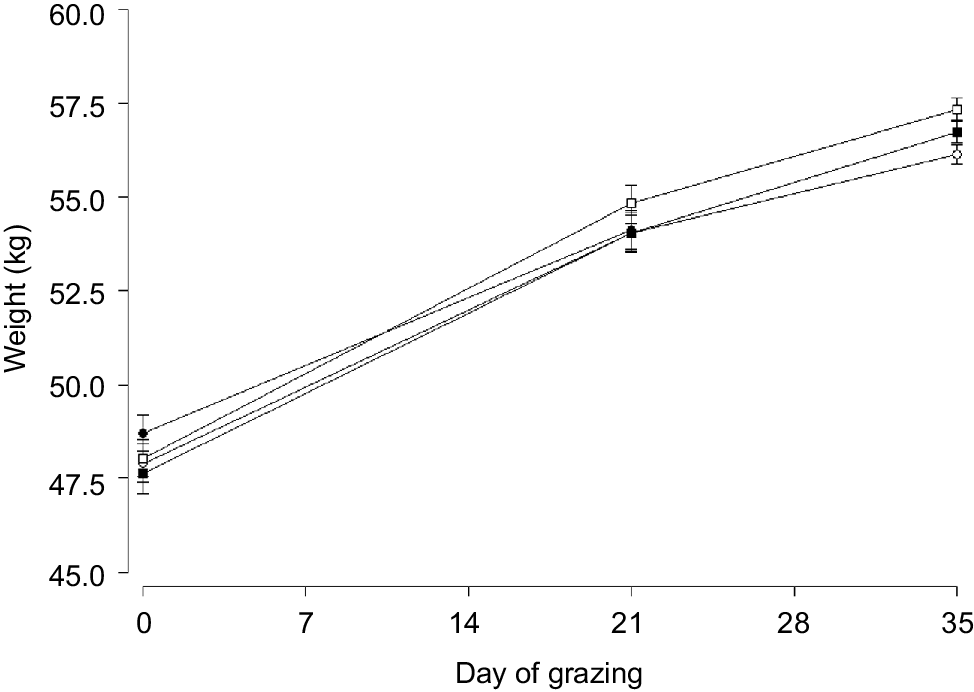
Mean LW from Day 21 to Day 35 was higher (P = 0.004) when lambs grazed plots containing the full mix of B + C + L than when grazing two-species mixes (B + C or B + L); however, it was not different between treatments from Day 0 to Day 21 or Day 0 to Day 35 (Table 3). Mean LW increased over the period of grazing but was lower when lambs grazed plots containing B + C than those containing B + C + L 35 days after the commencement of grazing (Fig. 5).
| Time period | Forage treatment | s.e.m. | P-value | ||||||
|---|---|---|---|---|---|---|---|---|---|
| Br | B + C | B + L | B + C + L | Forage treatment | Day | Treatment × Day | |||
| Weight (kg head−1) | |||||||||
| Days 0–21 | 51.87 | 51.41 | 51.29 | 51.87 | 0.64 | 0.879 | <0.001 | 0.063 | |
| Days 21–35 | – | 55.05b | 55.41b | 56.09a | 0.32 | 0.004 | <0.001 | 0.068 | |
| Days 0–35 | – | 52.69 | 52.80 | 53.40 | 0.39 | 0.333 | <0.001 | 0.049 | |
| Weight gain (kg ha−1) | |||||||||
| Days 0–35 | 87.3c | 188.2b | 218.9ab | 223.2a | 11.12 | <0.001 | – | – | |
| ADG (g head−1 day−1) | |||||||||
| Days 0–21 | 262.8 | 304.7 | 306.3 | 324.0 | 19.63 | 0.085 | 0.052 | 0.804 | |
| Days 21–35 | – | 126.8b | 178.7a | 187.0a | 19.09 | 0.011 | 0.127 | 0.158 | |
| Days 0–35 | – | 223.5 | 245.2 | 257.0 | 16.34 | 0.125 | 0.049 | 0.484 | |
Values are least-squares means ± standard errors of the least-squares means. Br control was grazed for 21 days, treatments B + C, B + L and B + C + L were grazed for 35 days.
Means in the same row with different letters differ significantly (at P = 0.05).
Mean weight of lambs grazing plots containing brassica only ( ) for 21 days or a mixture of brassica and cereal (
 ), brassica and legume (
 ) or brassica, cereal and legume (
 ) for 35 days. Values are least-squares means ± standard errors of the least-squares means.
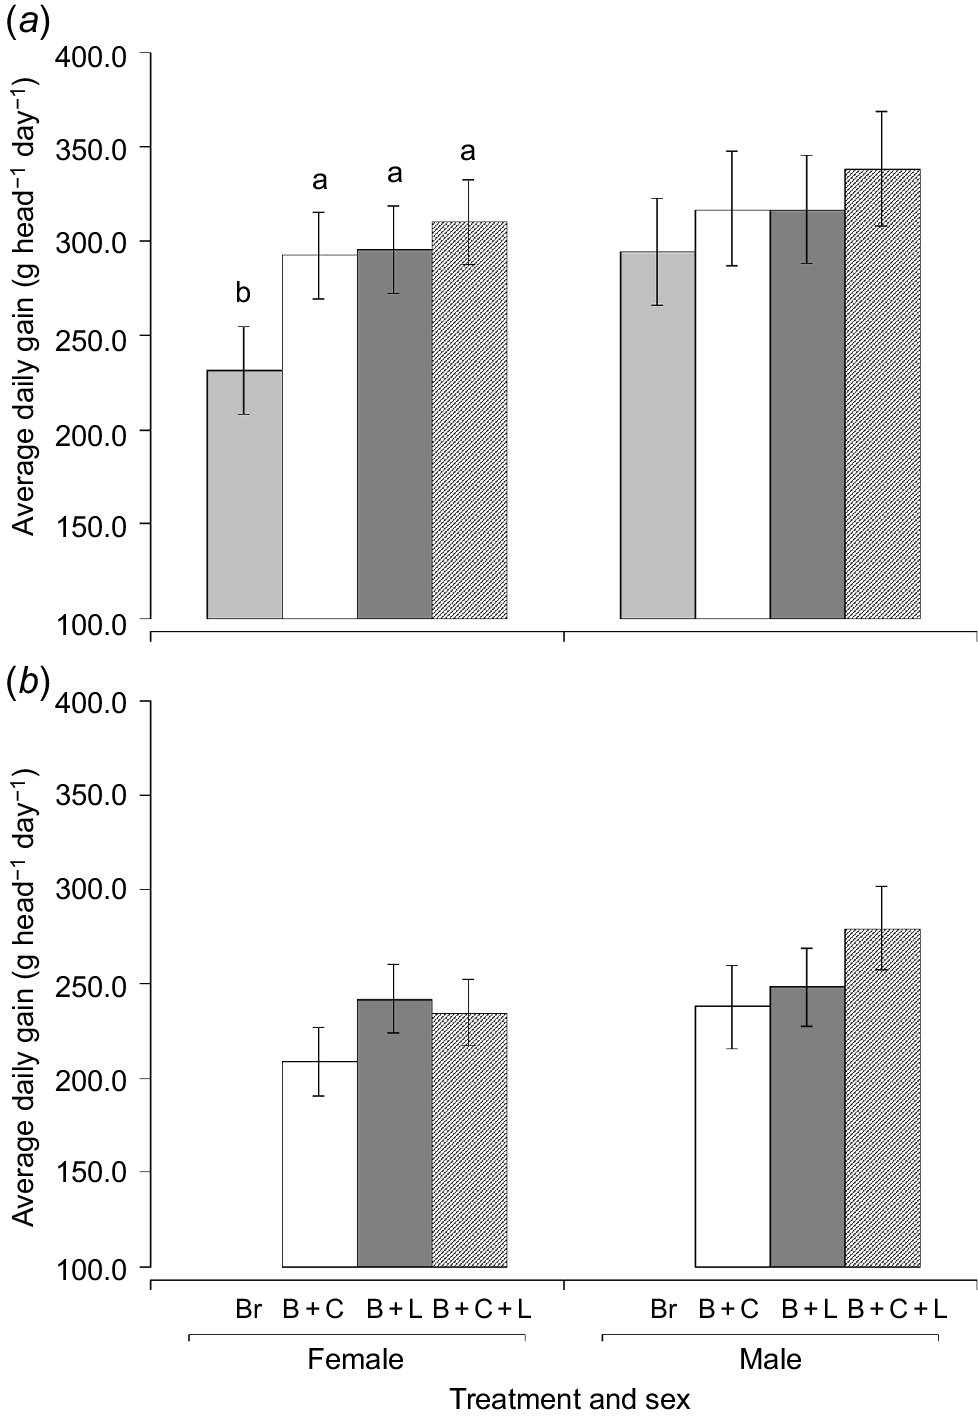
Mean ADG from Day 0 to Day 21 or from Day 0 to Day 35 did not differ between treatment groups (Table 3); however, ADG from Day 21 to Day 35 was lower for lambs grazing the B + C forage treatment than for those grazing the B + L or B + C + L forage treatments. When a secondary analysis was conducted by sex, ADG from Day 0 to Day 35 (255.2 ± 15.5 vs 228.5 ± 14.0, P = 0.048), but not from Day 0 to Day 21 (316.5 ± 17.0 vs 282.3 ± 14.3, P = 0.052), was higher for male compared with female lambs, respectively. Mean ADG from Day 0 to Day 21 was lower for female, but not male, lambs grazing the Br only plots than for those grazing any species mix (Fig. 6a). ADG per plot was positively correlated with the amount of DM on offer (kg ha−1) at the commencement of grazing for Days 0–21 (r2 = 0.40, P = 0.009), but not for Days 21–35 (r2 = 0.06, P = 0.380).
Average daily gain (ADG) for female and male lambs either (a) from Day 0 to Day 21 of grazing or (b) from Day 0 to Day 35 of grazing when lambs grazed plots containing brassica only (Br) for 21 days or a mixture of brassica and cereal (B + C), brassica and legume (B + L) or brassica, cereal and legume (B + C + L) for 35 days. Different letters between fodder species (within sex) indicate significant differences (at P = 0.05).
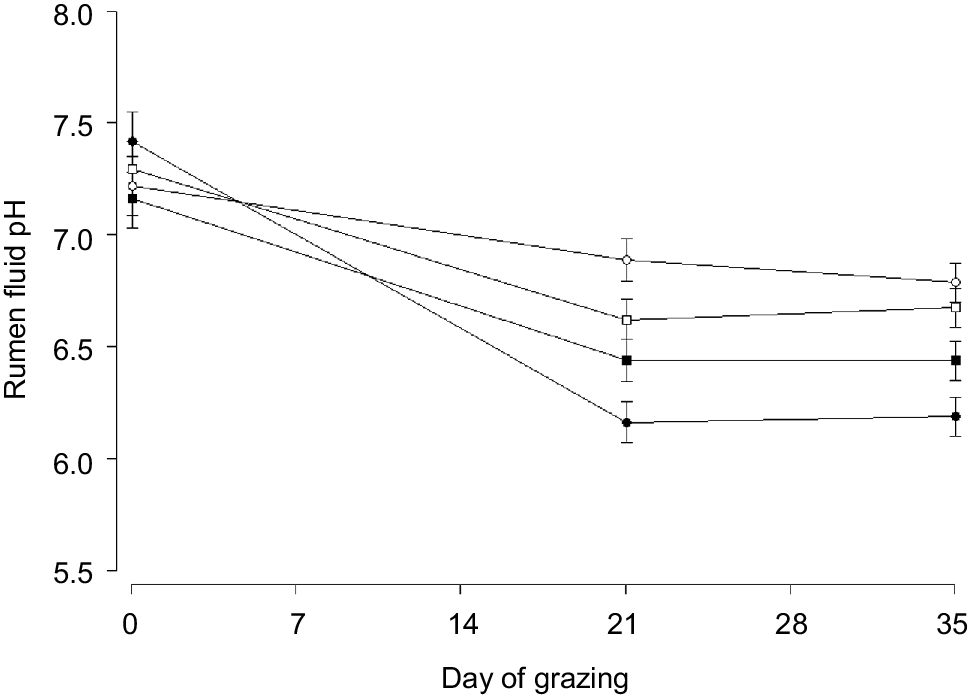
Mean rumen pH was lower (P < 0.001) when sheep grazed Br only or the B + L forage treatments for 35 days than when they grazed B + C or B + C + L forage treatments (Table 4). Rumen pH was lowest 35 days after grazing commenced when sheep grazed Br only and was highest when sheep grazed the B + C or B + C + L treatments compared with other treatments (Fig. 6). Rumen pH was below 6.2 for 8 of 12 sheep grazing the Br only plots at Day 21 and was as low as 5.8 in two sheep. The proportion of propionic acid (molar %) was lower in rumen fluid from lambs grazing the B + C and B + L treatments than in the Br control (Table 4). The ratio of Pr:(Ac + 2Bu) was not different among the dietary treatments; however, the interaction between treatment and day of collection was significant (Table 4) where the ratio of Pr:(Ac + 2Bu) on Day 21 of grazing was higher when lambs grazed the Br control (0.36 ± 0.016) compared with the B + C (0.30 ± 0.016) or B + L (0.36 ± 0.016) forage treatments.
| Parameter | Treatment | s.e.m. | P-value | ||||||
|---|---|---|---|---|---|---|---|---|---|
| Br | B + C | B + L | B + C + L | Treatment | Day | Treatment × Day | |||
| Rumen pH | 6.59b | 6.97a | 6.68b | 6.86a | 0.06 | <0.001 | <0.001 | 0.007 | |
| Total VFA concentration (mmol L−1) | 113.5ab | 99.1c | 115.6a | 102.8bc | 4.00 | 0.013 | <0.001 | 0.001 | |
| VFA proportion (molar %) | |||||||||
| Acetic acid | 56.58 | 58.13 | 56.97 | 56.83 | 0.62 | 0.326 | <0.001 | 0.002 | |
| Propionic acid | 25.44a | 24.10b | 23.93b | 24.97ab | 0.48 | 0.026 | <0.001 | <0.001 | |
| Iso-butyric acid | 0.39 | 0.43 | 0.41 | 0.50 | 0.04 | 0.230 | <0.001 | 0.015 | |
| Butyric acid | 13.90b | 15.07a | 15.89a | 15.36a | 0.42 | <0.001 | <0.001 | 0.010 | |
| Iso-valeric acid | 0.64 | 0.66 | 0.69 | 0.76 | 0.08 | 0.684 | <0.001 | 0.070 | |
| Valeric acid | 2.58a | 1.49c | 1.90b | 1.60bc | 0.15 | <0.001 | <0.001 | <0.001 | |
| Hexanoic acid | 0.62a | 0.29b | 0.40ab | 0.20b | 0.10 | 0.010 | 0.004 | <0.001 | |
| Heptanoic acid | 0.045a | 0.011b | 0.019ab | 0.004b | 0.02 | 0.015 | 0.000 | 0.001 | |
| Ac:Pr | 2.23 | 2.40 | 2.34 | 2.28 | 0.07 | 0.351 | <0.001 | 0.001 | |
| Pr:(Ac + 2Bu) | 0.32 | 0.29 | 0.29 | 0.31 | 0.01 | 0.057 | <0.001 | 0.016 | |
Values are least-squares means ± standard errors of the least-squares means.
Means within a row with different letters differ significantly (at P = 0.05).
Ac:Pr, ratio of propionate to acetate; Pr:(Ac + 2Bu), ratio of propionate to acetate + 2 × butyrate. Br, brassica only; B + C, brassica–cereal mix; B + L, brassica–legume mix; B + C + L, Brassica–cereal–legume mix grazed for 35 days.
The mean estimated intake of the mineral mix for the Br, B + C, B + L and B + C + L treatments from Day 0 to Day 21 was 3.29%, 4.21%, 3.51% and 2.97% ± 0.20% DMI respectively (P = 0.006), and from Day 21 to Day 35 it was 0.29%, 0.71%, 0.69% and 0.13% ± 0.20% DMI respectively (P = 0.164). Estimated mineral intake was lower (P < 0.001) from Day 21 to Day 35 (0.46% ± 0.10% DMI) than from Day 0 to Day 21 (3.49% ± 0.10% DMI). Mean rumen pH per plot was not positively correlated with estimated mineral intake (% DMI) on Day 21 (r2 = 0.23, P = 0.057) or Day 35 (r2 = 0.01, P = 0.739).
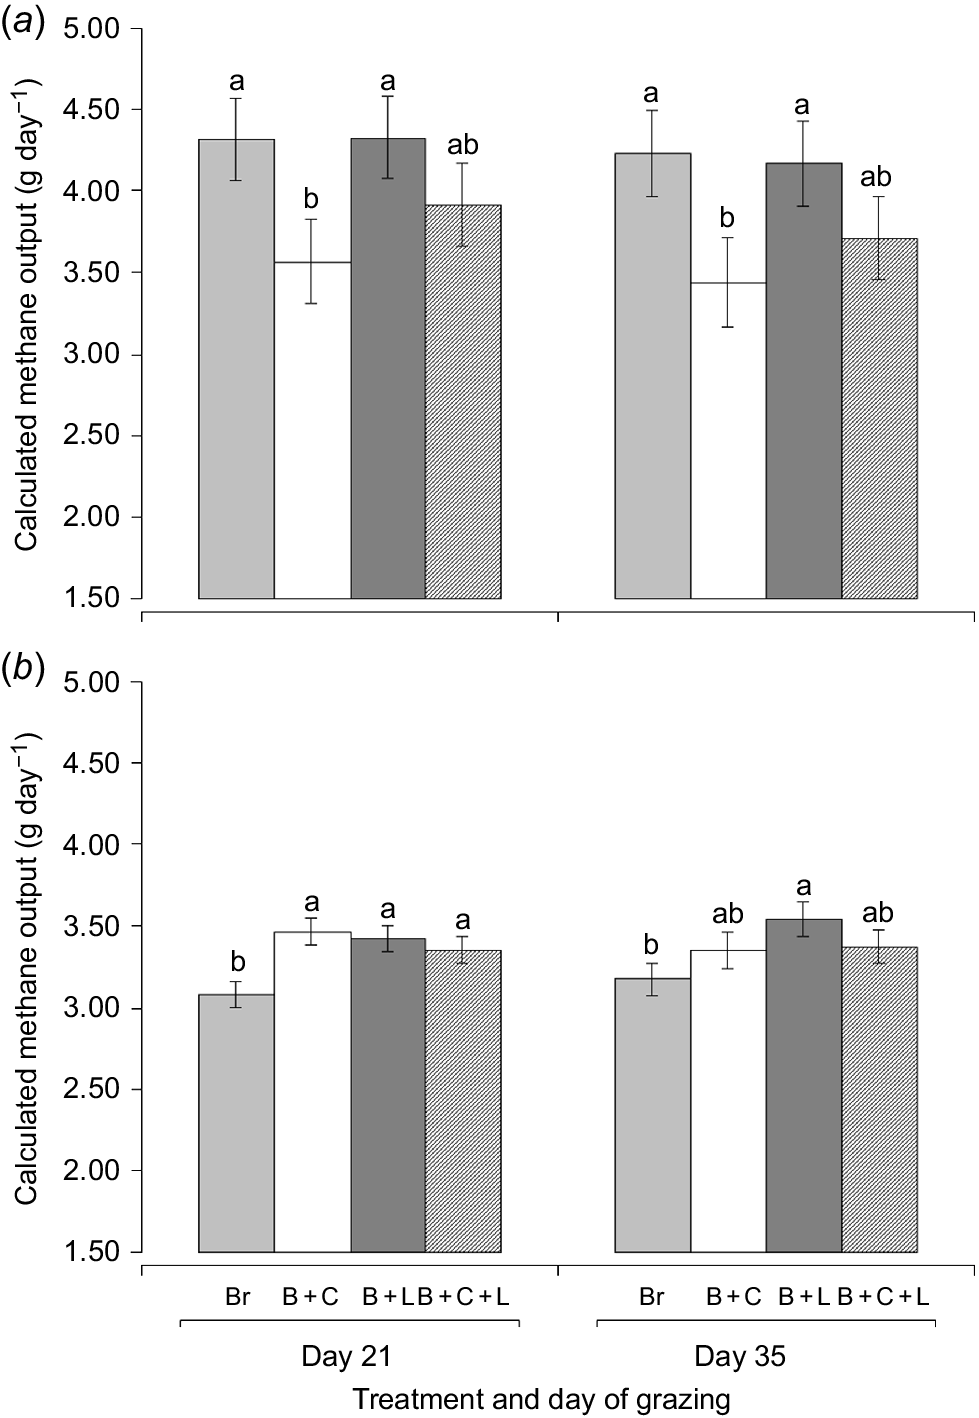
The mean estimated output of CH4 (g day−1) calculated from VFA concentration was lower when lambs grazed the B + C forage treatment than with Br only or B + L forage treatments on Days 21 and 35 (Fig. 7a). The estimated output of CH4 calculated from VFA proportions was lower when lambs grazed the Br only forage than when they grazed any other forage treatment on Day 21 (Fig. 7b). The calculated output of CH4 per unit of weight gain was not different among any forage treatment groups from Day 0 to Day 21 or from Day 0 to Day 35 (Table 5).
Mean rumen pH when lambs grazed plots containing brassica only ( ) or a mixture of brassica and cereal (
 ), brassica and legume (
 ) or brassica, cereal and legume (
 ) for 35 days. Values are least-squares means ± standard errors of the least- squares means.
| Methane | Methane output (g g−1 ADG) | s.e.m. | P-value | ||||||
|---|---|---|---|---|---|---|---|---|---|
| Br | B + C | B + L | B + C + L | Treatment | Day | Treatment × Day | |||
| Days 0–21 | 0.11 | 0.07 | 0.08 | 0.08 | 0.01 | 0.116 | <0.001 | <0.001 | |
| Days 0–35 | – | 0.09 | 0.09 | 0.09 | 0.01 | 0.893 | <0.001 | <0.001 | |
Values are least-squares means ± standard errors of the least-squares means. CH4 was calculated using VFA concentration (mmol L−1, (Williams et al. 2019)).
Means in the same row with different letters differ significantly (at P =0.05).
Br, brassica only grazed for 21 days; B + C, brassica–cereal mix; B + L, brassica–legume mix; B + C + L, brassica–cereal–legume mix grazed for 35 days.
Discussion
The higher DM yield in the three-species mix (B + C + L) than in single-species (Br) forage or other forage mixtures (B + C or B + L) was in contrast to the general conclusion of a previous meta-review indicating that mixed-species forage crops are not more productive than are single-species crops (Florence and McGuire 2020). The higher DM on offer reflected additive effects of individual species rather than dominance of a single species, indicating that competition among species does not appear to limit yield (Hayes et al. 2018). The lower forage production in the Br only plots could have been related to the low seeding rate; however, the rate used is common in the mixed farming zone of south-eastern Australia, particularly where grazing ceases mid-season, allowing crops to progress to grain development and harvesting (Fig. 8).
Estimated methane output 21 or 35 days after the commencement of grazing calculated from either (a) volatile fatty acid concentrations or (b) volatile fatty acid proportions when lambs grazed plots containing brassica only (Br) or a mixture of brassica and cereal (B + C), brassica and legume (B + L) or brassica, cereal and legume (B + C + L). Different letters between fodder species (within day) indicate significant differences (at P = 0.05).
The higher ADG when ewe lambs grazed any forage mixture than when they grazed brassica only was likely to be associated with a higher DM and energy intake with the higher DM on offer (Smith et al. 2021). The higher plant density (% cover) of the B + C + L mix than of any other forage treatment could have contributed to a higher intake through a greater bite size (Black and Kenney 1984); however, this did not translate to a significantly higher weight gain than with other forage mixes over the entire 35 day grazing period. However, the higher LW from Day 21 to Day 35 when lambs grazed the B + C + L forage treatment than when they grazed single mixes (B + C or B + L) could have reflected subtle differences in intake at later forage growth stages or a more stable weight change over a longer grazing period.
Although overall weight gain was not different among forage treatments, the lower ADG for female but not male lambs grazing the brassica only forage from Day 0 to Day 21, although not expected, could reflect subtle differences in energy intake or metabolism between sexes (Graham 1962). The lack of significant difference in ADG between treatments for male lambs may also have been due to a higher variability within treatment groups. The higher growth rate of male than female lambs was expected (Fogarty et al. 2005), which could have contributed to a higher variability in ADG. The lower number of males than females in each treatment group (8 vs 16 respectively) could also have contributed to a Type II error being observed, and further studies with greater numbers over a longer grazing period is required to resolve these differences.
A rumen pH of 6.2 or less can indicate subacute rumen acidosis (Bramley et al. 2008), which can result in decreased fibre digestibility (Shriver et al. 1986; de Veth and Kolver 2001). The low rumen pH observed in lambs grazing brassica only was not expected, given the relatively low concentration of WSC (Enemark et al. 2004; Packer et al. 2011); however, rumen pH was also lower when sheep were fed forage rape than when they were fed with ryegrass (Sun et al. 2015). The higher pH when cereals were included in the forage mix (B + C or B + C + L) could be the result of slower fermentation, or the improved buffering capacity of the cereal itself compared with brassica (Bujňák et al. 2011; Russo et al. 2018; Russo et al. 2021). Further research should be conducted to determine whether lower rumen fibre digestibility or energy utilisation of the brassica forage contributed to the lower ADGs observed in female lambs grazing brassica only early in the grazing period.
Another factor that could have contributed to alterations in rumen pH was the intake of mineral supplements, specifically lime (CaCO3). The lowest pH observed in the Br only treatment group on Day 21 was associated with lower total mineral and CaCO3 intakes. However, a number of observations provided evidence that the differences in rumen pH were not related to differential mineral intake. First, differences in pH among forage treatments remained similar on Day 35 to those on Day 21, despite mineral intakes from Day 21 to Day 35 being very low or zero. Second, mineral intake per plot was not statistically related to rumen pH, as reflected by mineral intake from Day 0 to Day 21 being similar for the Br, B + L and B + C + L forage treatments, despite rumen pH values being different. Finally, rumen pH was not altered when limestone was included in the ration of steers (Laudert and Matshushima 1982) or dairy cows (Rogers et al. 1982) at concentrations similar to those estimated in the current study, indicating that a significant effect of mineral intake on rumen pH was not likely.
The higher estimated CH4 output from lambs grazing the Br only forage treatment than from those grazing any forage mix was not expected, given previous results showing lower CH4 output with brassica species than with grasses (Sun et al. 2012) and lower CH4 output with rations containing lower fibre composition (Thornton and Owens 1981). The higher Pr:(Ac + 2Bu) ratio when lambs grazed Br only could indicate higher rumen efficiency; however, the higher total VFA concentration leads to the higher calculated output of CH4. A higher buffering capacity of cereals, reflected in a lower total VFA concentration when lambs grazed the B + C or B + C + L forage treatments, would also lead to a lower calculated CH4 output. The CH4 output per unit of ADG was not different among treatment groups, indicating the overall efficiency of CH4 production was not affected by the forage grazed. Relative differences in CH4 between treatment groups calculated from VFA concentration compared with those calculated from VFA proportion highlighted the need for caution when using VFAs to estimate output. Similar to the results observed in the current study, CH4 output was also lower for brassica than for ryegrass when calculated using VFA proportion, but not concentration (Sun et al. 2015).
The major limitations to the current study were the short grazing period (5 weeks only) and the low DM yield in the Br only plots, resulting in only 3 weeks of grazing being available for analysis. Therefore, the results from the study should be considered preliminary in nature and future studies should aim to assess growth rates over at least 6–8 weeks. Further studies could also consider varying stocking rate to better match DM on offer, as has occurred previously (Dove et al. 2012). The DM on offer for individual brassica or legume species could also be assessed to provide additional information regarding optimum species selection for early or late forage growth and grazing.
Conclusions
The higher ADG observed in female lambs grazing forage mixtures than the canola only control in early grazing was related to a higher DM on offer. Although LW and ADG over the entire grazing period were not different among forage treatments, further research should determine whether the lower pH observed when sheep grazed Brassicaceae and Fabaceae than Poaceae mixes is associated with subacute rumen acidosis and reduced fibre degradation and forage energy utilisation.
Conflicts of interest
Dr Edward Clayton is an Associate Editor of Animal Production Science. To mitigate this potential conflict of interest they had no editor-level access to this manuscript during peer review. The authors have no other conflicts of interest to declare.
Declaration of funding
The study was conducted with funding provided my Meat and Livestock Australia (MLA) through the MLA Donor Company and the NSW Department of Primary Industries.
Acknowledgements
We thank Richard Meyer and staff from the NSW DPI Feed Quality Service for technical assistance with the analysis of samples. The authors have all contributed to the design and conduct of the study, data interpretation and drafting and editing of the paper.
References
Barry TN (2013) The feeding value of forage brassica plants for grazing ruminant livestock. Animal Feed Science and Technology 181, 15-25.
| Crossref | Google Scholar |
Black JL, Kenney PA (1984) Factors affecting diet selection by sheep 2. Height and density of pasture. Australian Journal of Agricultural Research 35, 565-578.
| Crossref | Google Scholar |
Bramley E, Lean IJ, Fulkerson WJ, Stevenson MA, Rabiee AR, Costa ND (2008) The definition of acidosis in dairy herds predominantly fed on pasture and concentrates. Journal of Dairy Science 91, 308-321.
| Crossref | Google Scholar | PubMed |
Bujňák L, Maskaľová I, Vajda V (2011) Determination of buffering capacity of selected fermented feedstuffs and the effect of dietary acid–base status on ruminal fluid pH. Acta Veterinaria Brunensis 80, 269-273.
| Crossref | Google Scholar |
Chateil C, Gondringer I, Tarallo L, Kerbiriou C, Le Viol I, Ponge J-F, Salmon S, Gachet S, Porcher E (2013) Crop genetic diversity benefits farmland biodiversity in cultivated fields. Agriculture, Ecosystems & Environment 171, 25-32.
| Crossref | Google Scholar |
Clayton EH, Lean IJ, Rowe JB, Cox WJ (1999) Effects of feeding virginiamycin and sodium bicarbonate to grazing lactating dairy cows. Journal of Dairy Science 82, 1545-1554.
| Crossref | Google Scholar | PubMed |
Craig PR, Coventry D, Edwards JH (2013) Productivity advantage of crop–perennial pasture intercropping in southeastern Australia. Agronomy Journal 105, 1588-1596.
| Crossref | Google Scholar |
de Veth MJ, Kolver ES (2001) Digestion of ryegrass pasture in response to change in pH in continuous culture. Journal of Dairy Science 84, 1449-1457.
| Crossref | Google Scholar | PubMed |
Dove H, Kelman WM, Kirkegaard JA, Sprague SJ (2012) Impact of magnesium–sodium supplementation on liveweight gains of young sheep grazing dual-purpose cereal or canola crops. Animal Production Science 52, 1027-1035.
| Crossref | Google Scholar |
Enemark JMD, Jørgensen RJ, Kristensen NB (2004) An evaluation of parameters for the detection of subclinical rumen acidosis in dairy herds. Veterinary Research Communications 28, 687-709.
| Crossref | Google Scholar | PubMed |
Fletcher AL, Kirkegaard JA, Peoples MB, Robertson MJ, Whish JPM, Swan AD (2016) Prospects to utilise intercrops and crop variety mixtures in mechanised, rain-fed, temperate cropping systems. Crop & Pasture Science 67, 1252-1267.
| Crossref | Google Scholar |
Florence AM, McGuire AM (2020) Do diverse cover crop mixtures perform better than monocultures? A systematic review. Agronomy Journal 112, 3513-3534.
| Crossref | Google Scholar |
Fogarty NM, Ingham VM, Gilmour AR, Cummins LJ, Gaunt GM, Stafford J, Edwards JEH, Banks RG (2005) Genetic evaluation of crossbred lamb production. 1. Breed and fixed effects for birth and weaning weight of first-cross lambs, gestation length, and reproduction of base ewes. Australian Journal of Agricultural Research 56, 443-453.
| Crossref | Google Scholar |
Graham NM (1962) Energy expenditure of grazing sheep. Nature 196, 289.
| Crossref | Google Scholar |
Haydock KP, Shaw NH (1975) The comparative yield method for estimating dry matter yield of pasture. Australian Journal of Experimental Agriculture and Animal Husbandry 15, 663-670.
| Crossref | Google Scholar |
Hayes RC, Li GD, Norton MR, Culvenor RA (2018) Effects of contrasting seasonal growth patterns on composition and persistence of mixed grass–legume pastures over 5 years in a semi-arid Australian cropping environment. Journal of Agronomy and Crop Science 204, 228-242.
| Crossref | Google Scholar |
Hector A, Schmid B, Beierkuhnlein C, Caldeira MC, Diemer M, Dimitrakopoulos PG, Finn JA, Freitas H, Giller PS, Good J, Harris R, Hogberg P, Huss-Danell K, Joshi J, Jumpponen A, Korner C, Leadley PW, Loreau M, Minns A, Mulder CPH, O’Donovan G, Otway SJ, Pereira JS, Prinz A, Read DJ, Scherer-Lorenzen M, Schulze ED, Siamantziouras ASD, Spehn EM, Terry AC, Troumbis AY, Woodward FI, Yachi S, Lawton JH (1999) Plant diversity and productivity experiments in European grasslands. Science 286, 1123-1127.
| Crossref | Google Scholar | PubMed |
Howieson JG, O’Hara GW, Carr SJ (2000) Changing roles for legumes in Mediterranean agriculture: developments from an Australian perspective. Field Crops Research 65, 107-122.
| Crossref | Google Scholar |
Kirkegaard JA, Sprague SJ, Dove H, Kelman WM, Marcroft SJ, Lieschke A, Howe GN, Graham JM (2008) Dual-purpose canola: a new opportunity in mixed farming systems. Australian Journal of Agricultural Research 59, 291-302.
| Crossref | Google Scholar |
Laudert SB, Matshushima JK (1982) Limestone effects on digestion and gastrointestinal pH of finishing steers. Journal of Animal Science 55(Suppl 1), 427.
| Google Scholar |
Lithourgidis AS, Dordas CA, Damalas CA, Vlachostergios DN (2011) Annual intercrops: an alternative pathway for sustainable agriculture. Australian Journal of Crop Science 5, 396-410.
| Google Scholar |
Littell RC, Henry PR, Ammerman CB (1998) Statistical analysis of repeated measures data using SAS procedures. Journal of Animal Science 76, 1216-1231.
| Crossref | Google Scholar | PubMed |
Malézieux E, Crozat Y, Dupraz C, Laurans M, Makowski D, Ozier-Lafontaine H, Rapidel B, de Tourdonnet S, Valantin-Morison M (2009) Mixing plant species in cropping systems: concepts, tools and models. A review. Agronomy for Sustainable Development 29, 43-62.
| Google Scholar |
Masters DG (2015) Mineral nutrition of sheep: new insights into interactions when grazing vegetative crops. Animal Production Science 55, 1215-1216.
| Crossref | Google Scholar |
McGrath SR, Pinares-Patino CS, McDonald SE, Simpson RJ, Moore AD (2021a) Utilising dual-purpose crops in an Australian high-rainfall livestock production system to increase meat and wool production. 2. Production from breeding-ewe flocks. Animal Production Science 61, 1074-1088.
| Crossref | Google Scholar |
McGrath SR, Sandral GA, Holman BWB, Friend MA (2021b) Lamb growth rates and carcass characteristics of White Dorper and crossbred lambs grazing traditional and novel pastures during spring in southern Australia. Animal Production Science 61, 1160-1169.
| Crossref | Google Scholar |
Moore AD, Bell LW, Revell DK (2009) Feed gaps in mixed-farming systems: insights from the Grain & Graze program. Animal Production Science 49, 736-748.
| Crossref | Google Scholar |
Moss A, Jouany J-P, Newbold J (2000) Methane production by ruminants: its contribution to global warming. Annales de Zootechnie 49, 231-253.
| Crossref | Google Scholar |
Nelson AG, Pswarayi A, Quideau S, Frick B, Spaner D (2012) Yield and weed suppression of crop mixtures in organic and conventional systems of the Western Canadian Prairie. Agronomy Journal 104, 756-762.
| Crossref | Google Scholar |
Packer EJ, Clayton EH, Cusack PMV (2011) Rumen fermentation and liveweight gain in beef cattle treated with monensin and grazing lush forage. Australian Veterinary Journal 89, 338-345.
| Crossref | Google Scholar | PubMed |
Rogers JA, Davis CL, Clark JH (1982) Alteration of rumen fermentation, milk fat synthesis and nutrient utilization with mineral salts in dairy cows. Journal of Dairy Science 65, 577-586.
| Crossref | Google Scholar | PubMed |
Russo VM, Leury BJ, Kennedy E, Hannah MC, Auldist MJ, Wales WJ (2018) Forage type influences milk yield and ruminal responses to wheat adaptation in late-lactation dairy cows. Journal of Dairy Science 101, 9901-9914.
| Crossref | Google Scholar | PubMed |
Russo VM, Leury BJ, Kennedy E, Hannah MC, Auldist MJ, Morris GL, Wales WJ (2021) Prior forage type influences ruminal responses to a wheat grain challenge in lactating dairy cows. Animals 11, 3188.
| Crossref | Google Scholar | PubMed |
Shriver BJ, Hoover WH, Sargent JP, Crawford RJ, Jr, Thayne WV (1986) Fermentation of a high concentrate diet as affected by ruminal pH and digesta flow. Journal of Dairy Science 69, 413-419.
| Crossref | Google Scholar |
Smith WB, Galyean ML, Kallenbach RL, Greenwood PL, Scholljegerdes EJ (2021) Understanding intake on pastures: how, why and a way forward. Journal of Animal Science 99, skab062.
| Crossref | Google Scholar |
Sun XZ, Waghorn GC, Hoskin SO, Harrison SJ, Muetzela S, Pacheco D (2012) Methane emissions from sheep fed fresh brassicas (Brassica spp.) compared to perennial ryegrass (Lolium perenne). Animal Feed Science and Technology 176, 107-116.
| Crossref | Google Scholar |
Sun X, Henderson G, Cox F, Molano G, Harrison SJ, Luo D, Janssen PH, Pacheco D (2015) Lambs fed fresh winter forage rape (Brassica napus L.) emit less methane than those fed perennial ryegrass (Lolium perenne L.), and possible mechanisms behind the difference. PLoS ONE 10, e0119697.
| Crossref | Google Scholar | PubMed |
t’Mannetje L, Haydock KP (1963) The dry-weight-rank method for the botanical analysis of pasture. Journal of the British Grassland Society 18, 268-275.
| Crossref | Google Scholar |
Thornton JH, Owens FN (1981) Monensin supplementation and in vivo methane production by steers. Journal of Animal Science 52, 628-634.
| Crossref | Google Scholar | PubMed |
Wang Z, Goonewardene LA (2004) The use of MIXED models in the analysis of animal experiments with repeated measures. Canadian Journal of Animal Science 84, 1-11.
| Crossref | Google Scholar |
White A, Holst P (2006) Fat scoring sheep and lambs. NSW Department of Primary Industries Primefact 302, 1-2.
| Google Scholar |
Williams SRO, Hannah MC, Jacobs JL, Wales WJ, Moate PJ (2019) Volatile fatty acids in ruminal fluid can be used to predict methane yield of dairy cows. Animals 9, 1006.
| Crossref | Google Scholar | PubMed |