

Undegradable dietary protein limits growth and carcass yields in crossbred Boer kids fed Desmanthus hay or Rhodes grass (Chloris gayana) hay supplemented with urea and/or cottonseed meal
A. Aoetpah A B * , C. Gardiner A , B. Gummow A C , A. Mialon D and G. Walker A
A
B
C
D
Abstract
Low-protein tropical forages required protein supplementation, which might affect growth of meat goats.
This study was aimed to compare liveweight gain, carcass/non-carcass yields and meat quality in crossbred Boer kids fed isonitrogenous diets varying in undegradable (UDP) and rumen-degradable (RDP) dietary protein sources.
Twenty-five female crossbred Boer kids were randomly allocated into the following five dietary treatments: Rhodes grass (Chloris gayana) hay supplemented with urea (U), urea plus cottonseed meal (UCSM), cottonseed meal (CSM), gliricidia (Gliricidia sepium) (Gliri) or Desmanthus (Desmanthus leptophyllus) only (Desman). The diets were formulated to supply 135 and 195 g crude protein/kg DM for the two experiments. Experiment 1 lasted 78 days and the dietary UDP:RDP ratio (g/kg DM) was 35:102 (U), 37:100 (UCSM), 40:97 (CSM), 55:82 (Desman) and 46:91 (Gliri). Experiment 2 lasted 138 days and the dietary UDP:RDP ratio (g/kg DM) was 45:150 (U), 52:143 (UCSM), 58:137 (CSM), 83:112 (Desman) and 71:124 (Gliri) respectively. Data were subjected to one-way ANOVA and general linear model.
After 138 days of supplementation, the Desman goats had the highest liveweight gain (83 g/day) and heaviest cold carcass weight (12.1 kg) in Experiment 2. This was followed, in descending order, by CSM (58 g/day and 9.6 kg), UCSM (48 g/day and 7.8 kg), Gliri (41 g/day and 7.6 kg) and U (6 g/day and 6.0 kg). Heavier carcass weight was associated with larger eye-muscle area and fat depth at the 12th rib. Aus-meat Beef Colour Standard scores of 3–4 for the eye muscle of the Desman and CSM goats compared with scores of 1C-2 in the other goats meant that the darker meat in Desman and CSM diets was associated with heavier carcass weight and a more rapid rate of decline in carcass pH.
Crossbred Boer kids fed high dietary UDP had higher intakes of UDP, RDP, metabolisable protein (MP) and metabolisable energy (ME), even though an isonitrogenous diet was offered. The Desman kids had higher liveweight gain, heavier carcass yield, greater eye-muscle area, thicker fat depth and heavier mass of non-carcass components.
The higher liveweight gain and carcass/non-carcass yields for Desman goats than for others was associated with increased DM, UDP, RDP, MP and ME intakes.
Keywords: carcass, degradable/undegradable protein, Desmanthus, goats, supplementation, tropical legumes.
Introduction
Liveweight (LW) gain in meat goats fed a basal diet of tropical grass is generally low; consequently, time to reach market weight takes time to achieve and the carcass yield is generally low. Protein supplementation is usually recommended to increase LW gain. Studies to combine Sudan grass with legumes (Kanani et al. 2006), pangola grass (Digitaria decumbens) Stent with urea and/or soybean cake (Limea et al. 2009), or Rhodes grass hay with cottonseed cake and sunflower cake (Mtenga and Kitaly 1990), were reported to increase LW gains. However, the level of response for any given basal diet is not consistently predicted by the concentration of crude protein (CP) in the diet, but varies depending on protein degradability in rumen (Al Jassim et al. 1991).
Boer goat has been bred typically for meet because it is heavier than rangeland goats and has a higher carcass yield potential. Australian goat carcass weights average 15.3 kg/head. Pophiwa et al. (2017) reported that although the dressing percentage is similar (47.5%), Boer goats have higher LW than do indigenous goats.
Supplements derived from protein-rich seed meals such as cottonseed cake, sunflower cake and cottonseed meal generally produce a consistent increase in LW gains (Mtenga and Kitaly 1990; Solomon et al. 2008). The increased LW in these studies indicated that seed meals are good sources of undegraded dietary protein (UDP) (NRC 2007) that would be absorbed as true protein and made available for growth. By comparison, urea as a source of non-protein nitrogen–rumen degradable protein (NPN-RDP) was also reported to produce a consistent increase in LW gain by mixing it with fermentable carbohydrate. For example, Limea et al. (2009) reported that urea and soybean cake are best to mix with ground maize, wheat bran, vitamins and minerals. Uza et al. (2005) suggested mixing urea with cassava peels. However, Wambui et al. (2006) found that urea-treated maize stover was better supplemented with maize germ and Tithonia diversivolia foliage. These studies demonstrated that the use of urea as a NPN-RDP was effective in increasing LW gain in goats when fermentable carbohydrate was available in addition to another source of protein feed.
Studies aimed at increasing LW gain by supplementing goats with different sources of legumes have produced inconsistent results. For instance, Kanani et al. (2006) demonstrated that lablab and Desmanthus supplements had the same CP content but produced a highly contrasting LW gain. With the exception of Leucaena, these contrasting responses could not be explained by differences in neutral (NDF) and acid (ADF) detergent fibres or acid detergent lignin (ADL) contents (Kanani et al. 2006) or by typical digestibility values or tannin contents reported on Feedipedia (n.d.) [Leucaena (Leucaena leucocephala), available at https://www.feedipedia.org/, retrieved 23 February 2018].
Desmanthus species are nutritious subtropical/tropical herbaceous to shrubby legumes well suited to semiarid environments with clay soils (Gardiner 2016; Cook et al. 2020). Gliricidia is a multipurpose shrub/tree legume, which is widely used in Southeast Asia and tropical America as fodder for livestock, often in cut and carry systems (Cook et al. 2020). The use of these legumes as protein supplements to meat goats therefore warrants further study.
Recommendations for protein-supplement utilisation could be established on the basis of the highest LW gain response, but opinions in the published literature are divided about the best protein supplement for goats. Limea et al. (2009) suggested that concentrate diets were better utilised than were non-concentrate diets, but did not emphasise the use of soybean cake and urea as UDP and RDP sources respectively. Mtenga and Kitaly (1990) recommended increasing protein supplementation levels up to 200 g/kg DM, without discussing the effect of such an increase on the utilisation of cottonseed cake and sunflower cake. Kanani et al. (2006) were of the opinion that Leucaena was better than Desmanthus but gave no insight regarding degradability of these legumes. Hence, further understanding of why particular diets produce better responses than others is required to predict production responses to novel use of protein supplements.
In the present study, we hypothesised that growth and carcass yield in goats will be driven by the quantities of UDP and RDP rather than the types of protein supplement or concentrations of dietary CP. Therefore, the primary objective of this study was to compare LW gain, carcass and non-carcass component yields and meat quality in crossbred Boer kids fed isonitrogenous diets varying in UDP and RDP.
Materials and methods
Location, animals and management
Two experiments were conducted at the James Cook University Animal House, Townsville (19°19′30″S, 146o45′44″E), tropical northern Queensland, Australia. The use of animals and experimental protocols were approved by the Animal Ethics Committee of James Cook University (Approval number: A2122). The experiments followed the guidelines and regulations of the 2013 Australian Code of Practice for the Care and Use of Animals for Scientific Purposes.
Two experiments were performed because in Experiment 1 when dietary CP concentration was 137 g/kg DM, the animals hardly grew, some even lost weight. Therefore, Experiment 2 was performed by increasing dietary CP concentration to 195 g/kg DM. In Experiment 1, 25 Boer × Rangeland crossbred female kids (average BW of 19.60 ± 1.86 kg), 5 months old, were fed Rhodes grass hay as a basal diet, which was supplemented with either urea, cottonseed meal or gliricidia dry leaf. One group was fed with Desmanthus hay. The goats were penned in individual pens (2.2 m × 1.1 m × 1.7 m) for 78 days.
The floor was covered with rubber matting with an apron at the back, allowing for cleaning of the floor. At the start of the experiment, the degree of internal parasitic infection was determined using faecal flotations (Hutchinson 2009) and infected goats were treated with Zolvix monepantel 1 mL/10 kg bodyweight (BW). Faecal egg counts were repeated 1 week later to ensure that all experimental kids were free from internal parasites. A volume of 10 mL of blood was drawn from the jugular vein on the first day (Day 1) of the experiment, in the middle (Day 79) and at the end (Day 120), where packed cell volumes (PCV) in the animals were measured and confirmed to be within the normal reference range of between 26 and 27.
In Experiment 2, the same 25 goats (average BW 20.14 ± 2.13 kg) as in Experiment 1, were randomly allocated into the five dietary treatments and returned to single pens for another 138 days of supplementary feeding. The five dietary treatments were Rhodes grass (Chloris gayana) hay (RGH) supplemented with either urea (U), mixed urea and cottonseed meal (UCSM), cottonseed meal (CSM), air-dried gliricidia (Gliricidia sepium) leaves (Gliri) or Desmanthus (Desmanthus leptophyllus cv. JCU 1) dried leaves only (Desman).
Forages and feeding system
Rhodes grass hay (RGH) bales were purchased regularly from local farms by James Cook University. Samples from each batch were collected for CP analysis to ensure similar quality over the experimental period. The RGH was chaffed (SFC 2340 ‘Star’, Ballarat, Australia) at 5–10 cm lengths and separated into the following three forms: plain RGH for the CSM and Gliri goats, RGH 50% urea for the UCSM goats and RGH 100% urea for the U goats.
In Experiment 1, the amount of urea offered was 3.1 and 6 g/kg DM RGH and that in Experiment 2 was 8.8 and 17.3 g/kg DM RGH for the UCSM and U goats respectively. Urea was diluted with clean tap water (3:10, w/w) then sprayed on the RGH while mixing (Calan Super Data Ranger Mixer) to the desired CP content in the diet. Gliricidia was harvested from the University paddock, whereas Desmanthus leptophyllus cv. JCU 1 hay bales were supplied by Agrimix Ltd. The chaffed RGH was stored in plastic bins ready to feed the animals for several days. In Experiment 1, Desmanthus hay was chaffed and offered in a mixture of leaves and stems. In Experiment 2, Desmanthus leaves were manually separated from the stems, stored in plastic bins and only leaves were fed to the goats.
A representative offered and refused feed sample was collected daily for each animal, kept in airtight bags, stored in a 3°C room, and eventually ground to pass through a 2 mm sieve (Retsch, GmbH 5657 HAAN, West Germany). After mixing, an equal proportion of offered and refused feedstuff from each was collected according to the dietary treatment and sent for wet-chemistry analysis individually at the Forage Lab Australia, Victoria, Australia (www.foragelabaustralia.com.au), an affiliate of Cumberland Valley Assay Service (CVAS), USA.
Chemical composition and measurement of intakes
Nutrient composition of the experimental diets is shown in Table 1. Feed samples were analysed for DM, organic matter (OM) and CP (AOAC 1990) within 1 week of starting the experiments. All dietary treatments were formulated to contain 137 g CP/kg DM in Experiment 1 or 195 g CP/kg DM in Experiment 2, in accordance with the CP content of the Desmanthus leaves and stems in Experiment 1 or the Desmanthus dried leaves in Experiment 2.
| Item | Dietary treatment | |||||
|---|---|---|---|---|---|---|
| U | UCSM | CSM | Desman | Gliri | ||
| Experiment 1 | ||||||
| DM (g/kg fresh wt) | 911 | 910 | 909 | 915 | 911 | |
| CP (g/kg DM) | 137 | 137 | 137 | 137 | 137 | |
| UDP (g/kg DM) | 35 | 37 | 40 | 55 | 46 | |
| RDP (g/kg DM) | 102 | 100 | 97 | 82 | 91 | |
| MPTDN (g/kg DM) | 14 | 16 | 19 | 27 | 22 | |
| MPRDP (g/kg DM) | 65 | 65 | 65 | 65 | 65 | |
| ME (MJ) | 7.8 | 8.0 | 8.1 | 8.9 | 8.5 | |
| Experiment 2 | ||||||
| DM (g/kg fresh wt) | 905 | 903 | 902 | 890 | 911 | |
| CP (g/kg DM) | 195 | 195 | 195 | 195 | 195 | |
| UDP (g/kg DM) | 45 | 52 | 58 | 83 | 71 | |
| RDP (g/kg DM) | 150 | 143 | 137 | 112 | 124 | |
| MPTDN (g/kg DM) | 21 | 28 | 34 | 32 | 38 | |
| MPRDP (g/kg DM) | 98 | 98 | 98 | 83 | 95 | |
| ME (MJ) | 7.7 | 8.1 | 8.5 | 8.8 | 9.6 | |
DM, dry matter; CP, crude protein; RDP, rumen degradable protein; UDP, rumen undegradable dietary protein; MPTDN, metabolisable protein based on total digestible nutrient; MPRDP, metabolisable protein based on rumen-degradable protein; ME, metabolisable energy.
Equal amounts of the supplementary diets were offered to animals in individual pens twice a day, namely in the morning (08:00 hours) and in the afternoon (16:00 hours). To allow for refusals, 1.5 times the average intake of the two previous days was offered. All experimental animals had access to a complete mineral mix (Rumevite Fermafost’) (Unit 2C, Thor Court, Keilor East, Vic, Australia 3033). The forages were turned around at noon (13:00 hours) as the preparation of fresh feed encouraged the animals to eat. Fresh drinking water was available ad libitum.
Feed intake was measured as the difference between feed offered and refused within 24 h. The multiplication of nutrients from wet chemistry analysis by the amount of feed offered and refused on a DM basis was determined as intake of nutrients. Wet chemistry determined protein fractions of CP, acid detergent fibre insoluble protein (ADICP) and rumen-degradable protein (RDP), whereas energy was provided in the form of total digestible nutrient (TDN) and ME. All calculations were performed according to published standards (AFRC 1993; NRC 2007), as follows:
(AFRC 1993, eqn 31). Digestible undegradable protein (DUP) (g/kg DM) = 0.9 (UDP – ADICP) (AFRC 1993, eqn 33).
The equation for predicting MP, as suggested by AFRC (1993), was
NRC (2007) suggested estimating microbial crude protein (MCP) as 0.13 TDN if energy is a limiting factor or 0.85 RDP if protein is a limiting factor. Combining the equations,
(AFRC 1993, eqn 23) where fermentable energy is limiting the production of MCP. When RDP is limiting, then the equation used to estimate MPRDP is
This study, therefore, expressed MP as MPTDN and MPRDP. There was sufficient RDP to meet the needs of rumen microbes because all the experimental diets were supplemented with rich protein sources or Desmanthus.
Slaughter procedure, carcass dissection and measurement of carcass quality slaughter procedure
All experimental animals were humanely slaughtered at the end of Experiment 2 in the Nutrition Shed at James Cook University Veterinary Sciences by a licensed Veterinarian. Standard procedures for slaughter and measurement of carcass parameters have been described in detail elsewhere (McGregor 1990; Safari et al. 2011; Maia et al. 2012). Three to six goats were slaughtered daily over 5 days. Each goat was weighed, body condition scored and dentition recorded prior to slaughter. Teeth were evaluated as a practical indicator of slaughtering age. Each goat was stunned with a captive bolt, cut and hung by its Achilles tendon on a hook to bleed out the animal. The skin was immediately cut opened in the abdominal area for evisceration. Viscera were removed, stored in a plastic bucket and kept in a cooling room pending dissection and measurement.
After evisceration and skinning, the head was removed at the first vertebrae with the tongue left in place. The sternum, thoracic organs and all related tissues were removed but the skirt was left. The forefeet were removed at the carpal–metacarpal joint and the hind feet were removed at the tarsal–metatarsal joint.
Carcass and dissection
Hot carcass weight (HCW) was measured within 15 min after slaughter. The hot carcass was then moved into a 5°C room and stored for 24 h where meat pH and temperature were measured regularly. The ultimate meat pH and temperature were determined at 24 h postmortem, which was at the time of moving the carcass to the cold room and kept at 3°C for chilling. At 32 h postmortem, cold carcass weight, meat colour, eye-muscle area, fat depth, fat colour and kidney weight were determined. The carcass was split at the 12th rib using a knife and an electric saw. Meat colour was determined at the rib-eye muscle (longissimus dorsi) at the caudal side. Meat and fat colours were scored against the AUS-MEAT Colour Chart for Beef (see https://www.slideshare.net/choicethailand/ausmeat-handbook-australian-meat). Eye-muscle area (square centimetres) was manually measured by counting the number of 1 × 1 mm squares marked on a clear plastic grid covering the surface area of the longissimus dorsi muscle (including fascia) on the caudal side of the 12th rib. Fat depth (mm) was measured at the point of 110 mm from spinous to transverse process (White and Holst 2006). Kidneys and attached fat tissue were removed and weighed.
Carcass temperature and pH
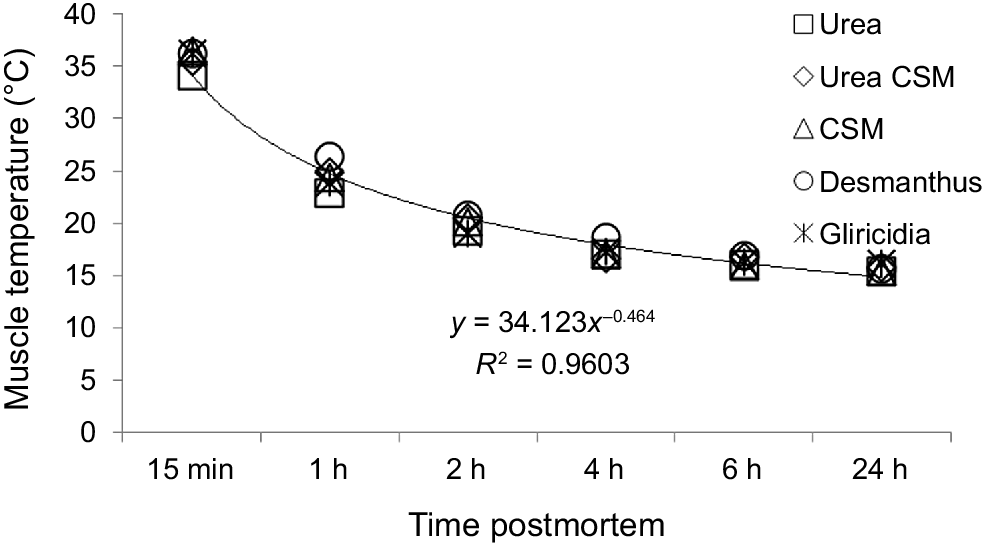
Carcass temperature and pH were measured six times postmortem at the same point on the semitendinosus muscle in accordance with Meat Standards Australia protocols (see https://www.slideshare.net/choicethailand/ausmeat-handbook-australian-meat). The sixth regular set times were 15 min, and 1, 2, 4, 6 and 24 h postmortem. Temperature was measured using an electrode probe (pH-mV-temperature, Springwood, Brisbane, Australia), while meat pH was measured by a meat pH meter (Model WP-80 M MSA, TPS, Springwood, Brisbane, Australia) (Fig. 1).
Non-edible carcass components and dissection
Non-edible carcass portions were weighed 6 h postmortem and stored in the cool room. These included weights of the empty digestive tract, fat attached to the digestive tract, skin, head with tongue, feet, heart, lungs, trachea, liver and spleen. Other edible parts were also measured, including sternum, whereas kidneys were left in the carcass.
Statistical analyses
Collected data for intake and LW changes for the two experiments were separately analysed using a one-way ANOVA. Collected data for weights of carcass and non-edible carcass components, eye-muscle area and fat depth in Experiment 2 were also analysed using a one-way ANOVA (SPSS Statistics for Windows, ver. 23.0, IBM Corporation, Armonk, NY, USA; see https://www.ibm.com/support/pages/ibm-spss-statistics-23-documentation) to test for the effect of treatment. The differences between treatment means were subjected to Duncan’s multiple range test at P < 0.05 threshold. Carcass temperature and pH data were analysed using a Generalised Linear Model (GLM) fitting the fixed effects of dietary treatment and time of measurement as well as their second order interactions. The effect of liveweight or carcass weight on the total weight of non-carcass products was also evaluated. If there were differences due to these factors at the 0.05 level of probability, then the post hoc Tukey pairwise mean comparison analysis was employed.
Results
Feed and nutrient intakes
Nutrient intakes are presented in Table 2. Total DM intake of Desman was significantly higher than that in other treatments for both experiments. Animals supplemented with urea only had the lowest total DM intake. Total DM intakes of goats fed RGH supplemented with CSM, urea + CSM or gliricidia were similar. RGH intake as a basal diet in the Gliri goats in Experiment 1 was comparatively lower than that in other diets, but these RGH intakes were similar across the supplemented goats in Experiment 2. Goats in the Desman treatments had significantly higher protein and ME intakes than did the goats in the other treatments in both experiments. CSM increased the intakes of protein fractions and ME, more than did other protein supplements in Experiment 2, but some of these intakes were similar in goats supplemented with Gliri or UCSM in Experiment 1. Goats in the U treatment had the lowest intakes of protein fractions and ME in both experiments.
| Item | Dietary treatment | s.e.m. | |||||
|---|---|---|---|---|---|---|---|
| U | UCSM | CSM | Desman | Gliri | |||
| Experiment 1 | |||||||
| Dry matter | 312A | 344AB | 377B | 652C | 358AB | 26.41 | |
| Crude protein | 43A | 47AB | 51B | 89C | 49AB | 3.61 | |
| UDP | 11A | 13AB | 15BC | 35D | 16C | 1.85 | |
| RDP | 32A | 34A | 36A | 54B | 33A | 1.81 | |
| MPTDN | 5A | 6AB | 7BC | 18D | 9C | 0.96 | |
| MPRDP | 20A | 23AB | 24B | 42C | 23AB | 1.70 | |
| ME (MJ/day) | 2.6A | 2.7AB | 3.0B | 5.8C | 3.0B | 0.25 | |
| Experiment 2 | |||||||
| Dry matter | 432A | 561B | 636B | 1027C | 591B | 42.91 | |
| Crude protein | 84A | 109B | 124B | 200C | 115B | 8.37 | |
| UDP | 19A | 29B | 37C | 85D | 42C | 4.72 | |
| RDP | 65A | 80BC | 87C | 115D | 73AB | 3.90 | |
| MPTDN | 9A | 16B | 21C | 32D | 23C | 1.62 | |
| MPRDP | 42A | 55B | 63B | 85C | 56B | 3.11 | |
| ME (MJ/day) | 3.3A | 4.5B | 5.4C | 9.0D | 5.7C | 0.40 | |
Values within a row followed by different letters differ significantly (at P < 0.05).
CSM, cottonseed meal; s.e.m., standard error of the mean; UDP, rumen-undegradable dietary protein; RDP, rumen-degradable protein; MPTDN, metabolisable protein based on total digestible nutrient; MPRDP, metabolisable protein based on rumen-degradable protein.
Liveweight changes, carcass yields and carcass qualities
Liveweight changes, carcass yields and carcass qualities are presented in Table 3.
| Item | Dietary treatment | s.e.m. | |||||
|---|---|---|---|---|---|---|---|
| U | UCSM | CSM | Desman | Gliri | |||
| Experiment 1 | |||||||
| Initial LW (kg) | 20.1 | 19.6 | 20 | 19.3 | 19.1 | 0.4 | |
| Final LW (kg) | 19.1 | 19.4 | 20.4 | 21.4 | 18.9 | 0.4 | |
| Average LWG (kg) | −0.9A | −0.2AB | 0.4B | 2.1C | −0.2AB | 0.2 | |
| ADG (g/day) | −15A | −3AB | 7B | 33C | −3AB | 3.9 | |
| Experiment 2 | |||||||
| Final LW (kg) | 20.0A | 25.5B | 27.6BC | 30.3C | 24.7B | 0.8 | |
| Average LWG (kg) | 0.7A | 5.6B | 6.7B | 9.6C | 4.7B | 0.6 | |
| ADG (g/day) | 6A | 48B | 58B | 83C | 41B | 5.5 | |
| FCR (g/g) | 37.3B | 10.6A | 10.4A | 11.6A | 14.2A | 5.4 | |
| HCW (kg) | 6.5A | 8.2B | 10.1C | 12.6D | 7.9A | 0.5 | |
| CCW (kg) | 6.0A | 7.8B | 9.6C | 12.1D | 7.6AB | 0.5 | |
| CCW to LW (%) | 29.4A | 30.4A | 34.3B | 39.6C | 30.4A | 0.8 | |
| CCW to HCW (%) | 91.8A | 95.6B | 95.9B | 96.0B | 94.9B | 0.5 | |
| EMA (cm2) | 2.4A | 3.5AB | 3.9B | 5.5C | 3.3AB | 0.26 | |
| Fat depth (mm) | n.d | <1 | 2.4 | 4.6 | <1 | – | |
Values within a row followed by different letters differ significantly (at P < 0.05).
LW, liveweight; LWG, liveweight gain, ADG, average daily gain; FCR, feed conversion ratio; HCW, hot carcass weight; CCW, cold carcass weight; EMA, eye-muscle area; n.d, not detectable.
Boer goats lost weight when they were offered RGH as a basal diet supplemented with U, UCSM or Gliri at the dietary CP concentration of 137 g/kg DM diet. Goats in the U treatment lost 15 g/day of LW, which was not significantly (P > 0.05) different from those in the UCSM and Gliri goats. Goats offered RGH and supplemented with CSM gained 7 g/day. Goats fed with chaffed dried leaves and stems of Desmanthus containing 137 g CP/kg DM diet, gained 33 g/day.
The Desman goats gained 83 g/day equivalent to double the gain in goats on Gliri and UCSM supplements as the dietary CP concentration increased to 195 g/kg DM diet. The other two treatments had similar ADG and liveweight as did the CSM goats. Boer goats offered Desmanthus yielded the heaviest carcasses compared with goats offered RGH and other protein supplements (P < 0.05). Among the supplemented treatments, CSM goats had the heaviest carcasses, whereas the other three groups had similar responses (P > 0.05).
About 4% loss of HCW after cooling was detected from carcasses of goats offered Desmanthus, which was similar to those in the supplemented groups (P > 0.05), except for the U group. The HCW loss in U-supplemented goats reached 8.2% after cooling, which was about double that in other groups.
Meat colour for the Desman goats was 3.75 and only 1 deviation at 1C. Meat colour for the CSM goats was 3.5. Gliri goats recorded a colour score of 2.66. Most of the U goats (80%) had a meat colour of 1C, whereas the UCSM goats had more variable meat colours, with 60% having 1C, 20% having 1B and another 20% having 2. In general, the order of meat colour from darker to red was Desman, CSM, Gliri, UCSM and U goats. The average fat colour scores for goats were 4 (CSM and Desman), 2.6 (Gliri), 2.4 (UCSM) and 1.8 (U). The Desman goats had darker yellow fat than did those in other treatments.
Carcass temperature and pH
A decrease in carcass temperature was associated with dietary treatment and postmortem aging (P < 0.05). The highest (22.41°C) and the lowest (20.79°C) carcass temperatures were recorded in Desman and U-supplemented goats respectively.
Carcass temperature dropped sharply from 35.7°C to 24.5°C within 1 h, decreased further to 20.0°C after 2 h and stabilised at the lowest temperature of 15.7°C after 24 h postmortem. Carcass pH was associated with dietary treatment and postmortem aging (P < 0.05). In regard to diet effect, the highest pH (6.31) was detected in U goats, which was similar to that in Gliri and UCSM, yet significantly higher than those of CSM (6.18) and Desman (6.13) goats. The carcass pH (6.90) measured within 15 min decreased to 5.66 at 24 h postmortem.
Non-carcass components and other non-edible parts of the carcass
Table 4 shows the mean weight of non-carcass and other non-edible parts of the carcass. Goats in the Desman treatment had the heaviest organs and non-edible carcass components. The total non-carcass weight was 13% of the carcass weight for all treatments, except that for Gliri it was 15%. Although total non-carcass weight varies among treatments, rearranged data analysis found that total non-carcass weight was not influenced by LW (P > 0.05).
| Variable | Dietary treatment | s.e.m. | |||||
|---|---|---|---|---|---|---|---|
| U | UCSM | CSM | Desman | Gliri | |||
| Heart | 80A | 91AB | 112B | 114B | 107B | 4.3 | |
| Lungs | 159A | 164AB | 231BC | 248C | 191AB | 11.6 | |
| Trachea | 90A | 109AB | 103AB | 130B | 114AB | 4.8 | |
| Liver | 208A | 295B | 360C | 426D | 336BC | 16.9 | |
| Kidney plus fat | 67A | 105B | 139C | 254D | 101B | 15.4 | |
| Spleen | 28A | 36B | 37B | 39B | 30A | 1.6 | |
| Total non-carcass (g) | 828A | 1144B | 1286B | 1579C | 1201B | 60.5 | |
| Total non-carcass to hot carcass weight (%) | 12.73A | 13.95B | 12.73A | 12.53A | 15.80C | 3.9 | |
| Non-edible parts of the carcass (g) | |||||||
| Empty digestive tracts | 1429A | 1846ABC | 1904BC | 2223C | 1609AB | 80.7 | |
| Fat of digestive tract | 87A | 179AB | 407B | 687C | 276AB | 52.6 | |
| Skin | 1270A | 1712B | 1979B | 2083B | 1690B | 76.8 | |
| Head and tongue | 1481A | 1650A | 1903B | 1881B | 1576A | 45.2 | |
| Feet | 551A | 621AB | 684BC | 756C | 630AB | 18.4 | |
| Total non-edible parts of the carcass | 4.818A | 6.008B | 6.877C | 7.630D | 5.781B | 1.7 | |
| Total non-edible parts of the carcass to hot carcass weight (%) | 74.12D | 73.27C | 68.09B | 60.56A | 73.18C | 4.2 | |
Means within a row followed by different letters differ significantly (at P < 0.05).
Discussion
Goats fed Desmanthus had the highest intakes of DM, CP, RDP, UDP and, as a result, estimated intakes of MP and ME. Desmanthus was associated with the highest rates of LW gain, heaviest hot and cold carcass weights, largest eye-muscle area and thickest fat depth after 138 days of growth when compared with all other diets. These high intakes recorded in goats on the Desmanthus diet are likely to be the result of higher palatability and DM digestibility, sufficient RDP and branched-chain VFA compared with goats supplemented with U, UCSM or CSM or on RGH only diet. This finding is consistent with the report of Ngo (2012) when growing sheep on Flinders grass hay were supplemented with freshly harvested Desmanthus.
Goats on basal RGH diet supplemented with CSM had the highest DM, CP, RDP and UDP intakes and estimated MP and ME when compared with U and UCSM supplements despite the diets being iso-nitrogenous (195 g CP/kg DM). The lower intakes observed in goats on UCSM supplement were likely to be due to lower palatability associated with the urea component of the supplement that had been coated onto the RGH. This is because RGH with CSM and RGH with UCSM diets had similar DMD and supplied similar quantities of RDP and UDP. However, the RGH 309 + U diet provided more RDP, less UDP and lower DMD than did the diets containing CSM. This suggests that rumen function in the goats supplemented with U alone, was limited by insufficient branched-chain amino acids and volatile fatty acids (VFA) because all goats had access to a complete mineral mix with adequate macro- and micro-minerals for a balanced rumen-fluid ammonia concentration. Apparent minor differences in dietary RDP and UDP concentrations resulted in substantial differences in DM, RDP, and UDP intakes and, therefore, MP and ME, as goats supplemented with CSM only grew approximately 21% faster and achieved 23% heavier carcass weights after 138 days of feeding than did goats fed RGH supplemented with UCSM.
Goats fed the U diet consumed the same amount of RGH as did goats supplemented with either UCSM or CSM alone. This indicates that urea did not limit DM intake, which enable the animals to maintain balance between nitrogen and carbon (Ngo 2012). The UCSM treatment did not stimulate intake of the basal diet despite the presence of a source of rumen-degradable true protein and minerals sufficient to meet the nutritional requirements for amino acids, ammonia-N, branched-chain fatty acids and macro- and micro-minerals. Despite supplying less CP, RDP and UDP, the total DM intake of goats fed Gliri was similar to that of goats fed CSM and UCSM diets. This response suggests that protein was not limiting and that there is an advantage to feeding tropical legumes. The preference for browsing behaviour of goats and their ability to select leaf over stem was also apparent in this study. As browsing ruminants, goats seem to select leaves rather than stems and prefer legumes rather than grass. This feeding behaviour indicated that browse legumes as protein source gave similar intake response as other protein sources, such as cottonseed meal.
The UDP caused more nitrogen to be retained in the body, whereas the RDP supplied nitrogen for rumen microorganisms, increasing their activity to degrade the diet physically or enzymatically, such that DM, OM, N and NDF digestibilities were enhanced (Al Jassim et al. 1991). Furthermore, in the abomasum and small intestine, digestible microbial crude protein (MCP) originating from RDP and digestible UDP, was absorbed as a precursor of metabolisable protein (MP) and functions to maintain normal biological life processes of the animals and to provide tissue protein (AFRC 1993; NRC 2007; McDonald et al. 2011). The MP requirement for the present experimental goats was 75 g to grow at the rate of 100 g/day (NRC 2007). The present study has provided a slightly higher MP above the goats’ requirement as can be seen from MPRDP. However, the greater palatability of Desman resulted in adequate MP for tissue synthesis, as evidenced by higher ADG, heavier carcass and larger eye-muscle area, indicating that energy is the limiting factor for the supplemented goats.
The higher LW gain and larger eye-muscle area in the Desman goats could be explained by a balance between MP and ME, i.e. 10 g MP/MJ ME (NRC 2007). The higher intake of ME provides sufficient energy to match RDP and UDP availability. Importantly, this ratio fulfilled the energy and protein requirements better than did other diets. Another possible explanation for low LW gain in the U goats could be the energy cost for ammonia excretion. Excessive ammonia that was formed from urea in the rumen required energy to be excreted through urine. The lower ME intake in the U goats would have been used primarily for urine excretion rather than to build up tissue for growth.
The 8.2% loss of HCW after chilling recorded in carcasses from the goats on U was probably due to carcass fat covering or shrinking cells. Thinner fat in the U carcass than the 4.6 mm fat depth in the Desman carcass, resulted in the muscle from goats in the U treatment to cool rapidly. This rapid cooling may have caused the cells to shrink, resulting in increased extracellular spaces, more drips or evaporation, leading to higher carcass weight loss, as described by Carmichael et al. (2012) and Listrat et al. (2016).
The thicker fat in the Desman carcass than in the U carcass suggested that the high ME intake in the Desman goats met the needs for net energy for maintenance and growth. Goats in the Desman treatments were more physiologically mature such that extra energy/metabolites were directed to fat deposition in the digestive tract, kidney and muscle. Fat detected from these three depots in the Desman goats indicated that the difference of 10.1 MJ ME intake and 7.4 MJ ME requirement (NRC 2007) is sufficient to build up fat in all depots. The darker yellow fat colour in the Desman carcass may be due to the amounts of beta-carotene and similar pigments found in the Desmanthus leaves. Goats naturally have more myoglobin in their meat and this explains the overall darker colour of goat meat than that of lamb or beef (Suman et al. 2009). However, the darker red colour in the Desman carcass than in other carcasses could be due to the iron mineral in the diet (Beriain et al. 2000; Calnan et al. 2014). Iron may enrich haemoglobin in blood, myoglobin and myofibrillar proteins in meat where iron is situated in sarcoplasm, leading to the darker red colour of the carcass.
The highest and the lowest carcass temperatures recorded in goats supplemented with Desman and U 24 h postmortem was an indication of the amount of energy stored in the muscle. The energy derived from ME intake is stored in the muscle and liver as glycogen and converted to lactic acid or pyruvic acid to produce ATP. Energy in the form of ATP, formed right before slaughter, is still used for chemical reaction until it is all used (Hocquette et al. 2001). After the ATP is used, the energy in glycogen is converted to form lactic acid (Hocquette et al. 2001). The highest temperature in the Desman carcass indicated that more energy was stored in glycogen.
The lowest mean pH in the Desman carcass indicated that more glycogen had been converted to lactic acid. The opposite results explain the lowest temperature and the highest pH in the U carcass. Carcass pH is associated with glycolysis (Casey and Webb 2010) where each gram of muscle requires about ≤50 μmol muscle glycogen to produce lactic acid for the ultimate pH to be achieved. Another explanation is the volume effect where a skinnier carcass has more surface area to mass so that it can lose heat more quickly, leading to a low carcass temperature.
The decreasing pattern of carcass temperature in this study was curvilinear, similar to the findings in Saanen goats (Kannan et al. 2006). This curvilinear pattern reflects the relationship between energy supply and glycolysis. The sharp fall in muscle temperature during the early hours following postmortem suggests that energy supply from the rumen or muscle had ceased, followed by a slow and steady glycolytic process; this muscle temperature fall was also affected by room temperature.
The maintenance requirements of a larger animal increase with LW and are higher for a given LW at a higher level of ME intake. The Desman goats had high intake and were growing at a rapid rate. This meant that they had a higher metabolic rate at the same metabolic LW.
Weights of non-carcass components and other non-edible parts of the carcass are usually considered to be of secondary importance compared with carcass attributes (Limea et al. 2009; Abbasi et al. 2012). However, these components reflect metabolic function. In addition, these components represent substantial value to the producer, given that the omental fat is sold as suet and channel and kidney fat can be harvested for sale. The liver, heart and kidneys are also high-value components. In this study, the Desman treatment produced more of these edible non-carcass components and this represents significant value to the producer. However, when adjusted for carcass weight, the highest percentage of total edible non-carcass weight was 15.80% and was found in the Gliri goats and the lowest was 12.53%, recorded for the Desman goats.
The findings in the present study have demonstrated that LW gain, carcass yields, eye-muscle area, non-carcass weights, non-edible parts of the carcass and fat deposition were different among Desman, CSM, UCSM, Gliri and U goats.
Conclusions
Liveweight gain, carcass yields, eye-muscle area, fat depth and mass of non-carcass components of crossbred Boer goats are affected by UDP, RDP, MP and ME intakes when different amounts of UDP and RDP are provided in the diets. Goats offered Desmanthus dried-leaves only as a tropical legume had a significantly higher LW gain, heavier carcass yield, larger eye-muscle area, thicker fat depth and heavier mass of non-carcass components than did goats offered diets with CSM, UCSM, Gliri and U treatments, in a descending order. Mean carcass temperature and pH during 24 h postmortem also aligned with other productive performance responses because of protein fractions and ME intakes of varying amounts of UDP and RDP in the diets.
Data availability
The data that support this study will be shared upon reasonable request to the corresponding author.
Declaration of funding
The authors declare that all sources of funding for the research were provided by DBA funds from James Cook University, Australia.
Acknowledgements
The authors gratefully acknowledge the Australian Award Scholarship for a PhD scholarship to the first-named author and James Cook University for funding this project. We are thankful to Agrimix Ltd for supplying the Desmanthus hay utilised in this study. Aduli Malau-Aduli is acknowledged for his scientific-content improvement, editorial and proof-reading of this paper in addition to his provision of advisory mentorship to the first-named author. This paper forms part of the PhD thesis of Aholiab Aoetpah (2019).
References
Abbasi SA, Vighio MA, Soomro SA, Kachiwal AB, Gadahi JA, Wang GL (2012) Effect of different dietary energy levels on the growth performance of Kamori goat kids. International Journal for Agro Veterinary and Medical Science 6, 473-479.
| Google Scholar |
Al Jassim RAM, Hassan SA, Al-Ani AN, Dana TK (1991) Effects of undegradable protein supplementation on digestion and nitrogen balance in sheep and goats. Small Ruminant Research 5, 57-63.
| Crossref | Google Scholar |
Calnan HB, Jacob RH, Pethick DW, Gardner GE (2014) Factors affecting the colour of lamb meat from the longissimus muscle during display: the influence of muscle weight and muscle oxidative capacity. Meat Science 96, 1049-1057.
| Crossref | Google Scholar | PubMed |
Carmichael AK, Kouakou B, Gelaye S, Kannan G, Lee JH, Terrill TH (2012) Organ mass and composition in growing dairy goat wethers fed different levels of poultry fat and protein. Small Ruminant Research 104, 104-113.
| Crossref | Google Scholar |
Casey NH, Webb EC (2010) Managing goat production for meat quality. Small Ruminant Research 89, 218-224.
| Crossref | Google Scholar |
Cook B, Pengelly B, Schultze-Kraft R, Taylor M, Burkart S, Arango JAC, Guzmán JJG, Cox K, Jones C, Peters M (2020) Tropical forages. Available at https://www.tropicalforages.info//text/intro/index.html [Verified 28 June 2020]
Gardiner CP (2016) Developing and commercializing new pasture legumes for clay soils in the semi-arid rangelands of northern Australia. In ‘Tropical forage legumes: harnessing the potential of Desmanthus and other genera for heavy clay soils’. (Eds JR Lazier, N Ahmad) pp. 283–304. (CAB International: Wallingford, Oxon, UK) doi:10.1079/9781780646282.0283
Hocquette JF, Ortigues-Marty I, Vermorel M (2001) Manipulation of tissue energy metabolism in meat-producing ruminants – review. Asian–Australasian Journal of Animal Science 14, 720-732.
| Crossref | Google Scholar |
Kanani J, Lukefahr SD, Stanko RL (2006) Evaluation of tropical forage legumes (Medicago sativa, Dolichos lablab, Leucaena leucocephala and Desmanthus bicornutus) for growing goats. Small Ruminant Research 65, 1-7.
| Crossref | Google Scholar |
Kannan G, Gadiyaram KM, Galipalli S, Carmichael A, Kouakou B, Pringle TD, McMillin KW, Gelaye S (2006) Meat quality in goats as influenced by dietary protein and energy levels, and postmortem aging. Small Ruminant Research 61, 45-52.
| Crossref | Google Scholar |
Limea L, Boval M, Mandonnet N, Garcia G, Archimede H, Alexandre G (2009) Growth performance, carcass quality and non-carcass components of indigenous Caribbean goats under varying nutritional densities. Journal of Animal Science 87, 3770-3781.
| Crossref | Google Scholar | PubMed |
Listrat A, Lebret B, Louveau I, Astruc T, Bonnet M, Lefaucheur L, Picard B, Bugeon J (2016) How muscle structure and composition influence meat and flesh quality. The Scientific World Journal 2016, 1-14.
| Crossref | Google Scholar |
Maia MdO, Susin I, Pires AV, Gentil RS, Ferreira EM, Mendes CQ, Alencar SMd (2012) Growth, carcass characteristics, chemical composition and fatty acid profile of the longissimus dorsi muscle in goat kids fed diets with castor oil. Revista Brasileira de Zootecnia 41, 2343-2349.
| Crossref | Google Scholar |
McGregor BA (1990) Boneless meat yields and prediction equations from carcass parameters of Australian cashmere goats. Small Ruminant Research 3, 465-473.
| Crossref | Google Scholar |
Mtenga LA, Kitaly AJ (1990) Growth performance and carcass characteristics of Tanzanian goats fed Chloris gayana hay with different levels of protein supplement. Small Ruminant Research 3, 1-8.
| Crossref | Google Scholar |
Pophiwa P, Webb EC, Frylinck L (2017) Carcass and meat quality of Boer and indigenous goats of South Africa under delayed chilling conditions. South African Journal of Animal Science 47, 794-803.
| Crossref | Google Scholar |
Safari J, Mushi DE, Mtenga LA, Kifaro GC, Eik LO (2011) Growth, carcass and meat quality characteristics of Small East African goats fed straw based diets. Livestock Science 135, 168-176.
| Crossref | Google Scholar |
Solomon M, Melaku S, Tolera A (2008) Supplementation of cottonseed meal on feed intake, digestibility, live weight and carcass parameters of Sidama goats. Livestock Science 119, 137-144.
| Crossref | Google Scholar |
Suman SP, Joseph P, Li S, Steinke L, Fontaine M (2009) Primary structure of goat myoglobin. Meat Science 82, 456-460.
| Crossref | Google Scholar | PubMed |
Uza DV, Barde RE, Ayoade JA (2005) The effect of urea treated cassava peels as supplement to West African dwarf (WAD) goats grazing natural pasture. Nigerian Veterinary Journal 26, 1-9.
| Crossref | Google Scholar |
Wambui CC, Abdulrazak SA, Noordin Q (2006) Performance of growing goats fed urea sprayed maize stover and supplemented with graded levels of Tithonia diversifolia. Asian-Australasian Journal of Animal Sciences 19, 992-996.
| Crossref | Google Scholar |
White A, Holst P (2006) Fat scoring sheep and lambs. NSW DPI. Available at www.dpi.nsw.gov.au/primefacts