Next generation sequencing of African and Indicine cattle to identify single nucleotide polymorphisms
W. Barris A , B. E. Harrison A , S. McWilliam A , R. J. Bunch A , M. E. Goddard B and W. Barendse A CC. R. C. for Beef Genetic Technologies
A CSIRO Livestock Industries, Queensland Bioscience Precinct, 306 Carmody Road, St Lucia, Qld 4067, Australia.
B Department of Primary Industries Victoria, 1 Park Drive, Bundoora, Vic. 3083, Australia.
C Corresponding author. Email: bill.barendse@csiro.au
Animal Production Science 52(3) 133-142 https://doi.org/10.1071/AN11095
Submitted: 1 June 2011 Accepted: 27 November 2011 Published: 19 January 2012
Journal Compilation © CSIRO Publishing 2012 Open Access CC BY-NC-ND
Abstract
We sequenced the genomes of a Brahman, an Africander and a Tuli bull because tropically adapted breeds of cattle have so far not been well characterised at the level of DNA variation. In excess of 16 Gb of Illumina GA-II sequence was obtained for each animal in the form of 75-bp paired-end reads, generating more than 6× coverage of each genome, and between 86.7 and 88.8% of the bases of each genome sequence was covered by one or more sequence reads. A total of 6.35 million single nucleotide polymorphisms (SNP) were discovered in the three animals, adding 3.56 million new SNP to dbSNP. The Brahman animal had nearly twice as many SNP as either the Tuli or the Africander. Comparing genome sequence to genotypic array data, genotype accuracy from sequencing was more than 98% for homozygotes that had at least six high quality sequence reads and for heterozygotes that had at least two high quality reads containing the alternative allele. Intergenic and intronic SNP were found at higher densities closer to coding sequences, and there was a reduction in numbers of SNP within 5 bp of a splice site, features consistent with genetic selection. On average, slightly more SNP per Mb, and slightly higher average reads per SNP per Mb, were found towards the ends of chromosomes, especially towards the telomeric end of the chromosome. At least one autosome in each animal showed a large stretch of homozygosity, the largest was 58 Mb long in the Tuli, although the animals are not known to have recent inbreeding.
Additional keywords: Africander, Brahman, cattle, genome, selection, sequence, Tuli.
Introduction
One of the main results of the first comprehensive study of breed diversity (The Bovine HapMap Consortium 2009) strongly confirmed that cattle were split into three main types, European, Indian and African, a subdivision that has not always received support. That study also showed that while Indian and African cattle showed higher effective population sizes and higher sequence heterozygosity they also showed lower heterozygosity when genotyped using single nucleotide polymorphism (SNP) arrays. The SNP arrays were primarily constructed from SNP identified from taurine cattle, which suggested that SNP arrays need to incorporate SNP from Indicine and African cattle otherwise some of the population genetics statistics derived from those SNP assays could be biased (Porto Neto and Barendse 2010).
Genome sequencing of cattle using conventional Sanger sequencing methods began in 2005 at the Baylor College of Medicine with a line-bred Hereford female, Dominette (Womack 2006). This effort was the result of a large international consortium and the assembly of this sequence and its publication has been described (Elsik et al. 2009). A taurine bull of the Flekvieh breed (Eck et al. 2009) has been sequenced using next generation sequencing (NGS). NGS is a high throughput, low-cost method of sequencing that brings genome sequencing within the budgets of ordinary molecular genetics laboratories. To date, there is little genome sequence of Indicine animals in public databases, a partial sequence of a Brahman animal was used in the Bovine Genome Project to identify SNP (The Bovine HapMap Consortium 2009), and there is a report in the conference literature that a Nelore animal is in the process of being sequenced (Sonstegard et al. 2010). Furthermore, to the best of our knowledge no one has obtained a genome sequence of an African animal.
One of the most important tools provided by these genome sequences are the large numbers of polymorphisms that can be used for genetic analysis and improvement. A direct result of the bovine genome sequencing has been the construction of arrays consisting of tens of thousands of SNP that can be genotyped in parallel (Matukumalli et al. 2009; The Bovine HapMap Consortium 2009), which could be used for the practical purpose of identifying quantitative trait loci (Geldermann 1975; Barendse et al. 2007) as well as of implementing genomic selection (Goddard and Hayes 2007). Other usages include the estimation of pairwise relatedness between individuals in the absence of pedigree data (Oliehoek et al. 2006; Lee et al. 2010) and high resolution studies of breed relationships and diversity (Pritchard et al. 2000; Patterson et al. 2006). Lastly, these polymorphisms can be used to study the genetic history of a species and identify regions of the bovine genome that have been under population genetic selection (Barendse et al. 2009).
The objective of this study was to identify millions of SNP from tropically adapted cattle based in Australia. An Africander and a Tuli animal were chosen because they are non-zebu African-derived animals that have made a contribution to the tropically adapted genotypes in Australia. The Brahman was chosen because it and its crossbreds are the mainstay of tropical cattle production in northern Australia. We used the Illumina (Solexa) GA-II NGS method (Bentley et al. 2008) on DNA from these individuals. The genome sequence was then aligned to the UMD3.0 assembly of the Hereford genome sequence (Zimin et al. 2009) and SNP were identified both as variable bases within each new sequence and as fixed differences between these genome sequences and the reference Hereford sequence. Each new SNP was located to the reference sequence and then comparisons were made between the three animals.
Materials and methods
A minimum of 5 μg of DNA at a minimum of 500 ng/μl with 1.8 < OD260 < 2.0 was extracted from semen or blood samples for a Brahman, a Tuli and a grade Africander bull. The Brahman animal was chosen because it has a very large number of direct offspring in Australia, it has a high accuracy high estimated breeding value for growth, and it had been used as a sire in the International Bovine Reference Panel (Barendse et al. 1994). Furthermore, its ancestry included Guzerat, Nelore, Gir and Indo Brazil lineages, all four of the foundation lines of Indian breeds that have gone into the formation of the Brahman (Sanders 1980). The Tuli animal was a purebred Tuli, derived from the Boran and Tuli animals imported from Africa (Frisch 1989), a breed that originated in Zimbabwe. The Africander animal was selected because it was the highest grade Africander animal available in Australia. The semen sample dated back to 1987 and the animal was more than 50% Africander. Although the animal was not pure Africander, having some Hereford and Shorthorn ancestry due to grading up from South African semen samples, the objective of the study was to identify SNP, so it was less important to get an absolutely purebred animal but rather to get a sample of a South African genome. Throughout this report, cattle of Indian ancestry are referred to as Indicine or zebu and not Indian because DNA or current samples cannot be obtained directly from India.
DNA was provided to Illumina Inc. (Hayward, CA, USA) via the FastTrack sequencing service in September 2009. Using the Illumina GA-II sequencing methodology (Bentley et al. 2008), a minimum of 16 Gb of 75-bp paired-end reads were generated for each animal, equivalent to one flow cell for each. The raw genome sequence was aligned to the UMD 3.0 assembly (Zimin et al. 2009) of the reference Hereford bovine sequence (Elsik et al. 2009) discarding all sequences that aligned to more than one region of the reference bovine genome. Paired ends were mated as a check of the assembly and the sequence was displayed using GBrowse (available at http://gmod.org/wiki/GBrowse, verified 30 November 2011).
The DNA of the three animals was not pooled during sequencing. This allowed relatively simple identification of SNP because a true heterozygote genotype will show ~50% of its sequences for each alternative base and so sequencing artefacts can be separated more accurately from true heterozygotes. SNP identification was not affected by the sampling bias towards common alleles, because it was not possible to identify how common a SNP was through this process, so SNP discovery would not be biased by that knowledge. However, the data would still suffer from the ascertainment bias due to the choice of the animal, a bias that can only be overcome by sequencing large numbers of individuals.
SNP were called where: (1) the animal showed two alleles at a particular base where both alleles were supported by a forward and reverse sequence read (type 1); or (2) the animal showed a fixed difference to the Hereford sequence (type 2). These genome sequences were analysed using the Sequence Alignment/Map (SAM) Tools pileup module (Li et al. 2009) downloaded from http://samtools.sourceforge.net/. SAM Tools calculates a SNP score (a Phred scaled likelihood that the SNP is identical to the reference sequence), a consensus quality (Phred scaled likelihood that the genotype is wrong) and a root mean square quality score for the reads covering the putative polymorphic site (http://http://sourceforge.net/apps/mediawiki/samtools/index.php?title = SAM_FAQ, verified 6 October 2011), and this filter was used as phase I of the SNP calling. These filters weight or remove bases that have poor sequence, such as low depth of coverage or too high a depth of coverage, too many SNP in a window, too many indels in a window, or close to a high quality indel, factors that will all tend to generate sequence artefacts. A Phred scaled likelihood is a log-based probability of sequence errors (Ewing et al. 1998). Alternative bases were removed if their quality score was low. A minimum SNP quality of 10 in SAM Tools was required. Then at least two alternative bases were required to call a SNP. If there were three variants at a position, 90% of the reads needed to be one of the alternatives to the Hereford sequence.
To quantify the accuracy of SNP genotyping for these animals, each animal was genotyped twice using an Illumina Bovine SNP50 array at CSIRO, a consensus genotype was then assigned to each SNP, and then the genotype at each sequence was compared with the Illumina Bovine SNP50 genotype.
To determine whether there were any consistent differences between genome regions in SNP abundance, the distribution and identity of SNP were analysed in 1-Mb non-overlapping bins and the results plotted using the R project software (Ihaka and Gentleman 1996) downloaded from http://www.r-project.org/, verified 1 December 2011. A smooth spline (Venables and Ripley 2000) was fitted to the distribution of SNP to show the fluctuation of SNP abundance and sequence coverage across the genome for each animal. Summary statistics were computed by counting and standard methods were used to calculate correlations between variables (Pearson 1903).
Results
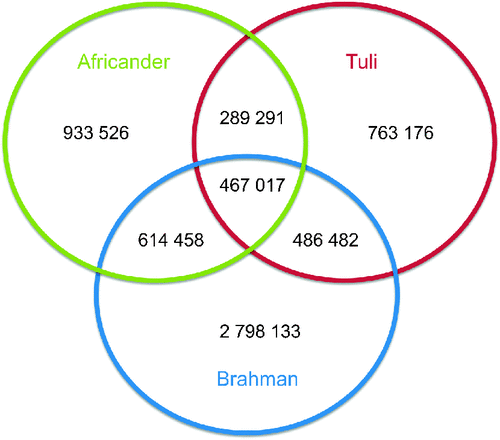
The number of SNP and genetic diversities of the animals sequenced are shown in Table 1, showing a range between 2 and 4.4 million SNP per animal. The sequencing volume was sufficient to cover each base of the sequence >6 times on average and between 86.7 and 88.8% of the bases of each animal was covered by one or more sequence reads. The mean ± s.d. of reads defining a SNP was between 6.0 ± 3.8 in Tuli and 6.8 ± 3.5 in Brahman with a range of 3–100. For the Brahman animal this translated to 1 variant bp per 611 bp, for the Africander, 1 per 1158 bp, and for the Tuli, 1 per 1331 bp, compared with the Hereford reference sequence. Seventy percent of SNP were transitions (A/G and C/T SNP) in all three animals. The intersection of SNP (Fig. 1) between these animals is Brahman and Africander: 1 081 475 SNP, Brahman and Tuli: 953 499 SNP and Africander and Tuli: 756 308 SNP. All three animals share 467 017 SNP. The total number of SNP reduced to 6 352 083 putative unique variants identified in this project. The SNP that were identified in these three animals were submitted to dbSNP, of which ~3.56 million were new to dbSNP. dbSNP accession numbers for the SNP are in the numerical ranges for Tuli of ss418642870 to ss422339814, for Africander of ss422339815 to ss424510092, and Brahman of ss424510093 to ss428897145.

|
|
Between 40 and 45% of the SNP were due to heterozygous bases within the animal (type 1) and the rest of the SNP were differences to the Hereford sequence (type 2). Despite the lower percentage of SNP due to heterozygous bases in the Brahman sequence compared with the Africander and the Tuli, the total number of heterozygous sites in the Brahman was still 1.72 times greater than the Africander and 2.03 times that found in the Tuli after removal of the SNP that were fixed differences to the Hereford. Rather, the Brahman sequence showed a larger proportion of fixed differences to the Hereford genome sequence than the Africander or the Tuli.
The reduced heterozygosity or reduction in type 1 SNP on the bovine X chromosome (BTAX) was used to estimate the false discovery rate (FDR) for SNP, because the animals were male and therefore should not be heterozygous, the only SNP being differences to the Hereford sequence. For the 137 Mb of BTAX outside the pseudo-autosomal region, the mean ± s.d. number of type 1 SNP per Mb was 41.1 ± 71.3 (Tuli), 43.6 ± 77.0 (Africander) and 55.1 ± 84.8 (Brahman). These were respectively 13.4, 11.8 and 8.1% of the type 1 SNP per Mb across the genomes of the Tuli, Africander and Brahman animals individually, and 10.3% when combined across all three animals, giving an estimate of the FDR.
The genotypes derived from sequencing were compared with genotypes obtained from an Illumina Bovine SNP50 array and these two sources of data showed low discrepancy (Table 2). These comparisons only included SNP where the animal was a heterozygote by sequence or where it showed a different homozygote to the Hereford reference animal, because we do not have the genotype of the Hereford reference animal for the Illumina Bovine SNP50 array. Nevertheless, for heterozygotes by sequence, the error rate overall ranged between 4.78 and 6.94%, but if SNP that were supported by only 1 alternative base were excluded, this percentage reduced to 1.14–1.93%, depending on the animal. Between 22.7 and 32.0% of heterozygous SNP genotypes were supported by only 1 high quality alternative base sequence. For homozygotes by sequence, the error rate overall ranged between 2.04 and 4.92%, but if SNP that were supported by fewer than 6 sequence reads were excluded then the error rate reduced to 1.07–2.28%, depending on the animal. Between 49.5 and 65.4% of homozygous SNP genotypes were supported by fewer than 6 high quality sequences.

|
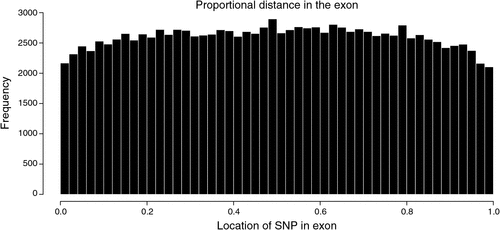
There were 2.26 million SNP in exons or introns of 20 774 of the 24 257 named genes (85.6%) in the bovine genome, of which 129 969 (2.1% of all SNP in this study) were in exons and 2 149 650 where in introns, and the rest of the 6.35 million SNP were located between genes. Of the SNP in introns, the distance to the closest coding sequence ranged from 1 to 554 418 bp with a mean of 15 867 bp. Of the SNP between genes, the distance to the closest coding sequence ranged from 1 to 2 841 329 bp with a mean of 184 284 and median 78 964 bp. Due to the draft nature of the bovine genome sequence, while the low end of the range would be accurate, the high end would be affected by the incomplete nature of the assembly, and the median is more likely to be representative of the distance. The number of intergenic (Fig. 2) and intronic (Fig. 3) SNP increased closer to coding sequences, reaching a peak near the start or end of coding sequences. Within coding sequences themselves, the number of SNP near splice sites, start or stop codons of genes was reduced compared with the body of the exon (Fig. 4). Furthermore, although the number of SNP in introns increased closer to the splice site, the number of SNP was reduced by more than 50% in the 5 bp next to the splice site. The numbers of SNP shown in these figures were not strongly influenced by differences in the distance between genes or the length of exons or introns. First, the exon lengths were scaled, so the number of SNP was expressed as a percentage of the length along the exon. Second, the mean distance between genes is 97 140 bp with a median of 20 728 bp and only 6333 of 18 804 of the reasonably well estimated intergenic distances were less than 10 kb – the number of intervals is less that the total number of genes because it is a draft assembly and so the longer distances are less well estimated, some genes are located within the introns of other genes, or the location of the gene is not on the assembly. However, most of the reduction in SNP densities had occurred after the 1 kb of the intergenic space just proximal to the start codon or distal to the stop codon, regions that would contain the promoter sequences and would be adjacent to the 3′ untranslated region of the gene. At the distances plotted in Fig. 2, one would expect that the distribution of SNP would be equal at all intervals rather than showing an increase as one approaches the boundary between gene and non-gene. The type 1 SNP showed the same shape of the distribution as the type 2 SNP in each animal. Although between 40 and 45% of SNP were type 1 across the genome, the proportion of type 1 SNP within 10 kb of the coding sequence was 57% (Brahman), 81% (Africander) and 84% (Tuli), a significant (P = 0) difference. All three animals showed greater heterozygosity near genes compared with away from genes, and both types of SNP became increasingly more common the closer one approached the start or end of a gene sequence coming from the intergenic region.

|

|
|
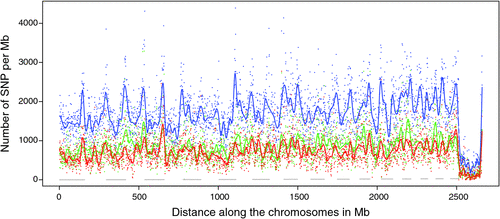
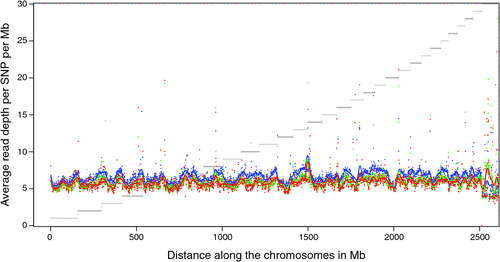
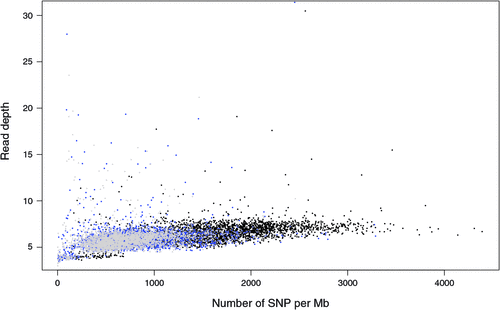
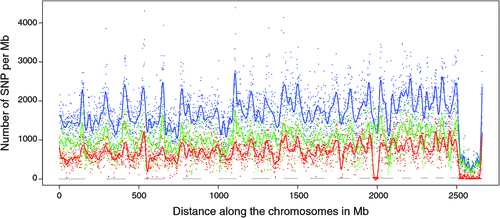
There appeared to be greater densities of SNP near the centromeric and telomeric ends of chromosomes that were not explained by differences in read depth across the genome (Figs 5 and 6). The NGS data showed a regular pattern of increasing read depth near the ends of chromosomes, which to some extent was mirrored by increased numbers of SNP near chromosome ends. However, the correlation between read depth and number of SNP was r = 0.17 (Tuli), r = 0.19 (Africander), and r = 0.40 (Brahman) for n = 2660 non-overlapping 1-Mb sequence bins (Fig. 7). Due to the sample size, all these correlations are significant at P << 0.001, but the regression coefficients were b <7.8 × 10⁻⁴ with s.e. <8.0 × 10⁻⁵ for all three of these relationships, and read depth explained less than 16% of the variance in SNP distribution. The correlation between type 1 and type 2 SNP in any Mb interval is low within each genome sequence, r = 0.13 (Tuli), r = 0.02 (Africander) and r = 0.19 (Brahman), the amount of the variance explained was small (R 2 < 0.036) (Fig. 8), which also suggested that SNP distributions were less affected by random factors such as read depth and more by factors such as functional differences between parts of the genome sequence.
|
|
|
|
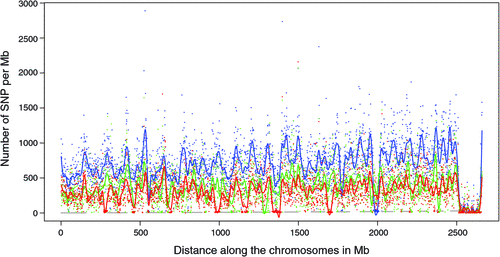
There are several regions where the heterozygosity or occurrence of type 1 SNP in an animal reached the FDR over a multi-Mb region in each of the three animals (Fig. 9), meaning that heterozygosity had effectively become zero. In the Brahman animal there is only one such region, of ~54 Mb on BTA20, where the number of type 1 SNP per Mb declined suddenly to close to zero. In the Africander and Tuli, there were several of these regions. The largest region in the Tuli consisted of ~58 Mb on BTA12 but the largest region in the Africander was much smaller, consisting of ~34 Mb on BTA11. The Africander appeared to have more, smaller regions of reduced heterozygosity than the Tuli.
|
Discussion
In this study we identified 6.35 million SNP from three Indicine or African bulls and added a further 3.56 million SNP to the public databases. These SNP were located to all parts of the genome, every Mb of the assembled genome had tens to thousands of SNP in each animal, even though the coverage of the genome was not complete for any animal. Approximately 90% of these SNP appear to be real and not false discoveries. Approximately a third of these SNP were in introns or exons of 85.6% of the named bovine genes, 2.1% of the SNP were in exons, and the rest of the SNP were located in the intergenic sequence. More than 50% of the SNP were differences between these sequences and the reference Hereford sequence. The Brahman sequence had more of these sequence differences than either the Africander or Tuli sequence, as expected from the genetic divergence between taurine and Indicine cattle. Nevertheless, the Brahman sequence had more variable bases than either the Africander or Tuli sequence, and SNP were approximately twice as common in the Brahman animal compared with the Tuli or Africander animal. In the intergenic region, as one approached the start or end of the coding sequence of a gene, SNP appeared to become more common. Furthermore, in each of these animals, the proportion of type 1 SNP increased, showing that the heterozygosity of each animal increased in the few kb before or after the coding sequence. This suggests not only an enrichment of SNP in areas of the genome that might affect the regulation of genes, but that individuals are more likely to be heterozygotes in these genomic regions. NGS sequencing appeared to generate more coverage of the bovine genome near ends of chromosomes, but while SNP numbers also appear to be greater near the ends of chromosomes, SNP numbers are only loosely related to coverage of the genome in this study. Finally, cattle are known to have a degree of inbreeding, which would usually be seen as regions of identity-by-descent of a range of small to moderate lengths, but surprisingly, all three animals were found also to have a few large segments of DNA at the tens of Mb pairs that were identical-by-descent.
One of the proposed uses of DNA sequence information is for imputation of genotypes in a genomic selection scheme (Meuwissen and Goddard 2010), but our results indicate that substantial depth of coverage will be needed per sire if this source of information is to have low levels of error. In genomic selection (Goddard and Hayes 2007), tens to hundreds of thousands of genotypes spread across the genome are used to predict breeding values or phenotypes. The basis for this prediction is linkage disequilibrium between the DNA markers and mutations that cause phenotypic change. The number of SNP needed is a linear function of the effective population size (Solberg et al. 2008), and, in practice, breeds such as the Holstein or Angus in cattle (Hayes et al. 2009; VanRaden et al. 2009; Anon. 2010; MacNeil et al. 2010) appear to have successful genomic selection using ~50 000 SNP. However, the equations linking SNP to breeding values are not transferable across breeds and some breeds may be too diverse to have genomic selection using only 50 000 SNP. One source of information that would be useful is to impute genotypes at a higher density using information from key ancestors (Meuwissen and Goddard 2010). The plan would be to genotype sires from each breed using a higher density SNP array, consisting of ~700 000 SNP. This resource would still rely on linkage disequilibrium between DNA marker and causative mutations. Using genome sequence could identify causative mutations (Mardis 2008; The 1000 Genomes Project Consortium 2010). However, our results show that low level sequence coverage, which may be suitable for the identification of SNP, will only generate accurate genotypes for the subset with depth of coverage of at least six sequence reads for homozygotes or at least two alternative sequence reads for heterozygotes, which was between one-third to one-half of the SNP in the three animals we sequenced. This shows that a large number of SNP could be incorrectly genotyped, radically affecting any imputation of genotypes, and SNP with too little depth of coverage should be excluded from such imputation experiments. Furthermore, if the notion is to incorporate all possible variation so as to capture the causative mutations in an animal, then substantially higher levels of read depth will be needed for a subset of the key ancestors of a breed, so that all of that animal’s genome is covered at a suitable depth.
The distribution of SNP near coding sequences is consistent with selection, is not likely to be due to random factors, and suggests that there is ample variation in regulatory regions of the genome for further evolution in cattle. It is well known that the regulation of gene expression is due to DNA sequences that are in the 1–2 kb upstream of a gene (Kozak 1996; Ptashne 2005), with some regulation of the mRNA itself in the 3′ untranslated region (Belloc et al. 2008). Furthermore, genetic variation within regulatory regions has long been implicated in major phenotypic change in evolution, rather than variation within coding sequence (Wang et al. 1999; Van Laere et al. 2003). Here we have shown much higher levels of SNP densities in regulatory regions of genes. Furthermore, there is a clear reduction in SNP densities in coding regions including further reductions in SNP variation on either side of the splice site, consistent with negative selection maintaining the machinery of gene transcription and integrity of protein sequence. Could the high levels of SNP variability be due to relaxation of selection? First, although there are islands of conservation of sequence as well as micro-RNA sequences in intergenic sequences, most of the intergenic region of the genome has no assigned function, but in our data this region has lower SNP variability than the regions close to genes. The higher levels near to genes are unlikely to be due merely to relaxed selection. Second, there is a significant change in the ratio of type 1 SNP so that there is a major increase in the heterozygosity of an individual close to genes compared with the genome as a whole. Under a neutral process, a SNP will arise and either exit the population or go to fixation in a characteristic time period dependent on the genetic history and population structure of a species (Kimura 1982). For there to be more SNP and higher levels of heterozygosity near genes would imply either that many of the SNP are being held from proceeding to fixation by some neutral population process that only applies near genes or that natural selection favours heterozygosity in promoter sequences in these animals. The former of these alternatives is hard to visualise compared with the latter alternative.
Acknowledgements
We thank Heather Burrow, Kishore Prayaga, David Johnston, Warren Sim, and Brian Dalrymple for discussion or support during this project. Sigrid Lehnert and Laercio Porto Neto read and commented on the manuscript. The Meat and Livestock Australia co-funded the research through the Beef CRC. The SNP identified in this report were provided before publication to Affymetrix Inc. and to Illumina Inc. for potential inclusion in their high density SNP arrays.
References
Anon (2010) Technical summary: high-density (HD) 50K MVPs –the beef industry’s first commercially available molecular value predictions from a high-density panel with more than 50 000 markers. Available at http://animalhealth.pfizer.com/sites/pahweb/US/EN/PublishingImages/Genetics%20Assets/HD50K/50K%20Tech%20Summary%2004-13-10.pdf [Verified 9 December 2011]Barendse W, Armitage SM, Kossarek LM, Shalom A, Kirkpatrick BW, Ryan AM, Clayton D, Li L, Neibergs HL, Zhang N, Grosse WM, Weiss J, Creighton P, McCarthy F, Ron M, Teale AJ, Fries R, McGraw RA, Moore SS, Georges M, Soller M, Womack JW, Hetzel DJS (1994) A genetic linkage map of the bovine genome. Nature Genetics 6, 227–235.
| A genetic linkage map of the bovine genome.Crossref | GoogleScholarGoogle Scholar | 1:CAS:528:DyaK2cXivFWitbo%3D&md5=a8c4e62e4031f545c62fde7a02f6788dCAS |
Barendse W, Reverter A, Bunch RJ, Harrison BE, Barris W, Thomas MB (2007) A validated whole genome association study of efficient food conversion. Genetics 176, 1893–1905.
| A validated whole genome association study of efficient food conversion.Crossref | GoogleScholarGoogle Scholar | 1:CAS:528:DC%2BD2sXhtVeiur3K&md5=c8a011571c1aafdb70ee7f82e41878bcCAS |
Barendse W, Harrison BE, Bunch RJ, Thomas MB, Turner LB (2009) Genome wide signatures of positive selection: the comparison of independent samples and identification of regions associated to traits. BMC Genomics 10, 178
| Genome wide signatures of positive selection: the comparison of independent samples and identification of regions associated to traits.Crossref | GoogleScholarGoogle Scholar |
Belloc E, Piqué M, Méndez R (2008) Sequential waves of polyadenylation and deadenylation define a translation circuit that drives meiotic progression. Biochemical Society Transactions 36, 665–670.
| Sequential waves of polyadenylation and deadenylation define a translation circuit that drives meiotic progression.Crossref | GoogleScholarGoogle Scholar | 1:CAS:528:DC%2BD1cXoslCltLs%3D&md5=56bf522d5ee0bb8e2eba255d92205a12CAS |
Bentley DR, Balasubramanian S, Swerdlow HP, Smith GP, Milton J, et al (2008) Accurate whole human genome sequencing using reversible terminator chemistry. Nature 456, 53–59.
| Accurate whole human genome sequencing using reversible terminator chemistry.Crossref | GoogleScholarGoogle Scholar | 1:CAS:528:DC%2BD1cXhtlCjtr3E&md5=ebf525c90efda96d8b7fec68cd857ab1CAS |
Eck SH, Benet-Pages A, Flisikowski K, Meitinger T, Fries R, Strom TM (2009) Whole genome sequencing of a single Bos taurus animal for single nucleotide polymorphism discovery. Genome Biology 10, R82
| Whole genome sequencing of a single Bos taurus animal for single nucleotide polymorphism discovery.Crossref | GoogleScholarGoogle Scholar |
Elsik CG, Tellam RL, Worley KC, Bovine Genome Sequencing Analysis Consortium (2009) The genome sequence of taurine cattle: a window to ruminant biology and evolution. Science 324, 522–528.
| The genome sequence of taurine cattle: a window to ruminant biology and evolution.Crossref | GoogleScholarGoogle Scholar |
Ewing B, Hillier L, Wendl MC, Green P (1998) Base-calling of automated sequencer traces using phred. I. Accuracy assessment. Genome Research 8, 175–185.
Frisch J (1989) More meat in the northern sandwich. Agricultural Science 2, 71–77.
Geldermann H (1975) Investigations on inheritance of quantitative characters in animals by gene markers. I. Methods. Theoretical and Applied Genetics 46, 319–330.
| Investigations on inheritance of quantitative characters in animals by gene markers. I. Methods.Crossref | GoogleScholarGoogle Scholar |
Goddard ME, Hayes BJ (2007) Genomic selection. Journal of Animal Breeding and Genetics 124, 323–330.
| Genomic selection.Crossref | GoogleScholarGoogle Scholar | 1:STN:280:DC%2BD2sjjvFyiug%3D%3D&md5=fbe6a6dc22a2d7e987a7a666f1412215CAS |
Hayes BJ, Bowman PJ, Chamberlain AJ, Goddard ME (2009) Invited review: genomic selection in dairy cattle: progress and challenges. Journal of Dairy Science 92, 433–443.
| Invited review: genomic selection in dairy cattle: progress and challenges.Crossref | GoogleScholarGoogle Scholar | 1:CAS:528:DC%2BD1MXit1Kju7s%3D&md5=23939241311e2729579adc8fdcbcfdabCAS |
Ihaka R, Gentleman R (1996) R: a language for data analysis and graphics. Journal of Computational and Graphical Statistics 5, 299–314.
| R: a language for data analysis and graphics.Crossref | GoogleScholarGoogle Scholar |
Kimura M (1982) The neutral theory as a basis for understanding the mechanism of evolution and variation at the molecular level. In ‘Molecular evolution, protein polymorphism and the neutral theory’. (Ed. M Kimura) pp. 3–56. (Japan Scientific Societies Press: Tokyo)
Kozak M (1996) Interpreting cDNA sequences: some insights from studies on translation. Mammalian Genome 7, 563–574.
| Interpreting cDNA sequences: some insights from studies on translation.Crossref | GoogleScholarGoogle Scholar | 1:CAS:528:DyaK28XlsFSlsLk%3D&md5=23c83d2aa805966a5515192a24224febCAS |
Lee SH, Goddard ME, Visscher PM, van der Werf JHJ (2010) Using the realized relationship matrix to disentangle confounding factors for the estimation of genetic variance components of complex traits. Genetics, Selection, Evolution. 42, 22
| Using the realized relationship matrix to disentangle confounding factors for the estimation of genetic variance components of complex traits.Crossref | GoogleScholarGoogle Scholar |
Li H, Handsaker B, Wysoker A, Fennell T, Ruan J, Homer N, Marth G, Abecasis G, Durbin R, 1000 Genome Project Data Processing Subgroup (2009) The sequence alignment/map format and SAMtools. Bioinformatics (Oxford, England) 25, 2078–2079.
| The sequence alignment/map format and SAMtools.Crossref | GoogleScholarGoogle Scholar |
MacNeil MD, Northcutt SL, Schnabel RD, Garrick DJ, Woodward BW, Taylor JF (2010) Genetic correlations between carcass traits and molecular breeding values in Angus cattle. In ‘9th world congress of genetics applied to livestock production’. Leipzig, Germany. (Ed. G Erhardt) Abstract PP2, p. 148.
Mardis ER (2008) The impact of next-generation sequencing technology on genetics. Trends in Genetics 24, 133–141.
| The impact of next-generation sequencing technology on genetics.Crossref | GoogleScholarGoogle Scholar | 1:CAS:528:DC%2BD1cXislKht74%3D&md5=39b1c8bda07ed20e092b091179b1e145CAS |
Matukumalli LK, Lawley CT, Schnabel RD, Taylor JF, Allan MF, Heaton MP, O’Connell J, Moore SS, Smith TPL, Sonstegard TS, Van Tassell CP (2009) Development and characterization of a high density SNP genotyping assay for cattle. PLoS ONE 4, e5350
| Development and characterization of a high density SNP genotyping assay for cattle.Crossref | GoogleScholarGoogle Scholar |
Meuwissen T, Goddard M (2010) The use of family relationships and linkage disequilibrium to impute phase and missing genotypes in up to whole-genome sequence density genotypic data. Genetics 185, 1441–1449.
| The use of family relationships and linkage disequilibrium to impute phase and missing genotypes in up to whole-genome sequence density genotypic data.Crossref | GoogleScholarGoogle Scholar |
Oliehoek PA, Windig JJ, van Arendonk JAM, Bijma P (2006) Estimating relatedness between individuals in general populations with a focus on their use in conservation programs. Genetics 173, 483–496.
| Estimating relatedness between individuals in general populations with a focus on their use in conservation programs.Crossref | GoogleScholarGoogle Scholar | 1:CAS:528:DC%2BD28XlvF2itLo%3D&md5=01cc63dde1eccb1dc6f28a0191486478CAS |
Patterson N, Price AL, Reich D (2006) Population structure and eigenanalysis. PLOS Genetics 2, e190
| Population structure and eigenanalysis.Crossref | GoogleScholarGoogle Scholar |
Pearson K (1903) I. Mathematical contributions to the theory of evolution. XI. On the influence of natural selection on the variability and correlation of organs. Philosophical Transactions of the Royal Society of London Series a-Containing Papers of a Mathematical or Physical Character 200, 1–66.
| I. Mathematical contributions to the theory of evolution. XI. On the influence of natural selection on the variability and correlation of organs.Crossref | GoogleScholarGoogle Scholar |
Porto Neto LR, Barendse W (2010) Effect of SNP origin on analyses of genetic diversity in cattle. Animal Production Science 50, 792–800.
| Effect of SNP origin on analyses of genetic diversity in cattle.Crossref | GoogleScholarGoogle Scholar |
Pritchard JK, Stephens M, Donnelly P (2000) Inference of population structure using multilocus genotype data. Genetics 155, 945–959.
Ptashne M (2005) Regulation of transcription: from lambda to eukaryotes. Trends in Biochemical Sciences 30, 275–279.
| Regulation of transcription: from lambda to eukaryotes.Crossref | GoogleScholarGoogle Scholar | 1:CAS:528:DC%2BD2MXltFCksrs%3D&md5=5d7f304a76015986df01f3e92460a2e9CAS |
Sanders JO (1980) History and development of zebu cattle in the United States. Journal of Animal Science 50, 1188–1200.
Solberg TR, Sonesson AK, Woolliams JA, Meuwissen THE (2008) Genomic selection using different marker types and densities. Journal of Animal Science 86, 2447–2454.
| Genomic selection using different marker types and densities.Crossref | GoogleScholarGoogle Scholar | 1:CAS:528:DC%2BD1cXht1ams73E&md5=25aafd32e898e5542fbbb9c829b04c36CAS |
Sonstegard TS, Schroeder SG, Smith TPL, Zimin A, Matukumalli LK, Ajmone-Marsan P, Wiedmann R, Negrini R, Yorke J, Van Tassell CP, Garcia JF (2010) Sequence analysis for a de novo genome assembly of Bos indicus (Nelore) cattle. In ‘32nd conference of the international society for animal genetics’. Edinburgh, Scotland. (Ed. A Archibald) Abstract P3092.
The 1000 Genomes Project Consortium (2010) A map of human genome variation from population-scale sequencing. Nature 467, 1061–1073.
| A map of human genome variation from population-scale sequencing.Crossref | GoogleScholarGoogle Scholar |
The Bovine HapMap Consortium (2009) Genome-wide survey of SNP variation uncovers the genetic structure of cattle breeds. Science 324, 528–532.
| Genome-wide survey of SNP variation uncovers the genetic structure of cattle breeds.Crossref | GoogleScholarGoogle Scholar |
Van Laere AS, Nguyen M, Braunschweig M, Nezer C, Collette C, Moreau L, Archibald AL, Haley CS, Buys N, Tally M, Andersson G, Georges M, Andersson L (2003) A regulatory mutation in IGF2 causes a major QTL effect on muscle growth in the pig. Nature 425, 832–836.
| A regulatory mutation in IGF2 causes a major QTL effect on muscle growth in the pig.Crossref | GoogleScholarGoogle Scholar | 1:CAS:528:DC%2BD3sXotlWqtro%3D&md5=96d94c6ec1ea62e2081069696b34f9b1CAS |
VanRaden PM, Van Tassell CP, Wiggans GR, Sonstegard TS, Schnabel RD, Taylor JF, Schenkel FS (2009) Invited review: reliability of genomic predictions for North American Holstein bulls. Journal of Dairy Science 92, 16–24.
| Invited review: reliability of genomic predictions for North American Holstein bulls.Crossref | GoogleScholarGoogle Scholar | 1:CAS:528:DC%2BD1MXlsVOrsw%3D%3D&md5=e20b7d5db6872bfe41fe1c7cba312240CAS |
Venables WN, Ripley BD (2000) ‘Modern applied statistics with S-PLUS.’ (Springer Verlag New York, Inc.: New York)
Wang RL, Stec A, Hey J, Lukens L, Doebley J (1999) The limits of selection during maize domestication. Nature 398, 236–239.
| The limits of selection during maize domestication.Crossref | GoogleScholarGoogle Scholar | 1:CAS:528:DyaK1MXitVGkt7g%3D&md5=6c526d630c8d44c1f1a2fadb7fa0e3acCAS |
Womack JE (2006) The impact of sequencing the bovine genome. Australian Journal of Experimental Agriculture 46, 151–153.
| The impact of sequencing the bovine genome.Crossref | GoogleScholarGoogle Scholar | 1:CAS:528:DC%2BD28XhvFCqs7k%3D&md5=6564bb30e281ec30183066c1827e4925CAS |
Zimin AV, Delcher AL, Florea L, Kelley DR, Schatz MC, Puiu D, Hanrahan F, Pertea G, Van Tassell CP, Sonstegard TS, Marçais G, Roberts M, Subramanian P, Yorke JA, Salzberg SL (2009) A whole-genome assembly of the domestic cow, Bos taurus. Genome Biology 10, R42
| A whole-genome assembly of the domestic cow, Bos taurus.Crossref | GoogleScholarGoogle Scholar |


