Within- and across-flock genetic relationships for breech flystrike resistance indicator traits
D. J. Brown A C , A. A. Swan A and J. S. Gill BA Animal Genetics and Breeding Unit*, University of New England, Armidale, NSW 2351, Australia.
B Meat & Livestock Australia, University of New England, PO Box U254, Armidale, NSW 2351, Australia.
C Corresponding author. Email: dbrown2@une.edu.au
Animal Production Science 50(12) 1060-1068 https://doi.org/10.1071/AN10102
Submitted: 21 June 2010 Accepted: 22 September 2010 Published: 23 November 2010
Abstract
Flystrike is a major cost for the Australian sheep industry. The industry is currently implementing selection strategies for flystrike resistance to reduce the need for breech flystrike prevention. The following indicator traits are used to select for breech flystrike resistance: wool cover, skin wrinkle on the body and breech, scouring (dags) and wool colour. The aims of this study were to estimate genetic correlations between these indicator traits and production traits using the Sheep Genetics database, to distinguish between within- and across-flock genetic relationships, and to quantify responses to selection using indexes that include breech wrinkle as a proxy trait for flystrike resistance. Breech flystrike indicator traits are all heritable; however, there are significant antagonisms between wrinkle score and some production traits, primarily fleece weight and fibre diameter. Thus, simultaneous improvement in both flystrike resistance and production will be most efficient when index selection is used. Our results show that, depending on the level of emphasis placed on breech wrinkle in the index, reductions in breech wrinkle score of 0.4–0.9 units can be achieved over a 10-year period. As across-flock relationships are generally stronger than within-flock relationships, breeders will be able to take advantage of this additional variation, depending on the relative merit of their flocks. Therefore, ram breeders should combine within-flock selection with across-flock selection where possible. Sheep Genetics released early breech wrinkle Australian Sheep Breeding Values in September 2009 to assist Merino breeders in making faster progress towards reducing breech wrinkle by using flock selection.
Introduction
Flystrike costs the Australian sheep industry $280 million dollars annually (Sackett et al. 2006) as a result of sheep deaths, the cost of treatment and reduced fleece and carcass weight. Merino producers have traditionally used the mulesing procedure, in which the skin around the breech is removed, to decrease the incidence of flystrike. Although this procedure has proven highly successful, increasing public concern for animal welfare has forced sheep breeders to search for alternatives. The most effective long-term strategy is to breed flystrike-resistant sheep that do not require surgical prevention. However, breech flystrike is not conducive to measurement or direct selection. Research has revealed several easily measured indicator traits associated with breech flystrike: breech wool cover, breech skin wrinkle, scouring (dags), wool colour and fleece rot (James 2006; Greeff and Karlsson 2009; Smith et al. 2009). There is now a large dataset on these traits in Sheep Genetics’ MERINOSELECT database, which was compiled using both industry and research flocks. A subset of these traits is used in routine analysis for estimating Australian Sheep Breeding Values (ASBV).
Accurate estimates of the associations of these traits with key production traits are required to evaluate the effect of including flystrike in the overall breeding objective and of using these traits as selection criteria. There are several significantly differing strains present across the Merino population. In addition the Australian Merino flock is very diverse by nature of distance, breeding philosophies and the increased use of across-flock sires. Significant between-flock effects have been demonstrated for production and flystrike resistance traits (Atkins and McGuirk 1976; Mortimer and Atkins 1989, 1993). As a result of these differences between flocks it is possible that associations between traits observed across the entire population may differ from those within individual flocks. Atkins and McGuirk (1976), Mortimer and Atkins (1989, 1993) also demonstrated that the magnitude of between-flock correlations for some traits is at least equal to and is in most cases greater than that of within-flock correlations. Furthermore, genetic group effects are fitted for each flock in the routine genetic evaluation for Sheep Genetics (Brown et al. 2007). These genetic group effects may also influence the associations observed between traits.
The aims of this study were to estimate genetic correlations between wrinkle, breech cover, dags, wool colour, wool character and fleece rot traits with production traits within the MERINOSELECT database, to distinguish between within- and across-flock genetic relationships and to predict selection responses to inclusion of early breech wrinkle in a selection index. Early breech wrinkle was chosen as this is the trait that is the only indicator trait that is currently published by Sheep Genetics.
Materials and methods
Data
Pedigree and performance data were extracted from the Sheep Genetics MERINOSELECT database (May 2010) (Brown et al. 2007). This database consists of pedigree and performance records submitted by Australian ram breeders and it is used for genetic evaluation purposes. For visual traits, Sheep Genetics currently includes measurements at two ages, early (at marking or weaning) and late (the first yearling, hogget or adult record). Data were extracted for early and late breech cover (ebcov and lbcov), early and late breech wrinkle (ebwr and lbwr), early and late body wrinkle (ebdwr and lbdwr), late wool character (lwchar), late wool colour (lcol), late dag score (ldag), late fleece rot (lflrot) and yearling and hogget weight (ywt and hwt), greasy fleece weight (yfgw and hgfw), fibre diameter (yfd and hfd), staple strength (yss and hss), staple length (ysl and hsl) and worm egg count (ywec and hwec). A summary of the data is presented in Table 1. Pedigrees were compiled using all available ancestral information. In 2008 there were approximately 950 merino flocks in Australia selling merino rams. The data for this paper originated from 156 merino flocks that were members of Sheep Genetics over 16 years (1994–2009). The proportion of data that originated from industry flocks compared with research and sire evaluation sites varied across traits. On average across all traits 26% of the records originated from industry ram breeding flocks; however, this ranged from 2% for lwchar up to 66% for ldag.
Statistical analyses
Parameters were estimated by fitting an animal model using ASReml (Gilmour et al. 2006). The fixed effects of age at measurement and age of dam were fitted as covariates for all breech strike indicator traits. Age of dam was fitted using both linear and quadratic components. Birth and rearing type were fitted as non-interacting fixed effects using a scale of 1–4. Contemporary group was defined as flock, year of birth, sex, date of measurement and management group. The fixed effects fitted for production traits were based on the routine analyses conducted by Sheep Genetics.
A series of univariate analyses were conducted to identify the most appropriate model for each trait. Direct additive genetic (a), maternal additive genetic (m) and maternal environmental (p) effects were considered by including the appropriate random effects in the four different models used to analyse these data:


where y is a vector of observations for the trait of interest; b, a, m, and p are vectors of fixed effects, direct genetic effects, maternal genetic effects and permanent environment-due-to-dam effects, respectively. The incidence matrices X, ZA and ZM relate the respective effects to y and e is a vector of random residual effects. The variance and covariance structures for the random effects in the analyses were: var(a) = Aσa2, var(m) = Aσm2, var(p) = Im σp2, var(e) = Iσe2 and cov(p, e) = 0 where A, I, Im, σa2, σm2, σp2 and σe2 are the numerator relationship matrix, identity matrix, identity matrix for dams, direct additive genetic variance, maternal additive genetic variance, maternal environmental variance and residual error variance, respectively. The covariance between direct and maternal genetic effects was assumed to be zero as the data structure did not contain sufficient maternal records across time to the accurately estimate this covariance. These models were fitted to all traits using the ASReml program. All models were compared using likelihood ratio tests and results from the model with the most significant log-likelihood are reported.
Bivariate analyses were conducted to estimate genetic correlations between indicator traits and production traits. The indicator traits were modelled using the best model identified in the univariate analyses. The production traits used standard Sheep Genetics models as defined by Brown et al. (2007). Each bivariate analysis included only animals for which both traits were recorded. To examine the differences in the genetic correlations at both the within-flock level and those across flocks, a series of bivariate analyses were completed using slightly different models and data selection strategies: (1) analysis of the complete dataset using standard models without genetic groups, (2) analysis of the complete dataset using genetic groups defined by flock, and (3) analysis of data for the progeny of home-bred sires alone using standard models.
Selection response predictions
The genetic parameters used for the Sheep Genetics F10SS index (Swain et al. 2009) (moderate emphasis on increasing fleece weight and reducing fibre diameter while increasing staple strength) were expanded to include early breech wrinkle using a desired gains approach. Ideally, flystrike would be included in the index as a breeding objective trait in its own right, but because its economic value is unknown, prediction of the reduction in early breech wrinkle through desired gains indexes is a useful alternative.
To determine desired gains ‘economic values’ for early breech wrinkle, selection indexes were calculated using R statistical software (R Development Core Team 2009), assuming the following traits: ycfw (yearling clean fleece weight), yfd, ydcv (yearling CV of fibre diameter), ywt and yss. Information from relatives included sire and dam estimated breeding values for each trait and records for 39 half-sibs. Gains per standard deviation of selection index were calculated and numerical optimisation was used to determine a desired gains economic value for breech wrinkle where the economic gain in the trait (economic value × trait gain) was a defined percentage of the overall gain (25, 50 or 66%).
The phenotypic and genetic parameters used for index calculations were obtained from the covariance matrices used for Sheep Genetics’ Merino genetic evaluations and were augmented with the parameters for early breech wrinkle presented in this paper. Correlations between early breech wrinkle and adult traits were assumed to be the same as correlations between early breech wrinkle and yearling traits. A second set of parameters that differed from those estimated using the Sheep Genetics data was derived from unpublished studies from several research flocks. This parameter set was developed to be more representative of a within-flock selection scenario and only differed for the relationships between indicator traits and the production traits. Selection responses were estimated using both sets of parameters.
Final responses to selection over a 10-year period were calculated using SelAction selection index software (Rutten et al. 2002), assuming information on traits and relatives as described above, a flock of 500 ewes mated annually to 10 rams with an 80% weaning rate, five age classes for ewes and one for rams and that ewes and rams had their first progeny at 2 years of age.
Results and discussion
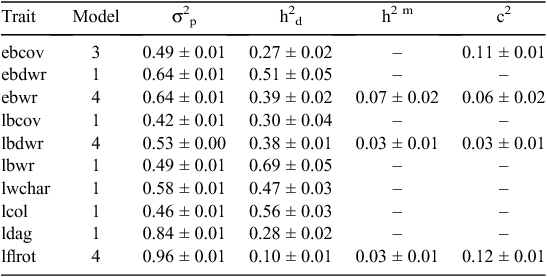
All breech strike indicator traits had moderate to high heritabilities (Table 2). Significant maternal genetic and permanent environment-due-to-dam effects were observed for ebwr, lbdwr and fleece rot, whereas only maternal permanent environment effects were significant for ebcov. The large genetic variation in these flystrike indicator traits indicates that genetic progress can be achieved.
|
Phenotypic variance and direct heritabilities were similar for the models and datasets investigated (Table 3). On average, heritability was 0.03 units lower (range, –0.08 to 0.01 units) when genetic groups were fitted. Whereas the phenotypic variances were generally similar, the direct heritabilities observed for the production traits were generally 0.20 units greater than those used for routine Sheep Genetics analyses. This is probably because much of the data used in this study originates from research and central progeny testing flocks, which have a more diverse sire usage that cannot be completely accounted for in the model and thus results in an inflated genetic variance in these flocks. This is supported by the lower heritabilities mostly observed for the production traits when only home-bred progeny were analysed (Table 3).
Correlations between flystrike indicator traits and weight traits (Table 4) for the complete dataset ranged from moderately unfavourable (e.g. 0.40 for hwt and lwchar) to moderately favourable (e.g. –0.54 for ywt and lbcov). Correlations between flystrike indicator traits and worm egg count traits (Table 4) also ranged from moderately unfavourable (e.g. 0.54 for ywec and lbwr) to slightly favourable (e.g. –0.38 for ywec and lbcov).
Correlations between flystrike indicator and greasy fleece weight traits (Table 5) for the complete dataset ranged from moderately unfavourable (e.g. 0.44 for hgfw and lbwr) to moderately favourable (e.g. –0.50 for ygfw and lbcov). Correlations between flystrike indicator traits and fibre diameter traits (Table 5) also ranged from moderately unfavourable (e.g. –0.44 for yfd and ebdwr) to moderately favourable (e.g. 0.42 for hfd and lwchar).
Staple strength correlations are presented in Table 5; ebdwr was favourably correlated with hss (–0.44), and lbcov was unfavourably correlated with hss (0.37). Staple length correlations were generally more favourable (Table 5); ebdwr was favourably correlated with ysl (–0.58) and lwchar was unfavourably correlated with ysl (0.21).
The results also indicate that dag is less strongly associated with production traits than with breech cover and wrinkle. These unfavourable correlations indicate that selection for reduced flystrike using these indirect selection criteria should be applied with caution and appropriate selection indexes should be used to improve production traits simultaneously with flystrike resistance.
Subsetting and modelling of data to separate within-flock from across-flock genetic effects generally resulted in slightly smaller within-flock relationships (Tables 4, 5), but the differences were not conclusive. Tables 4 and 5 demonstrate strong relationships between estimates from different models and between estimates for yearlings and hoggets. The correlation between estimates across all traits for the standard and genetic group models was 0.97 for both yearling and hogget ages. The correlations between estimates across ages were 0.62 and 0.63 for the standard and genetic group models, respectively. The similarity of the genetic correlations between datasets and models also suggests that the data structure currently used by Sheep Genetics is adequate for distinguishing flock effects from additive genetic effects.
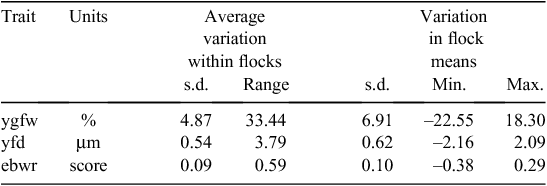
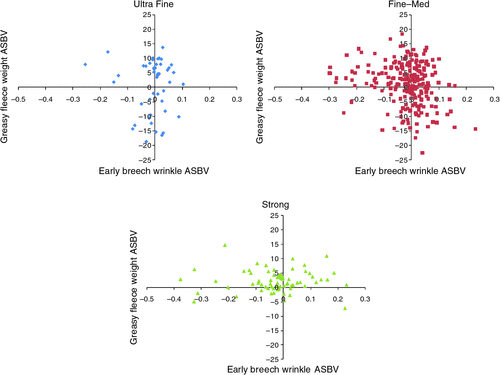
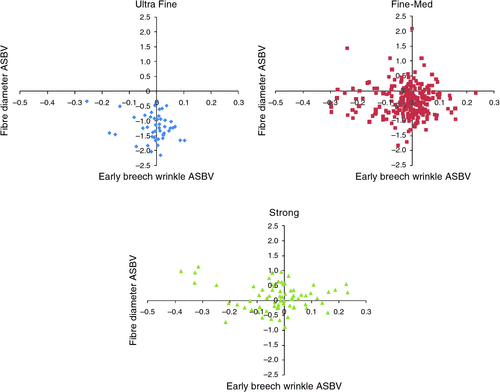
Table 6 shows the variation in ASBV within and across flocks. There is at least as much variation between flocks as there is within flocks, which affords breeders greater opportunity to select sires for these traits and to make genetic progress. Plots of flock mean ASBV for fleece weight (Fig. 1) and fibre diameter (Fig. 2) against breech wrinkle show that it is possible for breeders with rams with above average breech wrinkle to identify flocks and rams of a similar wool type but with significantly lower breech wrinkle.
|
|
|
The large across-flock variation indicates that sire selection strategies across the population will have a significant effect on progress in selecting for the flystrike resistance indicator traits and the achievable response in production traits.
Index selection
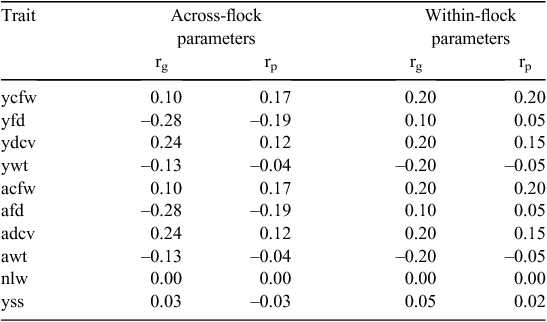
Selection response was estimated using two parameter sets (Table 7): (1) the estimates from this study and (2) a set of within-flock parameters similar to those reported by Richards and Atkins (2010). The largest difference between these parameters was the correlation between fibre diameter and breech wrinkle. In the industry datasets, which involve more across-flock usage of sires, this correlation is consistently negative, whereas estimates from closed research flocks indicate a small positive association.
|
Responses to 10 years of within-flock selection using the F10SS index inclusive or exclusive of breech wrinkle score are shown in Table 8. The standard index, which does not include breech wrinkle, resulted in an increase in wrinkle score of 0.7 units for the parameters estimated in this study and an increase in wrinkle score of 0.1 units for the research flock estimates. With the across-flock parameters, the addition of breech wrinkle to the index resulted in wrinkle score reductions of 0.4, 0.7 and 0.9 units when 25, 50 and 66%, respectively, of the emphasis was placed on wrinkle. With the within-flock scenario, the addition of breech wrinkle to the index resulted in wrinkle score reductions of 0.7, 0.9 and 1.1 units when 25, 50 and 66%, respectively, of the emphasis was placed on wrinkle. The unfavourable correlations between wrinkle and fleece weight and fibre diameter reduced responses in wool traits. In the across-flock scenario, the 25, 50 and 66% indexes resulted in 11, 24 and 34% less response in ycfw, respectively, and in 31, 56 and 69% less response in yfd. However, in the within-flock scenario, the reductions were much greater for ycfw (42, 72 and 90%, respectively), and less for yfd (0, 13 and 19%, respectively). There was some compensation in the form of an increase in the response in bodyweight, which is favourably correlated with breech wrinkle. However, these results show that it is a difficult and long-term proposition to reduce breech wrinkle by within-flock selection alone and that any reduction in breech wrinkle will be at the expense of progress in production traits. The use of both across- and within-flock selection for breech wrinkle and productivity is predicted to lead to considerably faster genetic gains than reliance of within-flock selection only. This highlights the need for ram breeders to utilise across-flock variation in breech wrinkle where possible and to include breech wrinkle and other flystrike indicator traits in their objectives.
Genetic trends from industry
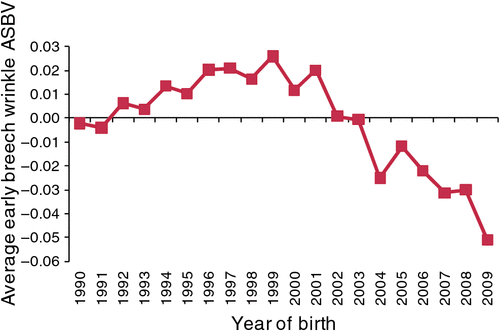
Sheep Genetics routinely publishes ASBV for breech and body wrinkle. The genetic trend for early breech wrinkle (Fig. 3) shows a very slight increase during the 1990s, which is consistent with the predictions of responses for the F10SS index shown in Table 6. From 1999 onwards, there has been a small reduction in breech wrinkle score of almost 0.1 units, which coincides with a period in which ram breeders became more aware of the need to breed sheep that do not have to be mulesed. Approximately half of the early breech wrinkle data originates from research and central progeny test flocks where there is little direct selection for breech wrinkle. Within the ram breeding flocks in Sheep Genetics there are some individual flocks that show quite rapid trends for breech wrinkle.
|
Conclusion
Susceptibility to breech flystrike in Australian Merino populations can be reduced by selection for several indicator traits. However, selection against breech wrinkle score alone may have a detrimental effect on other traits. Selection for reduced breech wrinkle score is best applied using an index selection approach to maximise simultaneous improvement in production traits. Selection responses and correlated effects on production traits will differ according to the sire selection strategy used. The use of both across- and within-flock selection for breech wrinkle and productivity is predicted to lead to considerably faster genetic gains than reliance of within-flock selection only. Sheep Genetics released early breech wrinkle ASBV in September 2009 to assist merino breeders make faster progress towards reducing breech wrinkle by using across flock selection.
Acknowledgements
Sheep Genetics is funded by Meat & Livestock Australia and Australian Wool Innovation. The authors acknowledge the contributions of the Sheep CRC Information Nucleus, the Australia Merino Sire Evaluation Association and industry-funded research flocks.
References
Atkins KD, McGuirk BJ (1976) Genetic improvements of fertility and fly resistance. In ‘Sheep breeding’. (Eds GJ Tomes, DE Robertson, RJ Lightfoot) pp. 271–275. (WA Institute of Technology: Muresk)Brown DJ, Huisman AE, Swan AA, Graser H-U, Woolaston RR, Ball AJ, Atkins KD, Banks RB (2007) Genetic evaluation for the Australian sheep industry. In ‘Proceedings of the 18th Conference of the Association for the Advancement of Animal Breeding and Genetics’. (Eds K Donoghue, B Pattie, B Restall) pp. 187–194. (Association for the Advancement of Animal Breeding and Genetics: Armidale)
Gilmour AR, Gogel BJ, Cullis BR, Thompson R (2006) ‘ASReml user guide. Release 2.0.’ (VSN International Ltd: Hemel Hempstead, UK)
Greeff J, Karlsson L (2009) Opportunities to breed for resistance to breech strike in Merino sheep in a Mediterranean environment. In ‘Proceedings of the 18th Conference of the Association for the Advancement of Animal Breeding and Genetics’. (Eds A Safari, B Pattie, B Restall) pp. 272–278. (Association for the Advancement of Animal Breeding and Genetics: Roseworthy)
James PJ (2006) Genetic alternatives to mulesing and tail docking in sheep: a review. Australian Journal of Experimental Agriculture 46, 1–18.
| Genetic alternatives to mulesing and tail docking in sheep: a review.Crossref | GoogleScholarGoogle Scholar |
Mortimer SI, Atkins KD (1989) Genetic evaluation of production traits between and within flocks of Merino sheep. I. Hogget fleece weights, body weight and wool quality. Australian Journal of Agricultural Research 40, 433–443.
| Genetic evaluation of production traits between and within flocks of Merino sheep. I. Hogget fleece weights, body weight and wool quality.Crossref | GoogleScholarGoogle Scholar |
Mortimer SI, Atkins KD (1993) Genetic evaluation of production traits between and within flocks of Merino sheep. I. Component traits of the hogget fleece. Australian Journal of Agricultural Research 44, 1523–1539.
| Genetic evaluation of production traits between and within flocks of Merino sheep. I. Component traits of the hogget fleece.Crossref | GoogleScholarGoogle Scholar |
R Development Core Team (2009) ‘R: a language and environment for statistical computing.’ (R Foundation for Statistical Computing: Vienna). Available at http://www.R-project.org [Verified 15 June 2010]
Richards JS, Atkins KD (2010) Will genetics offer a permanent solution to breech strike? Animal Production Science 50, 1053–1059.
| Will genetics offer a permanent solution to breech strike?Crossref | GoogleScholarGoogle Scholar |
Rutten MJM, Bijma P, Woolliams JA, van Arendonk JAM (2002) SelAction: software to predict selection response and rate of inbreeding in livestock breeding programs. The Journal of Heredity 93, 456–458.
| SelAction: software to predict selection response and rate of inbreeding in livestock breeding programs.Crossref | GoogleScholarGoogle Scholar | 1:STN:280:DC%2BD3s7ivVylsw%3D%3D&md5=a2c4df4b9ee35f98e31fb91ab5d4650dCAS | 12642649PubMed |
Sackett D, Holmes P, Abbott K, Jephcott S, Barber M (2006) Assessing the economic cost of endemic disease on the profitability of Australian beef cattle and sheep producers. Final report of project AHW–08, 7. Meat & Livestock Australia, Sydney.
Smith J, Brewer H, Dyall T (2009) Heritability and phenotypic correlations for breech strike and breech strike resistance indicators in Merinos. In ‘Proceedings of the 18th Conference of the Association for the Advancement of Animal Breeding and Genetics’. (Eds A Safari, B Pattie, B Restall) pp. 334–337. (Association for the Advancement of Animal Breeding and Genetics: Roseworthy)
Swain B, Swan A, Casey A, Ramsay A (2009) ‘Merino Superior Sires No. 15.’ (Australian Wool Innovation: Sydney)
* Animal Genetics and Breeding Unit is a joint venture of Industry and Investment NSW and the University of New England.


