

Priority areas for conserving greater gliders in Queensland, Australia
Patrick Norman A * and Brendan Mackey A
A Griffith University, 58 Parklands Drive, Southport, Qld, Australia.
Abstract
The southern and central greater glider (Petauroides volans) is a nationally listed endangered species in Australia. The species depends upon mature native forest providing critical habitat resources including tree hollows.
This study aimed to map and evaluate the tenure of patches of potential high-quality (core) habitat and corridors for the southern greater glider in Queensland.
Within greater glider habitat, we mapped 10 ranked classes of relative forest maturity using a model comprising remotely sensed metrics of canopy height, above-ground living biomass and canopy cover at a 30 m resolution. We also modelled the optimum movement corridors within and between habitat patches.
Results showed that 35% (4.943 million ha) of habitat was found in the more mature classes (Classes 7–9), which represent a proxy for associated limiting habitat resources, especially tree hollows. Mean patch size above a 1.6 ha threshold was found to be 122 ha and most patches (71%) were ≤10 ha, with 14 patches ≥100 000 ha. Freehold and leasehold lands hold 63.4% of the more mature habitat, multiple-use public forest 21.4% and nature conservation areas 12.8%. About half of the potential habitat is located on formally recognised Indigenous lands that represent different categories of Aboriginal ownership, management and other special rights.
The protection of mature forest patches and movement corridors is necessary for the conservation of the greater glider, a nationally listed threatened species.
Conservation interventions are needed, using a whole-of-landscape approach to protect core habitat and corridors from inappropriate land use.
Keywords: arboreal mammals, connectivity, conservation, greater glider, mature forest habitat, private forest, public forest, threatened species, tree hollows.
Introduction
The presence of old and mature forests is critical for the survival of many threatened species in Australia due to the dependence on tree hollows for shelter and nesting (Gibbons and Lindenmayer 1997). Australia’s forests are dominated by species from the Eucalyptus genus, which only start to form hollows suitable for hollow-dependent species after lengthy periods of time. For example, hollows for small animals such as the brush-tailed phascogale (Phascogale tapoatafa) and the eastern pygmy possum (Cercartetus nanus) start to occur after around 100 years, with medium size hollows suitable for animals such as parrots forming at around 200 years, and the wider and deeper hollows occupied by larger animals taking even longer (Mackowski 1984; Menkhorst 1984; Scotts 1991).
The greater glider (southern and central) (Petauroides volans) is a hollow-dependent arboreal marsupial species and is the largest gliding possum with a head and body length of 350–450 mm and a long furry tail measuring 450–600 mm. The species is listed as endangered in Queensland and as of July 2022, endangered federally under the Australian Environmental Protection and Biodiversity Conservation Act 1999 (Department of Climate Change, Energy, the Environment and Water 2022). The main threats to the greater glider are frequent and intense bushfires, inappropriate prescribed burning, climate change (increasing temperatures and changes to rainfall patterns), habitat clearing and fragmentation, and timber harvesting (Threatened Species Scientific Committee 2016). The greater glider is also listed under state or territory legislation as endangered in New South Wales and vulnerable in Victoria, the Australian Capital Territory and Queensland (Australian Government 2016). Our focus in this paper is on the greater glider populations in Queensland as the State government, rather than the Commonwealth, is primarily responsible for environmental and land planning and management that enable conservation measures for threatened species (Council of Australian Governments 1997).
A major review of greater glider habitat in Queensland (Qld) (Eyre et al. 2022) identified the following salient features: (a) of the 2859 described regional ecosystems in Queensland, 254 were confirmed as greater glider habitat and 124 regional ecosystems were identified as potential habitat; (b) six tree species were identified as dominant or co-dominant species to the majority of greater glider habitat (Corymbia citriodora, Eucalyptus moluccana, E. tereticornis, E. crebra, C. intermedia and E. portuensis); and (c) trees >30 cm diameter at breast height (DBH) are preferentially selected for foraging and >50 cm DBH for denning and sheltering.
Deforestation remains at very high levels in Queensland: in 2018–19, 680 688 ha of forest and woodland were cleared (82% full removal, 18% partially cleared) with 27 165 ha occurring in south-east Queensland. Further clearing also occurred in the Brigalow Belt bioregion as 266 597 ha was fully cleared, and 24 356 ha partially cleared (Queensland Government 2020b). Native forest harvesting is also a threatening process for the greater glider because it removes trees at a relatively young age, limiting the availability of tree hollows and the potential for hollow formation. In Queensland there are around 2 990 471 ha of ‘defined forest area’, which are state-owned native forests available for commercial timber production on a range of land tenures, where the state has retained ownership of the forest resource (Queensland Government 2023a).
In southern Queensland, the species appears to require at least 2–4 live den trees for every 2 ha of suitable forest habitat (Eyre 2002). Commercial species of note that also provide important habitat resources (food and/or dens) include Eucalyptus teriticornis, E. siderophloia, E. creba and E. acmenoides (Queensland Government 2020b). Selective logging removes habitat, which in turn alters the structure of a forest to create an even-aged stand dominated by younger stems (Queensland Government 1998; Eyre 2005). Although home ranges are 1 to 3 ha, the smallest forested patch greater gliders have been detected in is 1.6 ha (Pope et al. 2004). The proportion of cleared habitat within the local area (1 km spatial extent) is a key factor for greater glider densities, with densities predicted to decline to less than one glider per 3 ha with >15% clearing within the 1 km extent, or >47 ha cleared per 314 ha (Eyre 2006).
Connectivity between habitat patches is also an important consideration for the conservation management of the greater glider as it facilitates the movement between populations (Hanski and Gilpin 1991). Among other things, local populations can be extirpated (i.e. locally extinct) due to the impacts from catastrophic bushfires, disease or other stochastic processes, and habitat connectivity provides the means for re-colonisation from neighbouring populated habitat locations (Andrew et al. 2014; Campbell-Jones et al. 2022). Habitat connectivity can maintain meta-population connectivity, thereby reducing inbreeding and genetic drift associated with small, isolated populations. This in turn increases population viability, and resilience to future environmental conditions (Zilko et al. 2021). Tenure is an important factor to consider when developing conservation management strategies and options aimed at mitigating threatening processes for threatened species, such as the greater glider. In Queensland, the tenure classes comprise multiple-use public forests, public and private nature conservation areas, leasehold land, freehold land, and formally recognised Indigenous land that represent different categories of Aboriginal ownership, management, co-management and other special rights (Jacobsen et al. 2020). Taking into account the various tenure classes and their implications can help ensure that feasible conservation management strategies are prescribed that are tailored to the specific needs of threatened species in Queensland, such as the greater glider.
The aims of this paper are to: (1) identify and map patches of potential high-quality (core) habitat for the southern greater glider in Queensland using remote sensing to identify mature forests, as a proxy for hollows which are a limiting resource for the species; (2) identify and map critical potential movement corridors for between-patch connectivity; and (3) examine the distribution of potential high-quality habitat and corridors in relation to land tenure (protected areas, state forests, leasehold, freehold, formally recognised Indigenous land). We conclude with some recommendations regarding conservation actions that could benefit the greater glider.
Methods
Study area
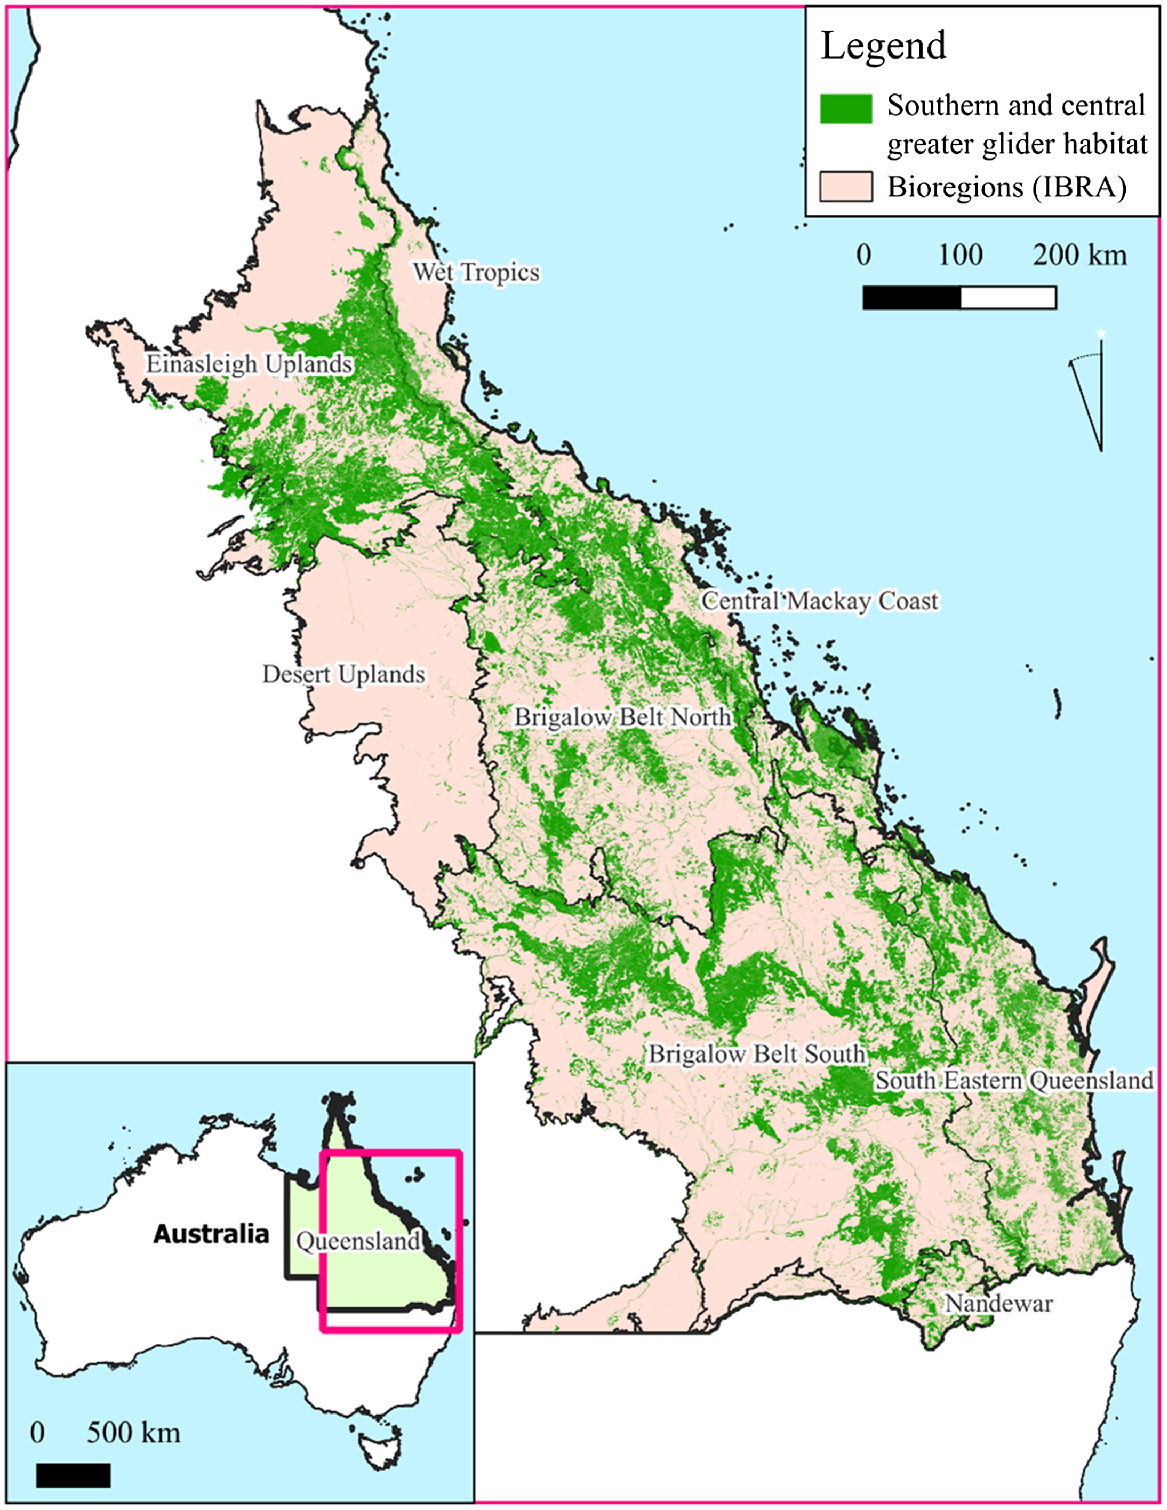
Our study was focused on the native forest in the Australian state of Queensland (Qld) within the known range of the southern and central greater glider, which largely encompasses the South Eastern Queensland, Brigalow Belt (North and South), Wet Tropics, Central Mackay Coast, New England Tablelands and Einasleigh Uplands Bioregions (Eyre et al. 2022) (Fig. 1).
A map showing the identified known and potential greater glider habitat areas from Eyre et al. (2022), based on detailed vegetation mapping of regional forest ecosystem types, field survey records and expert knowledge of species habitat resource requirements and IBRA bioregions (Interim Biogeographic Regionalisation for Australia), where the species occurs. An inset map of the location of Queensland in relation to Australia is also visible in the bottom left of the image.
Our analyses were restricted to within the known or potential greater glider habitat areas as mapped by Eyre et al. (2022) for the Queensland Government where: (i) ‘habitat’ was defined as regional ecosystems with confirmed greater glider records and which contains habitat attributes (but not necessarily all attributes); and (ii) ‘potential habitat’ was defined as regional ecosystems that do not have confirmed greater glider records but are identified by experts as potential greater glider habitat including the presence of six tree species known to be the dominant or co-dominant species. The methodology for classifying and mapping regional ecosystems, which provides the spatial basis for the greater glider habitat map of Eyre et al. (2022), is described in Neldner et al. (2019) and is based on three major attributes combined in a hierarchical manner (bioregion landscape patterns; geology, soils and landforms; and vegetation structure and floristics). An additional statistical species distribution model was also reported by Eyre et al. (2022) based on species location data and seven environmental variables (five climatic, broad vegetation group, land zone, topographic ruggedness). However, the known and potential habitat area dataset was applied here, given it included known locations, employed a rigorous expert elicitation process and used a fine scale vegetation floristic mapping.
Here we derive new spatial data based on satellite remote sensing to identify mature forests as a proxy for associated habitat resources, especially tree hollows, which are a limiting resource for the species. We use these data to identify the most mature forest cover within the current habitat mapping of Eyre et al. (2022) to better identify core habitat areas for the species.
Analytical workflow overview
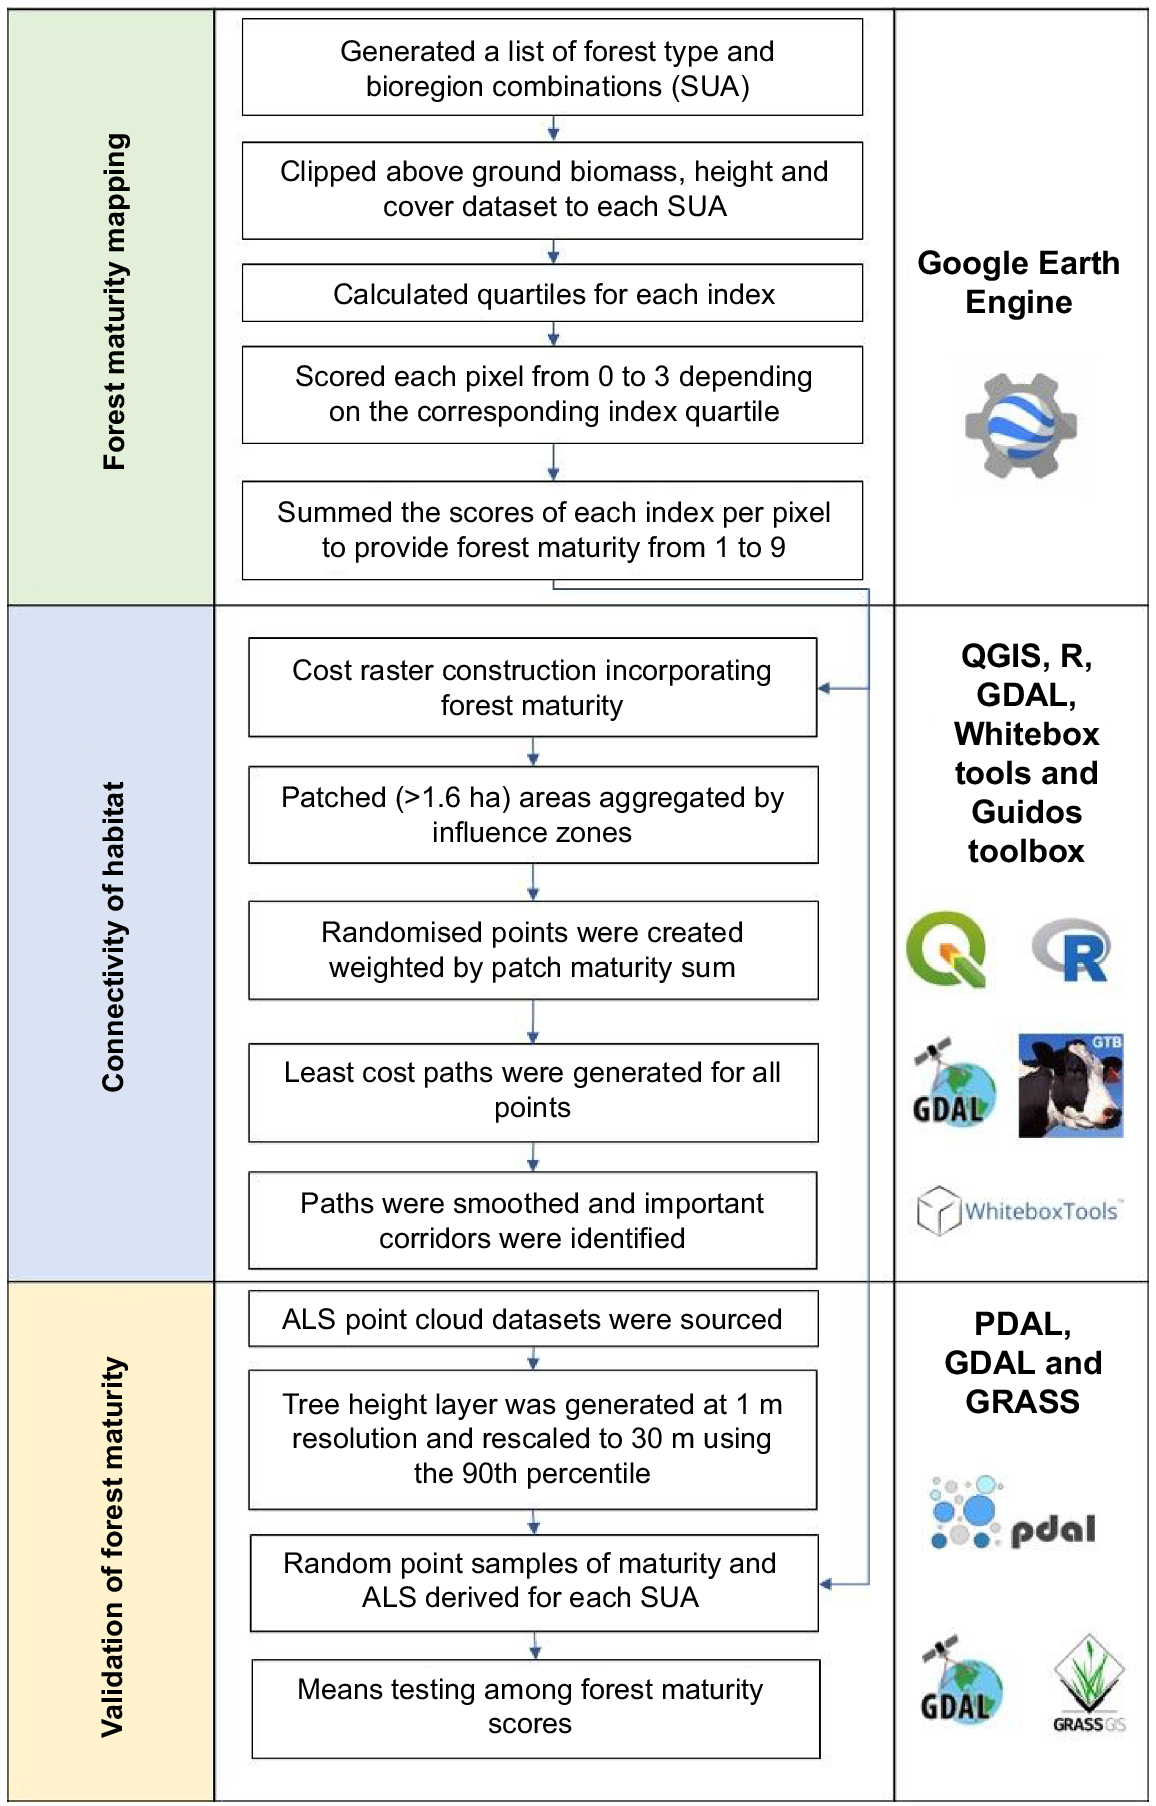
We mapped the relative level of forest maturity using a method developed by DellaSala et al. (2022). This method uses spatial metrics based on three variables: (1) forest canopy height (m); (2) forest canopy cover (%); and (3) above-ground living biomass (t ha−1). These spatial data sets were modelled from satellite-based sensors at a 30 m pixel resolution. The assumption is that, within a specific ecosystem type and its dominant canopy species, taller, denser forest areas with larger biomass stocks are relatively older than forests that are shorter, less dense, and have lower biomass levels, all else being equal. Older forests have a higher density of tree hollows, which are the critical limiting habitat resource for greater gliders. Given that greater gliders are known to disperse only through native forest cover (Eyre 2006), connectivity analysis was undertaken to map potential movement corridors between the identified habitat patches. The distribution of the relative maturity of habitat patches, and potential movement corridors within and between them, were then analysed according to tenure. Finally, we used an independent dataset of airborne laser scanning (ALS)-derived height data to validate the modelled satellite-based height component of the forest maturity model. The main steps in our workflow are shown in Fig. 2 and discussed below.
Forest maturity modelling
Our approach follows that of DellaSala et al. (2022) but was modified for Australian conditions and data. Analyses were undertaken using the cloud computing platform Google Earth Engine (Gorelick et al. 2017). The study area was first stratified by major forest types (Australian Government 2019) and bioregions (Hutchinson et al. 2005), which gave 61 combinations, referred to as spatial units of analysis (SUA). For each SUA, values were assigned to each 30 m pixel for: (1) forest canopy height (Potapov et al. 2020); (2) above-ground living biomass (Santoro et al. 2018); and (3) forest canopy cover (Hansen et al. 2013). For each given SUA, quantiles for each of these three variables were calculated, providing a score of 0 to 3, and were summed to give a single maturity score of between 0 and 9. Each pixel was therefore assigned one of 10 relative maturity classes. Cells with the score of 0 were excluded from further analyses as these were likely to be non-forest or error due to temporal differences in input spatial datasets. We assumed that the higher the class, the older and more ecologically mature the forest was likely to be. It was found that the input above-ground living biomass layer (Santoro et al. 2018) contained small areas of erroneous banding from the Landsat 7 Scan Line Corrector (SLC), which were visible within some patches in the northern parts of the species range. Pixels were interpolated based on correct neighbouring values using a regularised spine in GRASS (Neteler et al. 2012).
Habitat connectivity analysis
An optimum connectivity pathway analysis was performed using a least cost paths approach (Sawyer et al 2011; Correa Ayram et al. 2016). An analytical workflow was coded to perform the connectivity assessment over the study area and utilised the following software and packages; R (R Core Team 2022), GDAL (GDAL/OGR Contributors 2022), Guidos Toolbox (Vogt and Riitters 2017) and finally Whitebox Tools (Lindsay 2014) to generate the least cost paths. First, a weighted cost raster was created to provide a resistance spatial layer across the entire state. Due to the large computing power required to perform the analysis, the cost raster was rescaled to a 100 m cell size. As greater gliders require arboreal habitats, including for dispersal, areas outside a 200 m buffer from forests were excluded from the analysis. The buffer size was chosen as it exceeds the maximum known gliding distance (100 m) and allowed for the potential occurrence of small, isolated trees outside of forested areas, not detected through remote sensing (McCarthy and Lindenmayer 1999). Landscape resistance was weighted according to level of forest maturity, species habitat and location with respect to urban and peri-urban areas. For least cost path analyses, within patch habitat suitability is an important factor to assess pathways (Wang et al. 2008; Sawyer et al. 2011).
Due to the species’ dependency on mature habitats, the forest maturity model was used as a weighted measure to score suitability within forested areas. To incorporate forest maturity into the resistance layer, the nine maturity classes were rescaled to between zero and one and inverted. Using a similar technique adapted from work conducted in southern Australia (Barrett and Love 2012), modelled habitat was given a score of 1, other forested ecosystems 2, semi-urban and cleared land 4 and un-treed urban areas 5. The inversed rescaled forest maturity score was added for all forested areas, resulting in the most relatively mature habitat having the lowest resistance score. Areas of non-native forestry were later excluded from further analysis as the species is known to avoid or only venture small distances (≤20 m) within these forests (McCarthy and Lindenmayer 1999; Cunningham et al. 2004).
Polygons of habitat greater than 1.6 ha, the smallest observed area of habitat for the species, were then aggregated into zones using the Influence Zones tool from Guido Toolbox (Pope et al. 2004; Vogt and Riitters 2017). The tool identifies groups of patches using euclidean distance and patch size to create an equidistant zone between patches (Vogt and Riitters 2017). In total, 28 influence zones were identified and were used to separate close proximity patches from those further away. A series of random points were created across and within each patch throughout the study area using R (R Core Team 2022) and GDAL (GDAL/OGR Contributors 2022). Random point allocation within forest patches was calculated from the corresponding patch score (i.e. sum of all forest maturity raster pixel scores), thus giving more weight to larger and more mature patches. Points within differing zones were then randomly assigned as either source or destination points. Using the least cost path tool from Whitebox tools (Lindsay 2014) within a Python coding environment, the least cost path from a random source point to the nearest destination point was calculated and assigned a score of one. Source and destination points were then inverted, and the process was repeated. The entire workflow was repeated 50 times to minimise bias associated with the random polygon and point allocation. In total, there were 4.73 million paths assessed during processing, which were summed into a single layer using Orfeo toolbox’s BandMathX function (Grizonnet et al. 2017).
The aggregation of connectivity pathways was then smoothed using the gaussian smoothing algorithm from Orfeo toolbox and rescaled to values between zero and one. Identified high importance corridors (>99.9th percentile) over 100 ha in area were separated to within and outside of habitat patches. High importance corridors showed areas with the greatest convergence of pathways between and within habitat patches, providing the location of the most important corridors for movement for the species between habitat patches and across the state.
Tenure assessments
The distribution was calculated of the relative forest maturity classes within greater glider habitat occurring on the major tenure classes of protected area, multiple-use forest, leasehold land, freehold land and other crown land (ABARES 2021). Also assessed were areas within formally recognised Indigenous land which includes ownership, management and other special rights (subject to native title determinations, Indigenous Land Use Agreements and legislated special cultural use provisions) spread across multiple tenures (Jacobsen et al. 2020). The area of mature habitat classes within individual nature conservation reserves and multiple-use public forest by bioregion were calculated along with the tenure of identified high importance corridors.
Validation
The canopy height component of forest maturity classes were compared to airborne laser scanning (ALS)-derived height data, which can produce sub-metre accuracy of tree height (Coops et al. 2021). The ALS point cloud data was retrieved from Geoscience Australia’s LiDAR (Light Detection and Ranging) repository (Australian Government 2022). As ALS heights have only relatively limited coverage within Queensland, we downloaded data that sampled 0.7% of the greater glider habitat but within all 61 spatial units of analysis.
Due to the storage size of the point cloud datasets, a Bash shell processing script was written to process data in smaller tiles and then later mosaiced to create larger spatial rasters. GDAL and PDAL (Butler et al. 2021) command line scripts were used during the processing stage. In total, ~360 GB of ALS point cloud data was processed. First, point cloud data was filtered to ground and non-ground returns. Digital surface and digital terrain models were then generated using the PDAL writers function using a window size of 20 m and an output resolution of 1 m. Once both models were created for each tile, tree height was calculated from the difference between the two layers. The tiles were merged into a single mosaic spatial raster layer and then rescaled. To replicate the methods used in the creation of the input tree height layer by Potapov et al. (2020), the 1 m tree height layer was rescaled to a 30 m pixel using the 90th percentile value with GRASS command line tools (Neteler et al. 2012). Points samples were taken from the resulting tree height layer across all areas assessed by both the validation and forest maturity datasets. In total 282 278-point samples were retrieved along with the modelled values from the corresponding SUA. A 30 m minimum distance separated each point to ensure cells were not sampled multiple times.
To test the difference among the heights across the nine maturity classes, a series of Kruskal–Wallis rank sum tests were conducted. For the 10 most sampled SUAs, differences were initially assessed using raincloud plots comparing tree heights for each random point against the allocated maturity class. Values were tested in R using Kruskal–Wallis test and multiple comparisons test to establish differences among individual maturity classes. Due to forest height being only one of the three input variables used in the maturity modelling, multiple comparison tests were conducted on classes three scores apart (e.g. Maturity Class 1 against Class 4).
Results
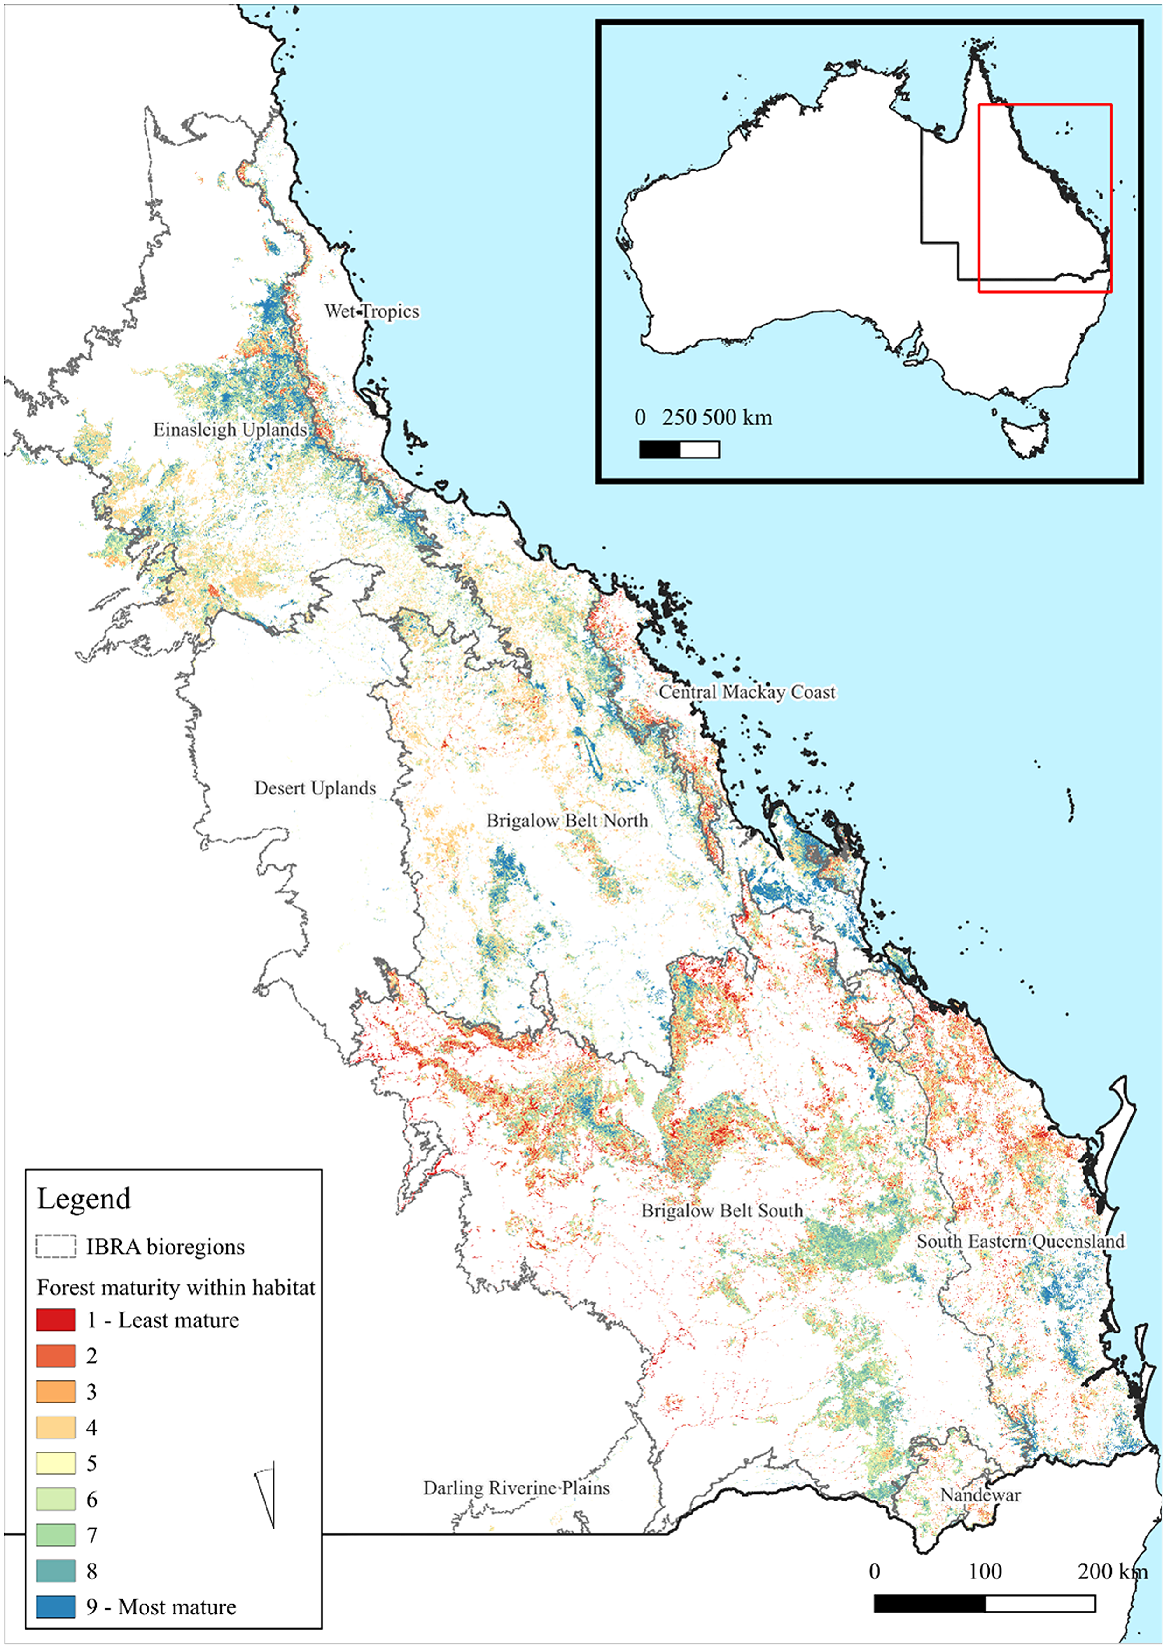
Throughout southern and central greater glider habitat established by Eyre et al. (2022), there were 14 249 748 hectares of forest within Maturity Class 1 to 9 (Fig. 3). Habitat condition (Table 1) was spread across the 10 relative maturity classes, with the largest extent being Class 4 (2 718 372 ha, 19.0%). In total, 35% (4 943 000 ha) was found in Classes 7–9 and 10.4% (1 478 339 ha) in the highest class. The dominant forest and woodland types within the species habitat were in Eucalypt Medium Woodland and Eucalypt Medium Open, with the two making up 91% of the total habitat area.
The maturity of all forest within identified greater glider habitats. Forest maturity is classified into 9 classes, ranging from 1 to 9, with the higher classes containing the greatest relative maturity score. IBRA bioregions within the species range are also shown (light grey) and labelled. An inset map shows the location of the study region within Australia in red with the state of Queensland also visible.
| Tenure | Maturity Class (ha) | Indigenous lands | Total area (ha) | |||||||||
|---|---|---|---|---|---|---|---|---|---|---|---|---|
| 1 | 2 | 3 | 4 | 5 | 6 | 7 | 8 | 9 | ||||
| Freehold | 422 (46.7%) | 346 (40.5%) | 384 (38.4%) | 682 (25.1%) | 509 (29.1%) | 562 (27.1%) | 485 (27.2%) | 436 (25.9%) | 414 (28.0%) | 1547 (22.4%) | 4239 (29.8%) | |
| Leasehold land | 305 (33.8%) | 302 (35.3%) | 343 (34.3%) | 1596 (58.7%) | 758 (43.3%) | 915 (44.1%) | 616 (34.6%) | 609 (36.2%) | 564 (38.2%) | 3503 (50.1%) | 6008 (42.2%) | |
| Multiple-use public forest | 84 (9.3%) | 106 (12.4%) | 144 (14.4%) | 226 (8.3%) | 295 (16.8%) | 379 (18.3%) | 472 (26.5%) | 408 (24.3%) | 176 (11.9%) | 1127 (16.3%) | 2290 (16.1%) | |
| Nature conservation reserve | 65 (7.2%) | 80 (9.4%) | 107 (10.7%) | 160 (5.9%) | 160 (9.1%) | 181 (8.7%) | 181 (10.1%) | 192 (11.4%) | 262 (17.7%) | 577 (8.4%) | 1388 (9.7%) | |
| Other Crown land | 26 (2.9%) | 21 (2.5%) | 22 (2.2%) | 54 (2.0%) | 30 (1.7%) | 38 (1.8%) | 30 (1.7%) | 37 (2.2%) | 63 (4.3%) | 148 (2.1%) | 321 (2.3%) | |
| Total area (ha) | 903 (100%) | 855 (100%) | 1000 (100%) | 2718 (100%) | 1752 (100%) | 2076 (100%) | 1784 (100%) | 1681 (100%) | 1478 (100%) | 6902 (100%) | 14 249 (100%) | |
Indigenous lands occur across multiple tenures and includes areas owned, managed and with special rights for First Nations peoples. Percentage values are related to the total area values within each column.
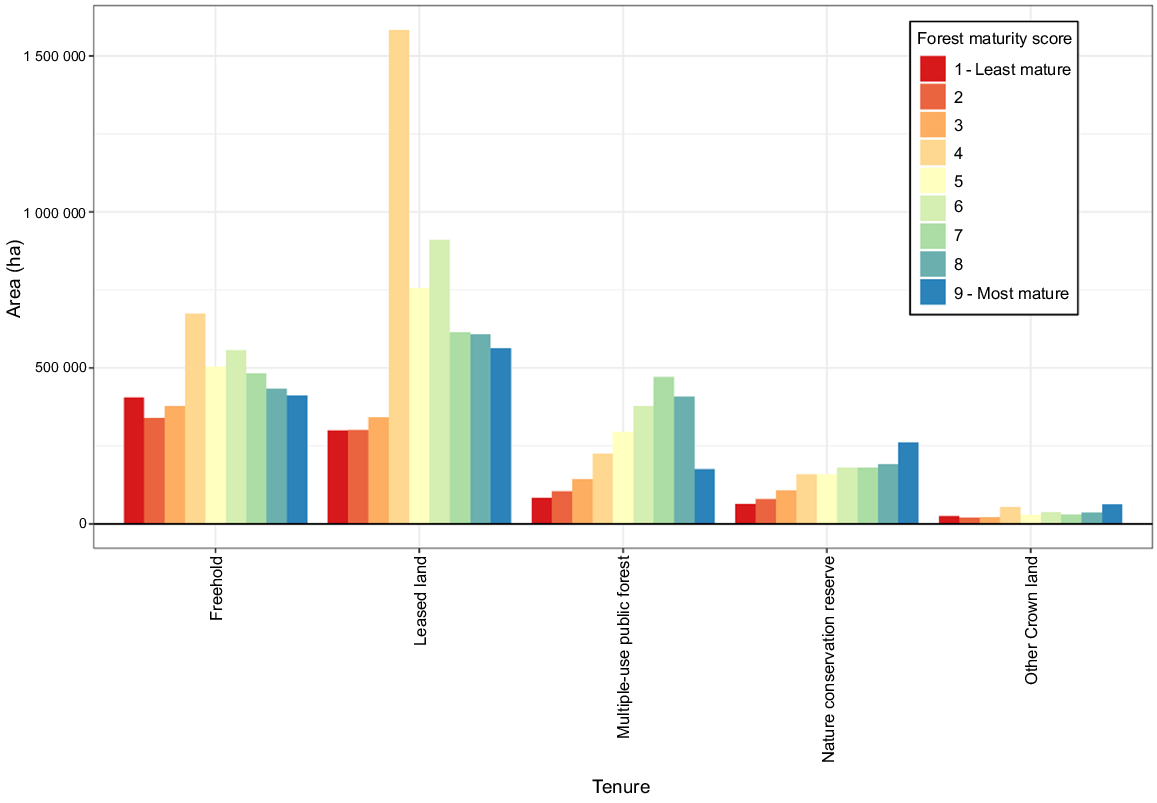
Habitat areas were unevenly distributed among tenures with 42.2% (6 008 431 ha) found on leasehold land, 29.8% (4 239 337 ha) found in freehold, and 16.1% (2 289 558 ha) on multiple-use public forest. Only 9.7% (1 388 172 ha) were located within nature conservation reserves meaning that over 90% of the species forested habitat remains unprotected within the state. Of the more mature classes (7 to 9), freehold and leasehold lands hold 63.4%, multiple-use public forest 21.4% and nature conservation areas 12.8%. Notably, within nature conservation reserves modelled Maturity Class 9 was the most dominant class, consisting of 18.8% of the forests within this tenure (Table 1).
The area of habitat was primarily confined to four bioregions (90.5% of the total habitat). Regions with the largest areas of mature habitat included the Brigalow Belt South (36.8%), the Brigalow Belt North (21.1%), Einasleigh Uplands (20.2%) and South Eastern Queensland (12.3%) (Supplementary Table S1). The same bioregions were also found to contain most of the habitat in nature conservation reserves, with 34.4%, 8.6%, 19.1% and 22.5%, respectively. For multiple-use public forest, however, it was found that the vast majority were located within the Brigalow Belt South bioregion (73.2%).
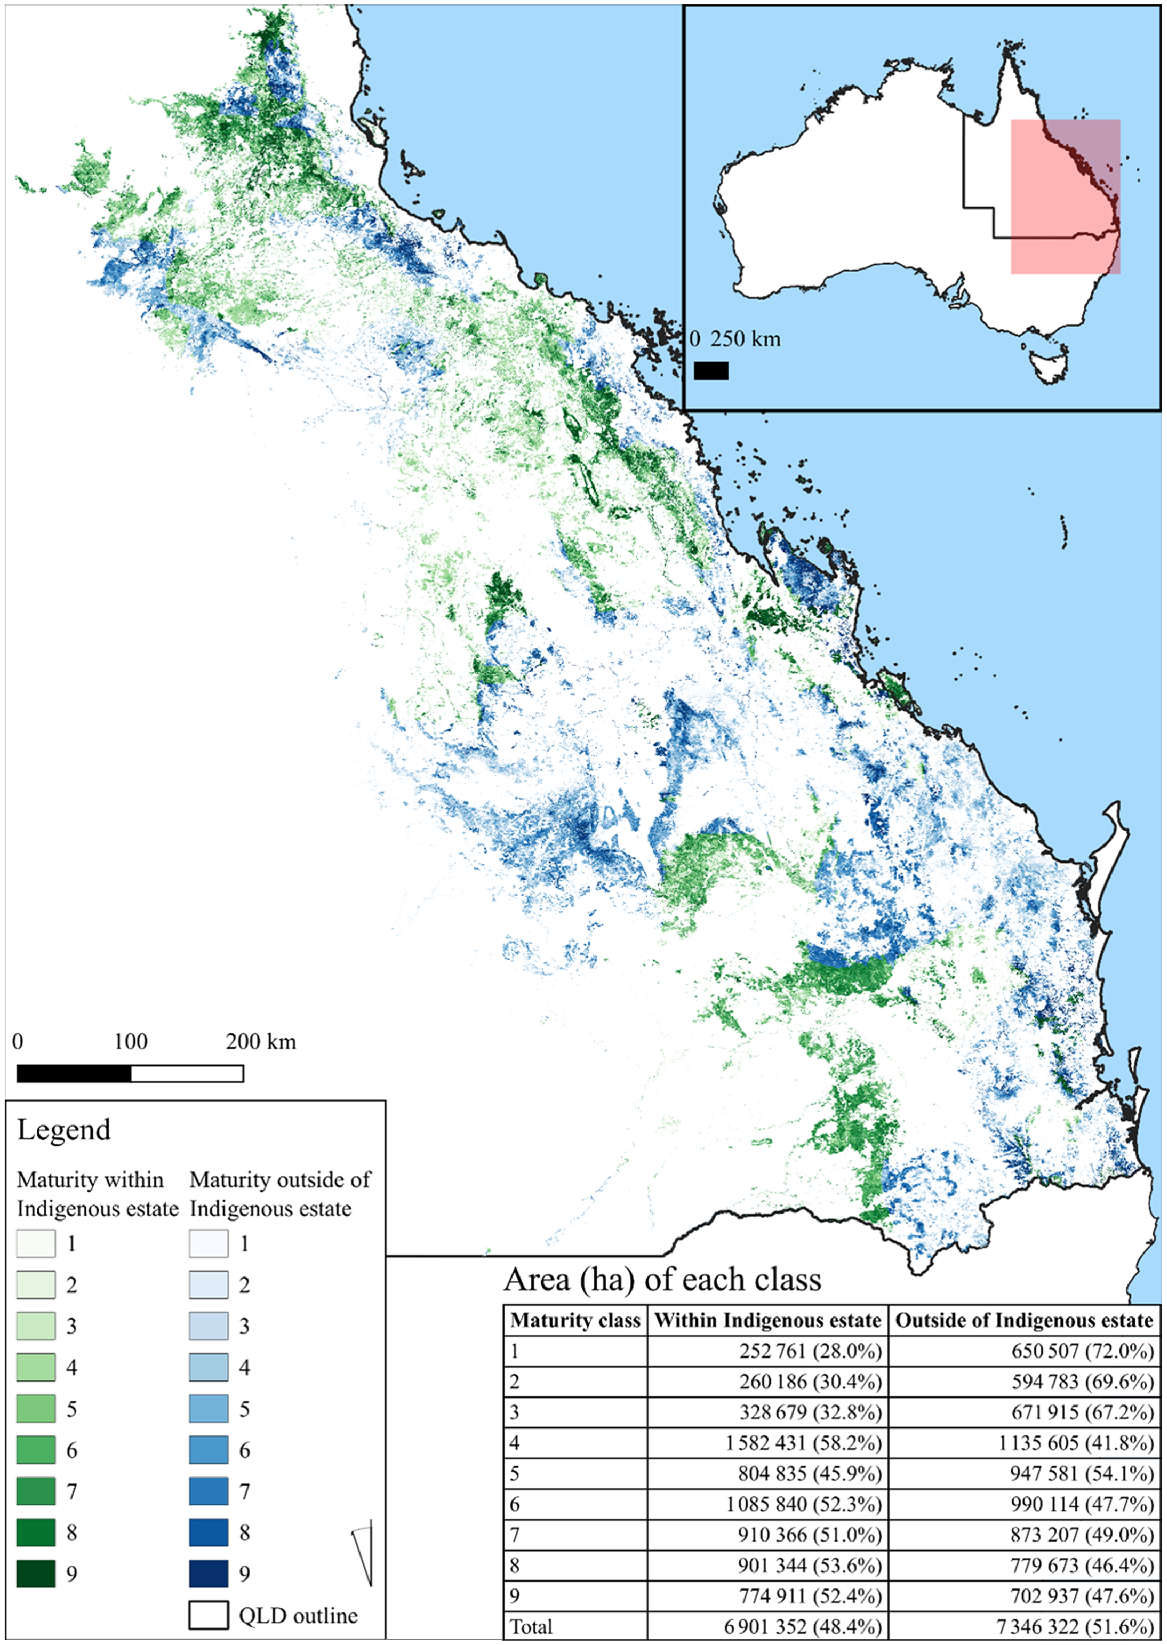
Large areas of habitat were found to be present within the Indigenous land and forest estate (Jacobsen et al. 2020) (Fig. 4). The area encompassing the most significant areas of habitat were those subject to native title determinations, registered Indigenous Land Use Agreements or legislated special cultural use provisions which covered 44.5% (6 902 600 ha) of habitat and 52.3% (2 586 621 ha) of maturity classes (7–9) (Fig. 4). Of the areas under agreements with First Nations peoples, located on 22.4% co-occurred on freehold land 50.7% on leasehold and 16.3% on multiple-use public forest.
Map of greater glider habitat maturity within Queensland, Australia. Forest maturity classes are coloured by whether the area is located within (green) or outside (blue) of the formally recognised Indigenous land and forest estate. The area (ha) of each class is included within the table in the bottom right, along with the percentage of each within classes (rows).
Habitat patches
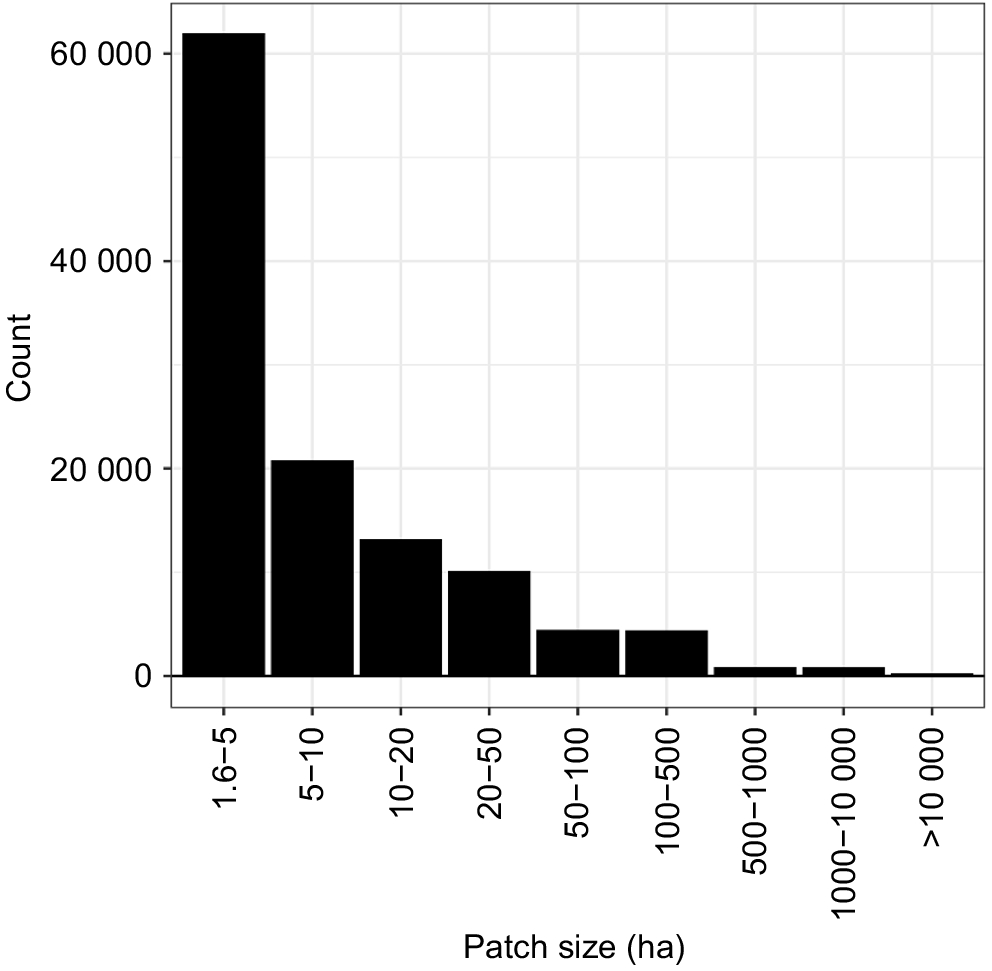
Across the greater glider range within the state, there were large numbers of geographically discrete forested habitat patches (N = 294 341) (Figs 5 and 6). There were 115 712 habitat patches over >1.6 ha, with a total area of 14 162 310 ha, accounting for 99.4% of the forest identified. The mean patch size above a 1.6 ha threshold was found to be 122 ha (s.d. = 8056 ha) with the largest patch being over 2.1 Mha. In total there were 14 patches over 10 000 ha in size. Most patches however were relatively small in area with 71.3% (N = 82 479) of patches being under 10 ha (Fig. 5).
The size distribution of habitat patches assessed. Note that the x-axis bins increase in size from left to right.
The area of each forest maturity class within patches of greater glider habitat over 1.6 ha by tenure. Leasehold land, Multiple-use public forest, Nature conservation reserve and Other Crown land are all owned by the crown.
Extensive areas of habitat patches were located within individual protected areas and state forests. The largest found was the 263 618 ha (184 356 ha of Classes 7–9) within Barakula State Forest located in the southern areas of the state. This single contiguous area comprised 17% of multiple-use public forests and 6.8% of habitat located on all public lands (nature conservation areas, multiple-use public forests and other crown lands). Other large areas of habitat within single estates included Carnarvon National Park (209 164 ha), Girringun National Park (140 847 ha) and Expedition National Park (101 479 ha).
Connectivity analysis results
From the optimum connectivity pathway analysis, a total of 88 high importance (99.9th percentile) corridors connecting habitats were identified (Fig. 7). Important corridors covered an area of 962 422 ha, with the largest within habitat corridor (36 612 ha) and largest inter patch corridor (5405 ha) both connecting habitat on the Einasleigh Uplands. Important corridors were found on all tenures: freehold lands (259 412 ha, 27.0%); leasehold lands (450 908 ha, 46.9%); multiple-use public forest (134 238 ha, 13.9%); nature conservation reserves (92 300 ha, 9.6%); and other crown lands (25 566 ha, 2.6%). Additionally, much of the area covered by important corridors occurred within the Indigenous land and forest estate (502 764 ha, 52.2%). The single most important corridor connecting two areas of habitat was found to be located connecting Blackdown Tableland National Park to Duaringa State Forest (Fig. 7b). The high connectivity score for the corridor was due to it connecting the extensive Southern Brigalow Belt habitats with those along the coastal fringe. It was also found that 39 052 (13.3%) patches of habit >1.6 ha had no viable forested corridors to another patch.

Validation
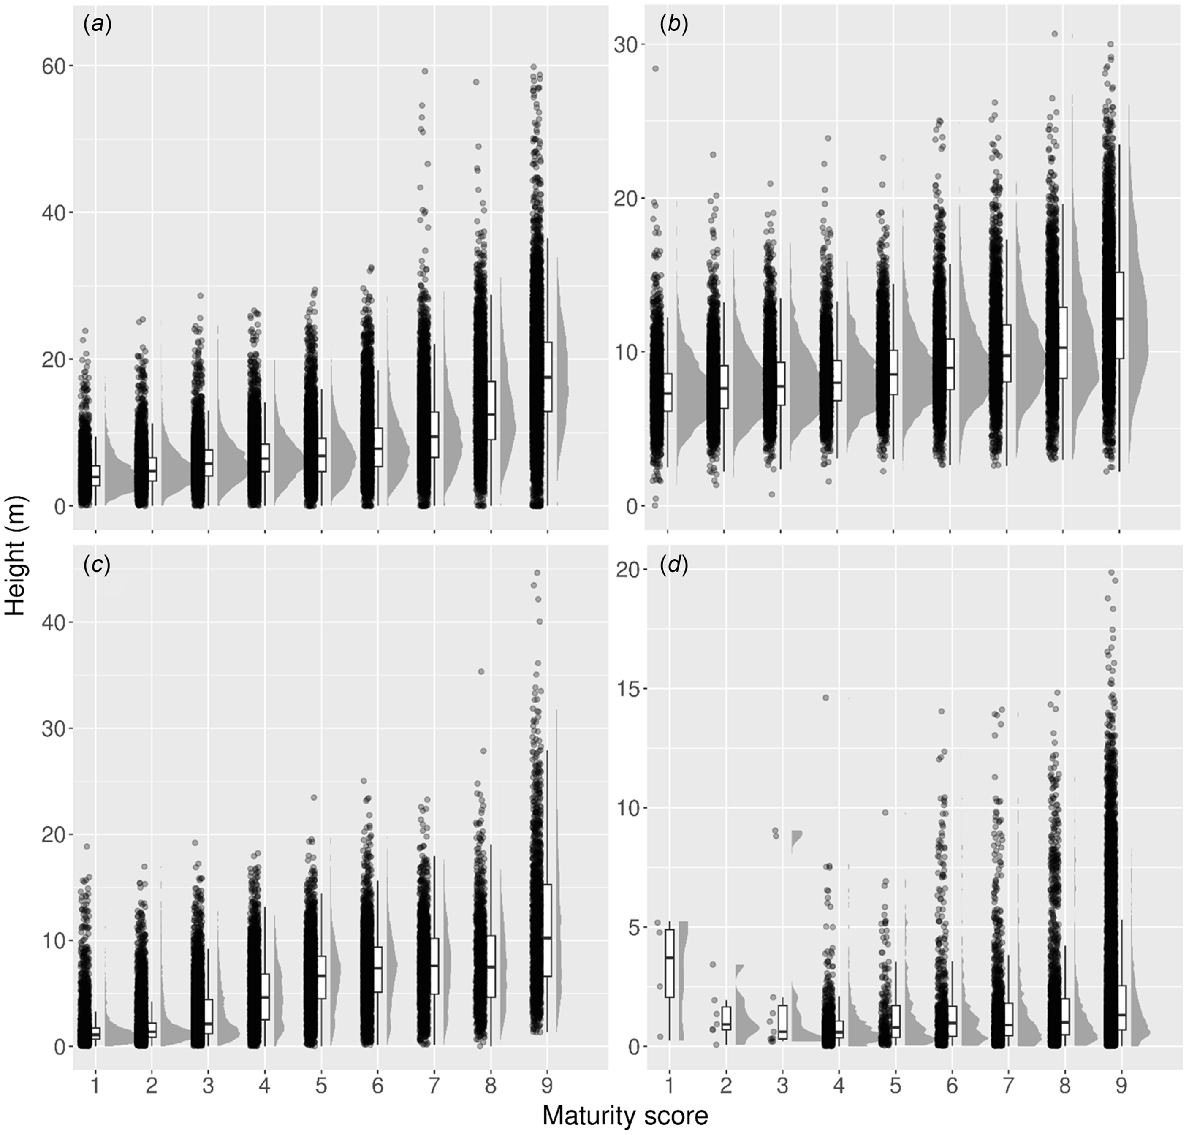
The comparison of the modelled forest maturity classes with ALS-derived tree height models found that there was a consistent positive relationship between forest height and the relative maturity class data. For all top 10 most sampled SUAs there was a significant difference (P < 0.05) among grouped maturity classes (see Supplementary materials Fig. S1–S10). For the multiple comparison test it was found that 78.0% (N = 59) had significant differences among each of the classes tested (Table 2). Almost all comparison tests (41 of 42, 98%) conducted on SUAs outside of the Brigalow Belt North bioregion were found to have significant differences between the maturity classes.
| Rank | Spatial unit of analysis (Forest community by bioregion combination) | N | Rank sum test | Maturity class comparisons | ||||||
|---|---|---|---|---|---|---|---|---|---|---|
| 1 × 4 | 2 × 5 | 3 × 6 | 4 × 7 | 5 × 8 | 6 × 9 | |||||
| 1 | Eucalypt Medium Open South Eastern Queensland | 69 085 | <0.0001 | 1 | 1 | 1 | 1 | 1 | 1 | |
| 2 | Eucalypt Medium Open Central Mackay Coast | 32 266 | <0.0001 | 1 | 1 | 1 | 1 | 1 | 1 | |
| 3 | Eucalypt Medium Woodland South Eastern Queensland | 31 439 | <0.0001 | 1 | 1 | 1 | 1 | 1 | 1 | |
| 4 | Eucalypt Medium Woodland Brigalow Belt North | 22 927 | <0.0001 | 0 | 0 | 0 | 1 | 0 | 1 | |
| 5 | Eucalypt Medium Woodland Brigalow Belt South | 22 588 | <0.0001 | 1 | 1 | 1 | 1 | 1 | 1 | |
| 6 | Eucalypt Medium Open Brigalow Belt North | 18 550 | <0.0001 | 0 | 0 | 0 | 0 | 1 | 1 | |
| 7 | Eucalypt Medium Open Brigalow Belt South | 16 742 | <0.0001 | 1 | 1 | 1 | 1 | 1 | 1 | |
| 8 | Eucalypt Tall Open South Eastern Queensland | 11 000 | <0.0001 | 0 | 1 | 1 | 1 | 1 | 1 | |
| 9 | Eucalypt Medium Woodland Central Mackay Coast | 10 327 | <0.0001 | 1 | 1 | 1 | 1 | 1 | 1 | |
| 10 | Acacia Low Woodland Brigalow Belt North | 5118 | <0.0001 | 0 | 1 | 0 | 0 | 0 | 0 | |
Two types of validation analysis were undertaken: the Kruskal–Wallis rank sum test and the multiple comparison test. Significant results (P < 0.05) for the overall test and individual comparisons are shown in bold. The rank sum test results compare all maturity classes, whereas the multiple comparisons are between classes that are three classes apart, where 1 represents a significant difference between classes and a 0 non-significant.
Mean heights varied amongst maturity classes and SUAs (Fig. 8). For the SUA with the greatest number of samples, Eucalypt Medium Open in South Eastern Queensland, mean height varied from 4.4 m (s.d. = 2.5 m) for Class 1, 7.3 m (s.d. = 3.7 m) for Class 5 and 17.8 m (s.d. = 7 m) for Class 9 at a 30 m resolution. The tallest height found from the analysis was Maturity Class 9 within Tall open forest in the South Eastern Queensland bioregion with a mean canopy height of 19.9 m (s.d. = 6.2 m).
Raincloud plots of the four most sampled communities tested in the validation analysis, including (a) Eucalypt Medium Open South Eastern Queensland (N = 69 085), (b) Eucalypt Medium Open Central Mackay Coast (N = 32 266), (c) Eucalypt Medium Woodland South Eastern Queensland (N = 34 439) and (d) Eucalypt Medium Woodland Brigalow Belt North (N = 22 927). Height (m) is shown on the y axis and the modelled forest maturity score shown on the x-axis. The length of whiskers correspond to 1.5 times the inter quartile range.
Discussion
We mapped and assessed the relative maturity of forest within the known and potential habitat of the greater glider in Queensland, Australia (Fig. 3). The analyses showed that around 35% (4.943 M ha) of the known and potential greater glider habitat in Queensland was found to be in the more mature classes (7–9) (Table 1). The mean patch size above 1.6 ha, the smallest known habitat area for the species, was found to be 122 ha (s.d. = 8056 ha), most patches (71.3%) were <10 ha, with 14 patches >100 000 ha (Fig. 5) (Pope et al. 2004). However, follow-up field wildlife survey is essential as these results only relate to the potential occurrence of greater glider populations and not whether a given mature patch is actually occupied.
The higher relatively mature classes 7–9 we consider here to be core habitat as they are most likely to have older trees and therefore tree hollows which are a critical and limiting habitat resource for the greater glider. Studies and have established the relationships between forest above-ground living biomass, canopy cover, tree height and age (Bi et al. 2004; Keith et al. 2009) including research in eastern Queensland finding the age at which tree hollows are prevalent vary from 165–324 years, equating with a DBH of >50 cm (Wormington et al. 2003). We validated canopy height, one of the three forest maturity metrics, using airborne laser scanning (ALS) which has sub-metre accuracy, and found consistent positive relationship in all the eucalypt dominated forests (Table 2). Nonetheless, further quantitative validation is warranted in relation to the other two metrics (biomass, cover) as well as additional systematic field survey in those areas highlighted as most likely to be core habitat with respect to forest maturity. It could be, for example, that some locations are classified as most mature, simply because they are the tallest, have the most above-ground biomass, and the densest canopy cover, in what is actually a highly degraded spatial unit of analysis where few old trees with hollows exist. If that is the case though, those areas would still hold conservation value as the ‘best of what’s left’ for that type. Also, additional research is warranted to further refine the potential habitat model, for example by incorporating the forest maturity data as a variable in a statistical species distribution model, which could also assist in identifying critical habitat areas across the species range.
Overall, freehold and leasehold lands have in total a larger area of more mature greater glider forest habitat (63.4% of Classes 7–9) compared to multiple-use public forest (~25%) and nature conservation areas (~10%) (Table 1, Fig. 6). There are also considerable areas (52.3%, 2 586 621 ha) of relatively more mature habitat on formally recognised Indigenous lands. These results highlight the significance of cross-tenure conservation management for ensuring viable populations across the species range and the need for a whole-of-landscape approach (Worboys et al. 2010; Reside et al. 2017).
The large extent of greater glider habitats located on the formally recognised Indigenous land and forest estate is noteworthy given the importance of the culture, values, knowledge, innovations and practices of Aboriginal and Torres Strait Islander people to the planning, management and conservation of biodiversity (Norman 2016; Bressan and Deshaies 2023). The integration of traditional ecological knowledge from First Nations people into decision-making processes is therefore important for the conservation of the greater glider, including for management of high-quality habitat on public lands, which encompasses multiple-use public forests, nature conservation areas and other crown lands. This collaborative approach to land management is an emerging priority for joint management and partnerships between First Australians’ communities and governmental agencies (Norman 2016; Queensland Government 2020a) and in addition facilitates the maintenance and restoration of cultural connectivity within and across landscapes (Bark et al. 2015).
It is important that government agencies and land managers comprehensively assess the impacts of extractive industries on the distribution and spatial configuration of those habitat resources that are critical for threatened species. Previous studies have shown how greater gliders and other mature forest dependent species are impacted by logging regimes (Incoll et al. 2001; Lindenmayer and Taylor 2022; Wardell-Johnson and Robinson 2022). Resource extraction activities pose a threat to the ecological integrity of the greater glider’s core habitat and, in turn, the viability of the species’ populations (Ashman et al. 2021; De Valck et al. 2021; Bressan and Deshaies 2023) through reducing stand age and the abundance of suitable tree hollows, increasing fragmentation which impedes meta-population dynamics, or by causing the full removal of forest cover (Eyre 2006; Eyre et al. 2010; Gould 2011, 2012; Werner et al. 2019).
The vulnerability of areas at risk is most evident by the extent of older maturity classes (7–9) located within Barakula State Forests – 184 356 ha, comprising 17% of all multiple-use public forests and 6.8% of habitat located on all public land – highlighting the need for cross-tenure conservation management for the greater glider. There is evidence that the South East Queensland Forests Agreement process led to a more intensive logging regime that removes commercially viable tree species >40 cm DBH in the majority of the remaining, state-owned forests (Eyre 2006). Such logging regimes are a threatening process for the greater glider given that trees >50 cm diameter at breast height (DBH) are preferentially selected for denning and sheltering (Eyre et al. 2022).
Important movement corridors were also modelled within and between the habitat patches and assessed in relation to tenure. In total, 88 important corridors connecting habitats were identified with 74% of important corridors located on freehold and leasehold land. The single most important corridor connecting two areas of mature habitat was found to be located between Blackdown Tableland National Park to Duaringa State Forest. Maintaining and restoring movement corridors between habitat patches is an essential conservation action for threatened species, particularly within fragmented landscapes (Downes et al. 1997; Worboys et al. 2010). Despite being capable of gliding over considerable distances, the species’ exclusive arboreal nature necessitates fixed distances between habitat trees, limiting habitat connectivity (Eyre et al. 2022). Retaining native tree cover together with ecological plantings within degraded landscapes helps maintain meta-population dynamics, population viability and adaptive capacity (Zilko et al. 2020). Successful interventions for movement corridors over barriers, such as glide poles for road crossings, have been applied for other species including squirrel gliders and yellow-bellied gliders (Goldingay and Taylor 2009; Taylor and Rohweder 2020) and are also needed to improve landscape permeability for greater gliders.
Previous studies have found that within the region, forests with the highest densities of the species are located within the wet native eucalypt forests of southern Queensland (Eyre 2006). Several important habitat corridors and large forest mature patches were found in this region and are at risk from the region’s rapid and ongoing urbanisation and associated infrastructure (Neldner et al. 2017). The important movement corridors identified here can be used to inform regional biodiversity network mapping and their formal protection would greatly benefit the conservation of the species (Queensland Government 2023b).
Conclusion
The protection of mature forest patches and movement corridors is necessary for the conservation of the greater glider, a nationally listed threatened species. Our results highlight areas that likely contain relatively mature forest and hollow bearing trees, which are a limiting habitat resource for the species, and which need urgent protection from threatening processes. We have also identified important potential movement corridors that warrant being protected or, if already degraded, having their tree cover restored. Targeted conservation interventions are needed on all land tenures where high-quality greater glider habitat occurs, noting that measures will vary depending on tenure and that First Nations peoples have a vital role to play in both their design and implementation.
Data availability
Programming scripts for all critical steps in the study can be accessed via the following GitHub repository (https://github.com/patrick-m-norman/Greater_glider_forest_maturity). All spatial layers and outputs are also available. Please contact the authors for data access.
References
Andrew D, Koffel D, Harvey G, Griffiths K, Fleming M (2014) Rediscovery of the greater glider Petauroides volans (marsupialia: Petauroidea) in the royal national park, NSW. Australian Zoologist 37, 23-28.
| Crossref | Google Scholar |
Ashman KR, Watchorn DJ, Lindenmayer DB, Taylor MFJ (2021) Is australia’s environmental legislation protecting threatened species? A case study of the national listing of the greater glider. Pacific Conservation Biology 28, 277-289.
| Crossref | Google Scholar |
Australian Government (2022) ‘Elvis - Elevation and depth - Foundation spatial data.’ (Geoscience Australia). Available at https://elevation.fsdf.org.au/
Bark RH, Barber M, Jackson S, Maclean K, Pollino C, Moggridge B (2015) Operationalising the ecosystem services approach in water planning: a case study of indigenous cultural values from the Murray–Darling Basin, Australia. International Journal of Biodiversity Science, Ecosystem Services & Management 11, 239-249.
| Crossref | Google Scholar |
Barrett T, Love J (2012) ‘Fine scale modelling of fauna habitat and connectivity values in the ACT region.’ (Citeseer). Available at https://www.environment.act.gov.au/__data/assets/pdf_file/0011/576794/Fine_scale_modelling_of_fauna_habitat_and_connectivity_values_in_ACT_Final_for_trish.pdf
Bi H, Turner J, Lambert MJ (2004) Additive biomass equations for native eucalypt forest trees of temperate australia. Trees 18, 467-479.
| Crossref | Google Scholar |
Bressan G, Deshaies M (2023) Coal seam gas extraction and related landscape changes in the agricultural production area of western downs (queensland, australia). Journal of Rural Studies 97, 495-506.
| Crossref | Google Scholar |
Butler H, Chambers B, Hartzell P, Glennie C (2021) PDAL: an open source library for the processing and analysis of point clouds. Computers & Geosciences 148, 104680.
| Crossref | Google Scholar |
Campbell-Jones MM, Bassett M, Bennett AF, Chia EK, Leonard S, Collins L (2022) Fire severity has lasting effects on the distribution of arboreal mammals in a resprouting forest. Austral Ecology 47, 1456-1469.
| Crossref | Google Scholar |
Coops NC, Tompalski P, Goodbody TRH, Queinnec M, Luther JE, Bolton DK, White JC, Wulder MA, van Lier OR, Hermosilla T (2021) Modelling lidar-derived estimates of forest attributes over space and time: a review of approaches and future trends. Remote Sensing of Environment 260, 112477.
| Crossref | Google Scholar |
Correa Ayram CA, Mendoza ME, Etter A, Salicrup DRP (2016) Habitat connectivity in biodiversity conservation: a review of recent studies and applications. Progress in Physical Geography 40, 7-37.
| Crossref | Google Scholar |
Cunningham RB, Pope ML, Lindenmayer DB (2004) Patch use by the greater glider (Petauroides volans) in a fragmented forest ecosystem. III. Night-time use of trees. Wildlife Research 31, 579-585.
| Crossref | Google Scholar |
De Valck J, Williams G, Kuik S (2021) Does coal mining benefit local communities in the long run? A sustainability perspective on regional Queensland, Australia. Resources Policy 71, 102009.
| Crossref | Google Scholar |
DellaSala DA, Mackey B, Norman P, Campbell C, Comer PJ, Kormos CF, Keith H, Rogers B (2022) Mature and old-growth forests contribute to large-scale conservation targets in the conterminous united states. Frontiers in Forests and Global Change 5, 979528.
| Crossref | Google Scholar |
Department of Climate Change, Energy, the Environment and Water (2022) Conservation Advice for Petauroides volans (greater glider (southern and central)). Department of Climate Change, Energy, the Environment and Water: Canberra. Available at http://www.environment.gov.au/biodiversity/threatened/species/pubs/254-conservation-advice-05072022.pdf
Downes SJ, Handasyde KA, Elgar MA (1997) The use of corridors by mammals in fragmented australian eucalypt forests: uso de corredores por mamíferos en bosques de eucalipto en australia. Conservation Biology 11, 718-726.
| Crossref | Google Scholar |
Eyre TJ (2005) Hollow-bearing trees in large glider habitat in south-east queensland, australia: Abundance, spatial distribution and management. Pacific Conservation Biology 11, 23-37.
| Crossref | Google Scholar |
Eyre TJ (2006) Regional habitat selection of large gliding possums at forest stand and landscape scales in southern Queensland, Australia: I. Greater glider (Petauroides volans). Forest Ecology and Management 235, 270-282.
| Crossref | Google Scholar |
Eyre TJ, Butler DW, Kelly AL, Wang J (2010) Effects of forest management on structural features important for biodiversity in mixed-age hardwood forests in australia’s subtropics. Forest Ecology and Management 259, 534-546.
| Crossref | Google Scholar |
GDAL/OGR Contributors (2022) Gdal/ogr geospatial data abstraction software library. Open Source Geospatial Foundation. Available at https://gdal.org. doi:10.5281/zenodo.5884351
Goldingay RL, Taylor BD (2009) Gliding performance and its relevance to gap crossing by the squirrel glider (Petaurus norfolcensis). Australian Journal of Zoology 57, 99-104.
| Crossref | Google Scholar |
Gorelick N, Hancher M, Dixon M, Ilyushchenko S, Thau D, Moore R (2017) Google earth engine: planetary-scale geospatial analysis for everyone. Remote Sensing of Environment 202, 18-27.
| Crossref | Google Scholar |
Gould SF (2011) Does post-mining rehabilitation restore habitat equivalent to that removed by mining? A case study from the monsoonal tropics of northern australia. Wildlife Research 38, 482-490.
| Crossref | Google Scholar |
Gould SF (2012) Comparison of post-mining rehabilitation with reference ecosystems in monsoonal eucalypt woodlands, northern australia. Restoration Ecology 20, 250-259.
| Crossref | Google Scholar |
Grizonnet M, Michel J, Poughon V, Inglada J, Savinaud M, Cresson R (2017) Orfeo toolbox: Open source processing of remote sensing images. Open Geospatial Data, Software and Standards 2, 15.
| Crossref | Google Scholar |
Hansen MC, Potapov PV, Moore R, Hancher M, Turubanova SA, Tyukavina A, Thau D, Stehman S, Goetz SJ, Loveland TR, Kommareddy A, Egorov A, Chini L, Justice CO, Townshend JRG (2013) High-resolution global maps of 21st-century forest cover change. Science 342, 850-853.
| Crossref | Google Scholar | PubMed |
Hanski I, Gilpin M (1991) Metapopulation dynamics: brief history and conceptual domain. Biological Journal of the Linnean Society 42, 3-16.
| Crossref | Google Scholar |
Hutchinson MF, McIntyre S, Hobbs RJ, Stein JL, Garnett S, Kinloch J (2005) Integrating a global agro-climatic classification with bioregional boundaries in Australia. Global Ecology and Biogeography 14, 197-212.
| Crossref | Google Scholar |
Incoll RD, Loyn RH, Ward SJ, Cunningham RB, Donnelly CF (2001) The occurrence of gliding possums in old-growth forest patches of mountain ash (Eucalyptus regnans) in the central highlands of victoria. Biological Conservation 98, 77-88.
| Crossref | Google Scholar |
Keith H, Mackey BG, Lindenmayer DB (2009) Re-evaluation of forest biomass carbon stocks and lessons from the world’s most carbon-dense forests. Proceedings of the National Academy of Sciences 106, 11635-11640.
| Crossref | Google Scholar |
Lindenmayer D, Taylor C (2022) Diversifying forest landscape management—a case study of a shift from native forest logging to plantations in australian wet forests. Land 11, 407.
| Crossref | Google Scholar |
Lindsay JB (2014) The whitebox geospatial analysis tools project and open-access GIS. In ‘Proceedings of the GIS Research UK 22nd Annual Conference’, Glasgow, UK. pp. 16–18. The University of Glasgow. Available at https://jblindsay.github.io/ghrg/pubs/LindsayGISRUK2014.pdf
McCarthy MA, Lindenmayer DB (1999) Conservation of the greater glider (Petauroides volans) in remnant native vegetation within exotic plantation forest. Animal Conservation 2(3), 203-209.
| Crossref | Google Scholar |
Menkhorst PW (1984) Use of nest boxes by forest vertebrates in gippsland: acceptance, preference and demand. Wildlife Research 11, 255-264.
| Crossref | Google Scholar |
Neteler M, Bowman MH, Landa M, Metz M (2012) Grass GIS: A multi-purpose open source gis. Environmental Modelling & Software 31, 124-130.
| Crossref | Google Scholar |
Norman H (2016) Coal mining and coal seam gas on gomeroi country: sacred lands, economic futures and shifting alliances. Energy Policy 99, 242-251.
| Crossref | Google Scholar |
Pope ML, Lindenmayer DB, Cunningham RB (2004) Patch use by the greater glider (Petauroides volans) in a fragmented forest ecosystem. I. Home range size and movements. Wildlife Research 31, 559-568.
| Crossref | Google Scholar |
Potapov P, Li X, Hernandez-Serna A, Tyukavina A, Hansen MC, Kommareddy A, Pickens A, Turubanova S, Tang H, Silva CE, Armston J, Dubayah R, Bryan Blair J, Hofton M (2020) Mapping global forest canopy height through integration of GEDI and landsat data. Remote Sensing of Environment 253, 112165.
| Crossref | Google Scholar |
Queensland Government (2020b) 2019–20 slats report. (Queensland Government) Available at https://www.qld.gov.au/environment/land/management/mapping/statewide-monitoring/slats/slats-reports/2019-20-slats-report/about-this-report
R Core Team (2022) R: A language and environment for statistical computing. R Foundation for Statistical Computing, Vienna, Austria. Available at https://www.R-project.org/
Reside AE, Beher J, Cosgrove AJ, Evans MC, Seabrook L, Silcock JL, Wenger AS, Maron M (2017) Ecological consequences of land clearing and policy reform in queensland. Pacific Conservation Biology 23, 219-230.
| Crossref | Google Scholar |
Santoro M, Cartus O, Mermoz S, Bouvet A, Le Toan T, Carvalhais N, Rozendaal D, Herold M, Avitabile V, Quegan S, Carreiras J, Rauste Y, Balzter H, Schmullius C, Seifert FM (2018) GlobBiomass global above-ground biomass and growing stock volume datasets. Available at http://globbiomass.org/products/global-mapping
Sawyer SC, Epps CW, Brashares JS (2011) Placing linkages among fragmented habitats: do least-cost models reflect how animals use landscapes? Journal of Applied Ecology 48, 668-678.
| Crossref | Google Scholar |
Taylor BD, Rohweder DA (2020) Yellow-bellied gliders use glide poles to cross the Pacific Highway at Halfway Creek, north-east New South Wales. Australian Mammalogy 42, 385-387.
| Crossref | Google Scholar |
Vogt P, Riitters K (2017) Guidostoolbox: Universal digital image object analysis. European Journal of Remote Sensing 50, 352-361.
| Crossref | Google Scholar |
Wang YH, Yang KC, Bridgman CL, Lin LK (2008) Habitat suitability modelling to correlate gene flow with landscape connectivity. Landscape Ecology 23, 989-1000.
| Crossref | Google Scholar |
Wardell-Johnson GW, Robinson TP (2022) Considerations in the protection of marsupial gliders and other mature-forest dependent fauna in areas of intensive logging in the tall forests of Victoria, Australia. Pacific Conservation Biology
| Crossref | Google Scholar |
Werner TT, Bebbington A, Gregory G (2019) Assessing impacts of mining: recent contributions from gis and remote sensing. The Extractive Industries and Society 6, 993-1012.
| Crossref | Google Scholar |
Wormington KR, Lamb D, McCallum HI, Moloney DJ (2003) The characteristics of six species of living hollow-bearing trees and their importance for arboreal marsupials in the dry sclerophyll forests of southeast queensland, australia. Forest Ecology and Management 182, 75-92.
| Crossref | Google Scholar |
Zilko JP, Harley D, Hansen B, Pavlova A, Sunnucks P (2020) Accounting for cryptic population substructure enhances detection of inbreeding depression with genomic inbreeding coefficients: an example from a critically endangered marsupial. Molecular Ecology 29, 2978-2993.
| Crossref | Google Scholar |
Zilko JP, Harley D, Pavlova A, Sunnucks P (2021) Applying population viability analysis to inform genetic rescue that preserves locally unique genetic variation in a critically endangered mammal. Diversity 13, 382.
| Crossref | Google Scholar |